
Abstract
Incorporating structural measures into pavement management systems can enhance the underlying performance models. The traffic speed deflectometer (TSD) offers advantages for network-level testing, but it differs from the traditional falling weight deflectometer (FWD) as a structural measure. It is important to investigate which measure provides the most improvement in pavement performance models. This study compares the impact of four structural measures on pavement performance models of four distress rating dependent variables (cracking, rutting, load distress rating, and critical condition index). Structural measures from the Virginia Department of Transportation pavement management data were analyzed, including ground penetrating radar measure of asphalt thickness, FWD measure of structural number, TSD measure of surface curvature index (SCI), and the site’s pre-treatment rate of deterioration. A multilevel model approach related each structural measure to site-specific performance models of asphalt resurfacing treatments. The TSD measure of SCI demonstrated the greatest impact on the cracking, load distress rating, and critical condition index models with increases in marginal R2 of 0.05, 0.03, and 0.01, respectively. Pavements with higher SCI values reach a failing critical condition index threshold one year sooner. Incorporation of the TSD measure of SCI leads to improved performance models and will benefit pavement management systems.
Keywords
A fundamental component of an effective pavement management system is an accurate pavement performance model. The performance model accuracy can be improved by incorporating pavement structural information. The traffic speed deflectometer (TSD) has been compared with the seminal falling weight deflectometer (FWD) as a pavement structural measure better suited for use in pavement management. When considering structural measures for pavement management, it is relevant to compare them based on their ability to inform pavement performance models. This is a useful basis for comparison because it focuses on the structural measure’s benefit to pavement management through improved performance models.
This study compares the impact of different structural measures on pavement performance models. The impact is evaluated using a multilevel modeling approach that relates structural measures to site-specific performance models. The evaluation considers the improved accuracy of the performance models and the practical effect of the structural measure on the performance models. This study seeks to identify which of four structural measures best supports pavement management.
Literature Review
The pavement performance model, also referred to as a pavement deterioration curve, is an equation representing the change in pavement condition over time ( 1 ). Commonly, the independent variable is the age of the pavement. Other contributing factors (i.e., traffic volume, climate, etc.) can be used to split the pavement network into separate family groups for modeling or incorporated as covariates into the model.
The FWD measurement of structural number (SN) has a long history of use for project-level pavement structure evaluation. However, the static FWD test is time-consuming to collect at a network-level, which has limited its use in agency pavement performance models. A study from the Kansas Department of Transportation incorporated FWD measures into sigmoidal family models for remaining service life ( 2 ). The predicted remaining service life decreased as measured deflection increased with varying amounts, rates, and inflection points depending on the pavement family. Another study of network-level FWD data uses the modified structural index (MSI), a ratio of effective SN and required SN from pavement design, to improve the pavement performance model ( 3 ). The study used a negative binomial model with an exponential form and further reduced prediction error by combining site-specific condition ratings with the network performance model.
TSD devices have been in development as a tool for pavement structural testing in recent decades ( 4 ). The TSD uses a tractor trailer with a known rear-axle load and multiple Doppler lasers that measure the deflection velocity underneath the loaded axle while traveling at highway speed (up to 60 mph). The deflection velocities are used to calculate deflections at different offsets from the axle, similar to the FWD. The TSD provides continuous data collection and is capable of reporting deflection measurements at intervals as low as 3.3 ft, though longer intervals are often preferred for averaging to improve consistency. The TSD has shown to be a suitable tool for agencies, though further work is needed to data collection protocols, calibration standards, and guidance for implementing in pavement management ( 4 ).
A synthesis of the state of TSD research shows while the measurements differ from that of the FWD, the two devices show similar trends and the ability to identify relatively weak and strong pavements ( 4 ). Previous research has further correlated the TSD to FWD by developing equations using TSD data to estimate SN as measured by FWD ( 5 , 6 ). However, the structural measure of surface curvature index (SCI) at 12 in. is more simply determined from TSD data without correlation to FWD structural measures. The SCI has been shown to relate to the pavement strain and suggested for inclusion in pavement management ( 7 , 8 ).
The relationship between SCI and pavement performance was plotted by Katicha et al. ( 8 ) showing a visual difference in average pavement surface condition indices (for load related, non-load related, and overall condition) over time for upper and lower quartiles of SCI. The study developed route-specific quasi-Poisson performance models with exponential form incorporating the SCI; most models showed the SCI was a significant factor relating to the rate of deterioration, albeit with a range of coefficients ( 8 ). A study of TSD data collected on Tennessee interstate routes showed a significant relationship between SCI and the one year deterioration rate and recommended using SCI in performance curves covering longer periods ( 9 ). Both studies found the SCI to better relate to the surface deterioration rate than the SN estimated from the same TSD data ( 8 , 9 ).
The incorporation of TSD into pavement performance models is shown in a recent study of two National Park System routes ( 10 ). The study found the TSD structural measures of MSI and SCI both improved performance models, with the overall condition index model coefficient of determination increasing by 0.015 with MSI and a similar 0.011 increase from SCI. This study notes that the two routes in the study had similar pavement structures and recommends further research on the relationship between TSD structural measures and performance models using a more diverse network ( 10 ).
The ability to test at highway speed allows the TSD to collect data over hundreds of miles per day, making it especially promising tool for network-level pavement structural testing. The previous research demonstrates that while the TSD differs from the FWD measurements of pavement structure, the two measures trend together. Network-level structural data can improve pavement performance models. The relationship between surface condition and different metrics (primarily SCI and SN) from TSD data have been compared, however the relationship between structure and performance has not been compared between the FWD and TSD testing methods. Separately, these testing methods have been shown to be significant in family pavement performance models, although the varying coefficients make it challenging to estimate the general effect of the structural measure on the pavement performance model coefficients. This investigation of pavement structural measures relationship to pavement performance models seeks to address these research gaps. This study includes different structural testing methods for comparison. Additionally, a multilevel model approach is employed to estimate the change in site-specific performance model coefficients related to the structural measures.
Methods
Data Sources
Virgina Department of Transportation’s (VDOT’s) pavement management data, including pavement segment information, pavement ratings, and structural measures, are used for this study. Pavement segments with the same structure (having the same layers, layer thicknesses, and resurfacing years) are identified in the pavement management data. The distresses and structural measures are averaged for each segment and year. Only asphalt pavement structures are included in this study. The asphalt mixtures for pavement surfaces include both dense-graded and stone matrix asphalt mixtures, predominantly with a nominal maximum aggregate size of 9.5 or 12.5 mm. Concrete and composite pavements are excluded since these pavement types would be expected to have different distress measures and performance models than asphalt pavements. Most of VDOT’s pavement network consists of asphalt pavements; a limited number of concrete and composite sites are unlikely to provide meaningful insights. Slurry seal, microsurfacing, and chip seal resurfacing treatments are also excluded. The age of each treatment, the number of years since the previous resurfacing treatment, is recorded for each pavement rating year. Treatments since 2005 are included in the study.
The performance model dependent variables come from VDOT automated pavement distress rating survey data from 2007–2023. The automated pavement rating surveys are conducted yearly in the right travel lane, or prime direction for two-lane routes, for the interstate and primary system. VDOT pavement ratings are aggregated into three pavement distress indices: load-related distress rating (LDR), non-load-related distress rating (NDR), and critical condition index (CCI), recorded on a 0–100 scale, with 100 being the best score and below 60 considered deficient ( 11 , 12 ). The LDR is calculated using deducts for measured distresses caused by vehicle loading, such as fatigue cracking, rutting, or patching. The NDR is based on deduct for measured distress caused by other factors, such as longitudinal cracking, longitudinal joint distress, bleeding, and so forth. The CCI is calculated as the lower of the LDR and NDR measures for a segment. This study uses LDR and CCI as dependent variable measures, as these are expected to relate more to the pavement structure than NDR. The rutting depth and percent cracking distress measures from the annual ratings are also used as dependent variables. These measures are part of federal data collection metrics requirements from VDOT’s Transportation Asset Management Plan related to asphalt pavement structure ( 13 ). Rutting is the average rut depth (in.) using the straightedge method. Cracking is the percent of fatigue cracked area, defined as severity 2 or 3 alligator cracking, in the tested lane. These distress measures also correspond to the measures used for VDOT’s Mechanistic-Empirical Pavement Design Guide local calibration ( 14 ).
The main structural measures for this study are from FWD and TSD deflection testing. VDOT completed a multi-year effort of network-level FWD testing on interstate routes in 2008, and the measured effective SN is now included in pavement management decision trees ( 15 ). This effective SN is used as the FWD structural measure for this study and follows VDOT’s typical practice for structural testing. VDOT obtained most of its TSD data in September 2017 and has continued with TSD testing on portions of the network in the subsequent years ( 8 ). The data collected on VDOT interstate and primary routes through 2023 are used in this study. The SCI measured at 12 in. is used as the structural measure for TSD based on previous research indicating it is the preferred metric from TSD to evaluate asphalt pavement structures ( 7 , 8 ). The SCI data used in this study are not temperature adjusted. About one-third of VDOT’s available TSD data do not include the asphalt thickness which is used to estimate the mid-depth asphalt temperature for adjustment ( 5 ). Using the same pavement treatment sites tested by both FWD and TSD provides a basis for comparing the SN and SCI structural measures by their relation to pavement performance.
Additionally, the asphalt thickness and previous rate of deterioration are also included as structural measures. The asphalt thickness is measured from network-level ground penetrating radar (GPR) testing of VDOT interstate routes in conjunction with the 2012 annual distress rating survey. The GPR testing followed the American Society for Testing and Materials (ASTM) D4748 to measure the total thickness of bound asphalt ( 16 ). The fourth structural measure considered is the pre-treatment rate of deterioration. This measure, referred to as Prev Slope here, is the slope coefficient from each site-specific pre-treatment performance model. Prev Slope is used as a structural measure in the model of the post-treatment performance for a given distress. Thus, the Prev Slope values are different for each model. In the cracking models, the Prev Slope is the previous cracking rate of deterioration before resurfacing; for CCI models, the Prev Slope is from the CCI. While Prev Slope is not a direct measure of the pavement structure, it is assumed that faster deterioration indicates poor structure.
These four structural measures, SN from FWD, SCI from TSD, thickness from GPR, and Prev Slope, represent both different testing methods and different metrics to quantify the structure. Previous research has shown ways to translate some structural testing results to metrics from other testing methods, especially for the deflection test methods ( 4 – 6 , 10 ). This study uses these primary metrics to focus on comparing the distinct testing methods. Incorporating more detail into a structural measure (such as combining SCI and pavement thickness for SN calculation) could further improve the models but also require additional data collection effort.
These four distinct structural testing methods are compared by assessing their individual relationship with each of the four distresses. This shows which structural measure best relates to the distress performance models. The deflection test methods, FWD and TSD, are likely to better characterize the structure by measuring a response to loading. The GPR and Prev Slope test methods could be easier to incorporate with typical distress survey procedures and may still relate to performance models. This study does not incorporate the costs of the different testing methods, as this will vary between agencies, method of data collection (either acquiring new equipment or contracting with a provider), and potential future cost changes owing to economies of scale. Agencies may also have additional uses for these network-level structural measures beyond improving network performance models. While a benefit-cost analysis is beyond of the scope of this study, previous research suggests that reduced accuracy of performance models could reduce the benefits of an agency’s resurfacing program by 15%–60% ( 17 ).
Although it would be preferable for all the structural measures to be collected at the same time for each treatment, it is expected that the structural measures remain constant over time. A study of VDOT network-level structural testing showed that the follow-up FWD testing after five years correlated well with the initial data and identified the same weak segments ( 18 ). The TSD data have also shown similarities in identifying weak and strong sections to the FWD data collected 10 years previously ( 8 ). Most treatments are thin (≤2”) single-lift asphalt resurfacing that are not expected to improve the pavement structure. Therefore, it is a reasonable expectation that the structural measures show a significant impact on performance even if the date of structural testing differs from the years of service for a specific resurfacing.
The data are grouped by the pavement segments and year of treatment. A segment with two treatments shown in the data is separated for each treatment occasion. These unique pavement segments and treatments are referred to as sites. For example, a segment that has a treatment history of asphalt overlays in 2008 and again in 2018 would be included as two distinct sites beginning in 2008 and 2018. A sample of the data is shown in Table 1 demonstrating the segments, sites, distress measures, and structural measures. The Prev Slope is only shown for CCI owing to space but is calculated for all four distress measures. The distribution of the site GPR, FWD, and TSD structural measures is shown in Figure 1, separated for interstate and primary sites. The figure also includes the minimum CCI the site reaches after treatment, indicating the range of distress observed at the sites. Each subplot shows the scaled frequency, the highest density scaled to a value of one (as opposed to area under the curve being equal to one). The figure shows more spread distribution among the primary sites than the interstate sites for CCI and TSD.
Sample Data from I-64 Westbound Segment from 55 to 53.8
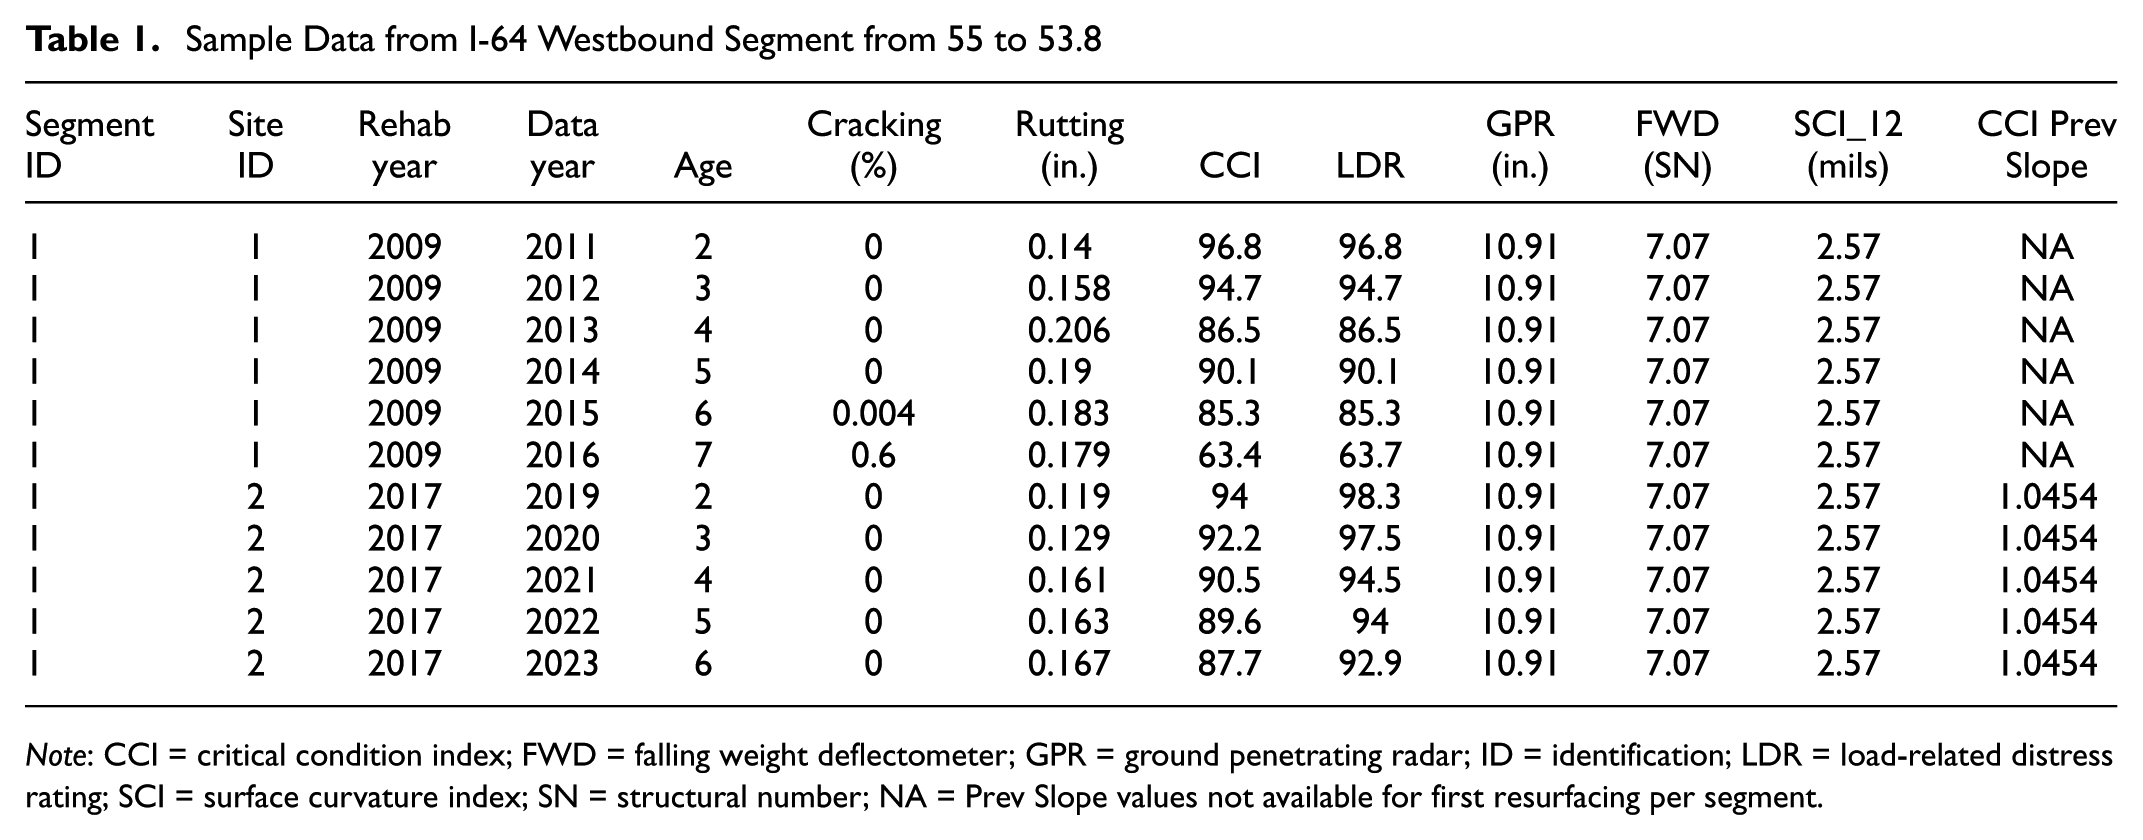
Note: CCI = critical condition index; FWD = falling weight deflectometer; GPR = ground penetrating radar; ID = identification; LDR = load-related distress rating; SCI = surface curvature index; SN = structural number; NA = Prev Slope values not available for first resurfacing per segment.
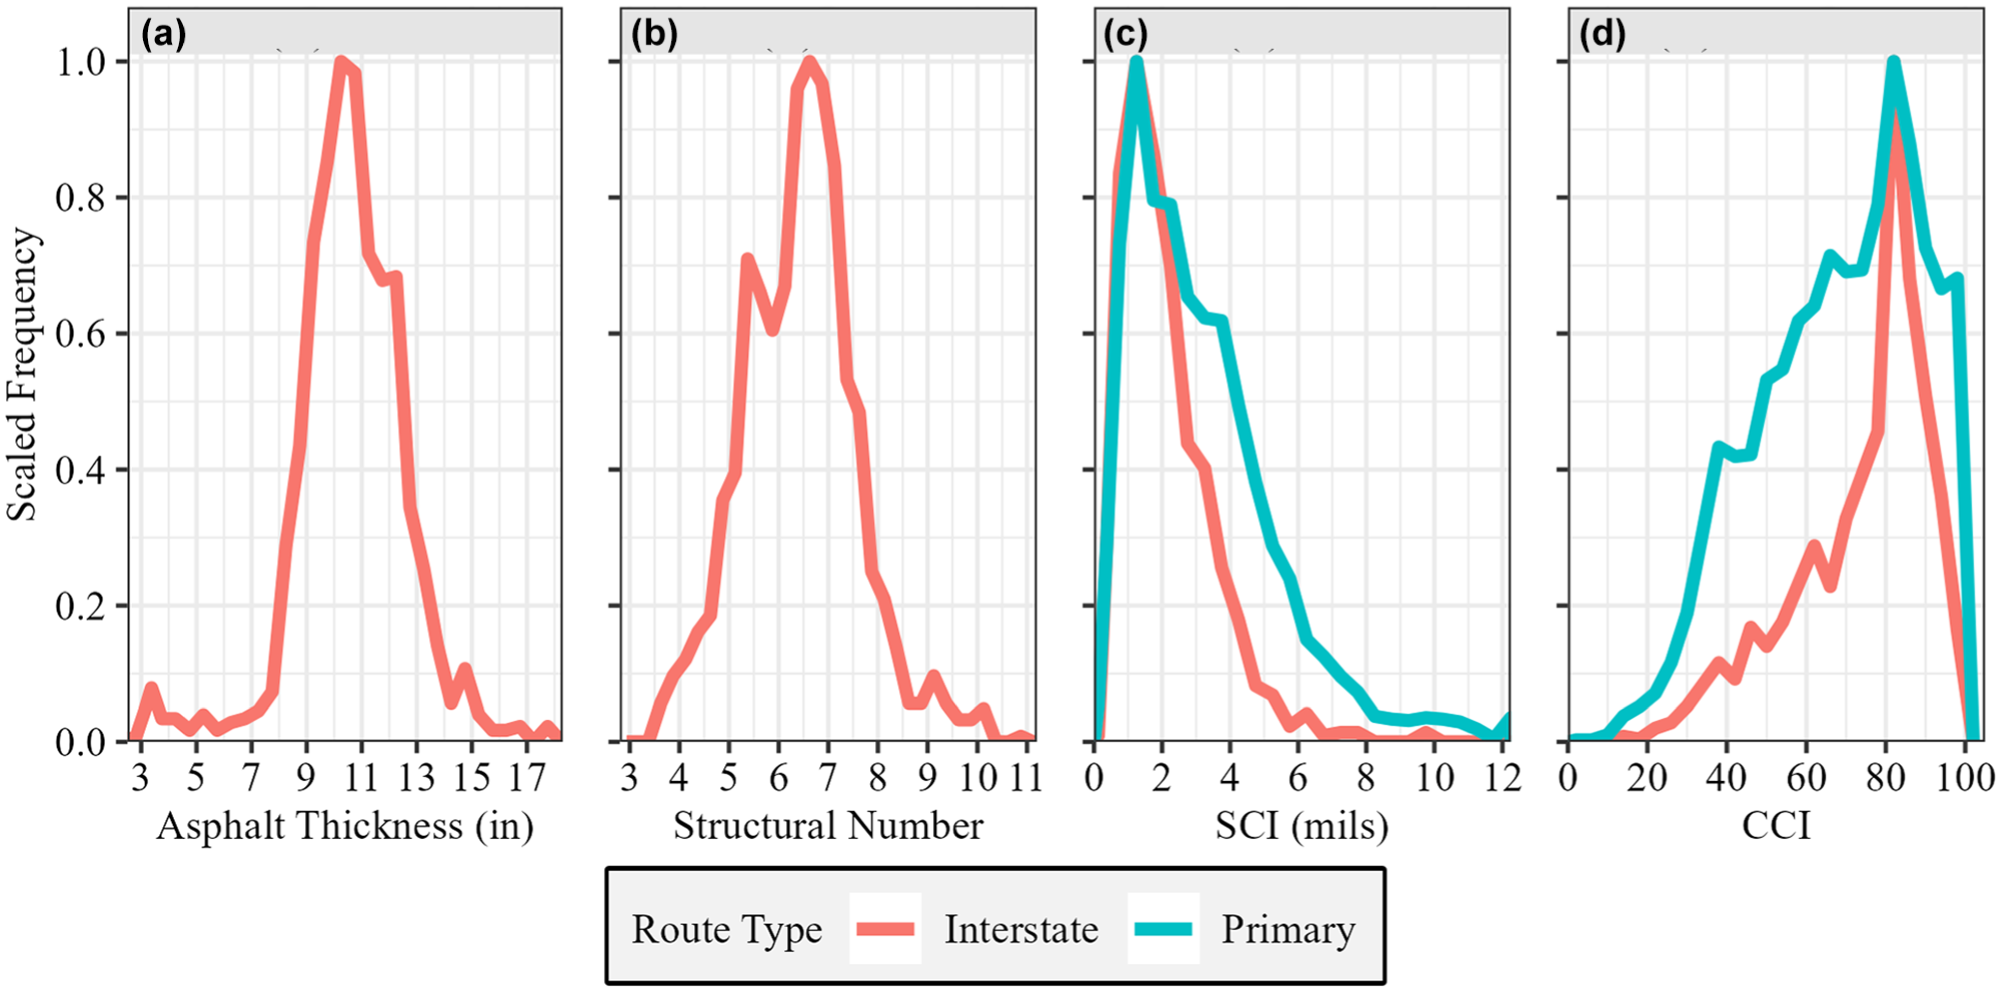
Distribution of ground penetrating radar (GPR), falling weight deflectometer (FWD), and traffic speed deflectometer (TSD) structural measures and site minimum critical condition index (CCI). GPR asphalt thickness in (a), FWD structural number in (b), TSD surface curvature index (SCI) in (c), site minimum CCI in (d). scaled frequency.
The dataset includes negative and positive age values for distress ratings. Negative age values represent the distress measured in the years before treatment (i.e., age = −1 being the distress in the year before treatment). In contrast, positive age values represent the distress measured after treatment. The models are separate for negative or positive age data to exclude the performance jump from the treatment. The annual distress survey data are collected in the last few months of the prior year, whereas the year of resurfacing can represent paving that finished at the end of that calendar year. Thus, an age of zero would show pre-treatment distress, and, in some cases, the data at age one still show pre-treatment distress. Therefore, data filtering removed observations for ages 0 and 1 because those measurements were ambiguous as to whether pre-treatment or post-treatment. Sites with less than three years of data were also removed to keep a minimum number of points for the site-specific model.
Multilevel Modeling
A multilevel regression model approach is used to evaluate the impact of structural measures on pavement performance. Multilevel models, also referred to as hierarchical, random-effects, or mixed-effects models, address the unobserved heterogeneity when having repeated measures of the same site ( 19 ). The multilevel model develops coefficients for each site, the random coefficients, as well as fixed effects coefficients that show the general form across all the data. The multilevel approach is preferred as traditional least squares regression would result in bias toward more significant results by ignoring the non-independent observations at each site ( 20 ). The multilevel model also can handle cases of panel dropout causing unequal numbers of observations from each site ( 20 ). This helps mitigate selection bias in the observational pavement performance data, where poor-performing sites are treated and no longer included in the data ( 3 , 10 ).
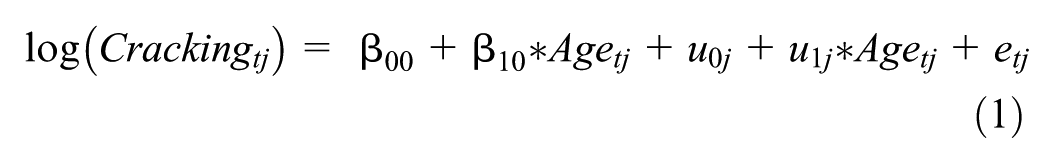
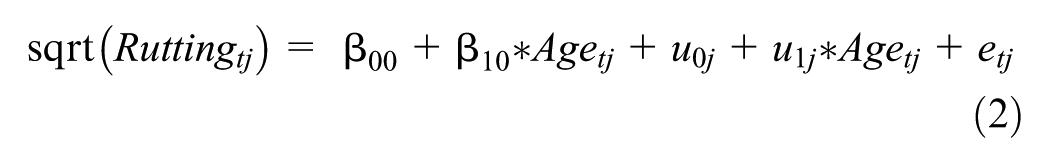
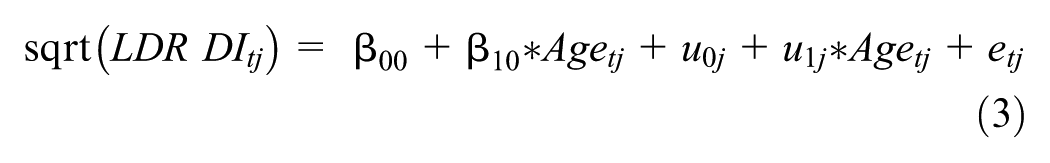
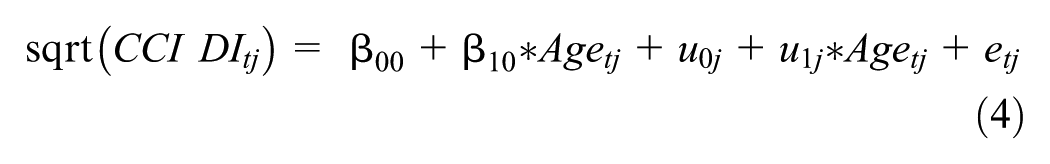
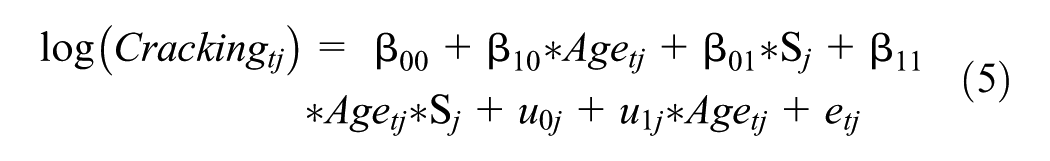
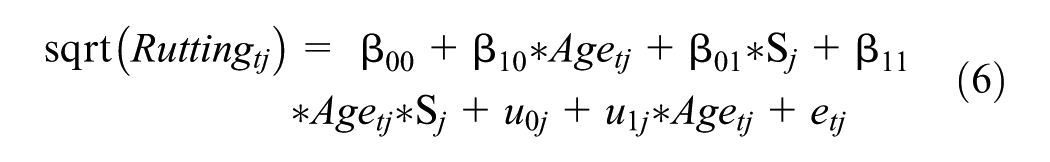
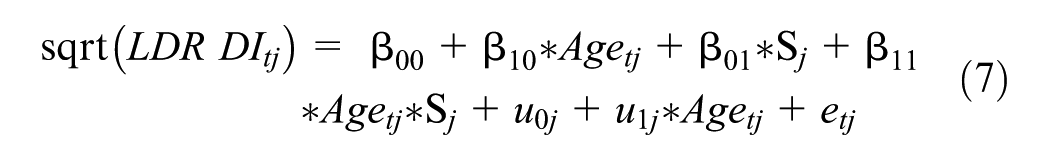
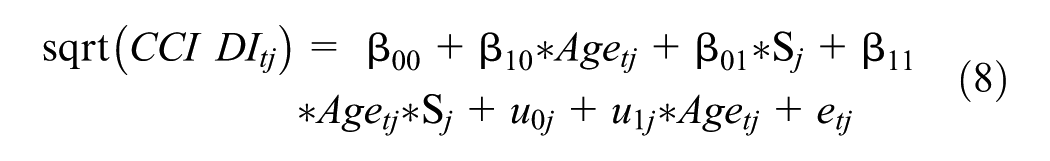
The multilevel model form for the study is shown below. The models are fitted and analyzed using the lme4 (linear mixed-effects models) package for R following the maximum likelihood criteria ( 21 , 22 ). The null models (Equations 1–4) have age as the only independent variable for the distress rating dependent variable. The multilevel models have both random intercept and slope coefficients to allow for different site-specific performance models. These null models are compared with the models including site-level structural measures as independent variables (Equations 5–8). The structural measures are considered time-invariant variables that are constant for each site. The structural measure is applied to both the intercept and slope coefficients. Thus, the multilevel model uses the structural measures to predict the site-specific intercept and slope coefficients.
Null Models
Models with Structural Measures
where
Cracking = percent of fatigue cracking
Rutting = rutting depth (in.)
LDR DI = 100 − LDR (scale starts at 0 for no damage)
CCI DI = 100 − CCI (scaled starts at 0 for no damage)
The LDR and CCI dependent variables are modeled as the reciprocal value, referred to as the deterioration index (DI). The DI values increase from zero to one hundred as more damage is measured (i.e., a CCI of 85 equals a CCI DI of 15). This helps in modeling to provide a consistent upward curve as distress increases with age for all four distress measures. The dependent variables are transformed and modeled with the pavement age. The structural models (Equations 5–8) incorporate the centered structural measure with both the slope and intercept terms. Additional independent variables (e.g., ADTT) could further improve the models; however, multicollinearity with the structural measure could mask the individual impact of each variable. Therefore, this study includes only the structural measure to focus on its specific impact on the performance models.
The transformed dependent variables are used in linear regression models, producing a monotonic, nonlinear relationship between age and distress. This is similar to the common pavement performance model shape in previous research ( 1 – 3 , 8 , 10 ). Since the multilevel model approach considers site-specific performance, some aspects of the previous research, such as showing rate of deterioration for older pavements in sigmoid function or quasi-Poisson and negative binomial models for overdispersion of count data, are not applicable. The cracking model uses a log transform of the cracking dependent variable to create an exponential growth curve to match the expectation that cracking will accelerate quickly. A square root transform was found to better adjust the rutting, LDR DI, and CCI DI dependent variables, as the individual site distress curves showed flatter curves than an exponential model. Because some individual sites sometimes have limited data before resurfacing, more complex models with more independent variables could add noise to the site-specific performance models. The transformed dependent variable linear models provide for better comparison among structural measures.
The structural measure impact is evaluated by the model improvement from the corresponding null model. The parameters used to evaluate model improvement are the likelihood ratio test, random coefficient variance, coefficient of determination, and the model coefficients:
The likelihood ratio test evaluates statistical significance model improvement with the structural measure from the nested null models. A significant p-value shows a statistically significant improvement when incorporating the structural measure.
The variance of the random effects (
The coefficient of determination (R2), the proportion of variation from the dependent variable that is explained by the model. For a multilevel model, Nakagawa ( 23 ) defines two different values, the conditional R 2 and marginal R2. The conditional R2 includes random effects to represent how well the performance model fits for each site. Because the structural measures are site-level factors, no change is expected from the conditional R2. The marginal R2 only includes how well the fixed effects account for the total variance. The increase in the marginal R2 from the null model shows the additional model improvement owing to the structural measure.
The fixed effects regression coefficients from the structural models are visualized using interaction plots to show the practical effect of the structural measure on the fixed effect (or the marginal, network-level) pavement performance model. This shows the expected performance curve for the mean structural measure and ±1 standard deviation to visually assess the impact of each structural measure.
Results
Owing to differences in locations where the GPR, FWD, and TSD structural testing were each performed, data for all three structural measures is not available for every segment. The initial evaluation focuses on sites tested by all three methods. This ensures a direct comparison between the structural measures, as the same performance data is being used for all models. However, this limits the dataset to only interstate routes because the network-level FWD and GPR are not available on any primary routes. The results of the models are summarized in Table 2, and selected FWD and TSD models are shown in Figure 2. These models use the distress data after treatment (positive age values).
Post-Treatment Model Outputs of Sites Containing Falling Weight Deflectometer (FWD), Ground Penetrating Radar (GPR), and Traffic Speed Deflectometer (TSD) Data
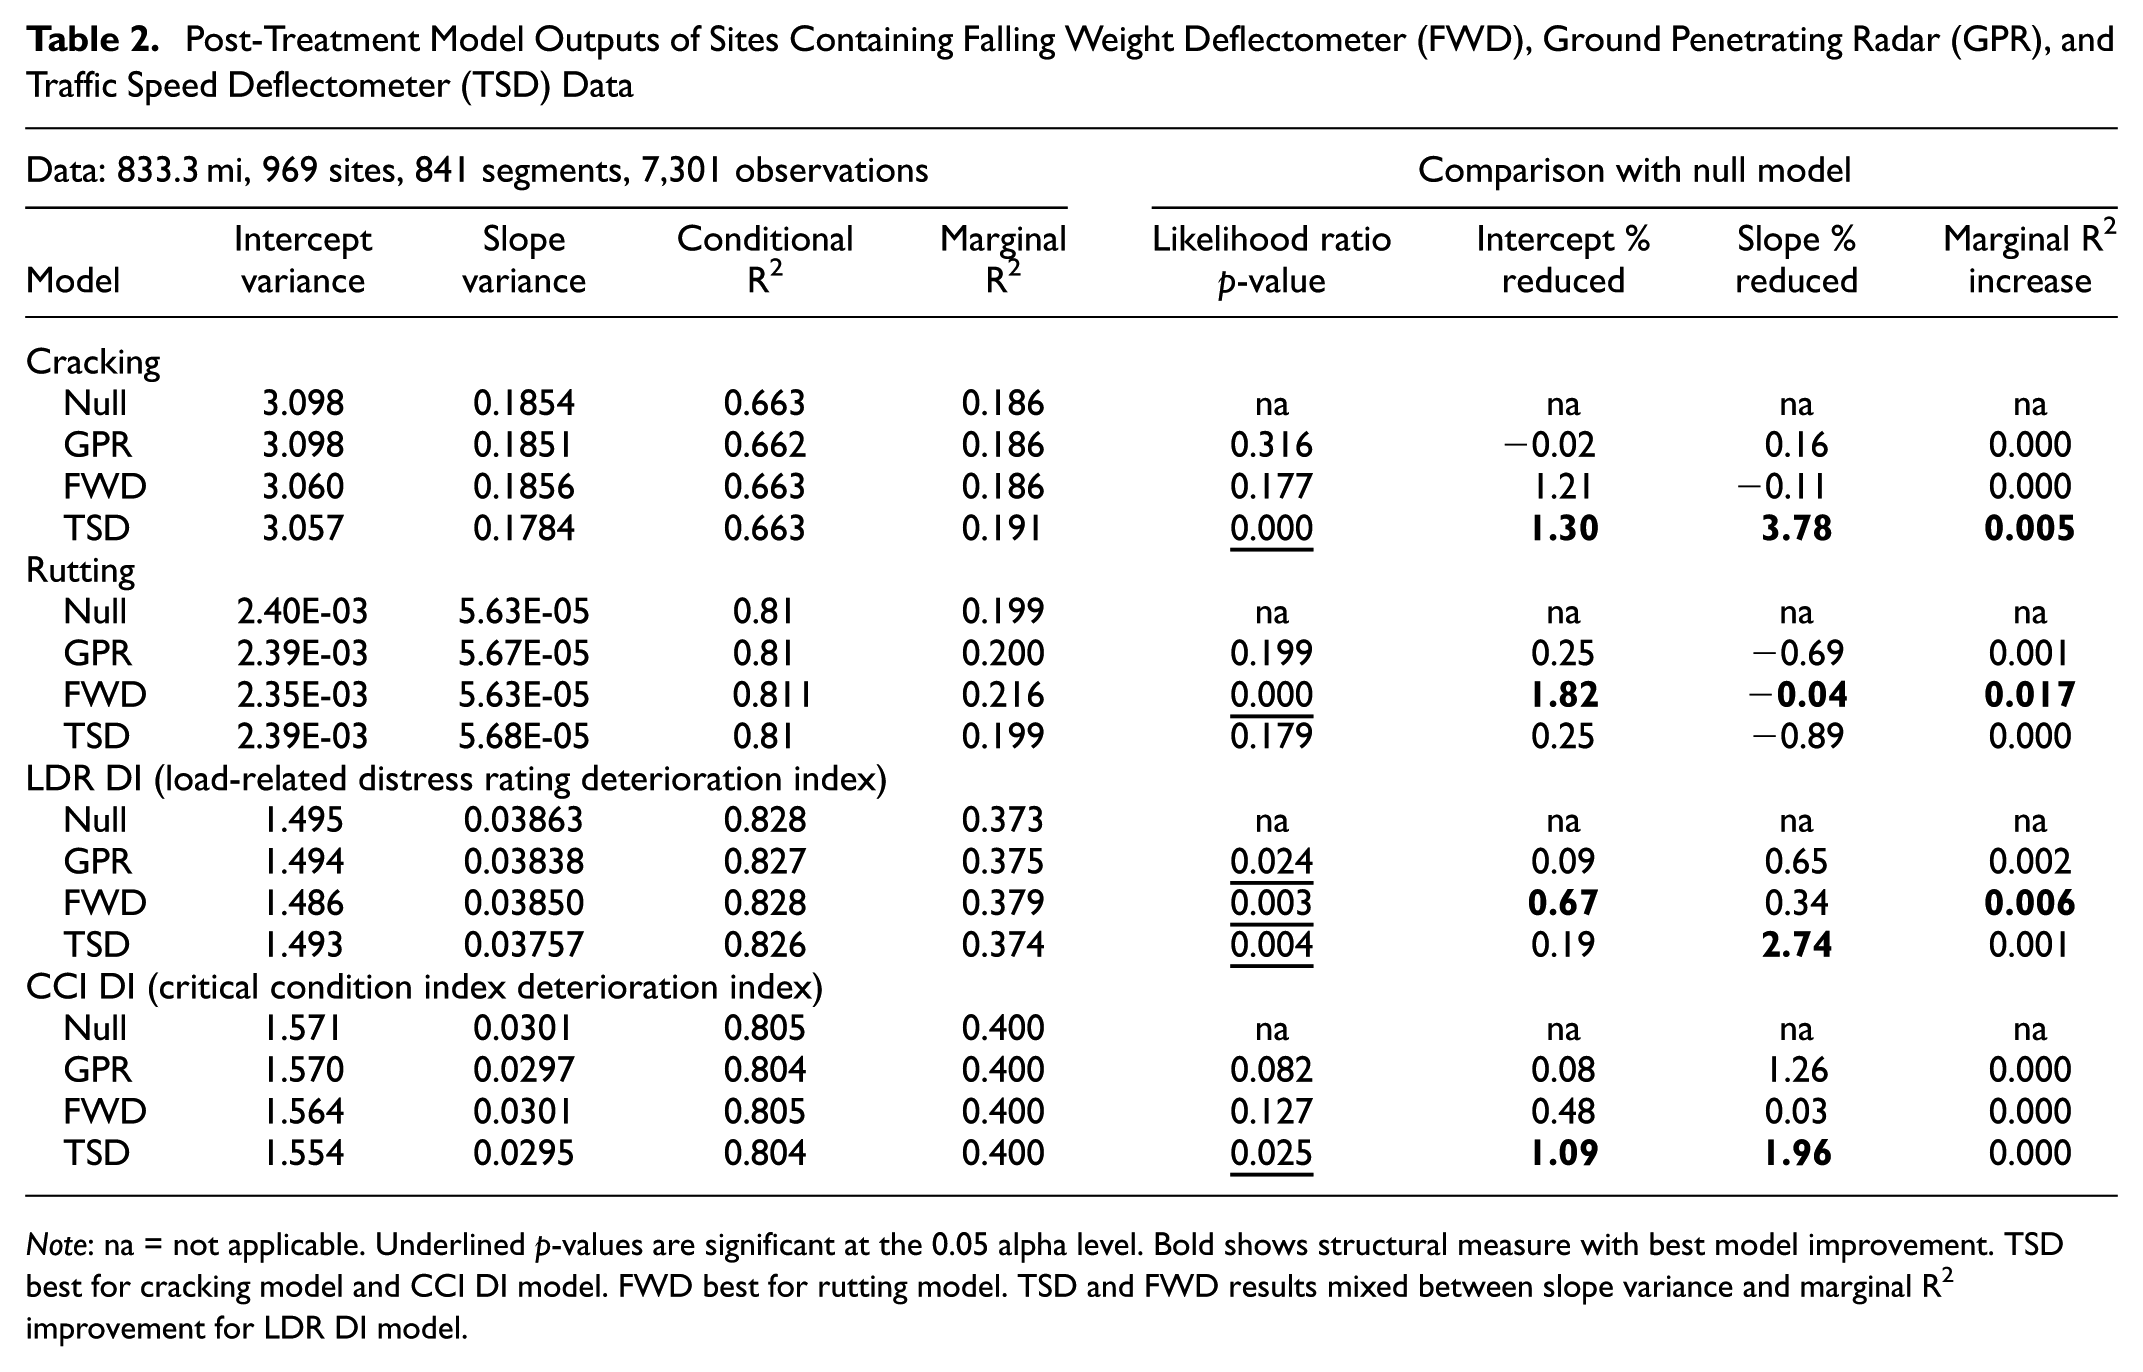
Note: na = not applicable. Underlined p-values are significant at the 0.05 alpha level. Bold shows structural measure with best model improvement. TSD best for cracking model and CCI DI model. FWD best for rutting model. TSD and FWD results mixed between slope variance and marginal R2 improvement for LDR DI model.
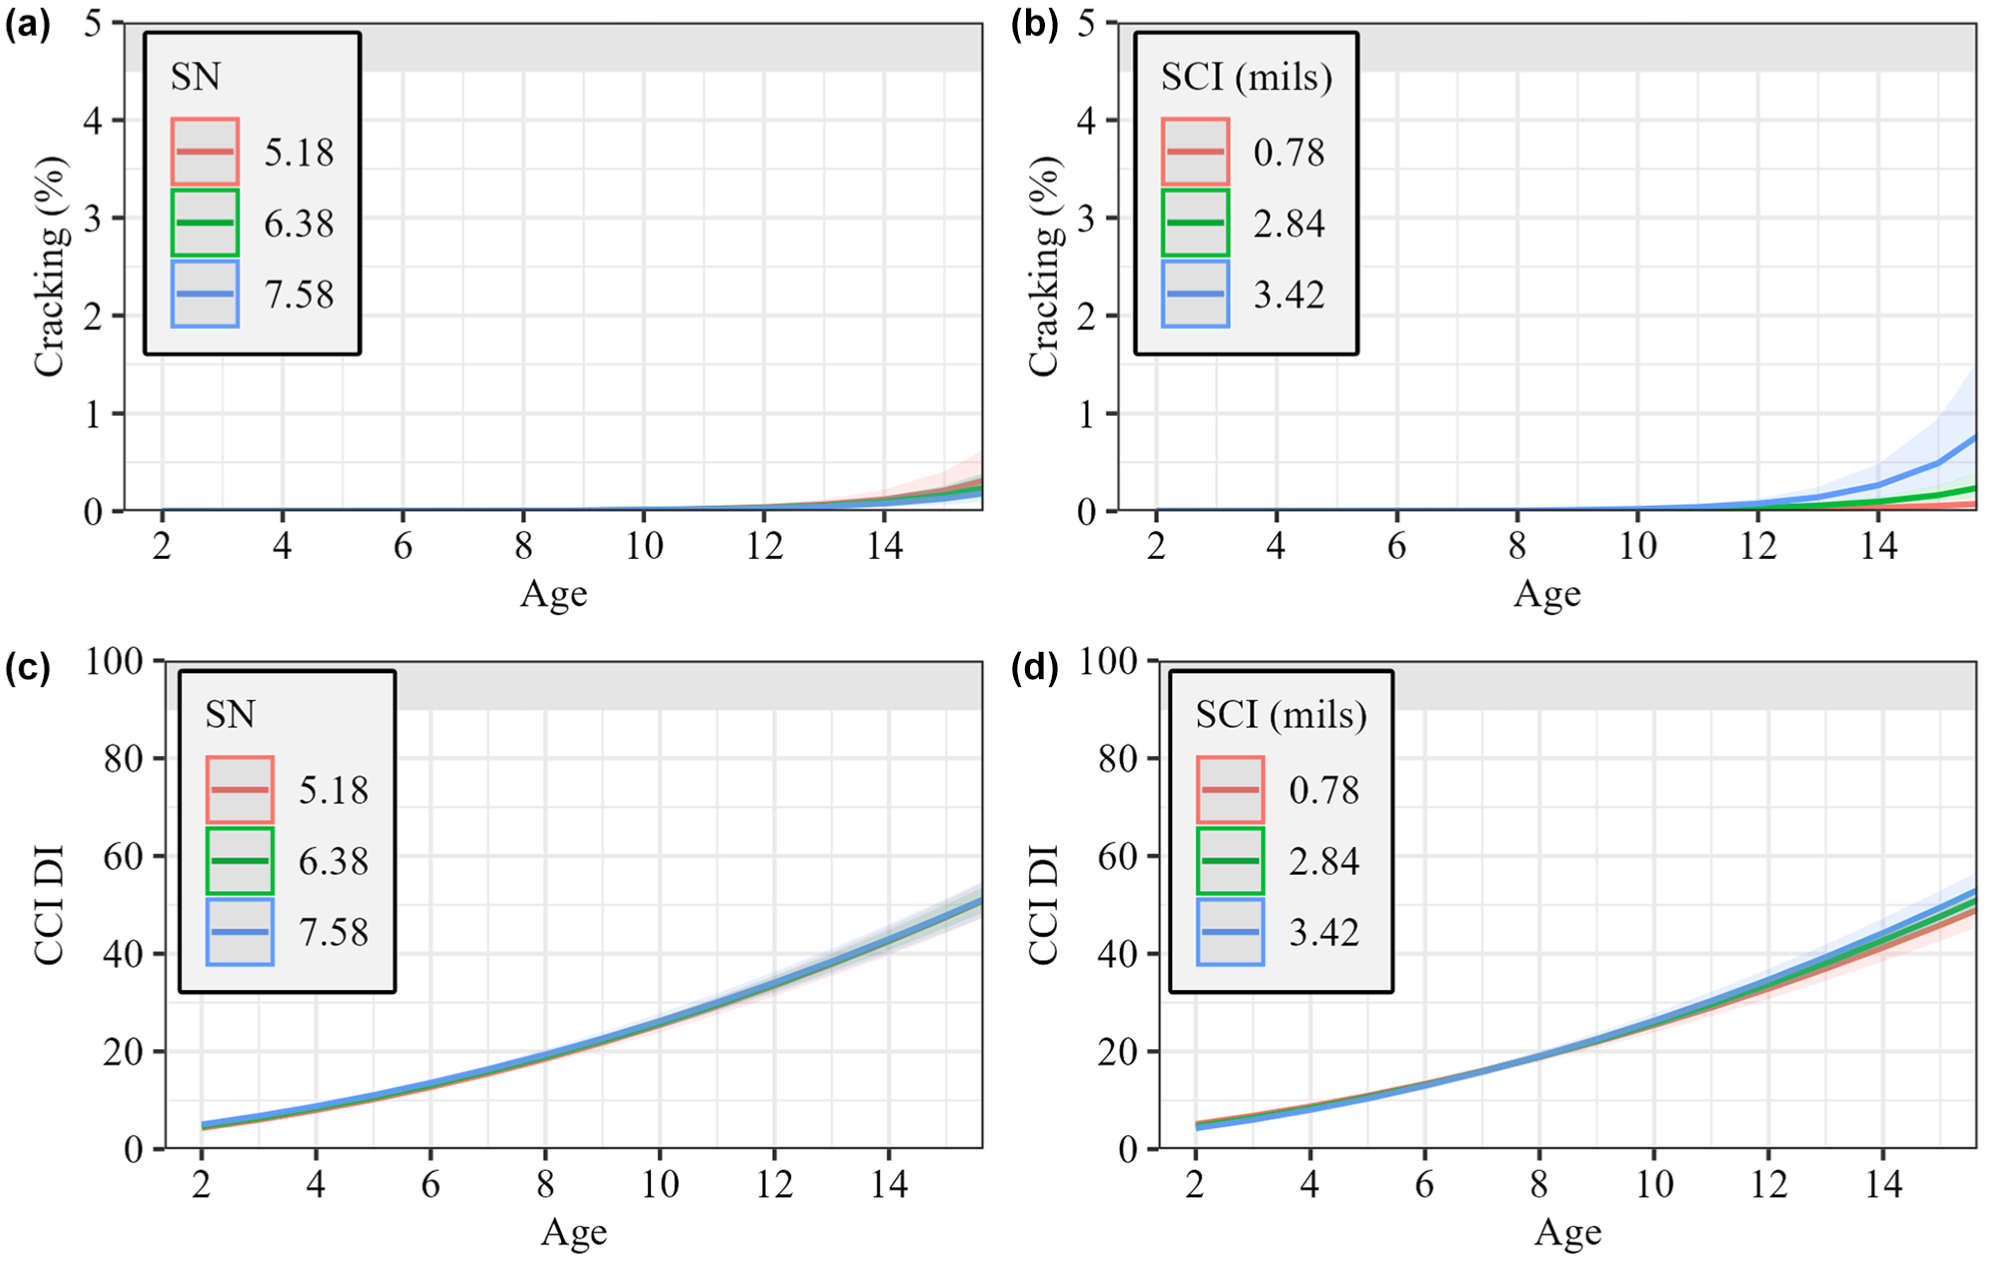
Falling weight deflectometer (FWD) and traffic speed deflectometer (TSD) structural measures matched data cracking and critical condition index deterioration index (CCI DI) post-treatment models. FWD cracking model in (a), TSD cracking model in (b), FWD CCI model in (c), TSD CCI model in (d).
The models with structural measures show an improvement from the respective null models. Each of the three structural measures showed a significant p-value for at least one distress. Also, all distresses show a statistically significant improvement for at least one of the structural models. Most models show an increase in marginal R2 less than 0.01, except for the FWD rutting model, which shows an increase of 0.017. The rutting models show an increase in random slope variance from the null model. This is attributed to the correlation between random coefficients and the high site-specific correlation, demonstrated by the difference between conditional and marginal R2.
The TSD structural measure shows the most improvement from the null model for the cracking and CCI models as the only structural measure that is statistically significant. However, the FWD model shows the best improvement for rutting. All three measures show significant likelihood ratio tests for LDR, with the FWD and TSD showing the most improvement in different parameters. While the TSD model for CCI showed improvement in the random coefficient variance, none of the CCI models showed any change in marginal R2.
The practical significance of the TSD and FWD structural measures is shown in Figure 2 for the cracking and CCI distresses. Three curves are plotted for the mean structural measure and ±1 standard deviation in each subplot. However, the different curves are hardly distinguishable within the Figure 2 CCI subplots, indicating no practical difference in the performance curve as the structural measure changes. This is congruent with no improvement in marginal R2 observed in Table 2. The TSD cracking plot shows an increase in cracking at the end of life for higher SCI.
As shown in Figure 2, these sites, with all three structural measures available, remain in good condition. Less than 10% of the observations show above 1% fatigue cracking, and only 16% of sites reached a failing CCI level of 60 or below. This is a result of the observational dataset where the agency is seeking to maintain its network in sufficient condition, especially its interstate routes.
Another set of multilevel models is fit using the pre-treatment distress measures (the negative age values) at each site. The distress data are filtered to only include sites in which the previous treatment was placed after 2001. Therefore, some sites may not have distress ratings for the initial years, but all sites have distress ratings as the site reaches the end of its service life. These previous treatments are included for asphalt resurfacing treatments (excluding chip seal, slurry seal, or microsurfacing treatments) with a minimum of three distress rating observations. The included asphalt resurfacing treatments are primarily mill and overlay and straight overlay treatments but also include multi-lift asphalt resurfacing and a few instances of recycling/reconstruction with asphalt resurfacing. The use of pre-treatment distress data makes three notable changes. First, all the sites are known to reach the end of their service life between asphalt resurfacing treatments. This increases the number of sites reaching a failing CCI to 44% of the sites (the remaining sites were resurfaced before failing on CCI). Second, the intercept represents the distress just before overlay, as opposed to just after overlay, causing an increase in the intercept variance. Third, the timing of the observations is shifted earlier and is better aligned with the FWD and GPR testing times with little overlap of the TSD collection times. The pre-treatment modeling results are shown in Table 3.
Pre-Treatment Model Outputs of Sites Containing Falling Weight Deflectometer (FWD), Ground Penetrating Radar (GPR), and Traffic Speed Deflectometer (TSD) Data
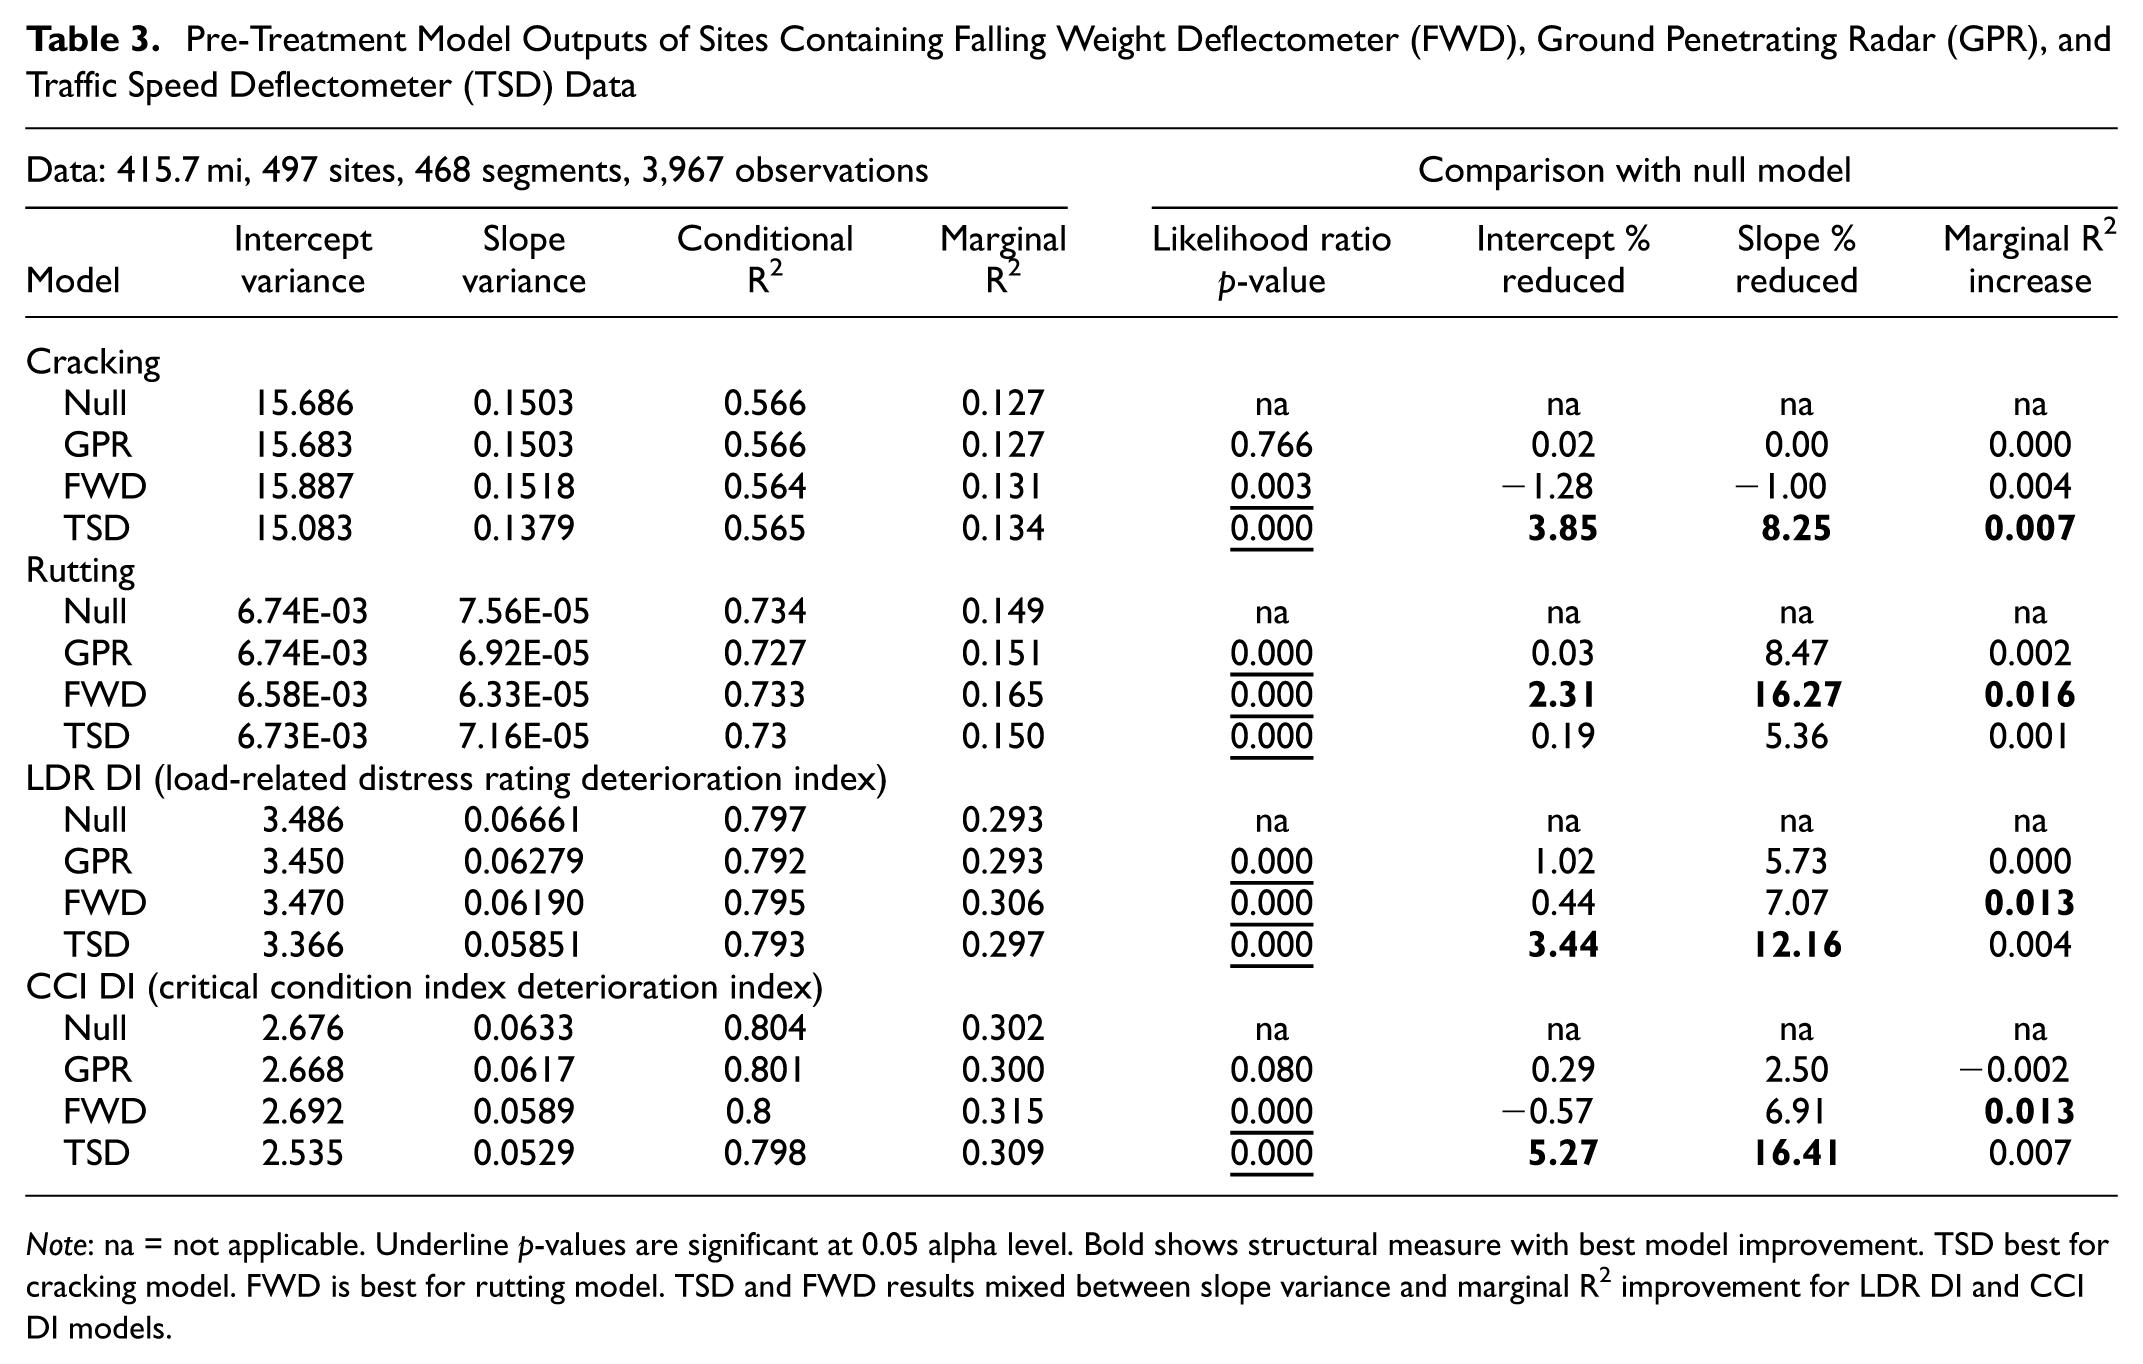
Note: na = not applicable. Underline p-values are significant at 0.05 alpha level. Bold shows structural measure with best model improvement. TSD best for cracking model. FWD is best for rutting model. TSD and FWD results mixed between slope variance and marginal R2 improvement for LDR DI and CCI DI models.
Ten out of twelve structural models in Table 3 show a statistically significant likelihood ratio p-value (exceptions being GPR cracking and GPR CCI models). A curious result is the FWD model for cracking distress, where the variance increased for both the intercept and slope coefficients. This could be related to the higher random coefficient correlation (0.79) for these cracking models and the overall lower proportion of error explained (conditional R2 around 0.566).
The comparison among the structural measures is similar to what is observed in Table 2. Based on the marginal R2, the TSD model again has the largest improvement in cracking performance. The FWD model shows the largest improvement for rutting. These findings support the assumption that the structural measures remain consistent across resurfacing treatments for a segment. The TSD models notably reduce the random coefficient variance for LDR and CCI. However, the FWD provides the greatest increase in the marginal R2 among the CCI and LDR models.
Limiting the data to segments with all structural measures available is helpful to compare results among the structural measures for the same data. It is also worthwhile to evaluate performance models including all available data for each structural measure. This includes a meaningfully larger number of sites with TSD data since data was collected beyond just the interstate routes. The third set of models presented in Table 4 includes all interstate and primary sites with available data for a particular structural measure. Because the data size differs for each structural measure, a separate null model is required for each row in the table. These null model results are not shown explicitly, but the improvement from the null model is still calculated as in Tables 2 and 3.
Post-Treatment Model Outputs for Ground Penetrating Radar (GPR), Falling Weight Deflectometer (FWD), Traffic Speed Deflectometer (TSD), and Prev Slope Structural Measures Including All Available Sites for Each Measure.
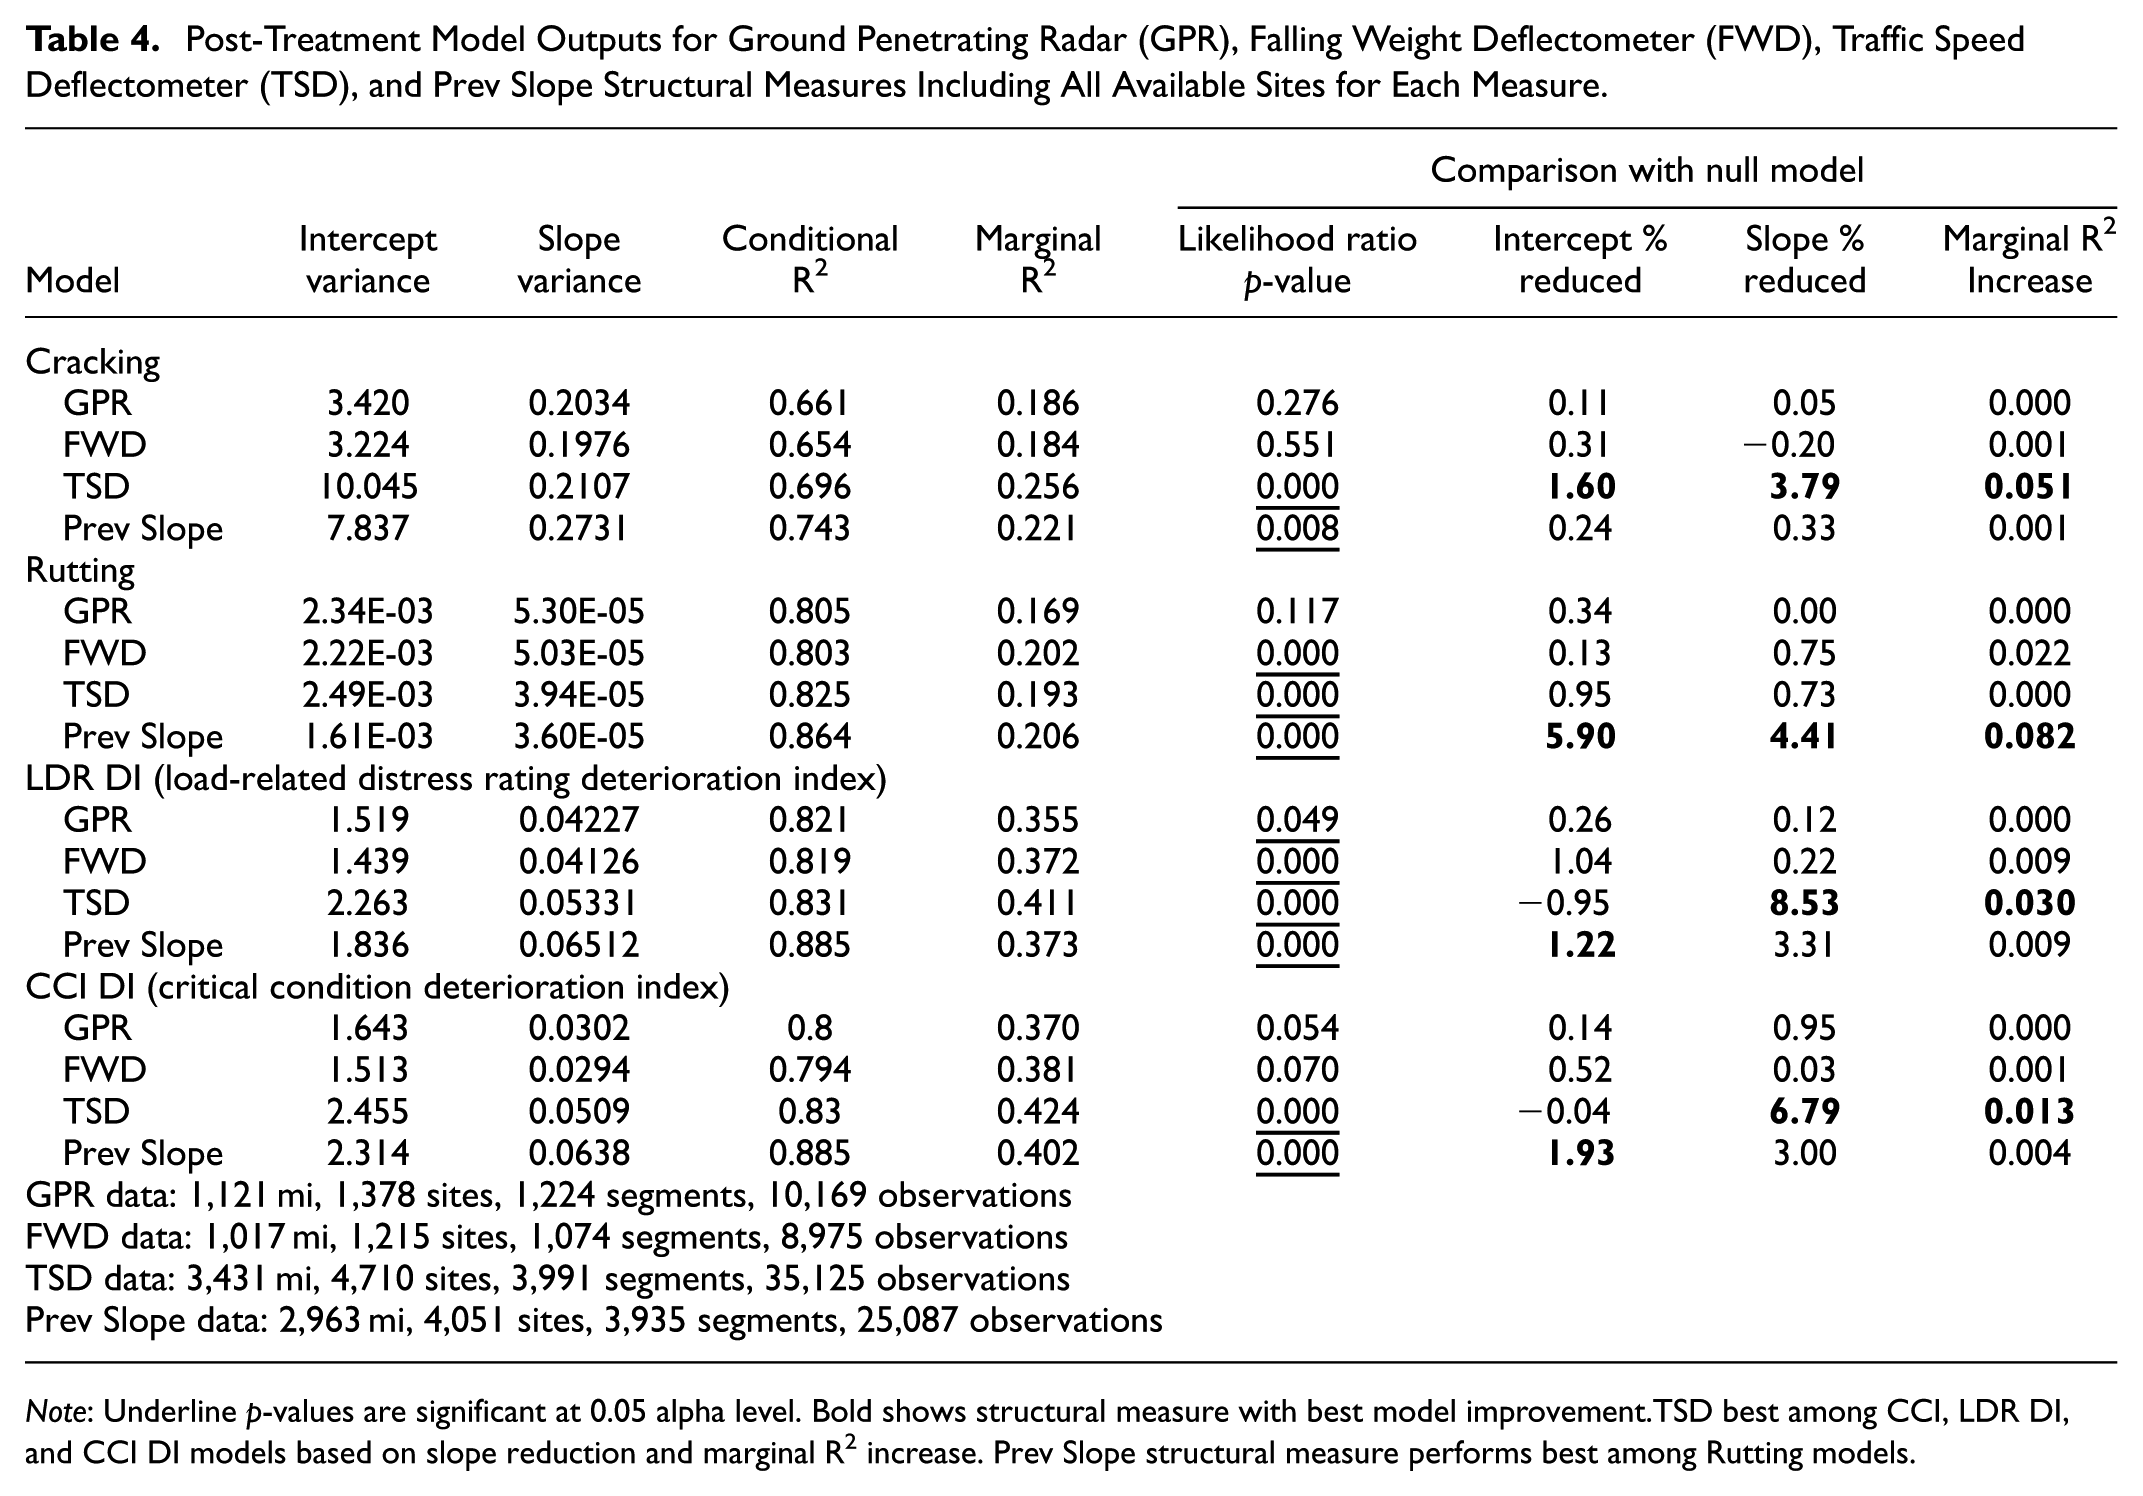
Note: Underline p-values are significant at 0.05 alpha level. Bold shows structural measure with best model improvement.TSD best among CCI, LDR DI, and CCI DI models based on slope reduction and marginal R2 increase. Prev Slope structural measure performs best among Rutting models.
The findings of Tables 2 and 3 show similarities between pre-treatment and post-treatment performance model improvement from structural measures. This suggests the pre-treatment performance model could be a potential alternative structural measure when modeling the post-treatment performance. This was evaluated by introducing the fourth structural measure, Prev Slope, in Table 4. This uses the pre-treatment model to determine the random coefficient slope term (
The TSD and Prev Slope model results in Table 4 show statistically significant likelihood ratio improvements from the null model for all four distresses. The GPR and FWD results are essentially the same as shown in Table 2, as not many new data were included for the models in Table 4. FWD models show statistical significance for rutting and both FWD and GPR structural measures show statistical significance for LDR. The TSD models show the most improvement for cracking, LDR, and CCI with marginal R2 increases of 0.05, 0.03, and 0.01, respectively. However, the Prev Slope model shows the most improvement for the rutting distress with a 0.08 increase in marginal R2.
The TSD and Prev Slope models had approximately three times larger datasets than the GPR and FWD. Because the TSD and Prev Slope models include both interstate and primary sites, their structural measures exhibit a wider range than those of FWD and GPR structural measures. Similarly, the intercept and slope variances in Table 3 show a higher variance from the TSD and Prev Slope data. This indicates a wider range of site-specific performance models when including primary routes. The further model improvement owing to the wider range of data is evident by comparing the TSD results in Table 2 with Table 4. The TSD cracking model marginal R2 increase, which was 0.005 in Table 2, is an order of magnitude higher at 0.05 in Table 4. The TSD testing covers a wider range of structural measures and pavement performance. The increased range of data results in a better relation of the TSD structural measure to the pavement performance models.
The models from Table 4 are visualized through interaction plots in the figures below, with each subplot corresponding to a row in the table. Like Figure 2, these plots show the fixed effect model for three curves, the mean structural measure and ±1 standard deviation. This visualizes the practical effect by showing how the performance model changes depending on the structural measure for each distress.
Figure 3 shows plots of the cracking distress models. As discussed previously, little cracking was observed on the interstate data, so the GPR and FWD models show no cracking distress. The TSD and the Prev Slope models show cracking increase above 1% after 12 years. The TSD and Prev Slope models include primary routes, whereas the GPR and FWD data only included interstate routes. The FWD plot of cracking is similar to Figure 2 because the same dataset was used. However, the TSD model in Table 4, including primary routes along with the interstate routes, shows a more prominent difference in performance curves owing to SCI than observed in Figure 2.
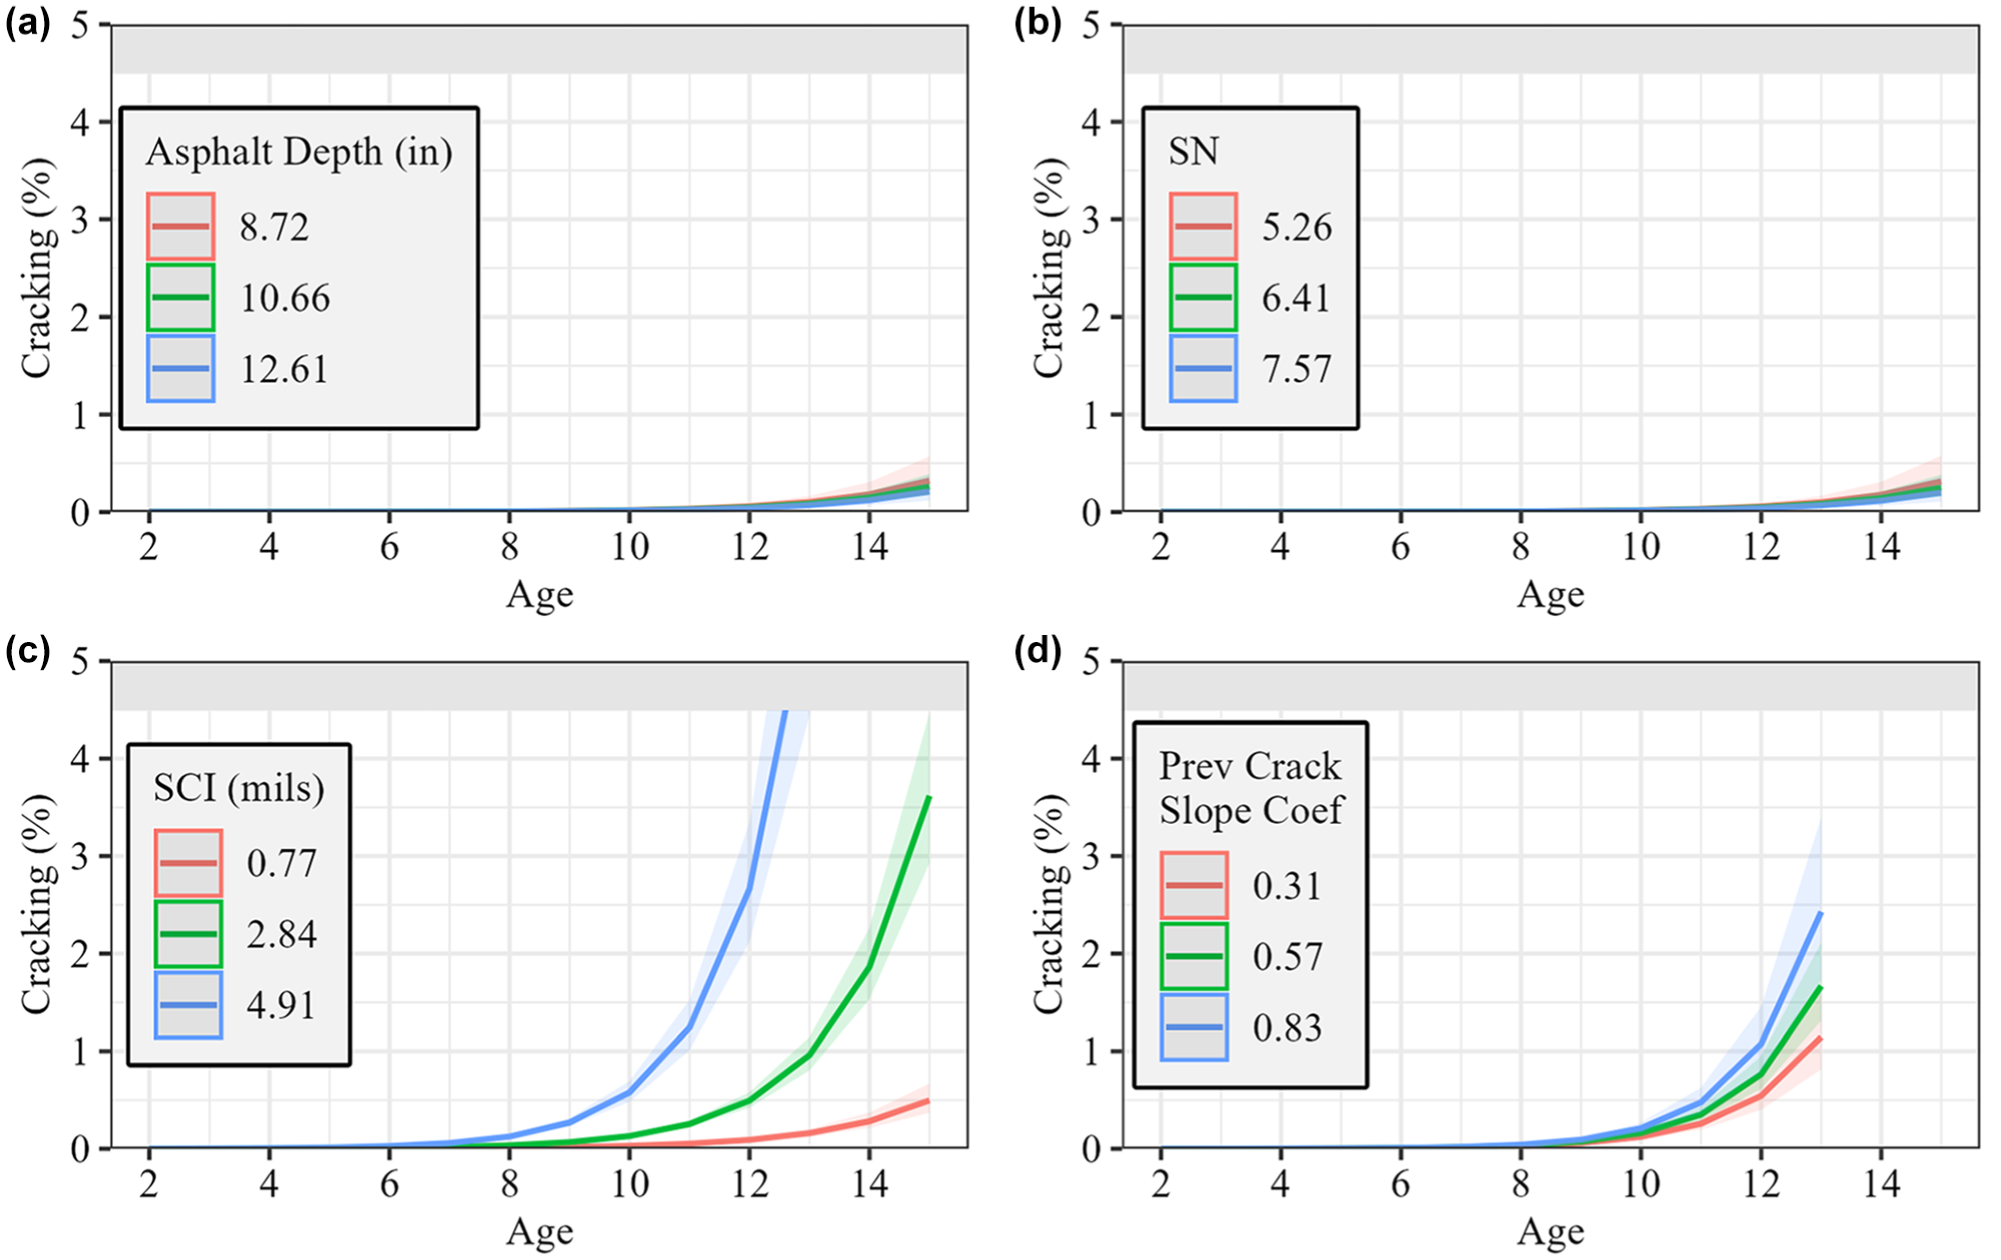
Interaction plot of cracking structural models. Ground penetrating radar (GPR) structural model in (a), falling weight deflectometer (FWD) structural model in (b), traffic speed deflectometer (TSD) structural model in (c), previous cracking slope model in (d).
The TSD plot shows the different SCI values result in prominent differences in the cracking performance model. The TSD model estimates that as SCI increases from 2.84 to 4.91, the time to reach 3% cracking decreases from 14.5 years to 12 years. While the Prev Slope data plot shows cracking values that increase, the pre-treatment slope coefficient does not show a practical impact on the estimated cracking.
Figure 4 shows interaction plots of the four rutting distress models. In this case, the TSD and GPR models show trivial differences between rutting based on the structural measure. The FWD model shows a similar rate of deterioration for each SN level, but the lower SN relates to a higher intercept value leading to more estimated rutting. The Prev Slope model shows a noticeable difference in the rate of rutting based on the Prev Slope rutting coefficient. This could be a result of the tendency to use the same mix types when resurfacing a segment. The estimated rutting performance when the previous slope is one standard deviation above the mean results in reaching 0.15 in. of rutting in seven years compared with nine years for the mean pre-treatment slope result.
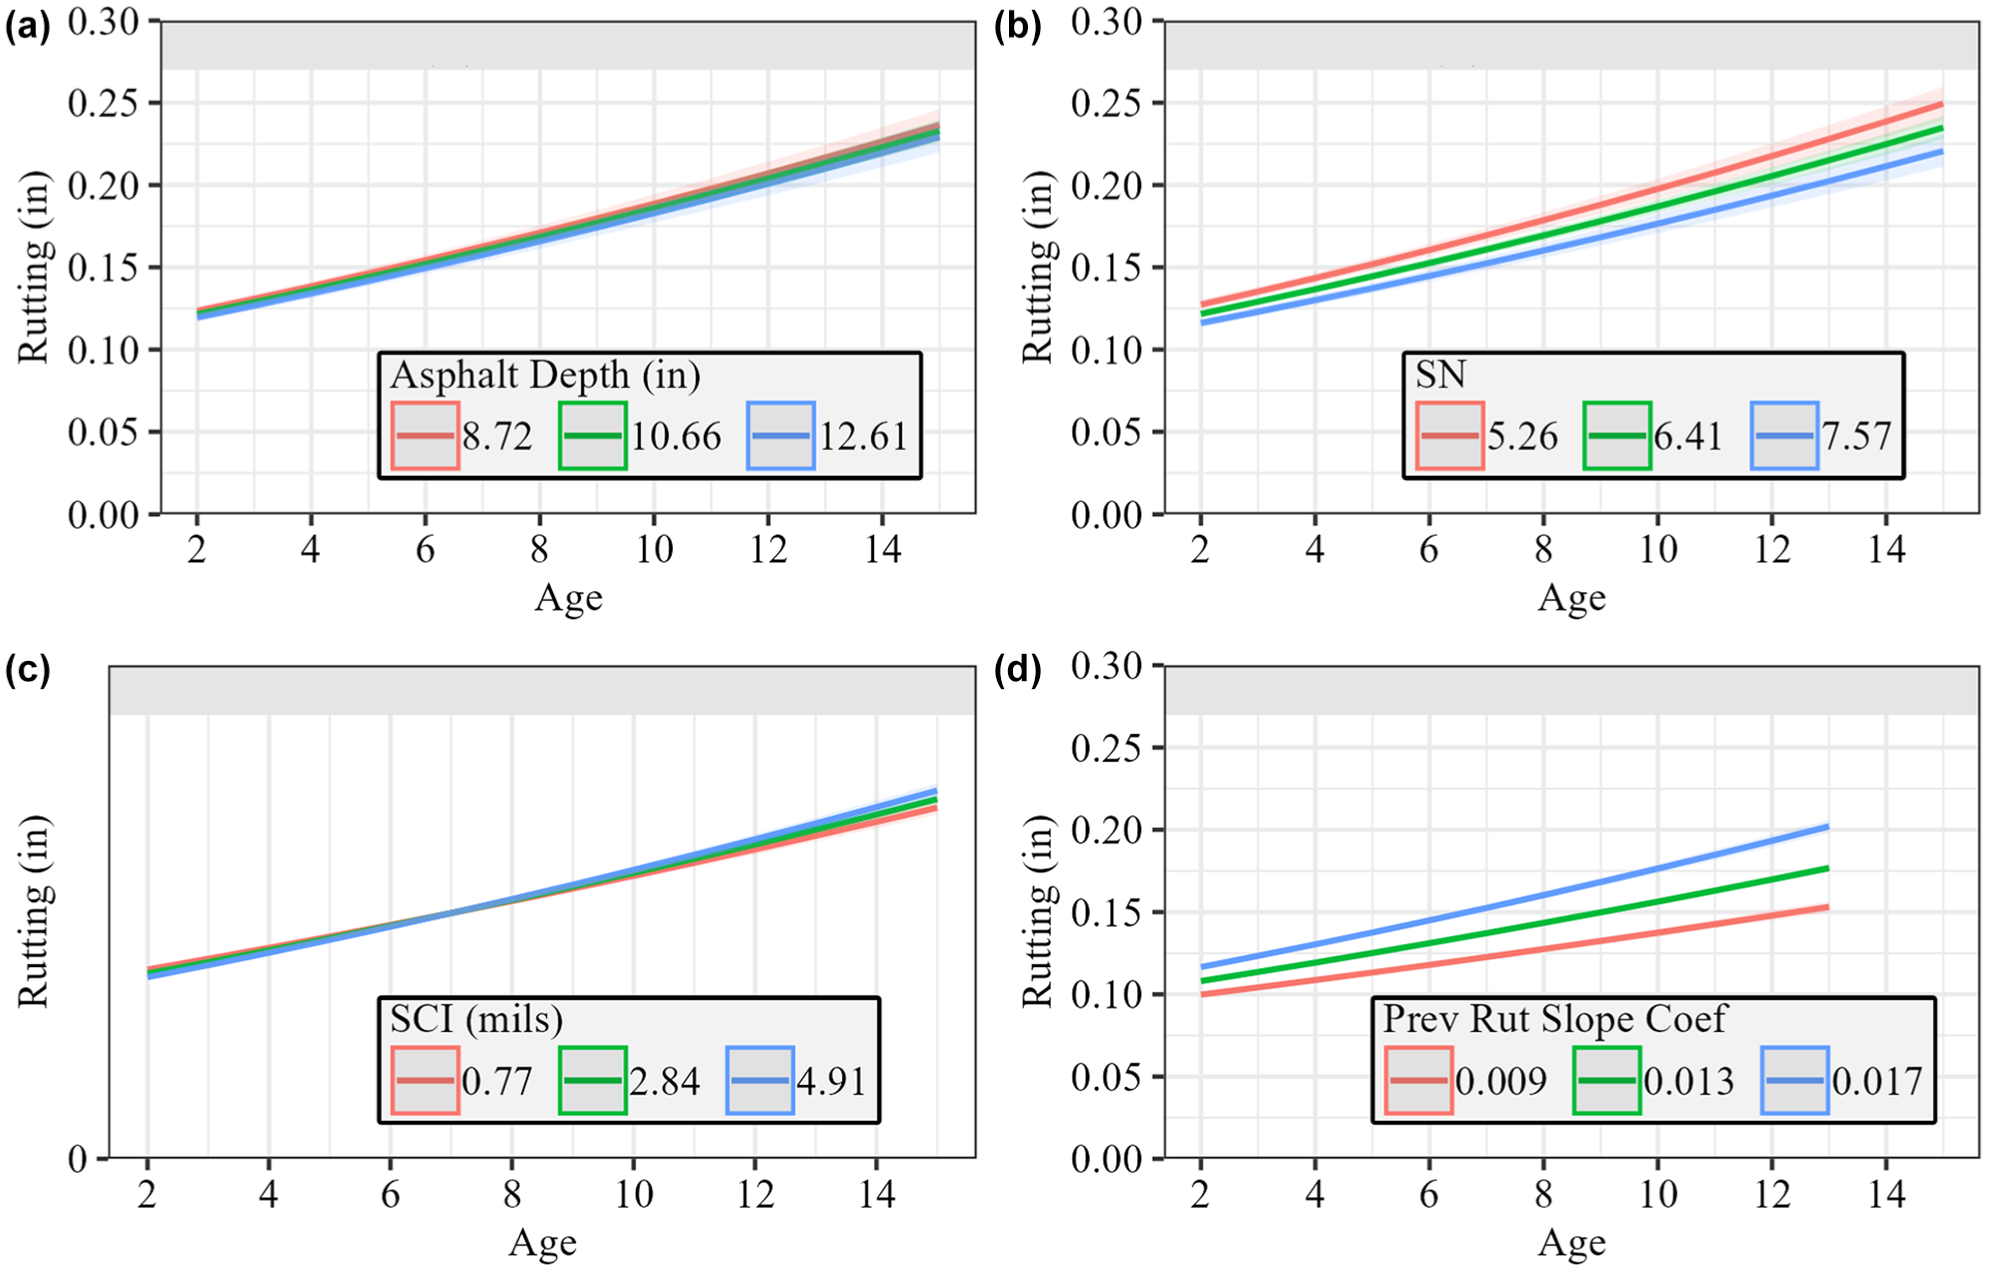
Interaction plot of rutting structural models. Ground penetrating radar (GPR) structural model in (a), falling weight deflectometer (FWD) structural model in (b), traffic speed deflectometer (TSD) structural model in (c), Previous rutting slope model in (d).
The models of the LDR DI are plotted in Figure 5. Like the plots in Figure 3, TSD and Prev Slope models show the most practical change in estimated distress. Both the TSD and Prev Slope models estimate 13 years age when LDR DI reaches the failure limit, 40, for the mean structural value (line shown in green [color online only]). This compares with the GPR and FWD models showing 15 years, given the overall better condition observed in their data. The TSD model shows that as SCI increases 2 mils above the mean, the estimated age to reach deficient LDR is reduced by three years, going from 13 years to 10 years. In comparison, the FWD model shows less impact from a reduced SN, as the age at deficient LDR is reduced from 15 to 14 years.
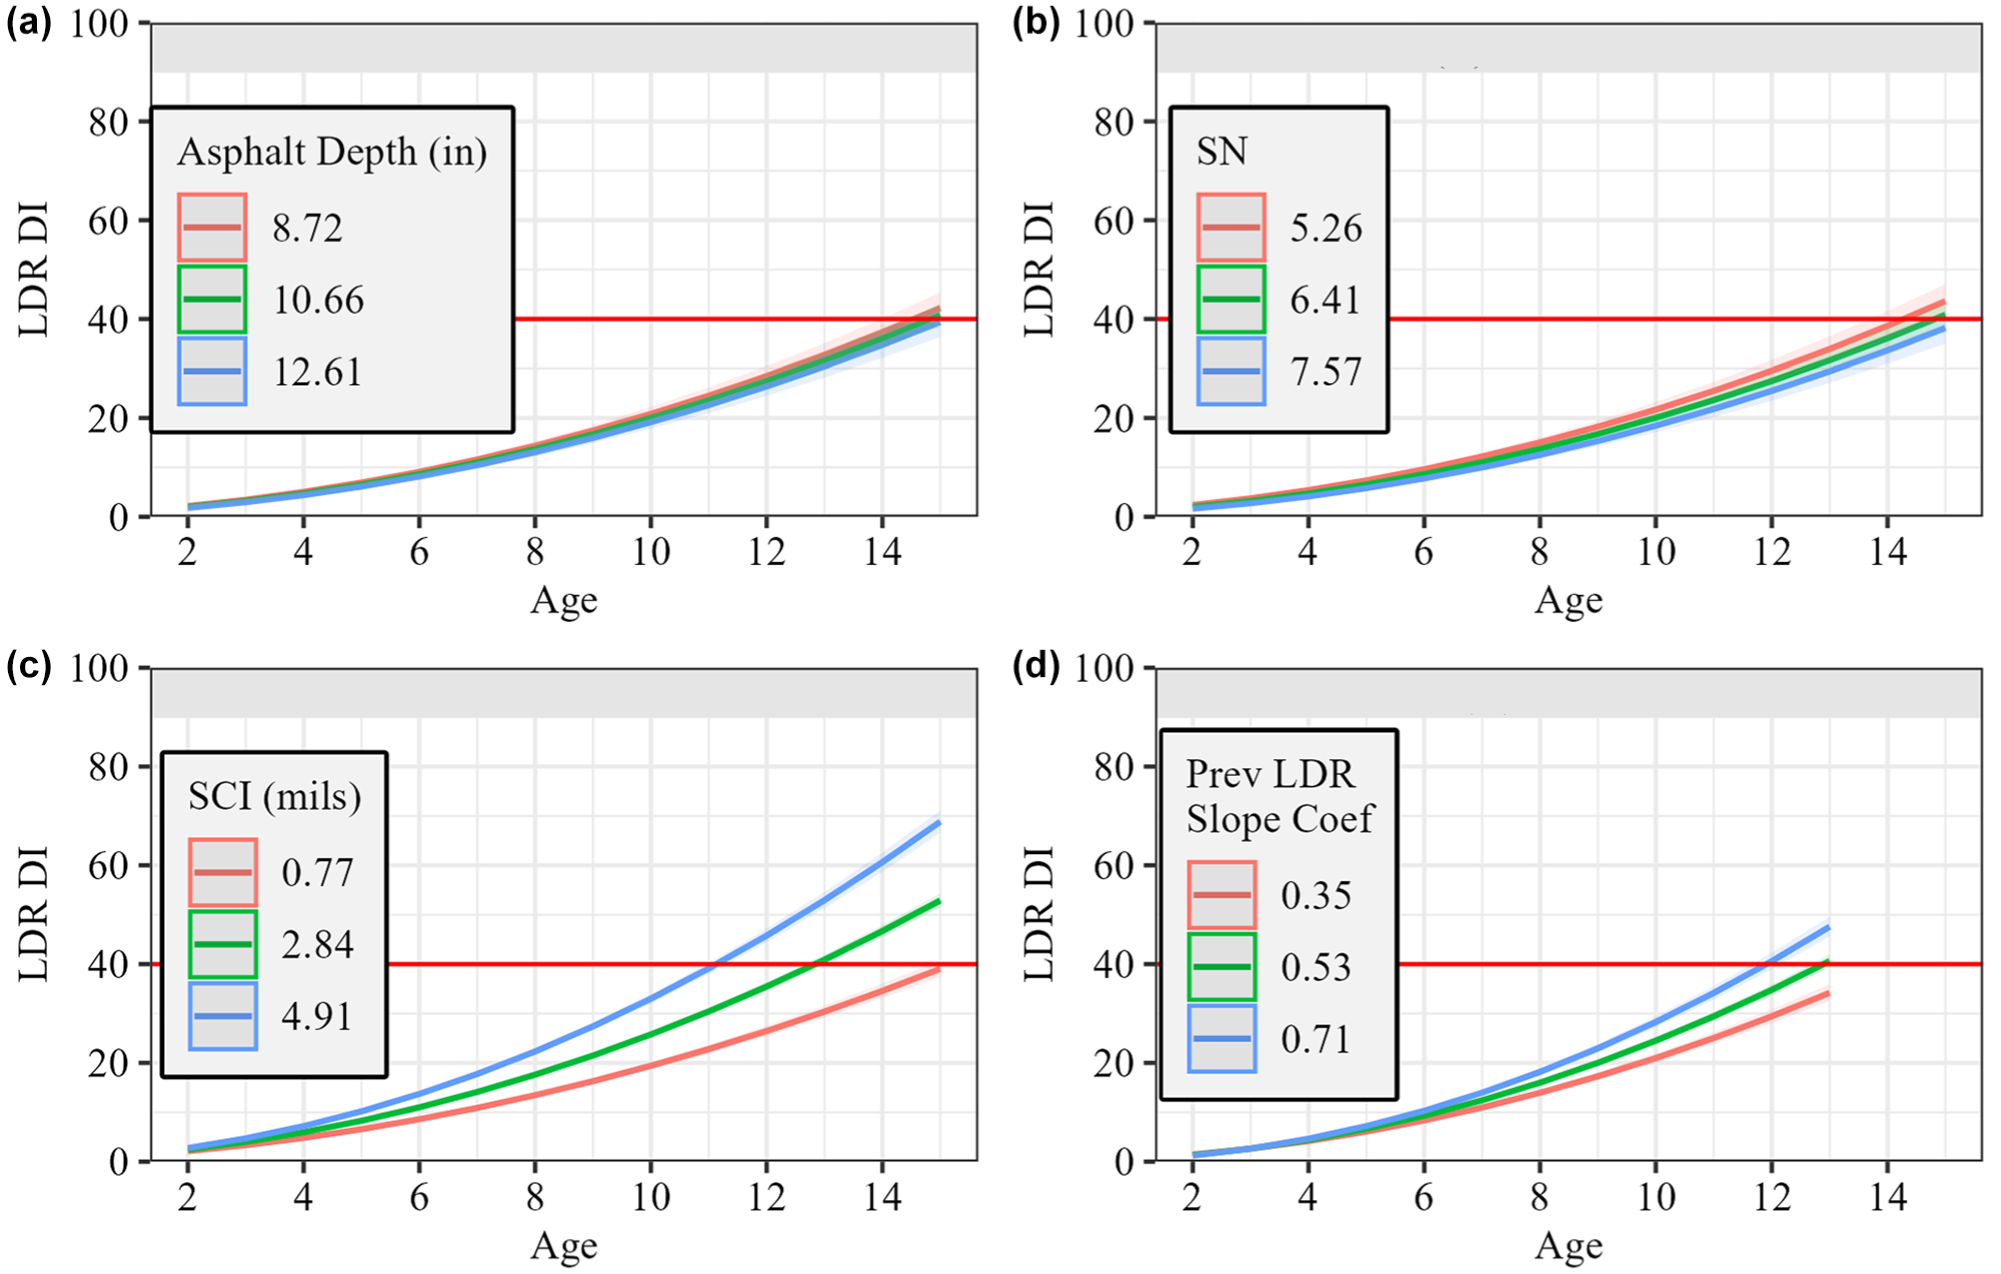
Interaction plot of load-related distress rating deterioration index (LDR DI) structural models. Ground penetrating radar (GPR) structural model in (a), falling weight deflectometer (FWD) structural model in (b), traffic speed deflectometer (TSD) structural model in (c), Previous LDR slope model in (d).
The CCI performance plots in Figure 6 show the CCI DI increases more in the first five years than observed in the LDR performance models in Figure 5. This suggests that pavements show lower NDR in the early years, with LDR being more critical as the pavement reaches the failure threshold. The TSD and Prev Slope models show more practical differences in CCI than GPR or FWD. An increase in SCI by 2 mils from the mean reduces the estimated age to reach CCI failure by about one year (11.5 years at 2.84 SCI and 10.5 years at SCI 4.91). The FWD model shows no practical difference of FWD SN to the projected age of CCI failure limit.
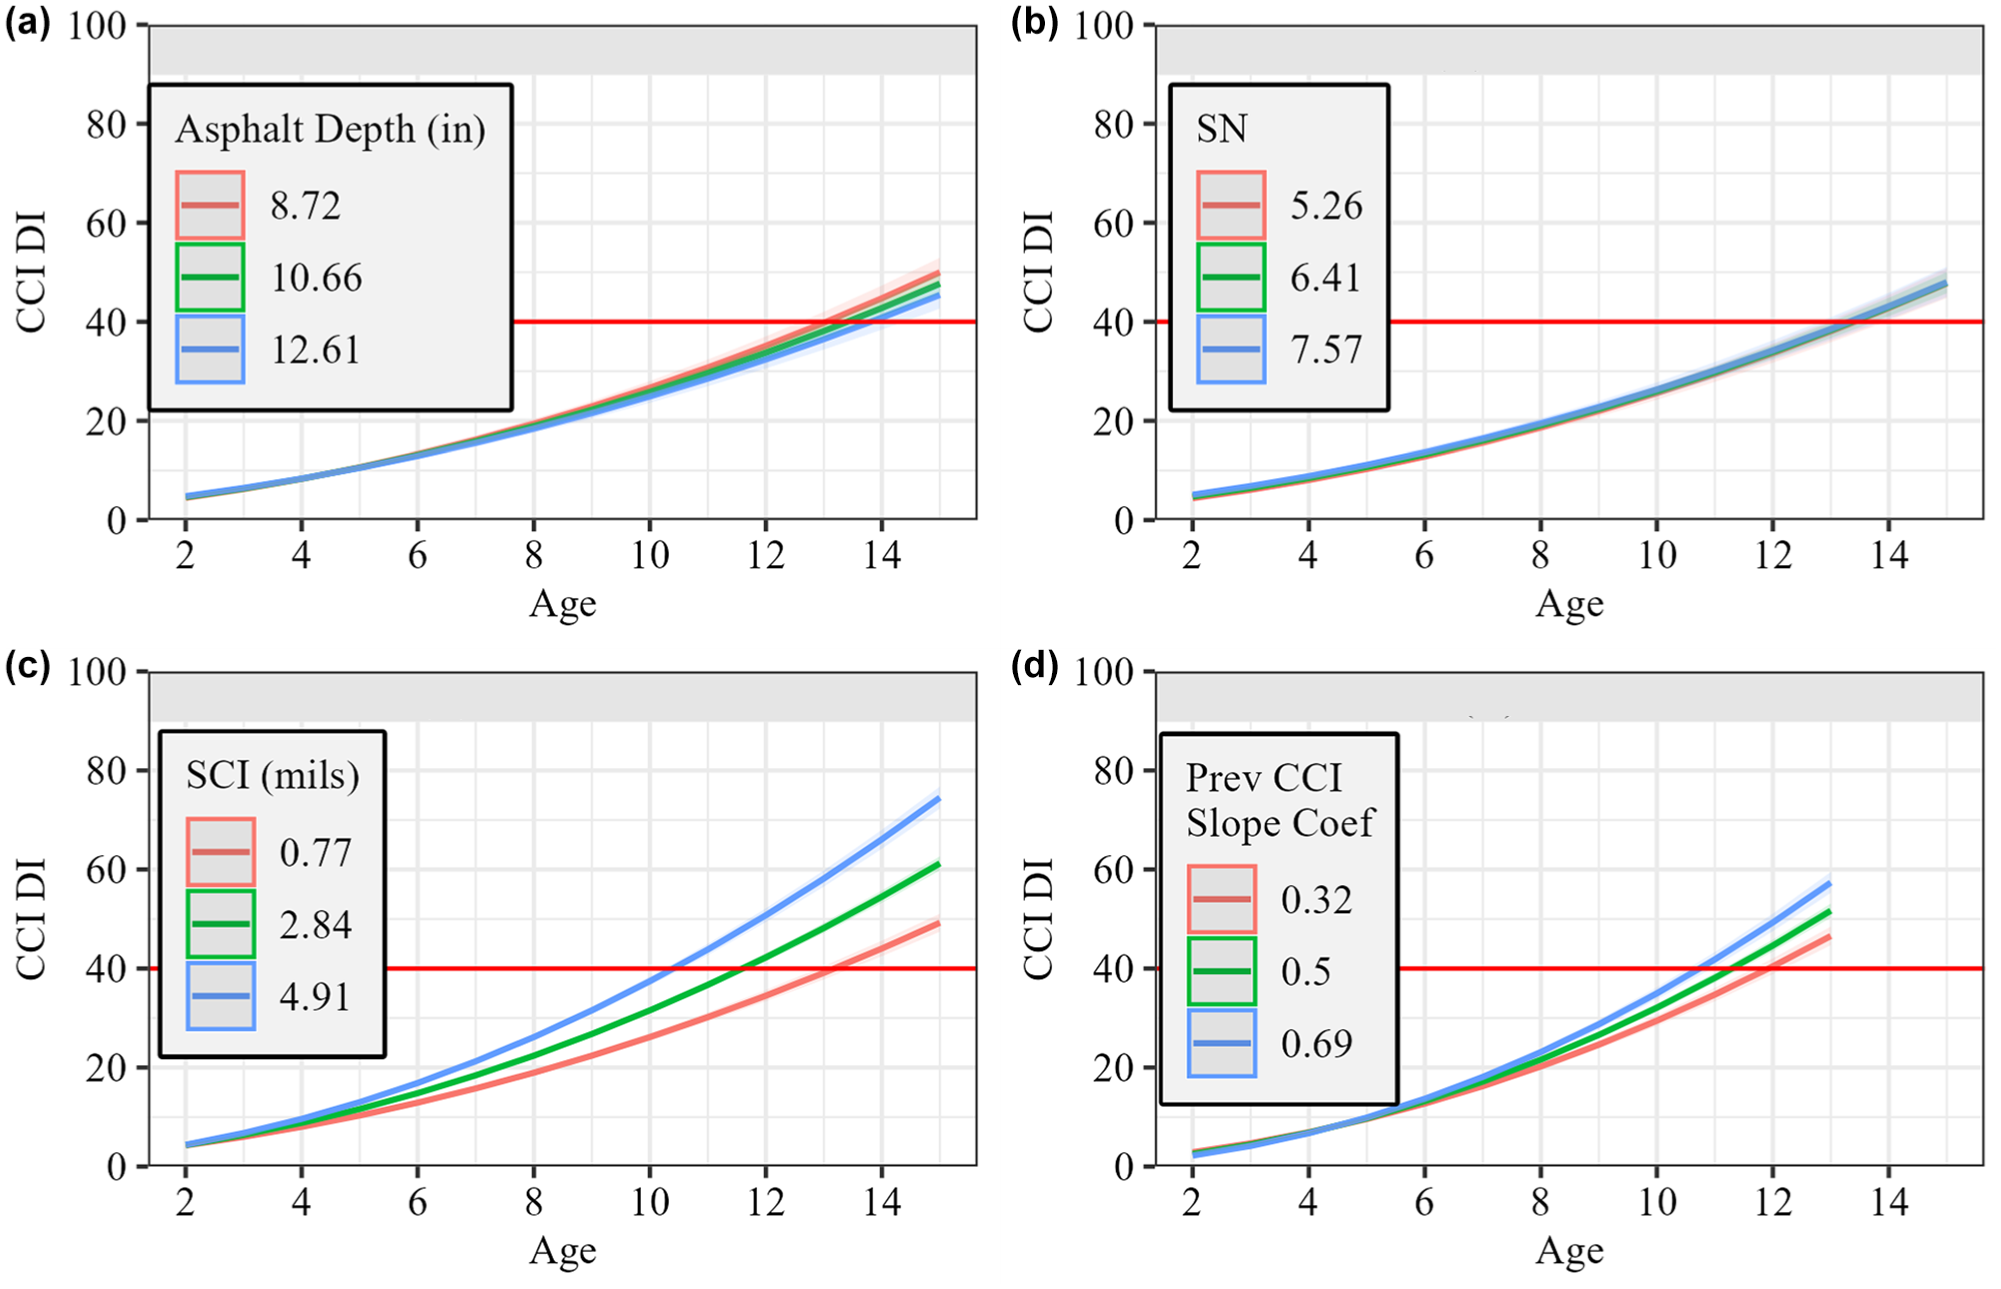
Interaction plot of structural models of critical condition index deterioration index (CCI DI). Ground penetrating radar (GPR) structural model in (a), falling weight deflectometer (FWD) structural model in (b), traffic speed deflectometer (TSD) structural model in (c), previous CCI slope model in (d).
Conclusions
The impact of a structural measure varies depending on the output distress being considered. While the TSD measure showed the largest improvement in cracking, LDR, and CCI among the different structural measures considered, it had no impact on the rutting model. The TSD measure of SCI compares favorably to the FWD SN structural measure, both when compared on the same matched site data and across all available sites. The projected service life, based on CCI, was reduced by one year as the TSD SCI measure indicated a weaker pavement, whereas a change in FWD SN did not show any observable difference in projected performance life. This suggests the SCI from TSD testing can be incorporated into network-level performance models without needing to convert TSD data to match the FWD output of SN. Incorporating temperature adjustments to measurements or pavement thickness to calculate different parameters could improve TSD relationship to performance. However, a network-level measure from TSD data does not need to be matched to the FWD SN as the ground truth measure.
The GPR measure of asphalt thickness was statistically significant in one distress model but did not provide a practical benefit to the models. The Prev Slope structural measure showed an impact on the post-treatment performance models, particularly the rutting model. While the TSD showed the best improvement to the performance models, the previous slope metric could offer a readily available alternative for agencies with ample time history of distress rating data.
The TSD also showed an increased impact when modeled with more diverse pavements including both interstate and primary sites. This highlights the need for any network-level structural measure to cover a wide range of values and pavement performance. Only testing sites with good structures will not provide as much benefit to performance models as testing both strong and weak pavements with varying performance curves.
While the multilevel model approach provides a consistent method for linking site-specific performance to the structural measures, a limitation is the assumption of a continuous relationship. This continuous relationship requires that a structural measure has a uniform effect on the performance model across its entire range. That is, a change in SCI from 1 to 2 has the same effect on the slope and intercept coefficients as an SCI increase from 5 to 6. However, the performance model will likely be more sensitive to structural measures in specific ranges. Further research into a selected structural measure could help identify the critical breakpoints where the pavement performance changes more.
Footnotes
Author Contributions
The authors confirm contribution to the paper as follows: study conception and design: B.C. Smith; data collection: B.C. Smith, analysis and interpretation of results: B.C. Smith; draft manuscript preparation: B.L. Smith, B.C. Smith. All authors reviewed the results and approved the final version of the manuscript.
Declaration of Conflicting Interests
The authors declared no potential conflicts of interest with respect to the research, authorship, and/or publication of this article.
Funding
The authors received no financial support for the research, authorship, and/or publication of this article.