
Abstract
This article presents an in-depth analysis of infrastructure risk and resilience assessment through the application of conventional and probabilistic risk analysis and management for critical asset protection (RAMCAP) methodologies. Focused on selected road segments in Camden City, New Jersey, U.S., the study explores the effectiveness of these methodologies in identifying vulnerabilities and enhancing infrastructure resilience. By conducting a comprehensive data inventory and employing both conventional and probabilistic approaches, the research reveals the significant advantages of incorporating probabilistic factors into risk assessments. The probabilistic RAMCAP methodology, in particular, is highlighted for its ability to account for the uncertainties of future conditions and events, offering a more nuanced understanding of potential risks. The findings underscore the importance of dynamic risk assessment models in capturing the complex nature of infrastructure systems and their interactions with environmental and anthropogenic hazards. Recommendations include the adoption of probabilistic approaches in infrastructure risk management, continuous data collection and analysis, investment in geospatial analysis tools, stakeholder engagement, and the integration of risk assessment findings into policy and planning. This research aims to contribute to the field of infrastructure risk management by demonstrating the practical application and benefits of probabilistic risk assessment methodologies, ultimately advocating for their wider adoption to ensure the resilience of urban infrastructure against future challenges.
The resilience of infrastructure systems, particularly transportation networks, is increasingly crucial as they face an array of risks, including natural-hazard-induced disasters, technological failures, and anthropogenic hazards. Among these, flooding poses a significant threat to road networks, affecting both the physical infrastructure and the safety and mobility of users. Flooding can lead to road closures, traffic disruptions, and crashes, thereby affecting emergency response time, economic activities, and daily commuting. In the U.S., flooding is a frequent and costly hazard; in 2024, FHWA reported approximately ¾ billion U.S. dollars to repair roads and bridges damaged by extreme weather events and natural hazards-induced disaster ( 1 ). In addition, over 60,000 mi of U.S. roads and bridges in coastal areas are at risk of flooding and damage ( 2 ). These statistics underscore the critical need for effective risk assessment and management strategies to mitigate flood-related impacts on transportation networks.
Several methodologies have been applied to assess resiliency risk and vulnerability within the transportation sector. One prominent methodology is the Risk Analysis and Management for Critical Asset Protection framework (RAMCAP), developed by the American Society of Mechanical Engineers (ASME) following the September 11, 2001, attacks. The White House requested a comprehensive framework for protecting critical infrastructure, prompting ASME to convene industry leaders to establish RAMCAP. This framework was designed to provide a standardized, objective approach to risk assessment, emphasizing the need for common terminology, metrics, and consistent analysis and reporting processes ( 3 ). RAMCAP interprets risk as the expected outcome of potential terrorist or natural events, as defined by the U.S. Department of Homeland Security. This approach evolved over time, becoming more streamlined for practical application, and is now known as RAMCAP Plus. The RAMCAP Plus process offers a standardized system of terminology and metrics, enabling comparative analyses across various assets or systems using the same methodology. The RAMCAP Plus process quantitatively evaluates risk, resilience, and the benefits of improvements in defined areas, incorporating expert assessments of vulnerability, threat likelihood, and various consequences, including non-quantifiable impacts such as psychological effects and public confidence. This approach has been applied to evaluate risk and enhance resilience against diverse threats such as hurricanes, floods, tornadoes, earthquakes, terrorism, and system dependencies ( 4 ). RAMCAP Plus calculates monetized risk and resilience measures, expressed in dollars per year. This methodology is comprehensive and data-intensive, enabling a detailed and monetary-based assessment of infrastructure risk. It incorporates a range of factors, including the likelihood of disruptive events, the vulnerability of infrastructure assets, and the potential economic impacts of such events. This approach is particularly useful in scenarios where detailed asset data is available, and a monetary-based risk assessment is required.
Several studies in the current literature have introduced approaches to applying the RAMCAP Plus process in various majors. For instance, Matsika et al. developed risk assessment specifications to analyze the vulnerability of public transportation systems to terrorist attacks ( 5 ). Renne et al. highlighted RAMCAP as one of the approaches utilized by state departments of transportation (DOTs) to evaluate risk and resilience in transportation infrastructure assets ( 6 ). A review study that explored the existing literature on critical infrastructure protection and resilience highlighted RAMCAP as one of the approaches utilized for modeling safe drinking water and RAMCAP Plus for energy, utilities, water, safety, and manufacturing sectors ( 7 ). Agencies also utilized the RAMCAP approach to develop resiliency-aid tools; in 2020, Colorado DOT (CDOT) adopted a quantitative risk assessment method to “build back better” after a devastating flood event in 2013. In addition, Bai et al. adopted the RAMCAP Plus approach and proposed a comprehensive analytical framework for risk-based infrastructure asset management ( 8 ). Other researchers utilized the basic design of the RAMCAP and developed updated risk analysis approaches based on their needs. For example, White et al. employed the design of the RAMCAP approach and developed a risk analysis methodology that considers fixed and mobile assets of the system, named Lifeline Infrastructure Risk Analysis ( 9 ). Cordero et al. highlighted that the RAMCAP process fundamentally addresses protection and resilience concerning only economic losses or injuries and fatalities, lacking in addressing operational or physical losses in infrastructure ( 10 ). The authors utilized some basics from the RAMCAP approach and developed a performance-based resilience procedure framework. Carbonelli and Gratta developed a multi-risk assessment method (MRAM) for natural-hazard-induced disasters and highlighted that MRAM is a non-proprietary method which can be deployed in various operating scenarios and in the presence of several hazards or threats ( 11 ). MRAM bridges the gap in RAMCAP as a proprietary approach.
Current literature has highlighted and addressed several limitations of the RAMCAP approach (e.g., its lack of addressing the operation or physical losses), that it is not a multi-risk approach, and its proprietary process ( 10 , 11 ). However, there are limitations that are still not addressed, including inadequate consideration of time-dependent consequences (e.g., the service life of an asset), assuming a stationary vulnerability assessment, and lack of guidance on target resilience or reliability levels. To address these shortcomings, this paper aims to present an enhanced framework for probabilistic risk analysis of critical infrastructure by integrating a probabilistic model to refine the RAMCAP methodology. The proposed probabilistic RAMCAP process accounts for the likelihood of threats occurring over the service life of infrastructure. In addition, it could enhance resiliency that is defined as “system recovery from additional disruptions” by incorporating time-dependent factors and uncertainties, allowing infrastructure operators to anticipate evolving threats and vulnerabilities over an asset’s service life, thus improving preparedness and adaptability ( 12 ). Moreover, by quantifying risks with probabilistic metrics, the framework supports targeted interventions and recovery strategies, enabling efficient resource allocation to strengthen the system’s ability to recover quickly from disruptions. The resulting framework should enable network operators to understand network behavior better, identify critical nodes, and develop targeted strategies to improve network reliability and resilience, leading to more efficient and effective use of resources and more comprehensive risk mitigation strategies. The findings of this research can be useful for policymakers, infrastructure operators, and other stakeholders involved in critical infrastructure planning and risk management.
Methods
This study employs a comprehensive approach to evaluate and enhance the RAMCAP methodology, focusing on its application within the transportation sector. The research began with a thorough review of the existing RAMCAP process to identify its limitations, particularly in addressing the complexities of infrastructure risk. Recognizing these shortcomings, an updated probabilistic RAMCAP framework was proposed, designed to incorporate probabilistic factors for a more nuanced risk assessment.
To validate the effectiveness of both the current and updated RAMCAP methodologies, this study has applied these frameworks to a selected case study area comprising two road segments in Camden City, New Jersey. This location was chosen based on the availability of relevant data. Before applying the RAMCAP methodologies to the case study, the process was first tested in a benchmarking area, the U.S. Virgin Islands (USVI). This region was selected to match a previously completed research study and to verify the analysis performed in that study, thereby ensuring the reliability of the results ( 8 ). Both the current and updated RAMCAP processes were coded in Python to facilitate precise calculations and enhance the reproducibility of results. Following this preliminary work, the updated probabilistic RAMCAP was applied to the case study area, and the results were compared with those obtained from the current RAMCAP framework. This comparative analysis provided a basis for developing recommendations aimed at improving the resilience of transportation infrastructure. The detailed methodologies for both the current and updated RAMCAP frameworks are outlined in the subsequent subsections, providing a clear and structured overview of the research approach.
Existing RAMCAP Approach
The seven steps of the RAMCAP Plus process were applied to experiment with a replicable approach for performing flooding risk and resilience analysis on transportation networks. Figure 1 shows the RAMCAP Plus process steps.
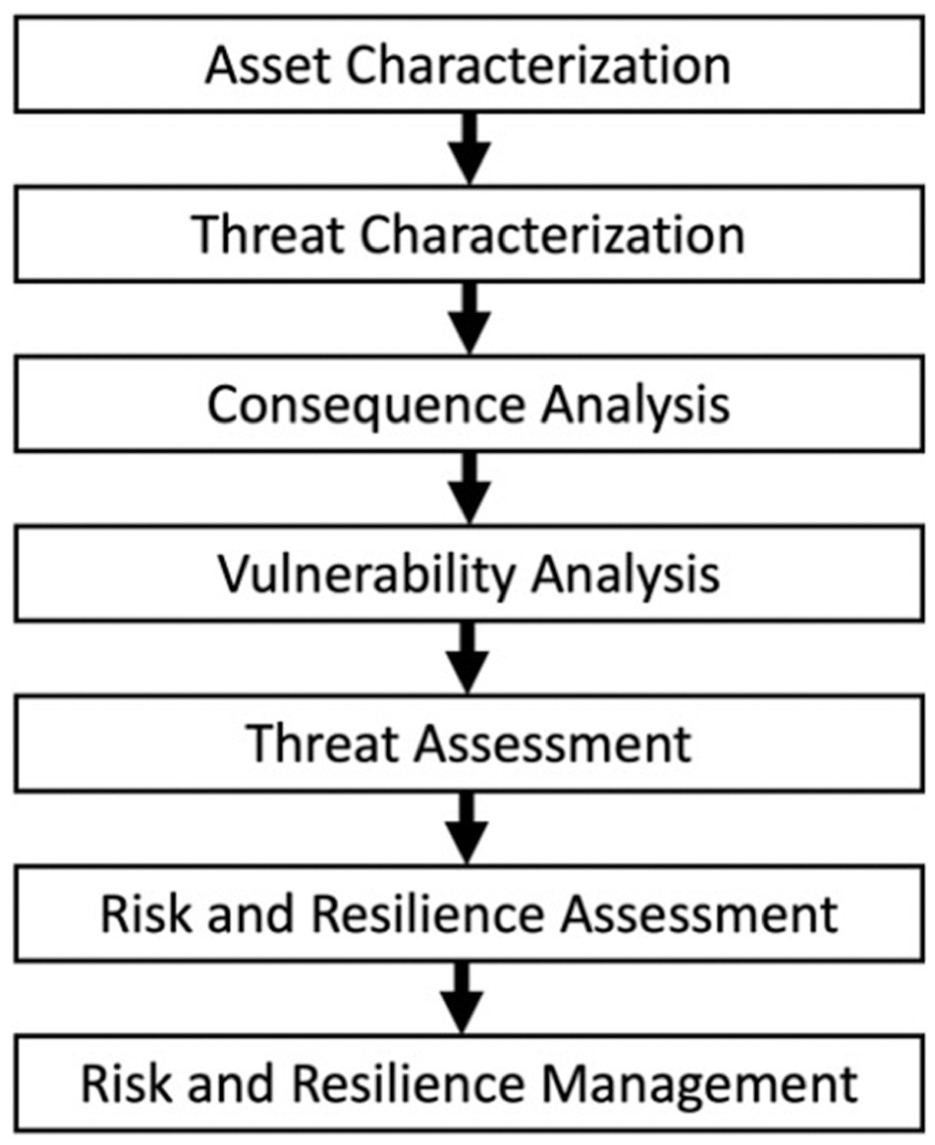
Risk Analysis and Management for Critical Asset Protection (RAMCAP) Plus process steps.
The RAMCAP Plus process steps are designed for assessing and managing risks to critical infrastructure, such as road networks. The process begins with defining and selecting assets, where key assets and systems are identified based on their significance and potential impact on public safety and the economy. The second step involves threat identification, where various threats, both natural and manufactured, are recognized and evaluated; this study considers the natural threat of flooding. The third step is to identify and assess the vulnerabilities of these assets, considering factors such as design, location, and operational characteristics. The fourth step is consequence analysis, where the potential impacts of the threat or failures are examined, including economic, environmental, and public health consequences. The fifth step involves threat assessment, which evaluates the likelihood of different threats materializing. The sixth step is to integrate these elements into a risk assessment, combining threat, vulnerability, and consequence analysis to determine overall risk levels. Finally, the seventh step is the application of risk management strategies, involving the prioritization and implementation of protective measures to mitigate identified risks. This comprehensive process provides a systematic approach to safeguarding critical infrastructure, integrating a range of factors to ensure thorough risk management. However, it is a broad framework that requires significant adaptation for application depending on the actual hazard and assets in question, ensuring flexibility for varying uses.
Existing research involves studies that adopted specific case studies and performed the analysis based on the associated characteristics of the adopted study area, such as the study conducted by CDOT, titled “I-70 Corridor Risk and Resilience Pilot.” The CDOT study adopted the RAMCAP Plus process to provide a proactive risk and resilience analysis approach for significant flood and rock fall events on Interstate 70 ( 8 , 13 ). This pilot project demonstrated that RAMCAP could be adapted to assess infrastructure vulnerabilities and inform mitigation strategies tailored to specific regional hazards. Following the severe impacts of the 2013 Colorado flood event, CDOT utilized the RAMCAP Plus framework to evaluate the risks posed by natural-hazard-induced disasters to critical highway assets along the I-70 corridor. The analysis identified priority areas for intervention by combining threat likelihood, asset vulnerability, and the potential consequences of asset failures. In addition, actionable recommendations were developed in that study. These recommendations included identifying cost-effective mitigation strategies, such as slope stabilization to address rockfall risks and flood-proofing for vulnerable sections of the highway ( 14 ). The “I-70 Corridor Risk and Resilience Pilot” underscores the practical applicability of RAMCAP for real-world infrastructure challenges, demonstrating how the framework can be adapted to improve decision-making in transportation network management. Moreover, the pilot project provides a strong counterargument to claims that RAMCAP is primarily an academic framework with limited utility for real-world practices, showcasing its capacity to address tangible infrastructure challenges effectively and highlighting the importance of its improvement.
Development of Probabilistic RAMCAP
The current RAMCAP methodology, while robust in its approach to risk assessment, faces limitations in its treatment of long-term infrastructure risks. Specifically, it does not account for the dynamic nature of risk over an asset’s service life, particularly in relation to cost fluctuations and the probability of hazard events occurring over time. This limitation prompts the need for a modification that incorporates a more nuanced, time-sensitive approach to risk calculation.
The proposed modification introduces a probabilistic and time-sensitive dimension to the RAMCAP methodology, emphasizing the uniform assessment of costs over the service life of infrastructure and the incorporation of inflation and event probability factors. The theoretical foundation of this approach rests on the premise that risk, and consequently the cost associated with it, evolves over time because of factors such as inflation and the changing likelihood of hazard events. By updating the cost assessment to include an annual inflation rate and applying a probabilistic framework that considers the varying probability of observations within predefined time intervals (e.g., every 10 years over a 100-year service life), we aim to provide a more accurate representation of risk. This modification significantly expands the scope of RAMCAP by enabling risk calculation as a function of both time and the probability of different risk events. It utilizes the formula in Equation 1 to adjust the initial cost for inflation over time (n years) and introduces a probabilistic update to risk calculation, represented by Equations 2 and 3, which calculates the total risk over the asset’s service life:

where
t = time interval,
n = number of years,
i = 3% inflation rate, and
C I = initial cost.

where
N interval = time interval,
(Risk|Di)= probability of risk given a specific disaster event (D i ), and
P (D i ) = probability of disaster occurrence.
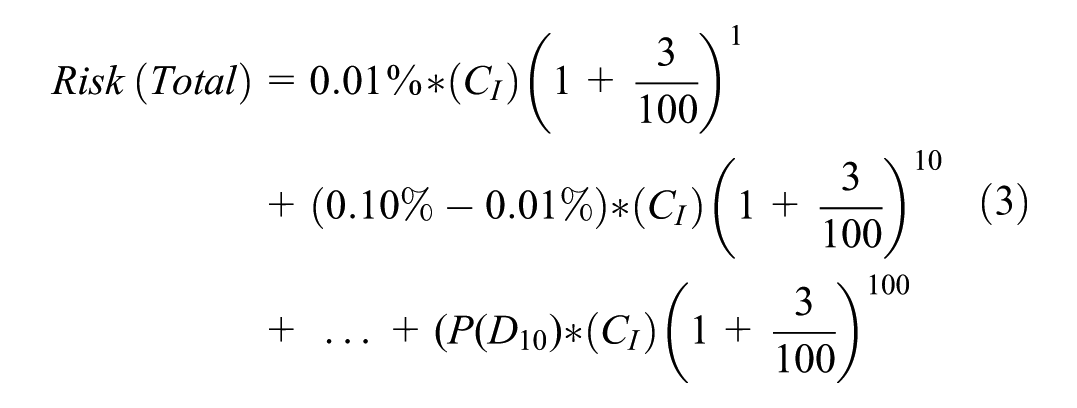
where
P (D i ) = probability of disaster occurrence (0.10%–0.01% in Equation 3), and
C I = initial cost.
Equations 2 and 3 aggregate the risk over different intervals, considering the specific probability of disaster occurrence and its impact on cost. Demonstrating exceedance probabilities over time for specified return periods, one would begin by selecting a range of return periods relevant to the analysis. For each selected return period, the corresponding annual exceedance probability (AEP) is calculated by taking the reciprocal of the return period. This probability reflects the likelihood of an event occurring within any given year.
The concept of a “100-year flood” emerged in the 1960s to denote a flood event with a 1% chance of occurring or being surpassed in any given year; that is, AEP, p = 1%, 0.01, or 1/100. The reciprocal of AEP is the return period or recurrence interval (

Considering the exceedance probability for an event of a certain intensity over a period of


where
N = the duration in years,
Q[N] y = the non-exceedance probability over N years,
q = the annual non-exceedance probability,
p = the AEP, and
T = the return period in years.
The probabilities of exceedance, P[N] y , and non-exceedance, Q[N] y , for the same N -year period is complementary, summing to 1, akin to p and q over 1 year. Thus, P[N] y = 1 −Q[N] y .


The chart in Figure 2 illustrates the exceedance probabilities for various annual exceedance probabilities over various periods. The right-hand side of Figure 2, derived from the flood hazard probability analysis by Osetinsky-Tzidaki and Fredj, provides a visual tool for comprehending the increasing likelihood of a hazard event throughout an asset’s useful life ( 15 ). This underscores the importance of incorporating a probabilistic approach into the RAMCAP methodology. Each curve depicted corresponds to a distinct return period, emphasizing the need for periodic risk assessments in managing infrastructure to account for the variability and criticality of these assessments. Each return period is associated with a specific intensity level, referred to as a “return level” or “return value”—generally, the greater the event’s intensity, the longer its return period.
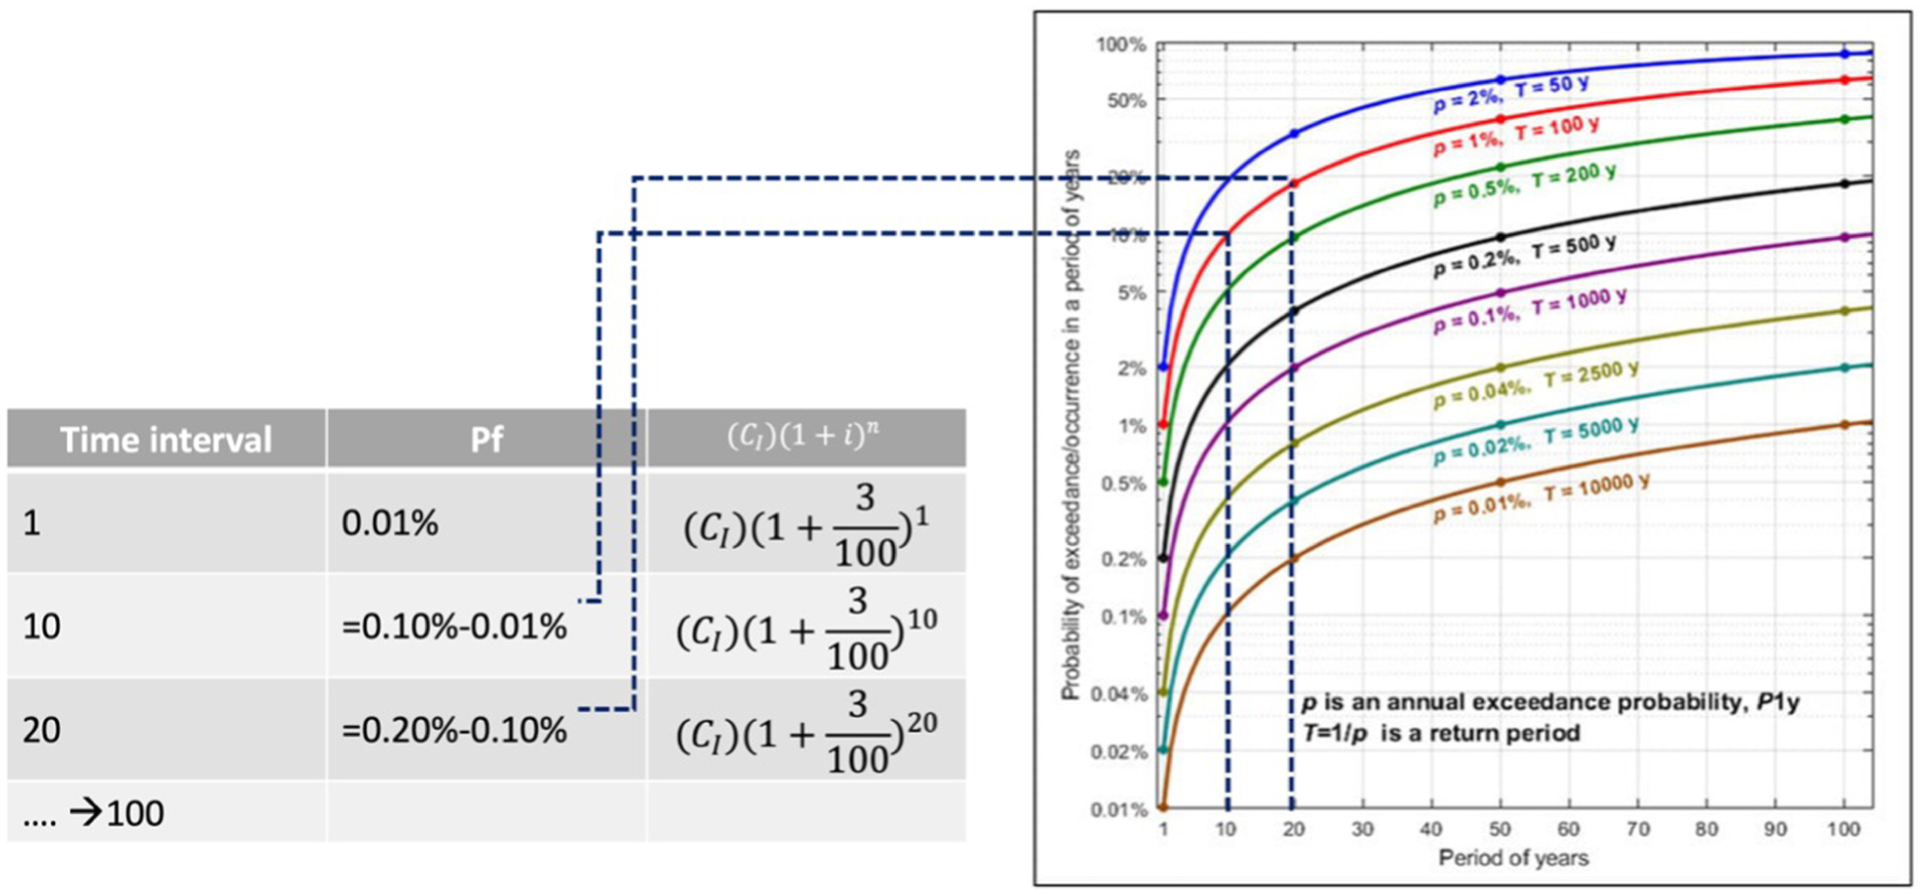
Probability of exceedance curves over time.
After determining the annual probabilities, the focus shifts to computing the probability that an event will exceed a certain threshold at least once over a span of N years. This is achieved by using a formula that accounts for the independence of yearly events, deducting the compounded non-exceedance probability from one. For clear interpretation, the probability exceedance graph allows one to ascertain the probability of an event’s occurrence over any period of N years for the various return periods. By selecting a point along the curve that corresponds to a specific return period, the exceedance probability for that period can be identified. This approach aligns with established practices for risk assessment and is adaptable to different types of events and studies concerning environmental and engineering risks. This approach not only addresses the limitations of the current methodology by factoring in temporal changes in risk and cost but also enhances the precision and relevance of risk assessments for long-term infrastructure planning and management. This concept of the proposed probabilistic approach can be extended for different natural disruptions using a more corresponding probability model.
Integration of Probabilistic RAMCAP into the Developed Computational Model
To update the existing risk analysis code with a probabilistic method, we introduced a comprehensive approach that assesses the total risk over the infrastructure’s service life, factoring in inflation and the likelihood of disaster events at specified intervals. This modification involved implementing a new function designed to estimate the cost of risk at future points in time by applying a 3% annual inflation rate to the initial risk costs, reflecting the increasing value of money over time. The risk calculation process was also refined to accumulate risk over the asset’s service life by considering the probability of disaster occurrences at predefined intervals. With these adjustments, the code now evaluates both the annual user and owner risks with a forward-looking perspective, accounting for economic changes and the probabilistic nature of risks, thereby providing a more nuanced and realistic assessment of long-term vulnerabilities and financial implications. This enhancement aligns the risk analysis more closely with real-world conditions, offering a dynamic framework for understanding and preparing for future uncertainties.
Results and Discussion
Application of Current RAMCAP on the Benchmarking Area: USVI
This step was informed by the research titled “Risk and Resilience Analysis Tool for Infrastructure Asset Management” ( 8 ). This earlier work provided a critical benchmark for this study, specifically in the application and findings related to risk and resilience assessment in infrastructure management. Building on this foundation, USVI was selected as the benchmark area, mirroring its use in Bai et al.’s study ( 8 ). This strategic choice allowed for establishing a direct comparison with the outcomes of the conventional RAMCAP as applied in this earlier study. Aligning the benchmark area with that used in the referenced research aims to validate the accuracy and functionality of the Python code developed for running the risk and resilience analysis. This method ensures that the analysis is grounded in a proven framework. This section exclusively focuses on the application of the conventional RAMCAP methodology in USVI, which is a fundamental step to set the baseline against which we can later compare the outcomes of the modified, probabilistic RAMCAP.
The current RAMCAP Plus process offers a structured approach, encompassing six steps, starting from asset characterization and ending with risk and resilience assessment and management. Table 1 unfolds these steps with respect to the analyzed two segments (Route 30 and Route 32, St. Thomas) in USVI.
Risk and Resilience Analysis Steps and Application Based on the Current Risk Analysis and Management for Critical Asset Protection (RAMCAP) Approach (all the data was inventoried from an existing research study) ( 8 ).
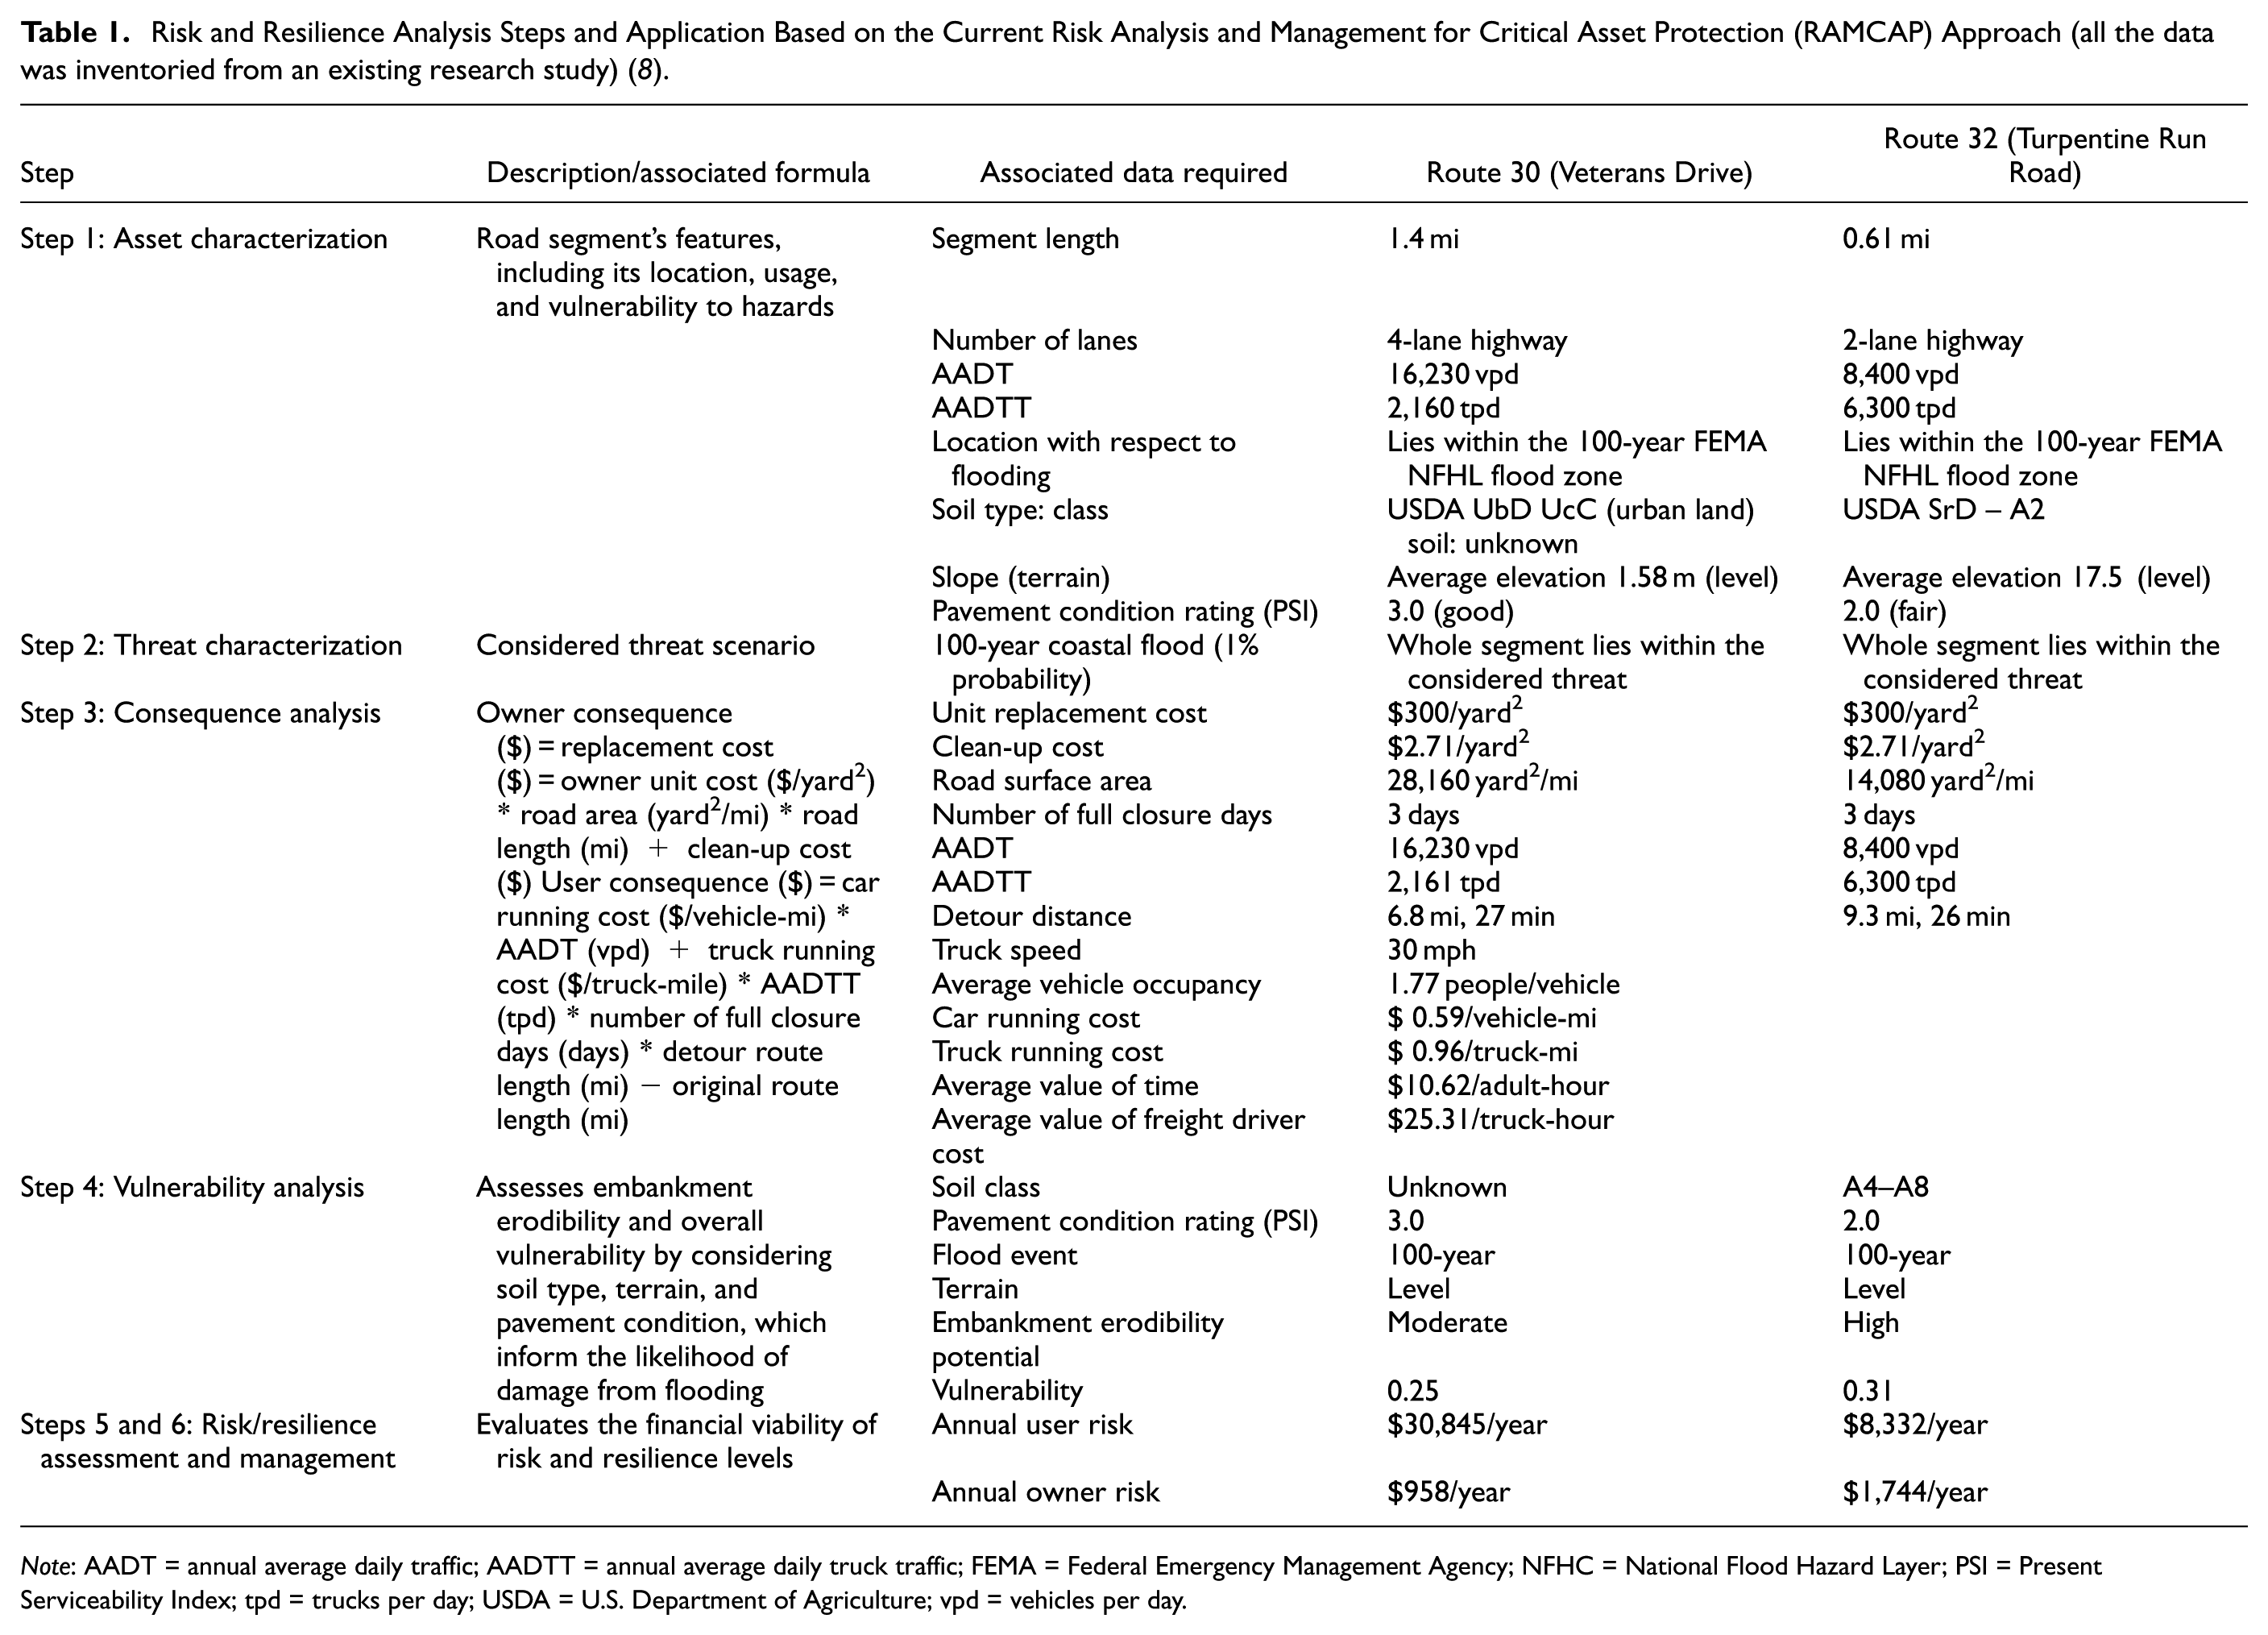
Note: AADT = annual average daily traffic; AADTT = annual average daily truck traffic; FEMA = Federal Emergency Management Agency; NFHC = National Flood Hazard Layer; PSI = Present Serviceability Index; tpd = trucks per day; USDA = U.S. Department of Agriculture; vpd = vehicles per day.
Risk Analysis Based on the Current and Probabilistic RAMCAP: Case Study in Camden City, NJ
In this section, both the current and the updated RAMCAP “probabilistic RAMCAP” were applied to a selected case study in Camden City, New Jersey, showcasing the practical application of the enhanced methodology. Three segments of two major roads within Camden City were selected as focal points for this analysis, guided by a thorough data collection process. Selected road segments were meticulously chosen for their relevance (proximity to water bodies) and the availability of comprehensive data aligning with the prerequisites of the current and probabilistic RAMCAP approach. The criteria for data requisition were systematically derived from the parameters outlined in the RAMCAP methodology, as detailed in Table 1. Subsequently, utilizing the collected data, the risk analysis was performed based on the refined probabilistic RAMCAP framework, ensuring a rigorous evaluation of the identified road segments.
Data Acquisition
In Camden City, three segments from two of the core roads were selected to perform the risk analysis. Two of the selected segments are part of the Interstate route I-676 that connects Camden City and South Jersey with Philadelphia through the Ben Franklin bridge; segment 1 of I-676 stretches from milepost 0 to milepost 1.073, and segment 2 of I-676 stretches from milepost 2.304 to milepost 3.255. The third segment stretches from milepost 0.92 to milepost 1.601 of the arterial roadway US 30. Table 2 below presents the data inventoried for the selected three segments with the associated data sources.
Data Acquisition of Selected Road Segments in Camden City
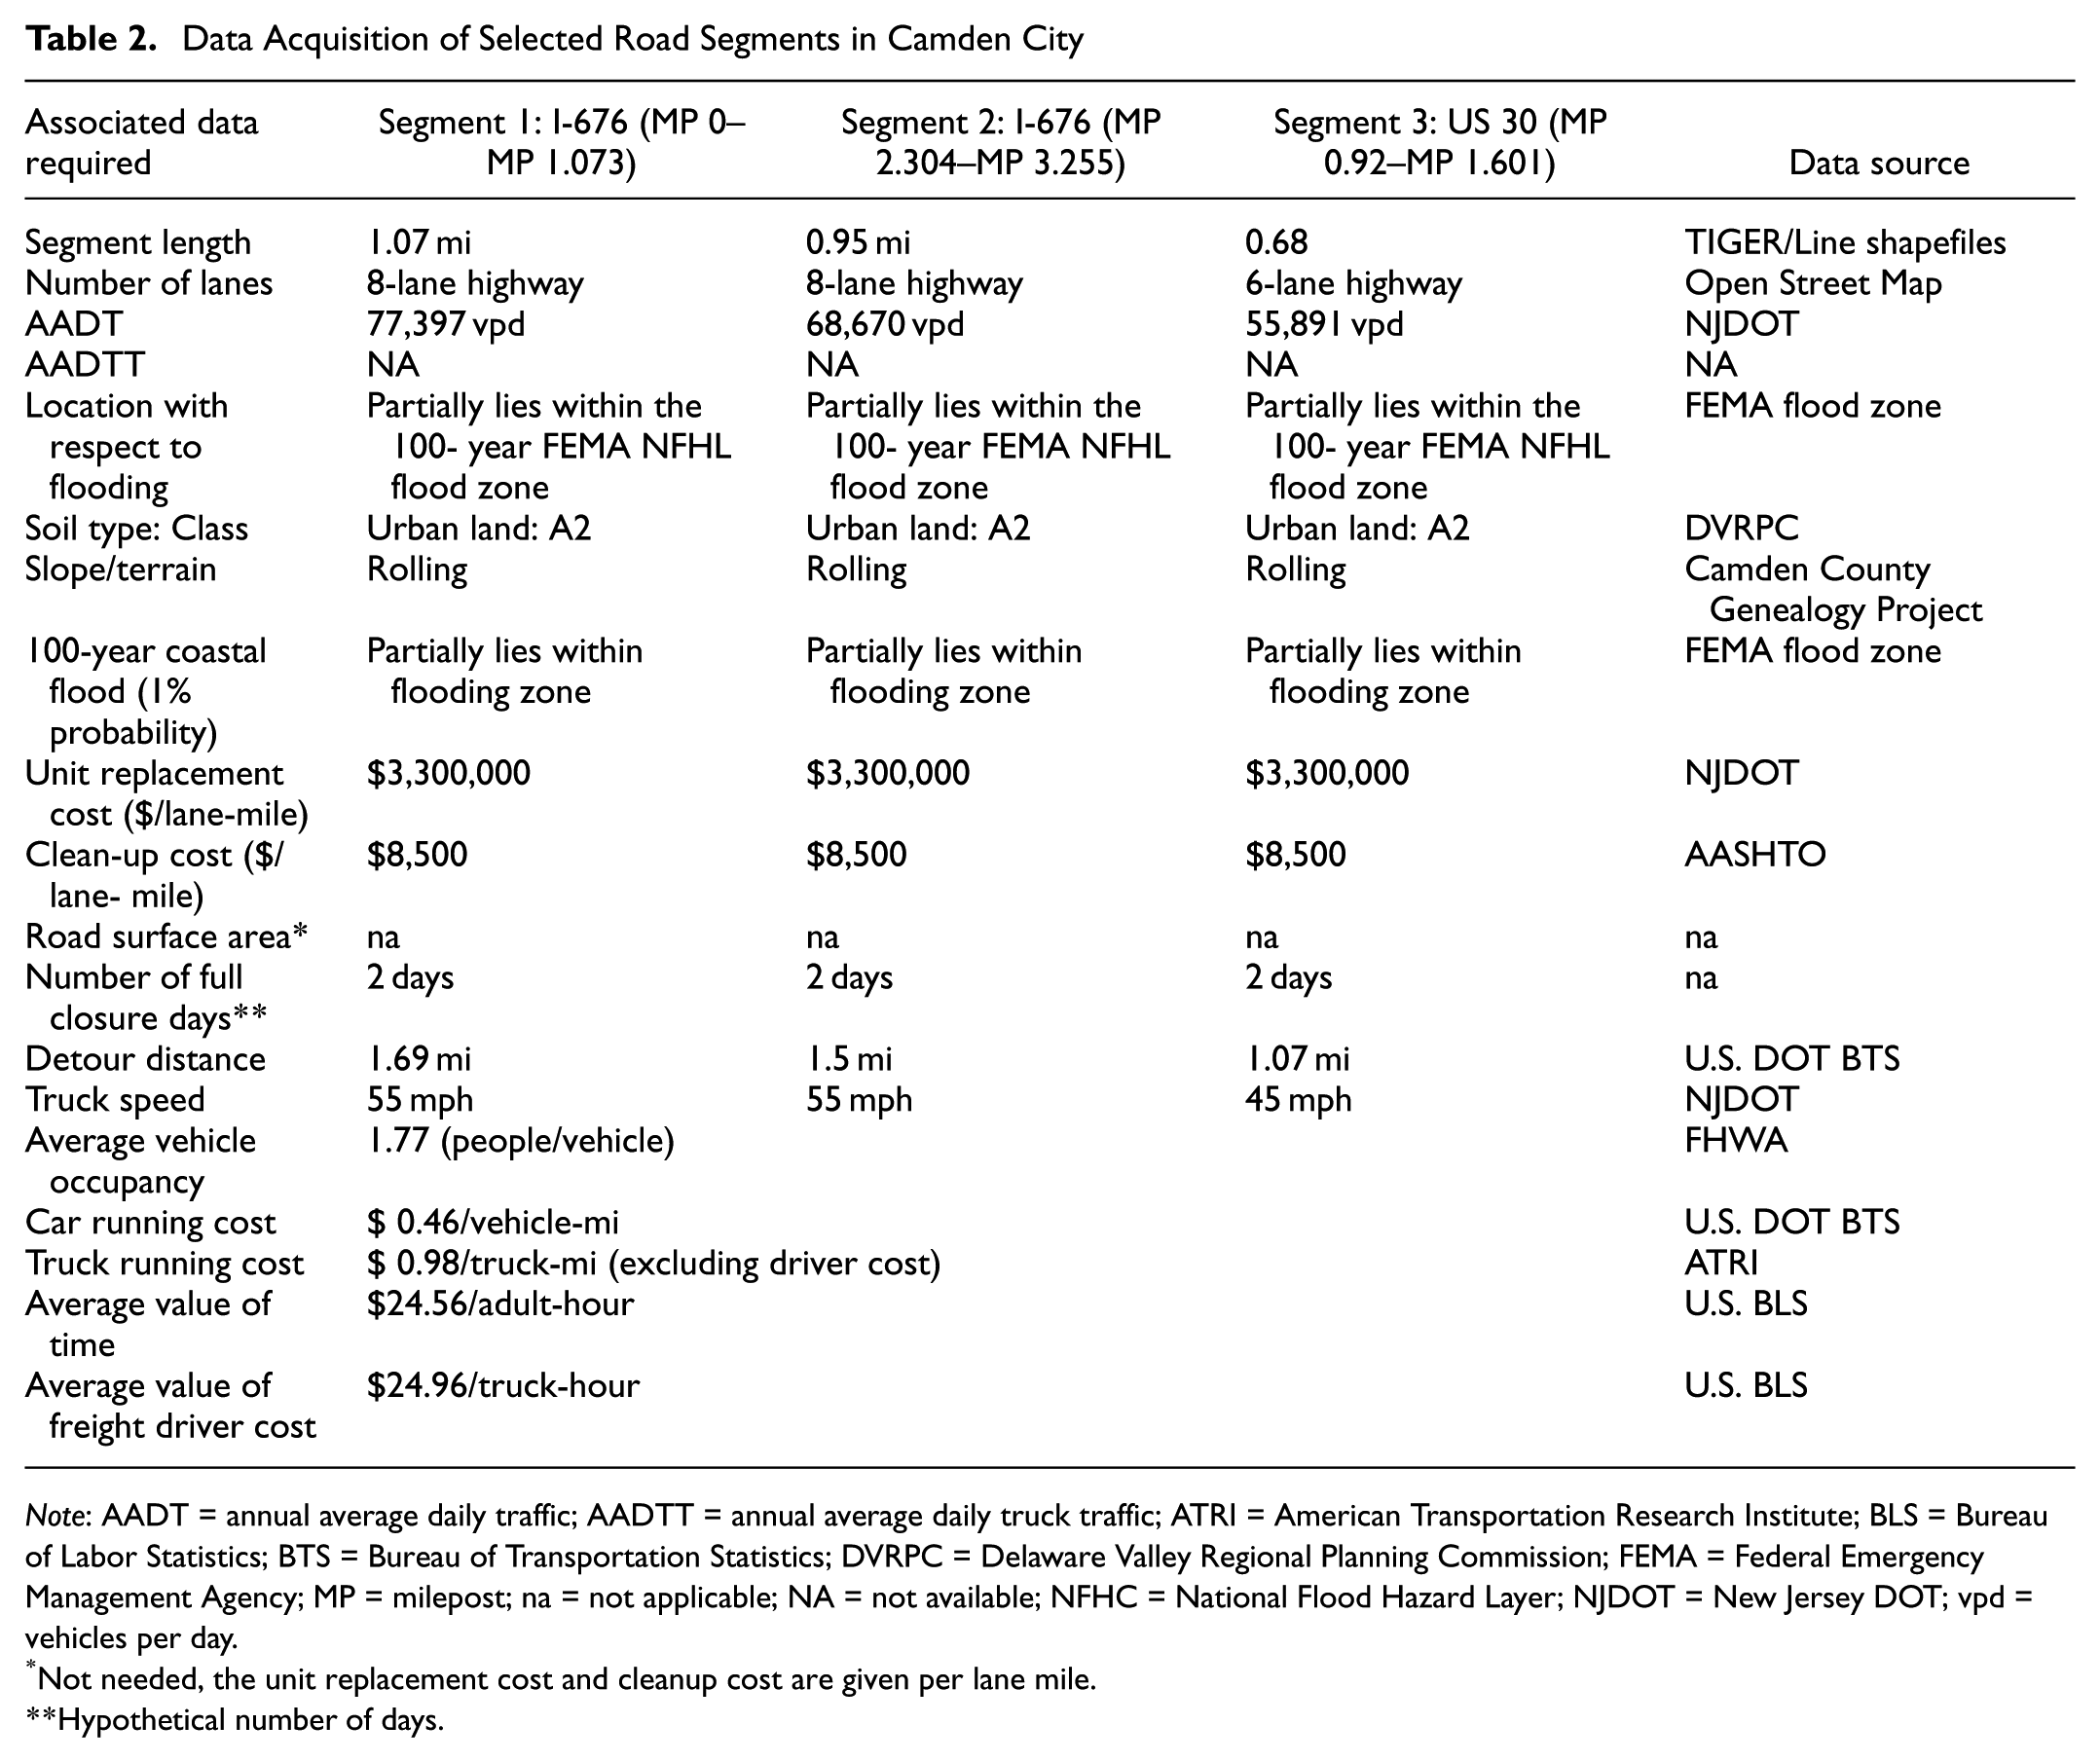
Note: AADT = annual average daily traffic; AADTT = annual average daily truck traffic; ATRI = American Transportation Research Institute; BLS = Bureau of Labor Statistics; BTS = Bureau of Transportation Statistics; DVRPC = Delaware Valley Regional Planning Commission; FEMA = Federal Emergency Management Agency; MP = milepost; na = not applicable; NA = not available; NFHC = National Flood Hazard Layer; NJDOT = New Jersey DOT; vpd = vehicles per day.
Not needed, the unit replacement cost and cleanup cost are given per lane mile.
Hypothetical number of days.
Acknowledging that the conducted data inventory is comprehensive, it nevertheless exhibits certain limitations because of the unavailability of specific data elements. Notably, the absence of annual average daily truck traffic (AADTT) data posed challenges in accurately calculating the user consequence. Detour distances were estimated utilizing a detour multiplier provided by U.S. DOT, given the nature of the selected segments, interstate, and arterial highways, where direct alternative routes are not readily discernible through network analysis in geospatial software, such as ArcGIS Pro. Furthermore, the temporal consistency of the inventoried data elements was compromised as the years of the data varied, introducing potential discrepancies in the analysis. The research team performed sensitivity analysis to address the concern of missing AADTT. Sensitivity analysis is a tool for addressing data uncertainty in research, as it allows for the systematic examination of how variations in uncertain or unavailable input parameters influence the outcomes of a model or analysis. In this study, the authors used a percentage of AADTT out of the total traffic ranging from 7% to 10% of the total annual average daily traffic (AADT). Those percentages were determined based on data derived from the New Jersey weigh-in-motion (WIM) ( 16 ). Data from the years 2019 and 2021 showed an average AADTT of 8.3% from the total traffic in 2019 and 7.9% in 2021. To account for wider range, sensitivity analysis was performed on a percentage ranging from 7% to 10%. This process helps to quantify how changes in the assumed truck traffic percentages affect the estimated annual user risk based on the proposed probabilistic approach. These limitations, particularly the absence of consistent AADTT and time-aligned data, introduce uncertainty into the risk estimation process. While sensitivity analyses helped address this concern, the findings should be interpreted in light of these data constraints.
While efforts were made to collect comprehensive data, some limitations were encountered, most notably, the lack of AADTT and temporal inconsistencies in the data sources. These constraints may introduce uncertainty into the risk calculations, and are further discussed in the next section.
Risk Analysis Results
The conventional and probabilistic RAMCAP approaches were utilized to apply risk analysis on the selected road segments within Camden City. The compiled data in the preceding section, encompassing a variety of critical elements such as traffic volumes and infrastructure characteristics, served as the foundational input for conducting risk analysis. By applying both frameworks to the same case study, the risk of the infrastructure in question was evaluated and the efficacy and outcomes derived from each approach was compared. The conventional RAMCAP provides a baseline assessment, offering a straightforward evaluation of risk based on existing conditions. However, the probabilistic RAMCAP introduces a dynamic layer of analysis, accounting for the variability and uncertainty inherent in future conditions and events. This application is anticipated to demonstrate the practical utility of the probabilistic RAMCAP in addressing the complexities of modern infrastructure systems, particularly in the context of evolving urban challenges. Table 3 presents the risk analysis results of both approaches in the case study area.
Risk Analysis Results Based on Conventional and Probabilistic Risk Analysis and Management for Critical Asset Protection (RAMCAP) in the Case Study
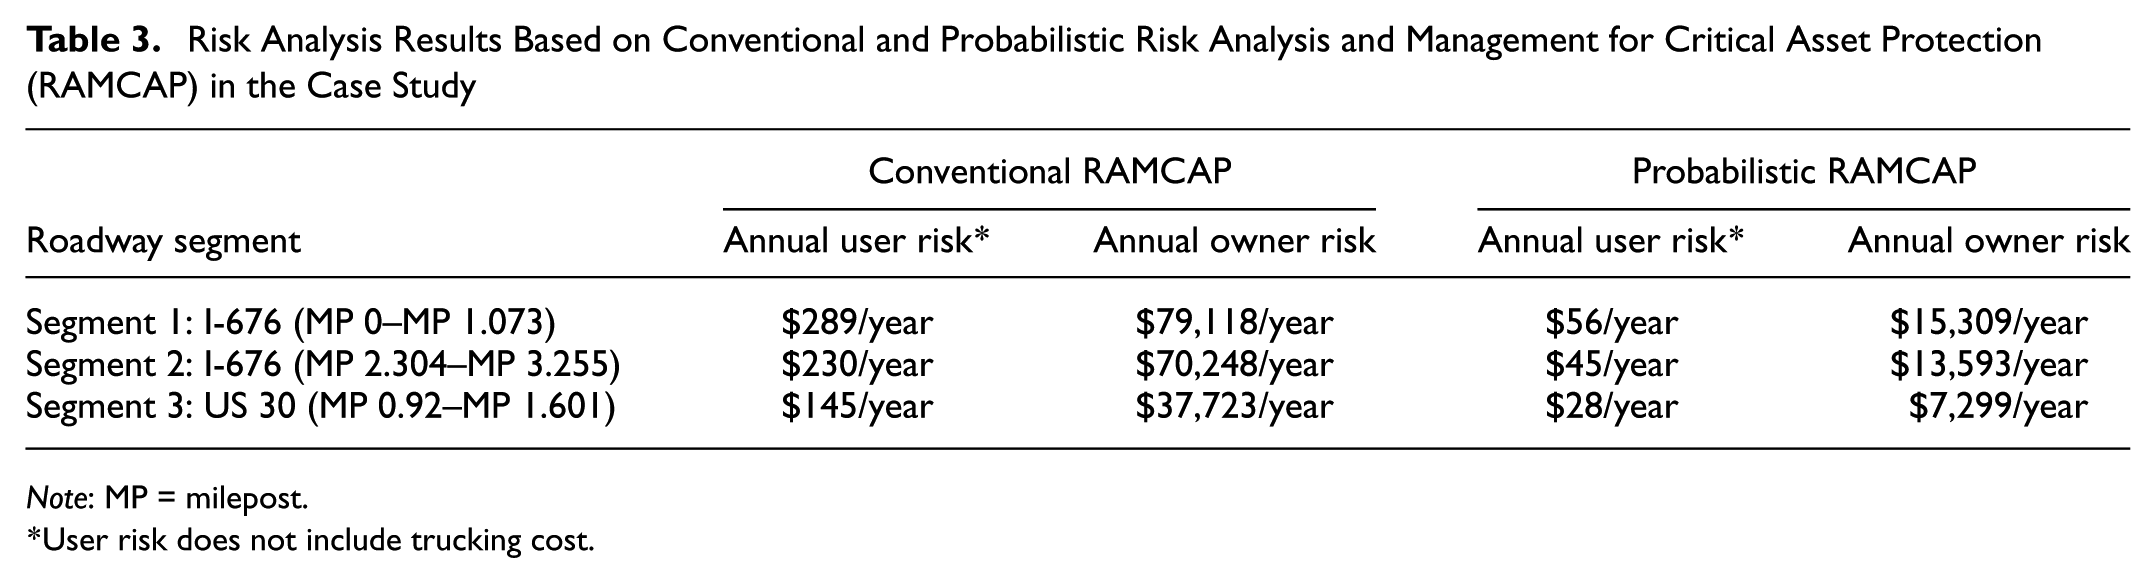
Note: MP = milepost.
*User risk does not include trucking cost.
The results of the risk assessment using conventional and probabilistic RAMCAP approaches highlight significant differences in the estimated annual user and owner risks for the road segments in Camden City. The conventional RAMCAP approach yielded higher risk values, with annual user risks ranging from $145 to $289 and annual owner risks from $37,723 to $79,118. These higher values reflect the deterministic nature of the conventional RAMCAP, which tends to assume worst-case scenarios based on historical data and fixed parameters. This method does not account for the variability and uncertainty in future conditions, potentially leading to an overestimation of risks. In contrast, the probabilistic RAMCAP approach, which incorporates a broader range of potential scenarios and outcomes, resulted in notably lower risk estimates, with annual user risks between $28 and $56 and annual owner risks between $7,299 and $15,309. This approach evaluates risks by considering the likelihood of various events, including rare but high-impact occurrences and more frequent, less severe incidents. By assigning probabilities to different scenarios, the probabilistic RAMCAP provides a more nuanced understanding of the actual risk landscape, offering a realistic assessment that considers both the frequency and severity of potential events. The significantly lower risk estimates in the probabilistic model suggest that the conventional approach may not accurately reflect the true risk profile, potentially leading to an over-allocation of resources for risk mitigation.
The disparity between conventional and probabilistic risk values stems from fundamental methodological differences. The conventional RAMCAP assumes deterministic, often worst-case, scenarios based on static conditions and fixed inputs. In contrast, the probabilistic RAMCAP integrates uncertainties, temporal dynamics, and likelihoods of occurrence, which results in more nuanced, and often lower, risk estimates. This difference underscores the importance of incorporating probabilistic modeling in infrastructure risk assessments to better reflect actual risk distributions and improve resource allocation efficiency.
While the probabilistic RAMCAP approach offers significant advantages over traditional deterministic methods, it also has potential limitations. The approach requires extensive and high-quality data, which can be difficult to obtain and may lead to inaccuracies if the data is inadequate or poor in quality. There is also inherent uncertainty in estimating probabilities, especially for rare or unprecedented events, which can affect the reliability of the risk assessment. Additionally, probabilistic models can be sensitive to the assumptions and parameters used, potentially leading to varied outcomes based on small input changes. This complexity can pose challenges in interpretation and decision-making, requiring additional training for effective use. Lastly, there is a risk of over-reliance on quantitative data, potentially overlooking important qualitative factors. Addressing these challenges requires a balanced approach, incorporating qualitative assessments, sensitivity analyses, and stakeholder engagement to enhance the robustness and applicability of the risk assessment.
As a part of this study, the authors tried to address some of these uncertainties. Although historical data specific to Camden City was unavailable to compare the perceived results, the probabilistic model aligns with trends observed in similar studies. For instance, White et al. validated probabilistic extensions of RAMCAP in critical infrastructure systems by demonstrating their ability to capture the complex nature of risks across sectors, including transportation and utilities ( 9 ). Similarly, Bai et al. showed that probabilistic methods improve the accuracy of risk assessments by incorporating uncertainties into infrastructure planning ( 8 ). In addition, a sensitivity analysis was performed to account for the missing data of AADTT (Figure 3). To assess the impact of uncertainty in AADTT, different assumptions about the percentage of truck traffic in the total AADT were tested. The authors considered percentages ranging from 7% to 10%. These values were selected to represent a plausible range of truck traffic proportions commonly observed in urban environments. For each scenario, AADTT was estimated by multiplying the total AADT by the assumed percentage of truck traffic. The calculated AADTT values were then used as inputs in the probabilistic RAMCAP approach, and the results were compared across the scenarios.
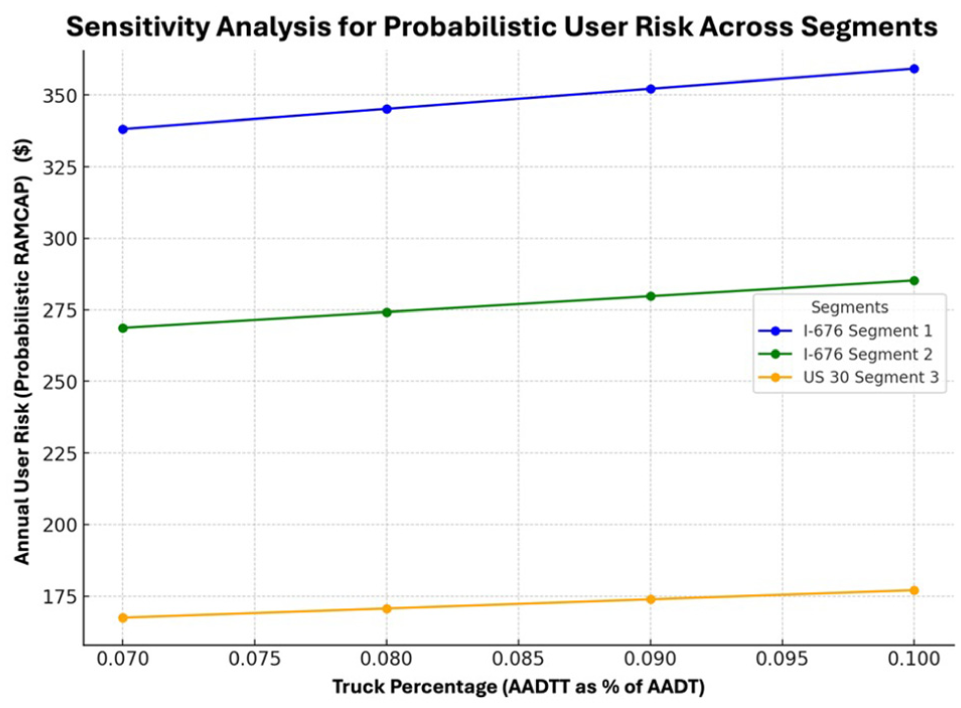
Sensitivity analysis for probabilistic user risk across segments.
The results reveal a clear relationship between truck traffic proportions and risk levels. Higher truck percentages significantly increase annual risks, with probabilistic RAMCAP showing a compounded effect over time because of the inclusion of inflation and dynamic probability factors. This underscores the importance of accurate truck traffic data in risk assessments and highlights the value of probabilistic approaches in capturing long-term risk dynamics. These results emphasize the need for collecting accurate and granular data to refine risk estimates and enhance decision-making for infrastructure resilience.
While the probabilistic RAMCAP framework provides a more dynamic and realistic assessment of infrastructure risk, its effectiveness is inherently tied to the quality and completeness of input data. In this study, several data limitations, such as the unavailability of AADTT for the selected segments, and the reliance on estimated detour distances rather than observed network rerouting, posed constraints on result precision. The absence of granular truck traffic data, for example, required the use of statewide truck percentages and sensitivity ranges (7%–10%) derived from WIM data to approximate freight movement risks. This approximation, while validated by literature-based ranges, inevitably introduces some level of uncertainty into the user risk estimates. Additionally, the temporal inconsistency among data sources (e.g., traffic volumes from different years) may affect the internal coherence of inputs and outputs, particularly in time-sensitive probabilistic modeling.
These limitations suggest that the presented risk values, particularly for user-related consequences, should be interpreted as indicative rather than definitive. Nevertheless, the observed patterns across the different scenarios and segments remain instructive. The relative differences between segments and between the conventional and probabilistic approaches are consistent and meaningful, offering insights into how different assumptions affect the magnitude of estimated risks. Moreover, the probabilistic approach’s responsiveness to input variability, as shown through sensitivity analysis, demonstrates its strength in revealing how changes in uncertain parameters influence long-term risk outcomes. This quality positions it as a useful tool for infrastructure agencies that often must operate under imperfect data conditions, as it supports scenario-based planning and risk communication.
Conclusions
The comprehensive analysis of conventional and probabilistic RAMCAP methodologies has yielded significant insights into infrastructure risk and resilience assessment. The case study of selected road segments in Camden City, New Jersey, facilitated a deep dive into applying these methodologies, highlighting the critical importance of incorporating probabilistic elements into infrastructure risk assessment to anticipate better and mitigate future vulnerabilities.
The application of the probabilistic RAMCAP, in particular, has underscored the value of integrating dynamic risk factors and the uncertainty of future events into our evaluations. This approach has enhanced our understanding of potential vulnerabilities and allowed for a more nuanced analysis that considers the complexity of infrastructure systems and their interactions with natural and human-caused hazards. Comparing the outcomes of the conventional and probabilistic methodologies demonstrated the probabilistic RAMCAP’s superior capability to capture the multifaceted nature of risk and provide actionable insights for infrastructure resilience.
Based on the findings, several actions could be recommended to improve infrastructure risk management, including: 1) consider adopting the probabilistic risk assessment methodologies by infrastructure stakeholders as a standard practice, which will enable a more comprehensive understanding of risks and better prepare for unforeseen challenges; 2) continuous data collection and analysis to enhance the accuracy of risk assessments—this includes updating data on traffic volumes, structural conditions, and environmental factors, which are crucial for dynamic risk assessment models; 3) the investment into and use of advanced geospatial analysis tools, such as GIS software, should be expanded to facilitate detailed risk analysis, enhancing emergency response strategies and infrastructure planning; 4) engaging a broad range of stakeholders, including local authorities, infrastructure owners, and the public, which could lead to more robust risk management strategies and ensure that the needs and priorities of all parties are addressed; and 5) findings from probabilistic risk assessments should be integrated into urban planning and policy-making processes to ensure that infrastructure development and retrofitting efforts are aligned with risk management objectives, leading to more resilient urban environments.
To further validate the probabilistic RAMCAP approach, future work should focus on incorporating historical data and engaging stakeholders. Historical incident data, such as flood risks, traffic disruptions, and infrastructure damage costs, can be used to compare model predictions with observed outcomes, providing a quantitative basis for assessing accuracy. Stakeholder involvement, including input from infrastructure operators, emergency planners, and transportation agencies, would offer valuable insights into the practical applicability of the model. Workshops and consultations could refine probabilistic parameters, such as the likelihood of rare events, and ensure that the scenarios reflect local realities. These efforts will strengthen the framework’s reliability and applicability, enhancing its capacity to guide risk mitigation strategies and infrastructure planning.
Beyond flooding, the proposed probabilistic RAMCAP framework is adaptable to other hazard types by modifying the threat likelihood inputs and consequence modeling parameters. For instance, seismic risk can be modeled using ground motion exceedance probabilities and retrofit cost estimates, while cyber threats could incorporate downtime probabilities and recovery costs over time. By adjusting the hazard-specific probability curves and consequence parameters, the probabilistic framework can serve as a versatile tool for assessing diverse risks to critical infrastructure systems.
In conclusion, the insights gained from this study highlight the imperative to evolve our approach to infrastructure risk assessment and management. By embracing probabilistic methodologies and fostering a culture of continuous improvement and collaboration, the resilience of infrastructure systems could significantly be enhanced against the myriad challenges of the future.
Footnotes
Author Contributions
The authors confirm contribution to the paper as follows: study conception and design: R. Alfaris, S. Ghasemi, M. Jalayer; data collection: R. Alfaris; analysis and interpretation of results: R. Alfaris, S. Ghasemi; draft manuscript preparation: R. Alfaris, S. Ghasemi, M. Jalayer. All authors reviewed the results and approved the final version of the manuscript.
Declaration of Conflicting Interests
The authors declared the following potential conflicts of interest with respect to the research, authorship, and/or publication of this article: S. Hooman Ghasemi and Mohammad Jalayer are members of Transportation Research Record’s Editorial Board. All other authors declared no potential conflicts of interest with respect to the research, authorship, and/or publication of this article.
Funding
The authors disclosed receipt of the following financial support for the research, authorship, and/or publication of this article: This publication was supported by a subaward from Rutgers University, Center for Advanced Infrastructure and Transportation (Grant No. 69A3551847102) from the U.S. Department of Transportation, Office of the Assistant Secretary for Research and Technology (OST-R).