
Abstract
The aim of this research is to examine the impact of a newly established metro station on travel behavior and physical activity in Tehran, Iran. Data were collected from a convenience sample of 1403 metro users through a structured questionnaire, and a paired-sample t-test was utilized to compare commuting patterns before and after the station's implementation. The findings revealed a significant decline in the use of cars and buses for commuting to the metro station, accompanied by a notable increase in walking. Specifically, car usage halved, while the percentage of individuals walking rose dramatically from 7.1% to 55.5%. The study further indicated that the new metro station had a more substantial effect on reducing private car usage for leisure and educational trips than for work-related journeys. Remarkably, 46% of those utilizing the metro station achieved the World Health Organization's recommended levels of physical activity through walking during their commutes. In addition, the analysis showed that certain demographics—including the elderly, women, and individuals with lower educational attainment—exhibited higher average weekly walking times. The data also suggested that individuals living closer to the metro station tended to use it more frequently. With respect to body mass index, older travelers, those with higher education levels, women compared to men, and individuals who relied on buses rather than personal vehicles were less likely to be classified as obese or overweight. Some implications were outlined for policymakers and urban planners, along with limitations and directions for future studies.
For many people, the most accessible forms of physical activity are those integrated into everyday routines—for instance, walking or cycling as alternatives to motorized transport for commuting to work, school, or other daily trips ( 1 ). Understanding how new transportation infrastructure shapes travel behavior is therefore essential for designing effective transportation policies and planning strategies. Although studies from the U.S.A., U.K., and China have examined these relationships ( 1 – 4 ), evidence remains limited—particularly in developing countries—on whether such infrastructure reduces car dependency and promotes physical activity. This research gap stems largely from the difficulty of conducting experimental studies and the lack of control over how transportation interventions are planned and implemented. Existing intervention studies exploring the effects of new infrastructure on travel behavior and physical activity can be broadly divided into two categories: those focusing on public transport systems, such as urban rail and bus networks, and those emphasizing active modes of transportation.
The study by Wang et al. ( 2 ) investigates how the introduction of metro services influences transportation choices of auto, taxi, bus, electric bicycle, and bicycle users in Xi'an, China, a city with a poorly integrated transport system. The results indicate that suburban residents are more inclined to switch from cars to the metro for work trips. In addition, female users of taxis and cars are more likely to adopt the metro than their male counterparts. For trips longer than 10 km, both taxi and electric bicycle riders tend to prefer the metro. In addition, the study found that the impact of a single metro corridor on easing traffic congestion is not significant, and suggests the need for parallel policies to be adopted.
The results of a survey with 1770 participants on travel behavior before and after the introduction of a new metro system in Nanchang city showed that people who used to take the bus now use the metro instead, with an average daily metro usage of 30.9 min for work trips and 16.6 min for non-work trips. Walking and cycling times decreased significantly, while car and e-bike usage remained largely unchanged. The study suggests that the new metro did not necessarily lead to an increase in active travel or a reduction in car use ( 3 ). Similarly, the study by He et al. ( 4 ) found that the new metro line had a significant negative effect on older adults' weekly moderate-to-vigorous physical activity, but no significant effect on their walking time. The study also found differences in the effects of the intervention among gender and age subgroups. In addition, the study suggests that physical activity and walking levels may stabilize over time. Overall, the study provides evidence that new metro developments may not promote physical activity and walking levels among older adults in Hong Kong. Furthermore, the study by Huang et al. ( 5 ) investigated the impact of a new light rail transit (LRT) line in Seattle on the walking behavior of residents living within <1 mi of one of the 13 LRT stations. The study found that overall walking decreased after the LRT opened, but there was no significant change in station area walking. However, there was a shift in walking activity toward the station areas. This shift was greater for participants living closer to the LRT station and who were male, college-educated, normal weight, had less access to cars, and frequently used the LRT.
On the other hand, the study by Deng and Zhao ( 6 ) used mobile phone data to construct a four-wave panel of 7799 residents in Shenzhen, China, over 2 years and assess the impact of new metros on travel behavior in catchment areas of 0–1, 1–2, and 2–3 km. The findings indicate that the introduction of metro lines 6 and 8 increased metro trips, total trips, and places visited for residents living within the 0–3 km range, while only increasing total trip frequency and distance for those living within the 0–1 km range. The use of metro mainly replaced bike, e-bike, and bus trips and slowed the growth of car trips. In the same way, the results of the study by Miller et al. ( 7 ), in which participants (n = 536) wore GPS receivers and accelerometers before (2012) and after (2013) LRT construction, showed that the construction of LRT in a neighborhood of Salt Lake City, Utah, U.S.A., directly generated new physical activity that was not shifted from other physycal activity (PA), supporting the public health benefits of new high-quality public transit like LRT. Moreover, the study by MacDonald et al. ( 8 ) aimed to examine the effect of using LRT on changes in body mass index (BMI), obesity, and meeting recommended physical activity levels in Charlotte, NC. The results showed the use of LRT to commute to work was associated with a reduction in BMI and reduced odds of becoming obese over time.
The results of a systematic review of five articles indicated that the construction of new public transit options is linked to a statistically significant increase in light-to-moderate physical activity levels by 1.76 metabolic equivalent of task (MET) hours/week (95% CI = 0.19, 3.32, p = 0.03). This equates to an increase of about 30 min per week in walking and other light-to-moderate physical activities compared to baseline. No significant effect was found for moderate-to-vigorous physical activity ( 9 ). Another article review found that after transit interventions, total physical activity decreased (combined mean: 80.4 min/week, 95% CI: 157.9, −2.9), but transport-related physical activity increased (mean: 6.7 min/week, 95% CI: 10.1, 23.5). This suggests that following new transit infrastructure, total physical activity may decline while transport-related physical activity may increase ( 10 ). Another review study analyzed the impact of changes in the built environment infrastructure on physical activity, active transportation, and sedentary behavior. Nineteen relevant articles were reviewed, and it was found that walking and biking trails had varying effects on physical activity and walking, but positive effects on bicycling. More extensive infrastructure changes had mixed results, with mostly non-significant effects, but those living closer to the changes showed positive effects on bicycling. No studies assessed sedentary behavior ( 11 ).
The study by McCormack et al. ( 12 ) assessed changes in transit use and physical activity after and before a bus rapid transit (BRT) service replaced a traditional bus service in Calgary, Canada, between 2018 and 2019. The study found no significant differences in neighborhood transportation walking or cycling, moderate-to-vigorous intensity physical activity, or perceived relative change in physical activity after 12 months. In addition, the replacement of the traditional bus service with a BRT service did not appear to have an immediate impact on physical activity levels.
The results of a survey with 469 adult commuters living within 30 km of Cambridge, U.K., in 2014 showed that exposure to the Cambridgeshire Guided Busway was associated with a higher likelihood of an increase in weekly cycle commuting time and an increase in overall time spent in active commuting among the least active commuters at baseline. However, there was no evidence of changes in recreational or overall physical activity. The study concluded that the new sustainable transport infrastructure effectively promoted an increase in active commuting, providing support for reconfiguring transport systems as part of public health improvement strategies ( 13 ). Similarly, a study involving 1712 participants from mini-Holland boroughs—an initiative launched in three outer London boroughs (Enfield, Kingston, and Waltham Forest) to create Dutch-style environments more conducive to walking and cycling—compared outcomes with non-mini-Holland boroughs that did not undergo such interventions. The cycling program included measures such as the redesign of town centers, the development of segregated cycle lanes, the introduction of low-traffic neighborhoods, improved pedestrian crossings, and supportive community engagement activities. Results showed that individuals in “high-dose” neighborhoods, where substantial changes were made to the local walking and cycling infrastructure, were 24% more likely to engage in cycling at follow-up compared to those in non-mini-Holland areas. In addition, there was an increase of 41.0 min in active travel time for this group. Positive changes in perceptions of the local environment, particularly related to cycling, were observed in intervention areas, despite some controversy surrounding the interventions ( 14 ).
The study by Song et al. ( 15 ) monitored changes in travel behavior after the implementation of new walking and cycling infrastructure, to examine the shift from private car use to walking and cycling. They tested two types of exposure measures: distance from the infrastructure as a measure of potential usage and actual usage of the infrastructure. Only the latter measure showed a statistically significant association with modal shift, indicating that infrastructure provision alone may not be enough to promote active travel. Along with the use of new infrastructure, factors such as loss of employment, higher education, being male, and being part of the ethnic majority were consistently found to be positively associated with modal shift toward walking and cycling. The findings support the construction of walking and cycling routes, but also suggest that additional efforts may be needed to promote active travel.
In contrast, a cohort study of 470 working adults in Cambridge, U.K., examined the impact of the opening of a guided busway with a path for walking and cycling in 2011. The results indicated that proximity to the busway was linked to a higher likelihood of a significant increase in the share of commute trips involving active travel, as well as a decrease in the proportion of trips made solely by car. However, it did not have an impact on changes in the share of commute trips involving public transport, the number of commute trips, or commute distance ( 16 ). Two years later, Heinen et al. ( 17 ), in another article with the same case study, indicated that there were five distinct patterns of change in commuting behavior, including no change, full modal shift, partial modal shift, non-stable but patterned behavior, and complicated or apparently random patterns. It was found that a minority of participants experienced directed changes of either a full or partial modal shift, while a large proportion showed highly variable patterns. However, no significant associations were found between exposure to the intervention and specific modal shifts or patterns of change.
In Tehran, air pollution is linked to around 6000 deaths per year, resulting in an economic cost of 11 billion U.S. dollars ( 18 ). In addition, physical inactivity has been highlighted as key factor in the high rate of obesity in the city ( 19 ). The city's car-oriented nature is considered a significant contributor to these problems, and investing in public transport is seen as a potential solution to reduce congestion and improve public health. However, the effects of new metro systems on travel behavior and active commuting have not been thoroughly studied, and there is a lack of scientific evidence to support the potential benefits of transit infrastructure modifications. To address this gap, this study aims to fill the existing literature void by presenting the findings of the first study on travel behavior change before and after the introduction of a new metro station (heavy rail transit) in Tehran, Iran. The results of this study can inform future transportation planning and policy decisions in rapidly growing urban areas.
Methodology
Intervention
The intervention was a new Metro station, Meydan-e San'at, that opened in Tehran on March 16, 2019. Meydan-e San'at metro station is located on the northern edge of San'at Square in the Shahrak-e Gharb area of Tehran. It is the current northwestern terminus of Line 7 (Figure 1). We conducted a questionnaire to investigate how this new metro station changed participants’ travel behaviors.
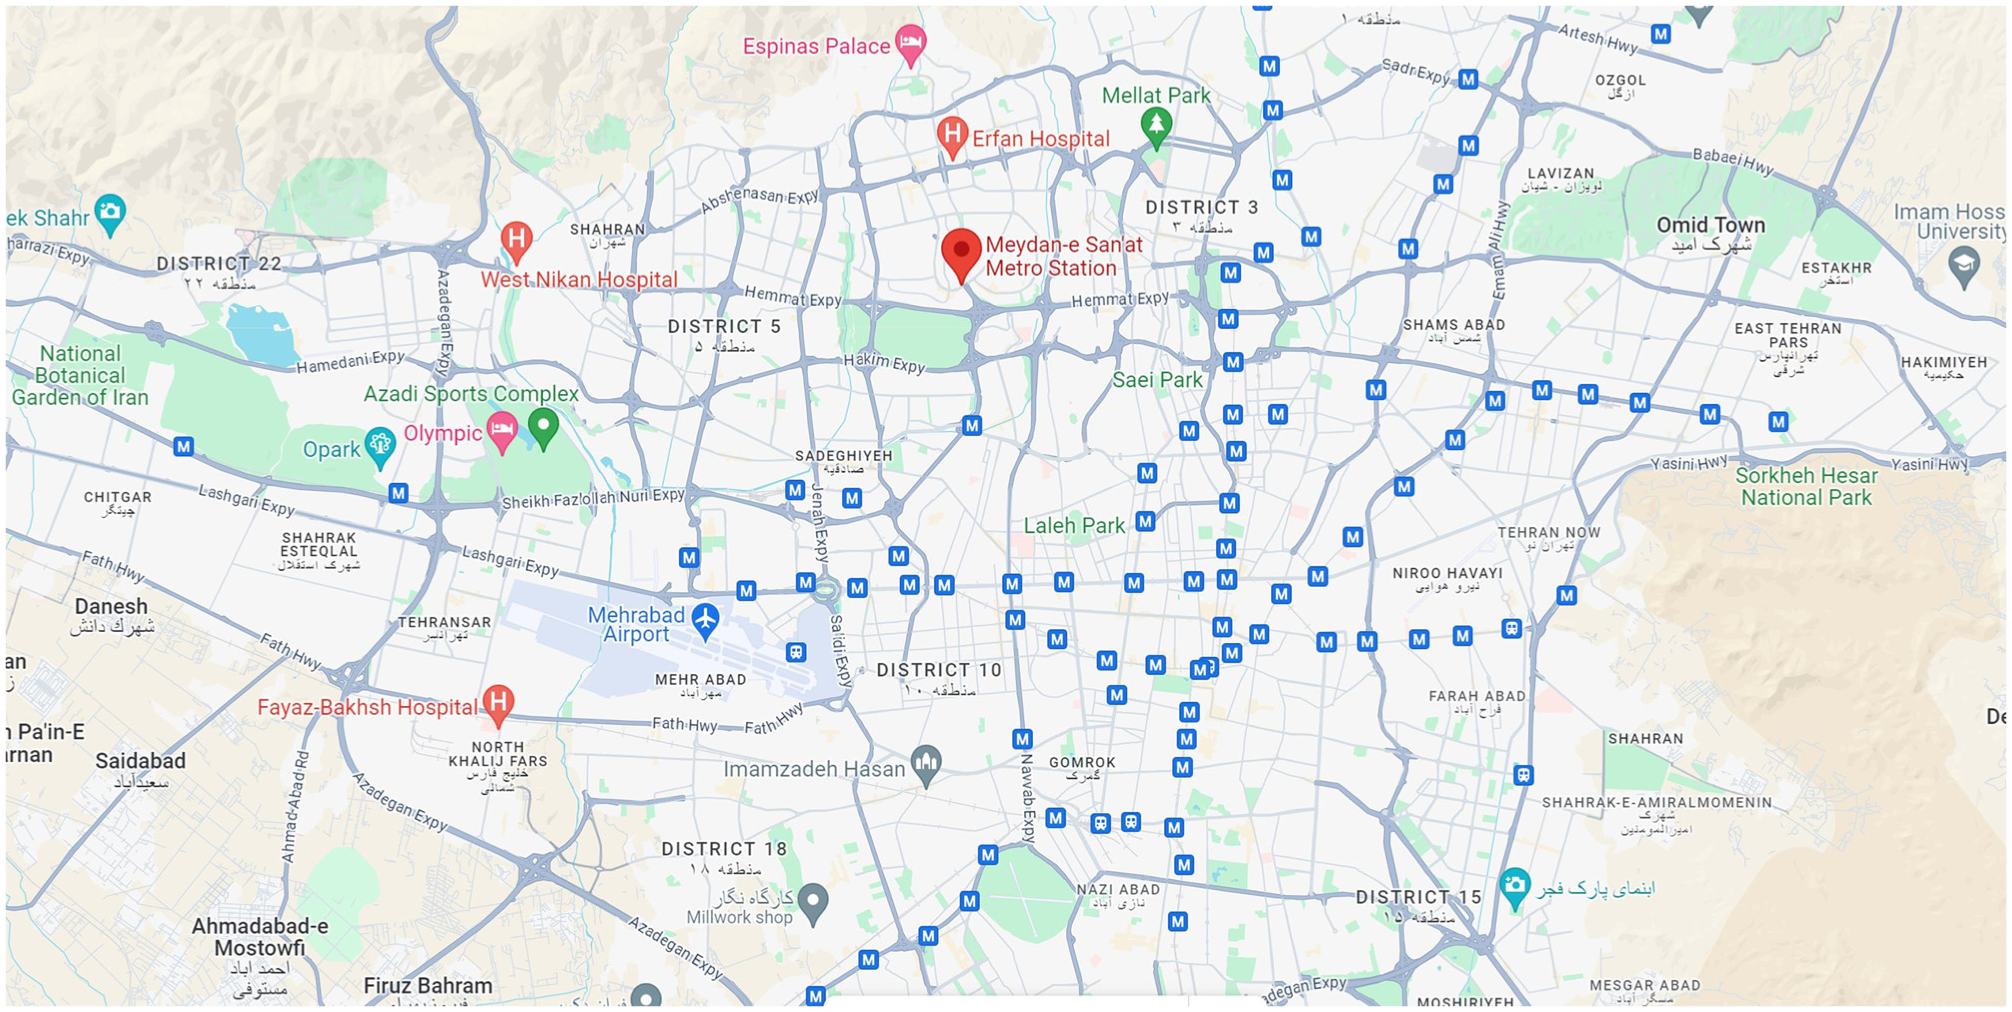
Location of Meydan-e San'at metro station in Tehran.
Tehran is the capital of Iran and the most densely populated city in the country with an urban area of 730 km2 and an urban population of 8.7 million in 2016. The Tehran metro is a rapid transit system and the largest metro system in the Middle East with seven active lines and 156 active stations.
Data Collection
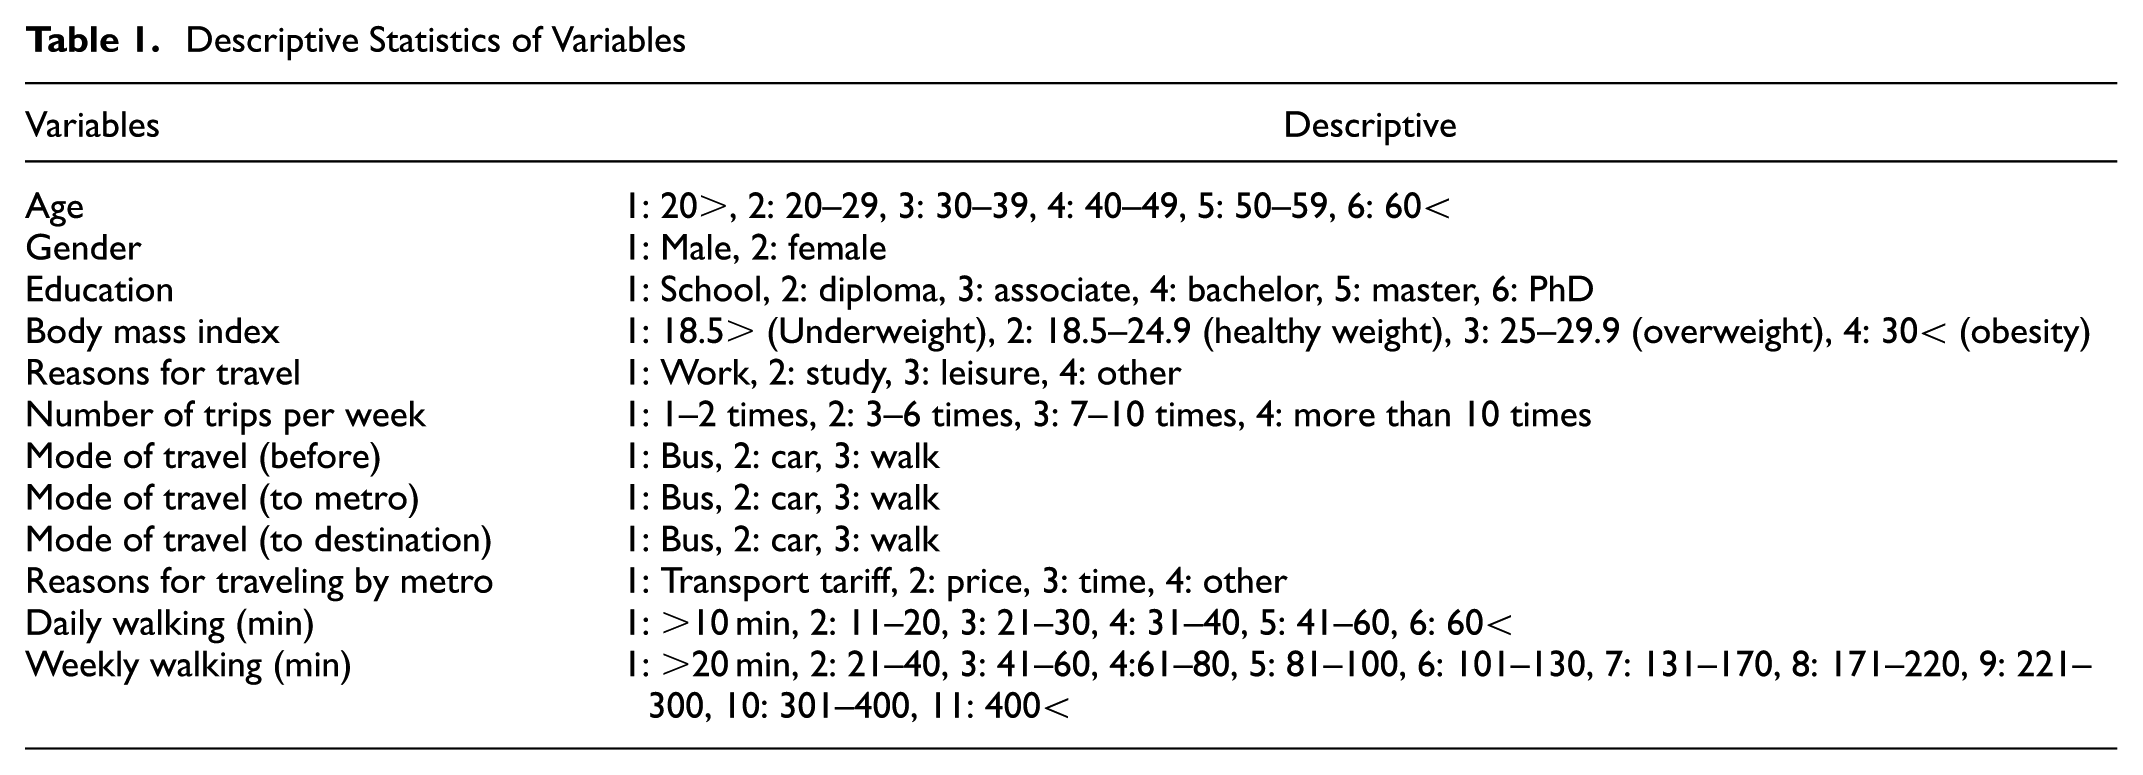
This study employs a cross-sectional analysis. A questionnaire was administered on both weekdays and weekends from July 23 to August 18, 2021, during two time periods: 7–10 a.m. and 5–8 p.m. The purpose of this survey was to gather detailed information about participants' travel behaviors. The questionnaire included six questions about the purpose of travel, the mode of travel before the opening of the metro station, the mode of travel after the opening of the metro station (both from home to the station and from the station to the destination), the reason for choosing the metro as a mode of transport, the frequency of commuting, and the time taken for walking. Furthermore, the participants’ age, weight, height, and level of education were also recorded. The BMI of all participants was calculated using each person's height and weight (see Table 1). The interviewers posed questions verbally to the participants and recorded their responses in an online questionnaire using their mobile devices. The team consisted of one female and one male interviewer. Participants were selected from individuals who expressed interest in entering the new metro station, resulting in a convenience sample of users. No incentives were provided to participants for their involvement. A total of 1403 people responded to the survey, and the number of individuals who refused to participate was low. About 37% of the total participants were male, while 63% were female. The largest age group was individuals aged 20–29, comprising approximately 38.9% of participants, followed by those aged 30–39 at around 25.8%. Participants under 20 and over 60 each represented the smallest share, with about 20% in each category. Most participants held a bachelor's degree (approximately 40.3%) or a master's degree (around 24.7%). School students constituted the smallest group at about 6.05%, followed closely by those who completed school and held a diploma at approximately 6.7%. With respect to BMI, around 58.3% of participants had a healthy weight, followed by overweight individuals at about 31%. Those classified as obese and underweight each accounted for 5.2%.
Descriptive Statistics of Variables
Statistical Analysis
Analysis 1: We used a paired t-test to examine whether participants’ travel behaviors have changed significantly between t1 and t2. We separately compared the mode of travel before the intervention with the mode of travel to the metro station as well as the mode of travel to the destination. The null hypothesis (H0: μ(Tt2) = μ(Tt1)) was that the mode of travel at t1 and t2 remains the same. The difference in means was calculated as μ(Tt2) −μ(Tt1) and percent of change as (Tt2 Tt1) / Tt1.
Analysis 2: Analyses were conducted separately for both dependent variables (weekly walking time and BMI). The association between weekly walking time and independent variable, including age, gender, education, and the purpose of travel, was estimated using logistic regression to calculate adjusted prevalence odds ratios (aORs) and 95% confidence intervals. The same is true for estimating the relationship between BMI and the independent variables. We used logistic regression because dependent variables were categorial.
Results
Mode of Travel Before and After the Intervention
A paired-sample t-test was conducted to assess the impact of the new metro station on people's travel mode. Table 2 displays a significant difference in the mode of travel before and after the introduction of the new metro station in Tehran, with a t-value of −16.93 and p-value of .000 for travel to the metro station, and a t-value of −29.25 and p-value of .000 for travel from the metro station. Although the eta square statistic for travel to the metro (0.17) indicated a small effect size, the eta square statistic for travel from the metro (0.37) indicated a moderate effect size. In other words, the change in people's mode of travel from the metro station to their destination is more significant than from their home to the metro station.
Paired Differences: Changes in the Mode of Travel Before and After the Intervention
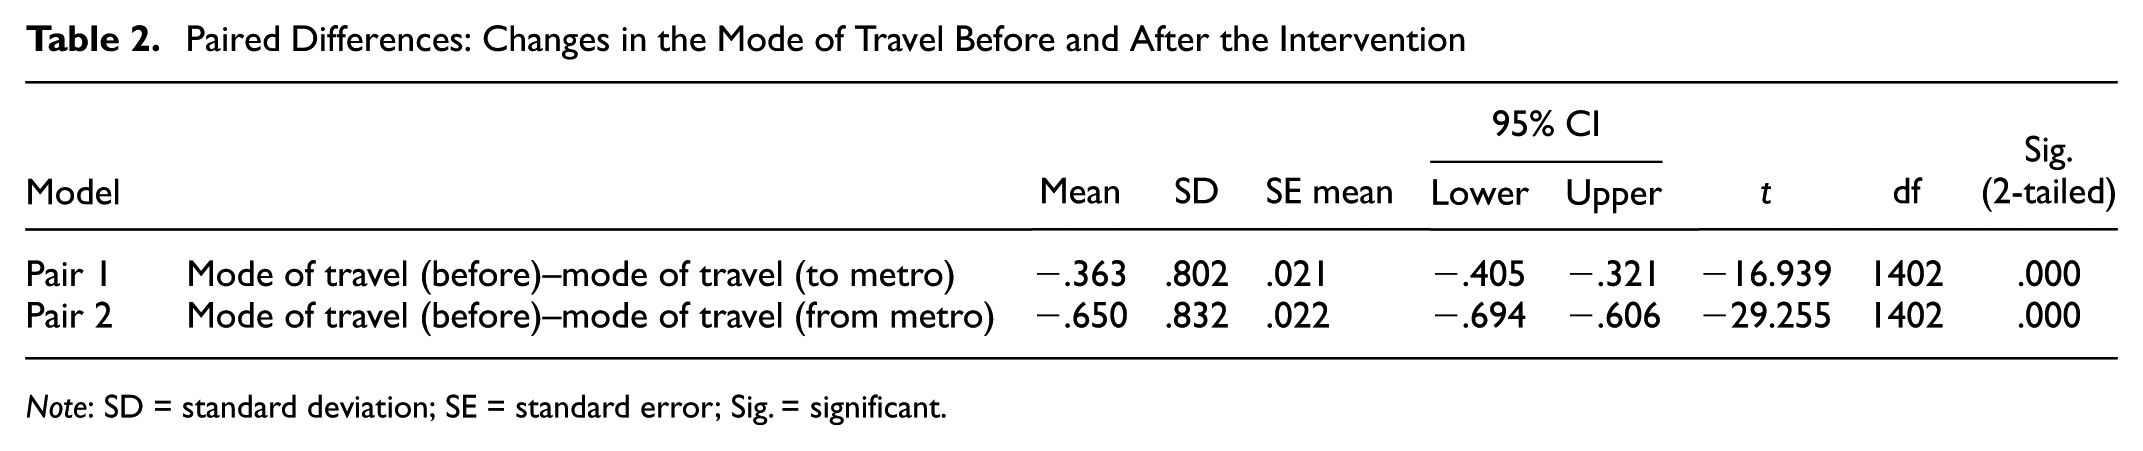
Note: SD = standard deviation; SE = standard error; Sig. = significant.
Overall, before the opening of the new metro station, a significant proportion of people traveled by private car, accounting for around 67.4%, compared to about 25.6% who traveled by bus and 7.1% who walked to their destination. Following the intervention, the number of people traveling by car and bus from home decreased by about 10% and 13.5%, reaching 58% and 12.1%, respectively, while the proportion of people walking significantly increased by about 23% to reach 30%. From the metro station to their destination, the figures for car usage halved, reaching 35.4%, with the figure for bus usage slightly declining to 9.1%. Approximately 55% of the study population walked from their destination metro stations to their final endpoints. Before the intervention, most people traveled by car from home to their destinations. However, after the introduction of the new metro station, many have switched their mode of travel from driving to walking and using the metro.
When considering the purpose of travel and comparing modes of transportation before and after the introduction of the new metro station, it is evident that there was a slight increase of 2% in car travel to the metro station for work trips. However, there was an increase in active transport caused by a modal shift from bus to walking for work trips. For study and leisure trips, the rise in the number of active transport trips is because of the reduction of both bus and car trips. Furthermore, when comparing modes of transportation before and after using the metro, there was a significant reduction of 17.7% in car travel from the metro station to people’s workplaces, while leisure and study trips by car from the metro station decreased by 35.5% and 39.7%, respectively. This suggests that commuters are more likely to use cars for work trips compared to leisure and study trips. In addition, while 18.5% of bus travelers switched to walking for work and study purposes, only 12% changed their mode of travel from bus for leisure purposes (Figure 2).
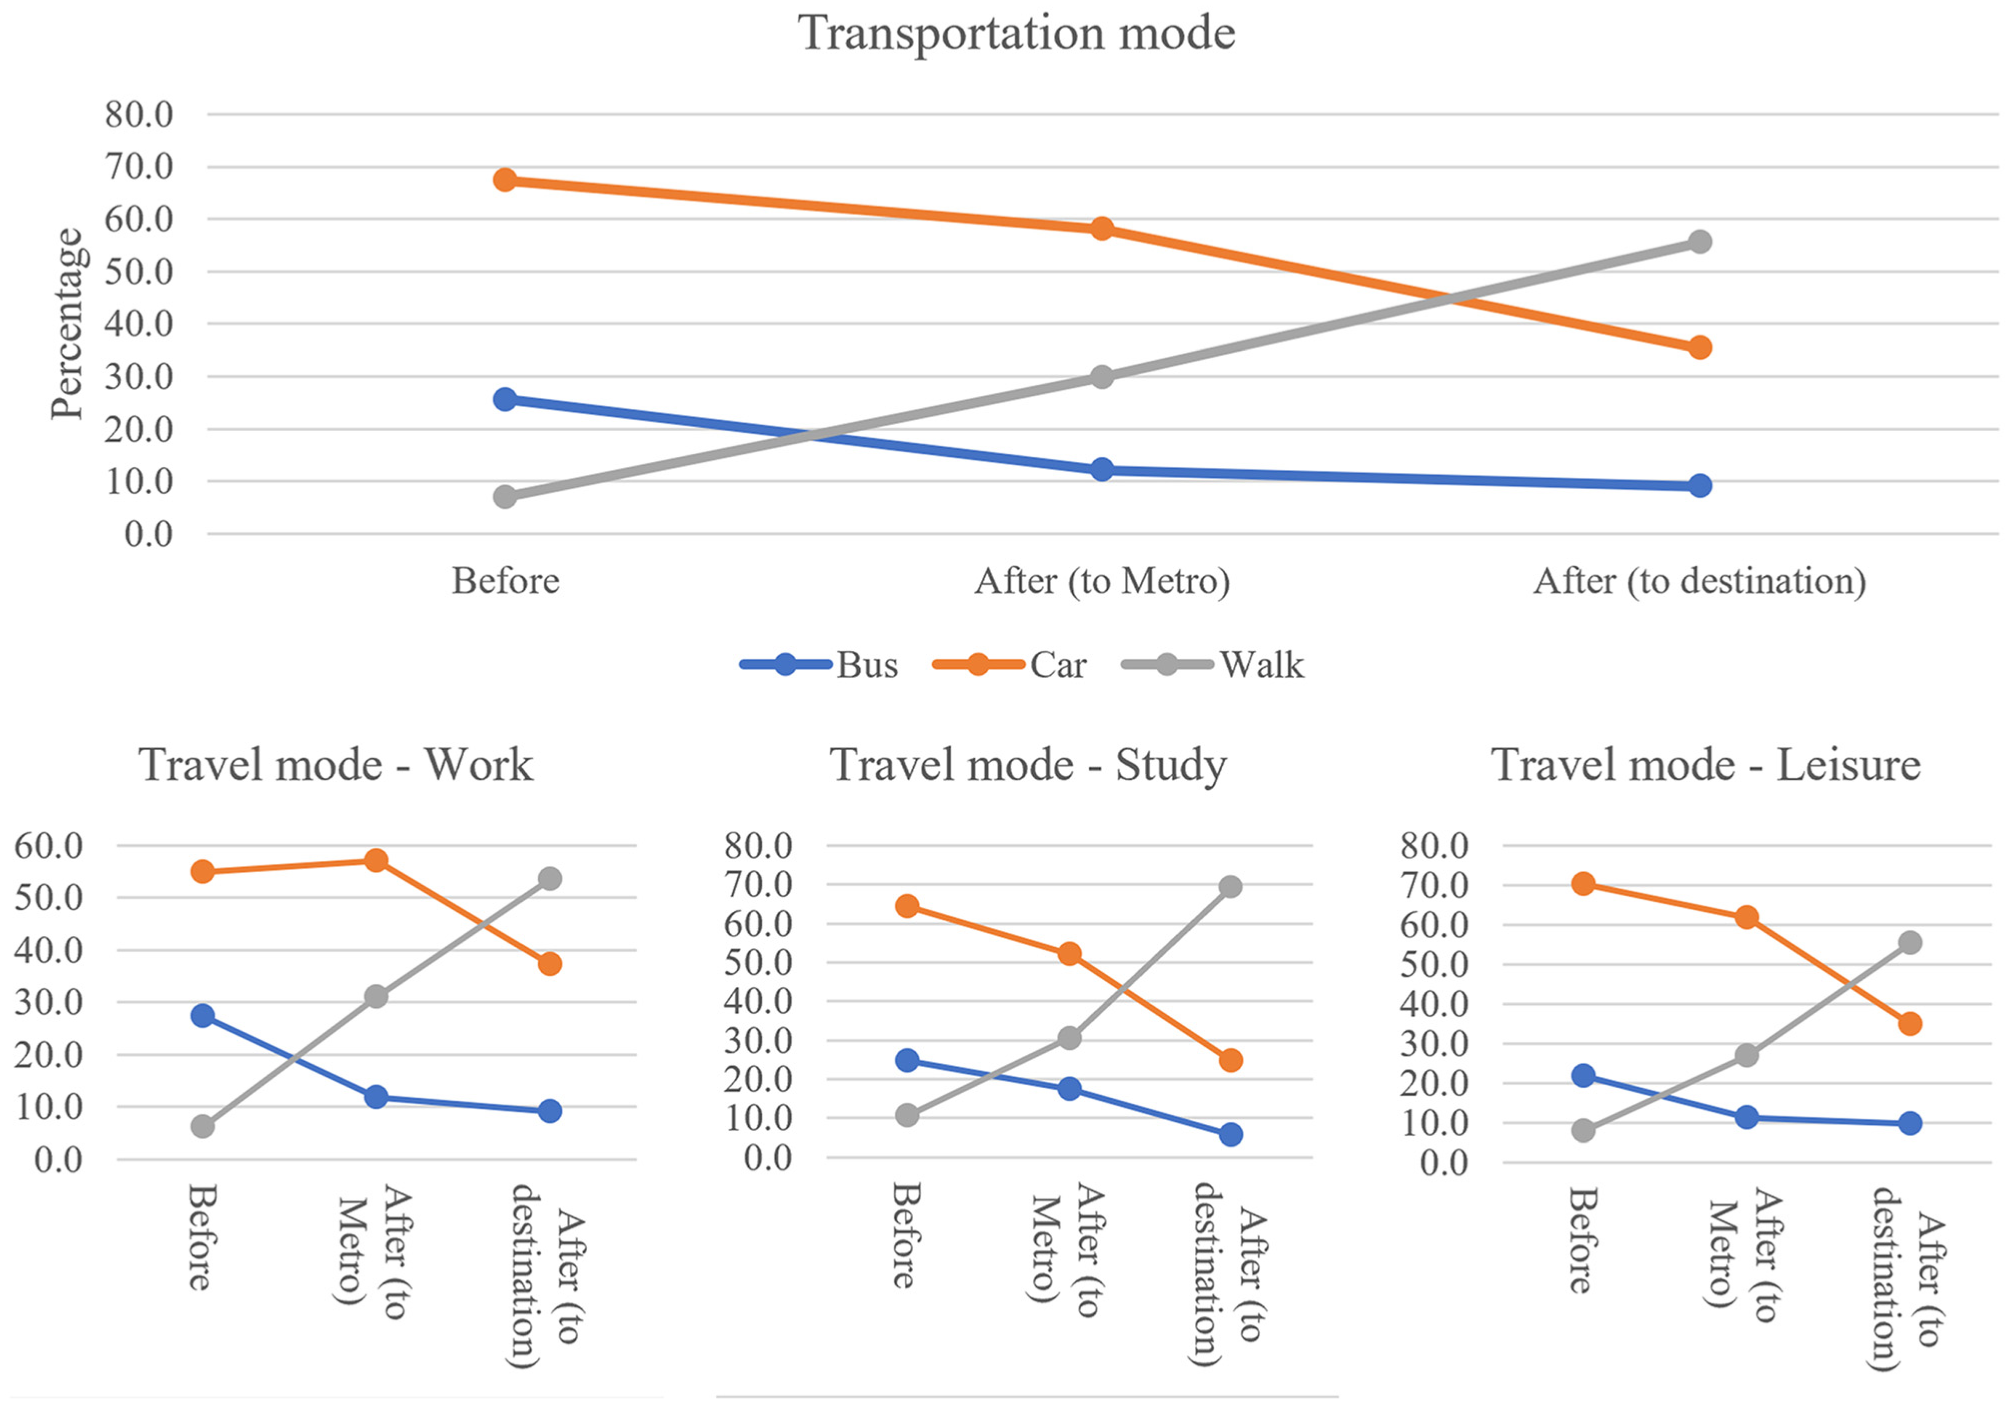
Percentage of people using different modes of travel before and after the intervention.
Weekly Walking Time caused by Modal Shift
Based on the walking times reported by participants to reach the new metro station from home, as well as from the final metro station to their destinations, we found that elderly individuals and teenagers tend to walk more than other age groups. In this sample, adults aged 60 and older walk an average of 147 min per week, while the average was about 163 min for individuals under 20 years old. On average, those aged 50–59 walk around 125 min per week, while those aged 20–60 walk around 95 min weekly. With respect to gender, females tend to walk more than males. On average, women walk around 118 min per week, while men walk approximately 89 min weekly.
After analyzing the purpose of travel, we found that individuals who travel for study and recreational activities tend to walk more than those who commute from home to work. On average, commuters walk approximately 83 min per week, while those traveling for leisure or study purposes walk around 144 and 160 min weekly, respectively. Interestingly, we have observed that individuals with lower levels of education tend to walk more than those with higher education degrees. On average, undergraduates and graduates averagely walk around 102 and 89 min per week, respectively, whereas those with diplomas and lower qualifications walk about 130 min weekly. With respect to the frequency of travel, we observed that individuals who traveled more frequently by metro tended to walk less, likely because their homes and final destinations are near to the metro station. On average, individuals who travel 1–6 times per week walk approximately 170 min weekly, while those who travel 7–10 times per week walk about 97 min weekly. Participants who travel more than 10 times per week walk around 30 min weekly (Figure 3).
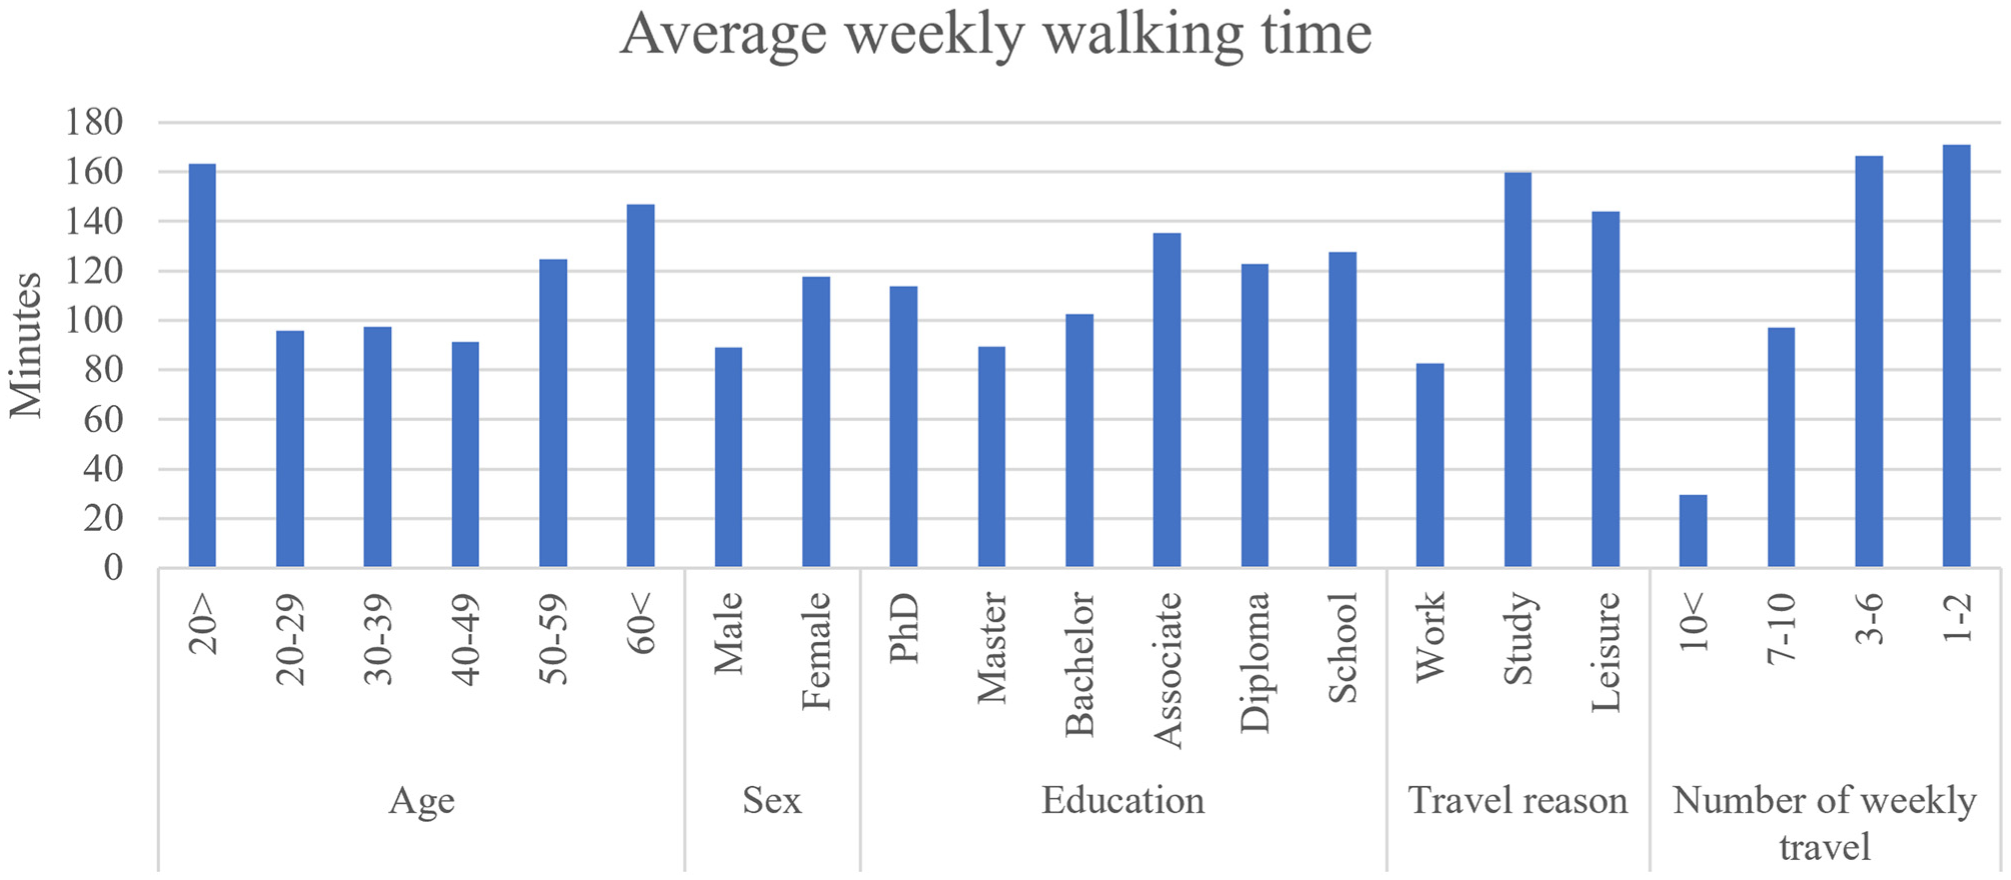
Average weekly walking time based on sociodemographic factors.
In this convenience sample, the introduction of the new metro station has resulted in approximately 16% of people walking 81–100 min per week, with around 13.6% of passengers walking 41–60 min and 10.6% of people walking only 21–40 min weekly. Of the total passengers who have switched to active transport, approximately 46% meet the level of weekly physical activity recommended by the World Health Organization, walking more than 170 min per week (Figure 4).
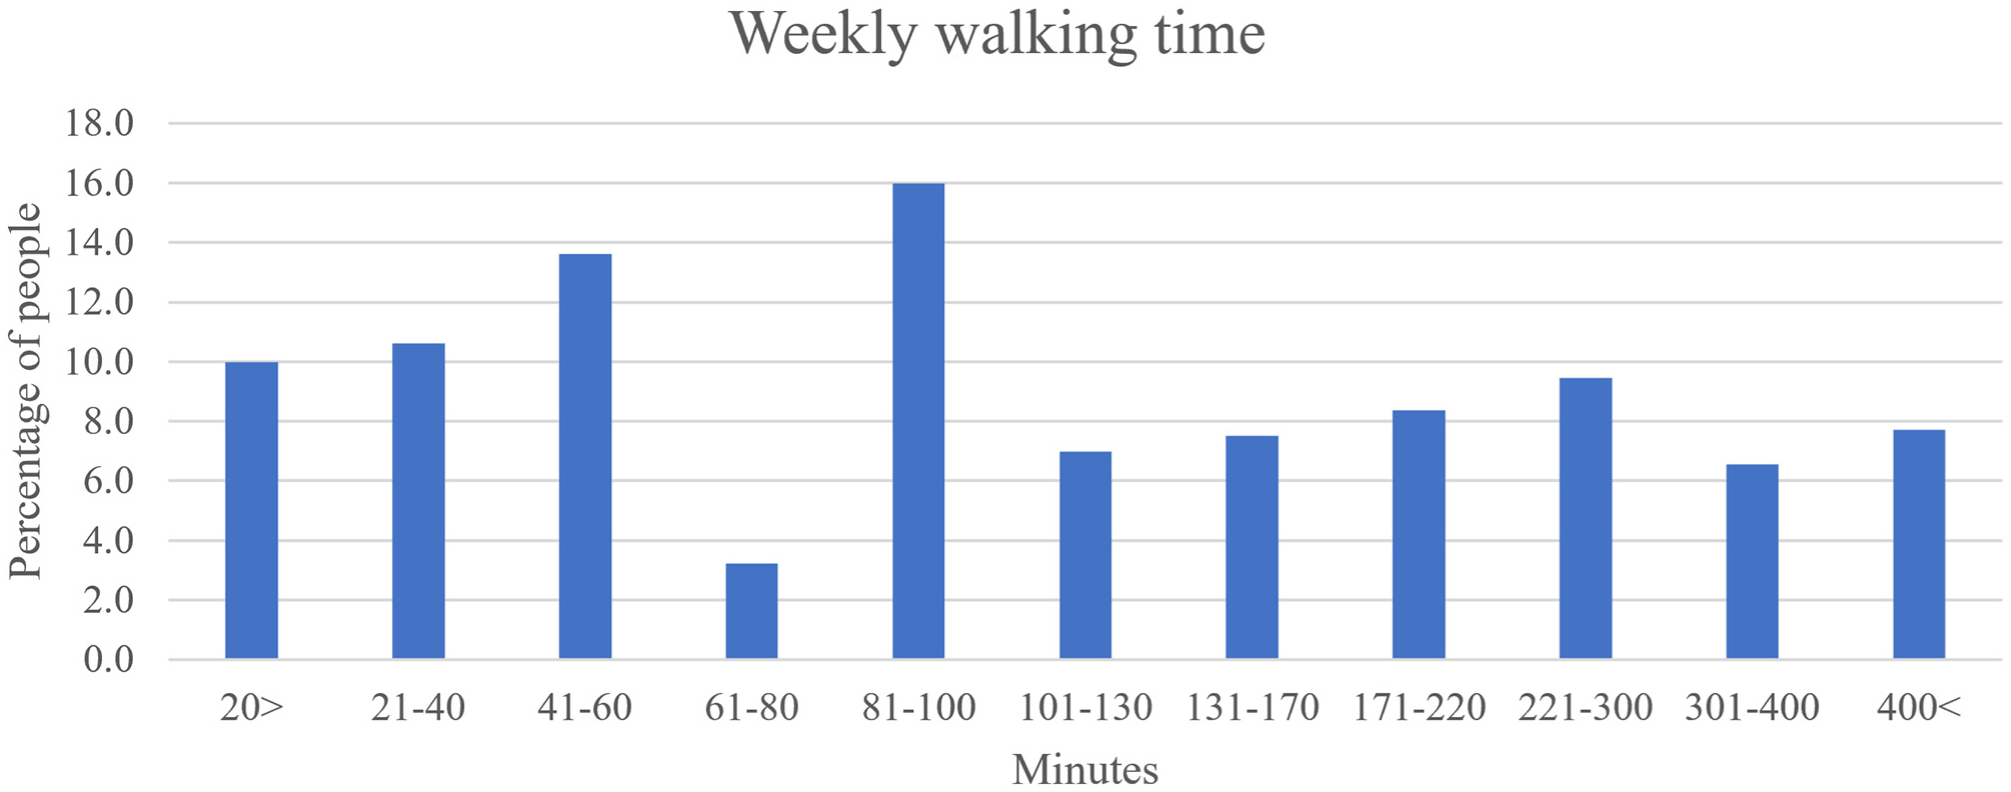
Weekly walking time.
Association between Weekly Walking Time and Sociodemographic Factors
A logistic regression analysis was conducted to examine the relationship among age, gender, education, and travel purpose in relation to weekly walking time. The overall model was statistically significant compared to the null model (χ2(13) = 151.098, p < 0.001), but it only accounted for 15% of the variance in walking time (Nagelkerke R2). This suggests that the independent variables considered in the study have limited explanatory power in understanding the variability and changes in weekly walking time. It is likely that other unexamined factors or variables have a significant influence on weekly walking time. Table 3 indicates that while age, gender, and travel purpose were significant predictors, education level was not.
Association Between Weekly Walking Time (WWT) and Sociodemographic Factors
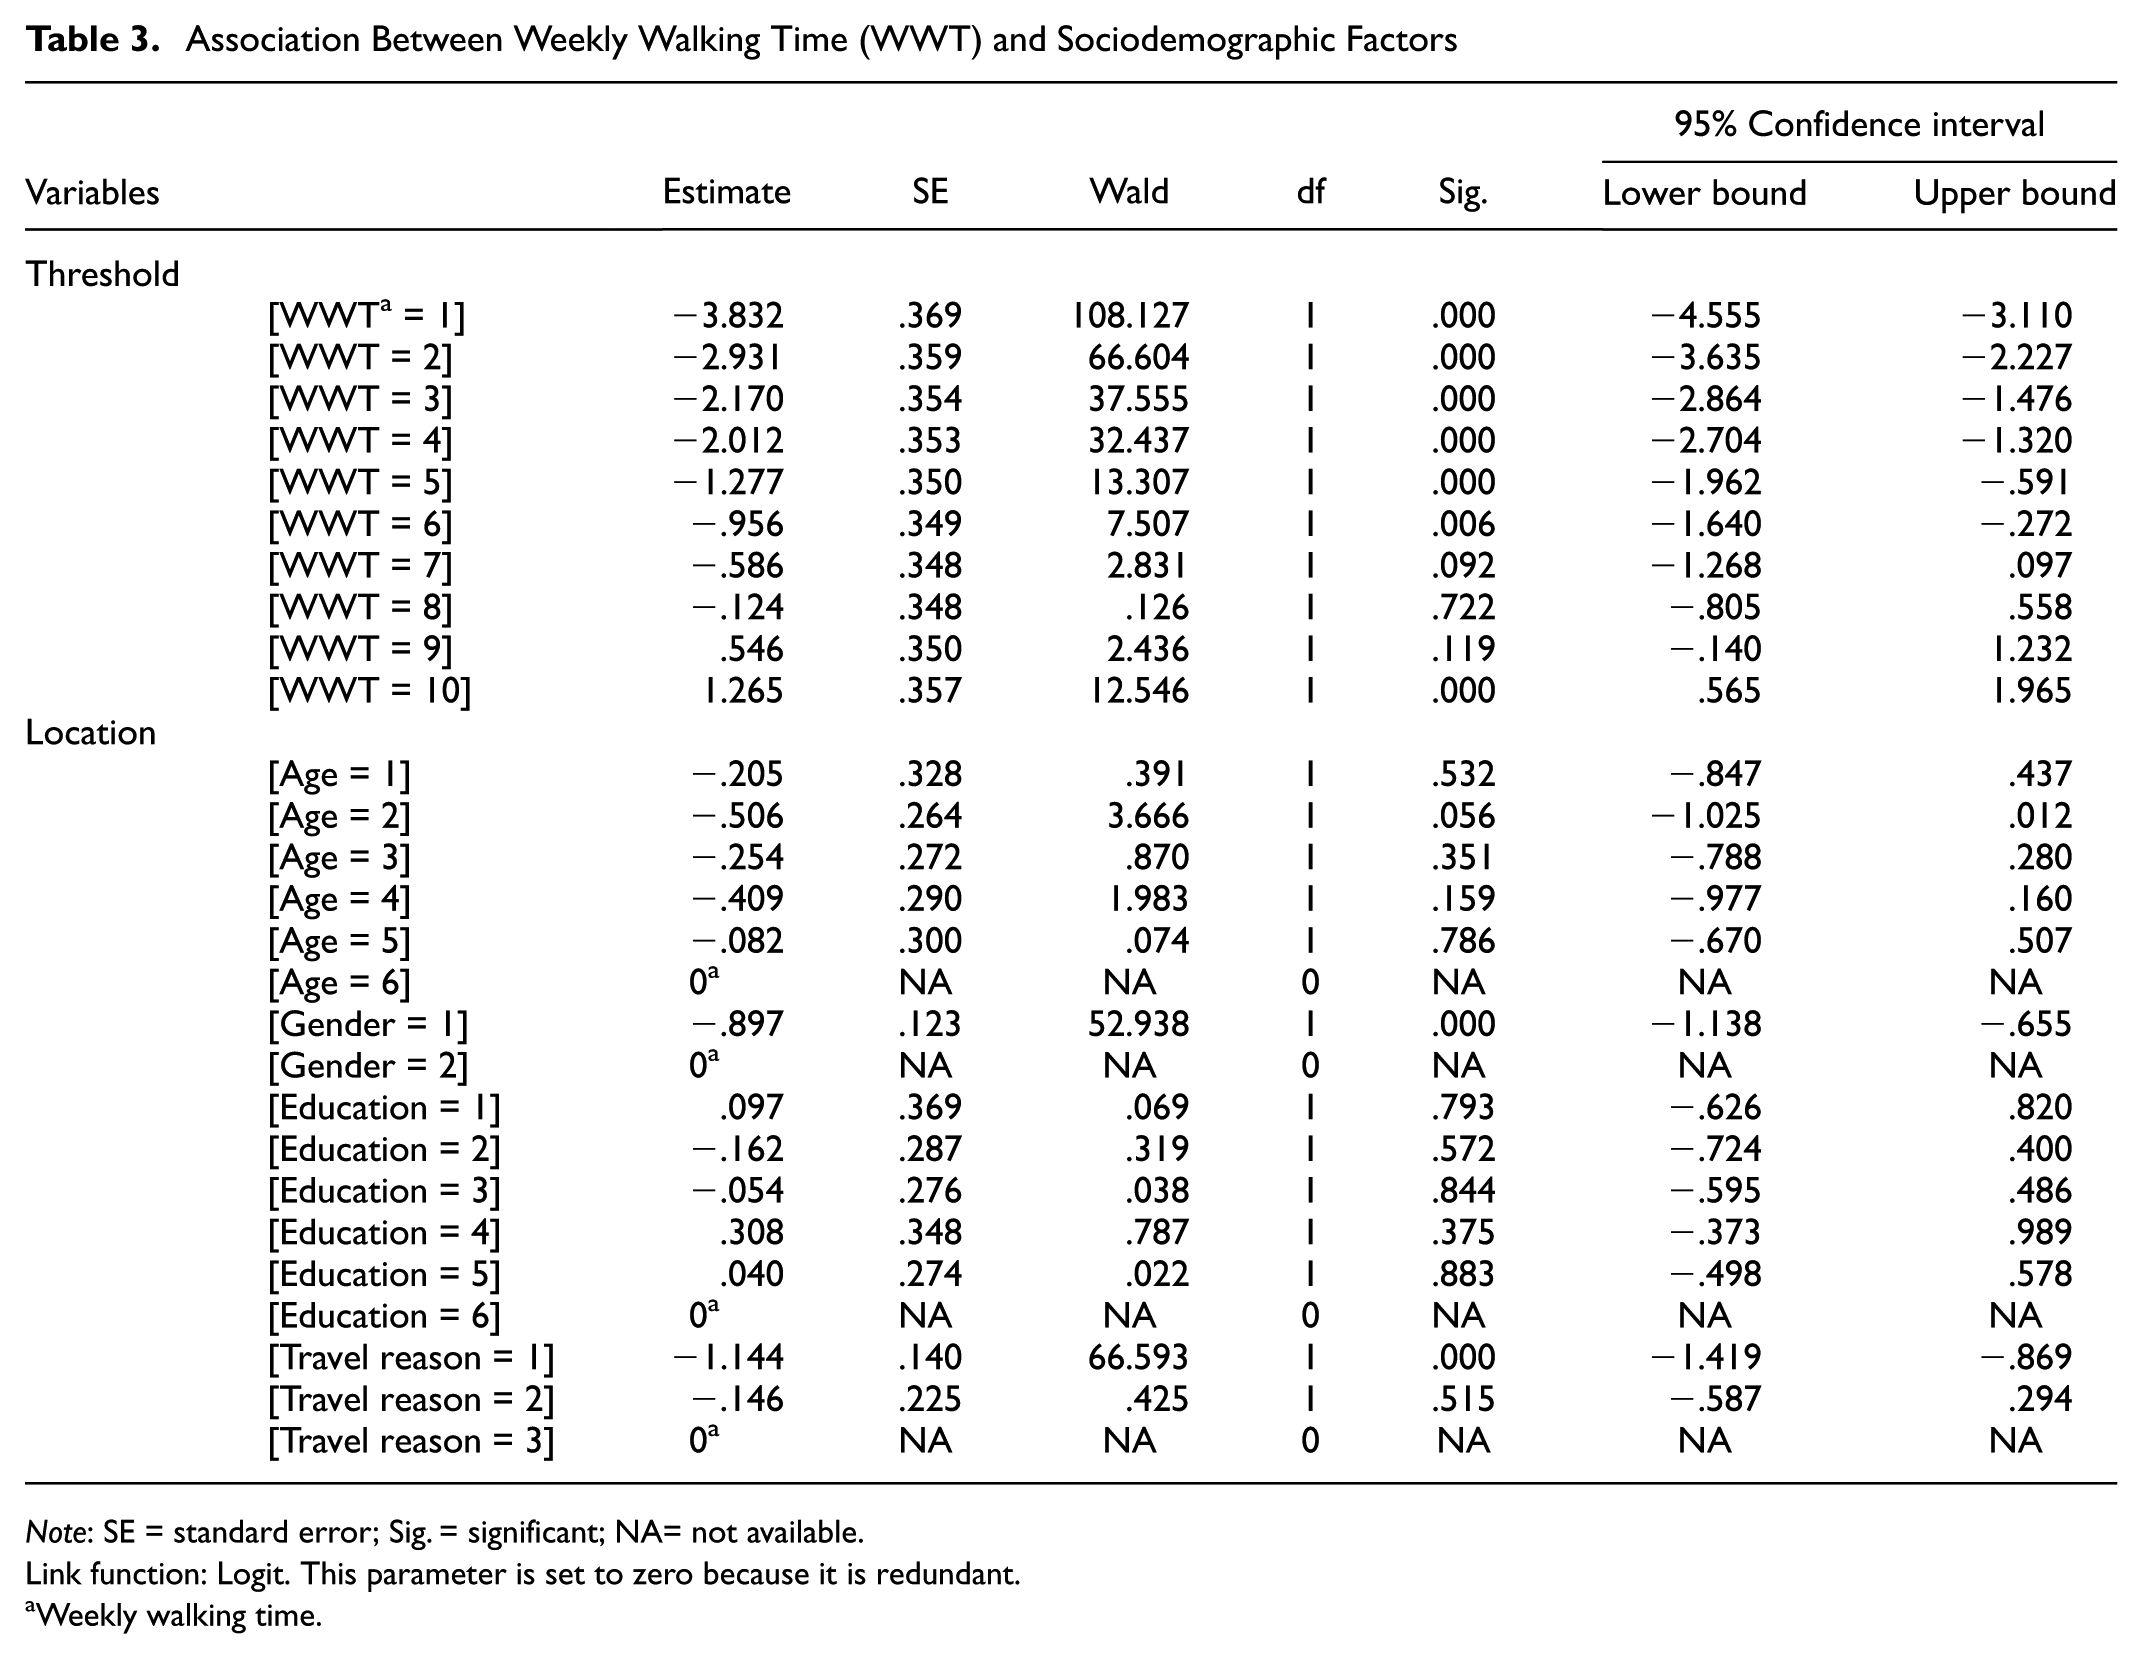
Note: SE = standard error; Sig. = significant; NA= not available.
Link function: Logit. This parameter is set to zero because it is redundant.
Weekly walking time.
The results demonstrate a significant gender difference in walking behavior, with males being less likely to walk than females following the introduction of the new metro station in Tehran. Furthermore, the findings indicate that work-related trips are negatively associated with walking, suggesting that commuters are less inclined to walk compared to those traveling for leisure or study purposes. This might because their destinations were not near the metro or that a car was necessary to reach their destination. Interestingly, individuals aged 20–29 exhibit a negative correlation with walking as a mode of transportation, indicating that this age group is less likely to walk to and from the metro station to their destination (Table 3).
Association between BMI and Sociodemographic Factors
A logistic regression was conducted to examine the correlation of age, gender, education, purpose of travel, number of weekly travel trips, and mode of transportation with the probability of obesity. The overall model was statistically significant in comparison to the null model (χ2(20) = 244.398, p < 0.001), but only accounted for 18% of the variation in survival (Nagelkerke R2). This suggests that the independent variables examined in the study have limited explanatory power (18%) in comprehending the variance and changes in likelihood of obesity. It implies that there may be other factors or variables not considered in the analysis that significantly influence the likelihood of obesity. Table 4 indicates that while age, gender, education, and mode of transportation were significant, the purpose of travel and the number of weekly travel trips were not.
Association Between Body Mass Index (BMI) and Sociodemographic Factors
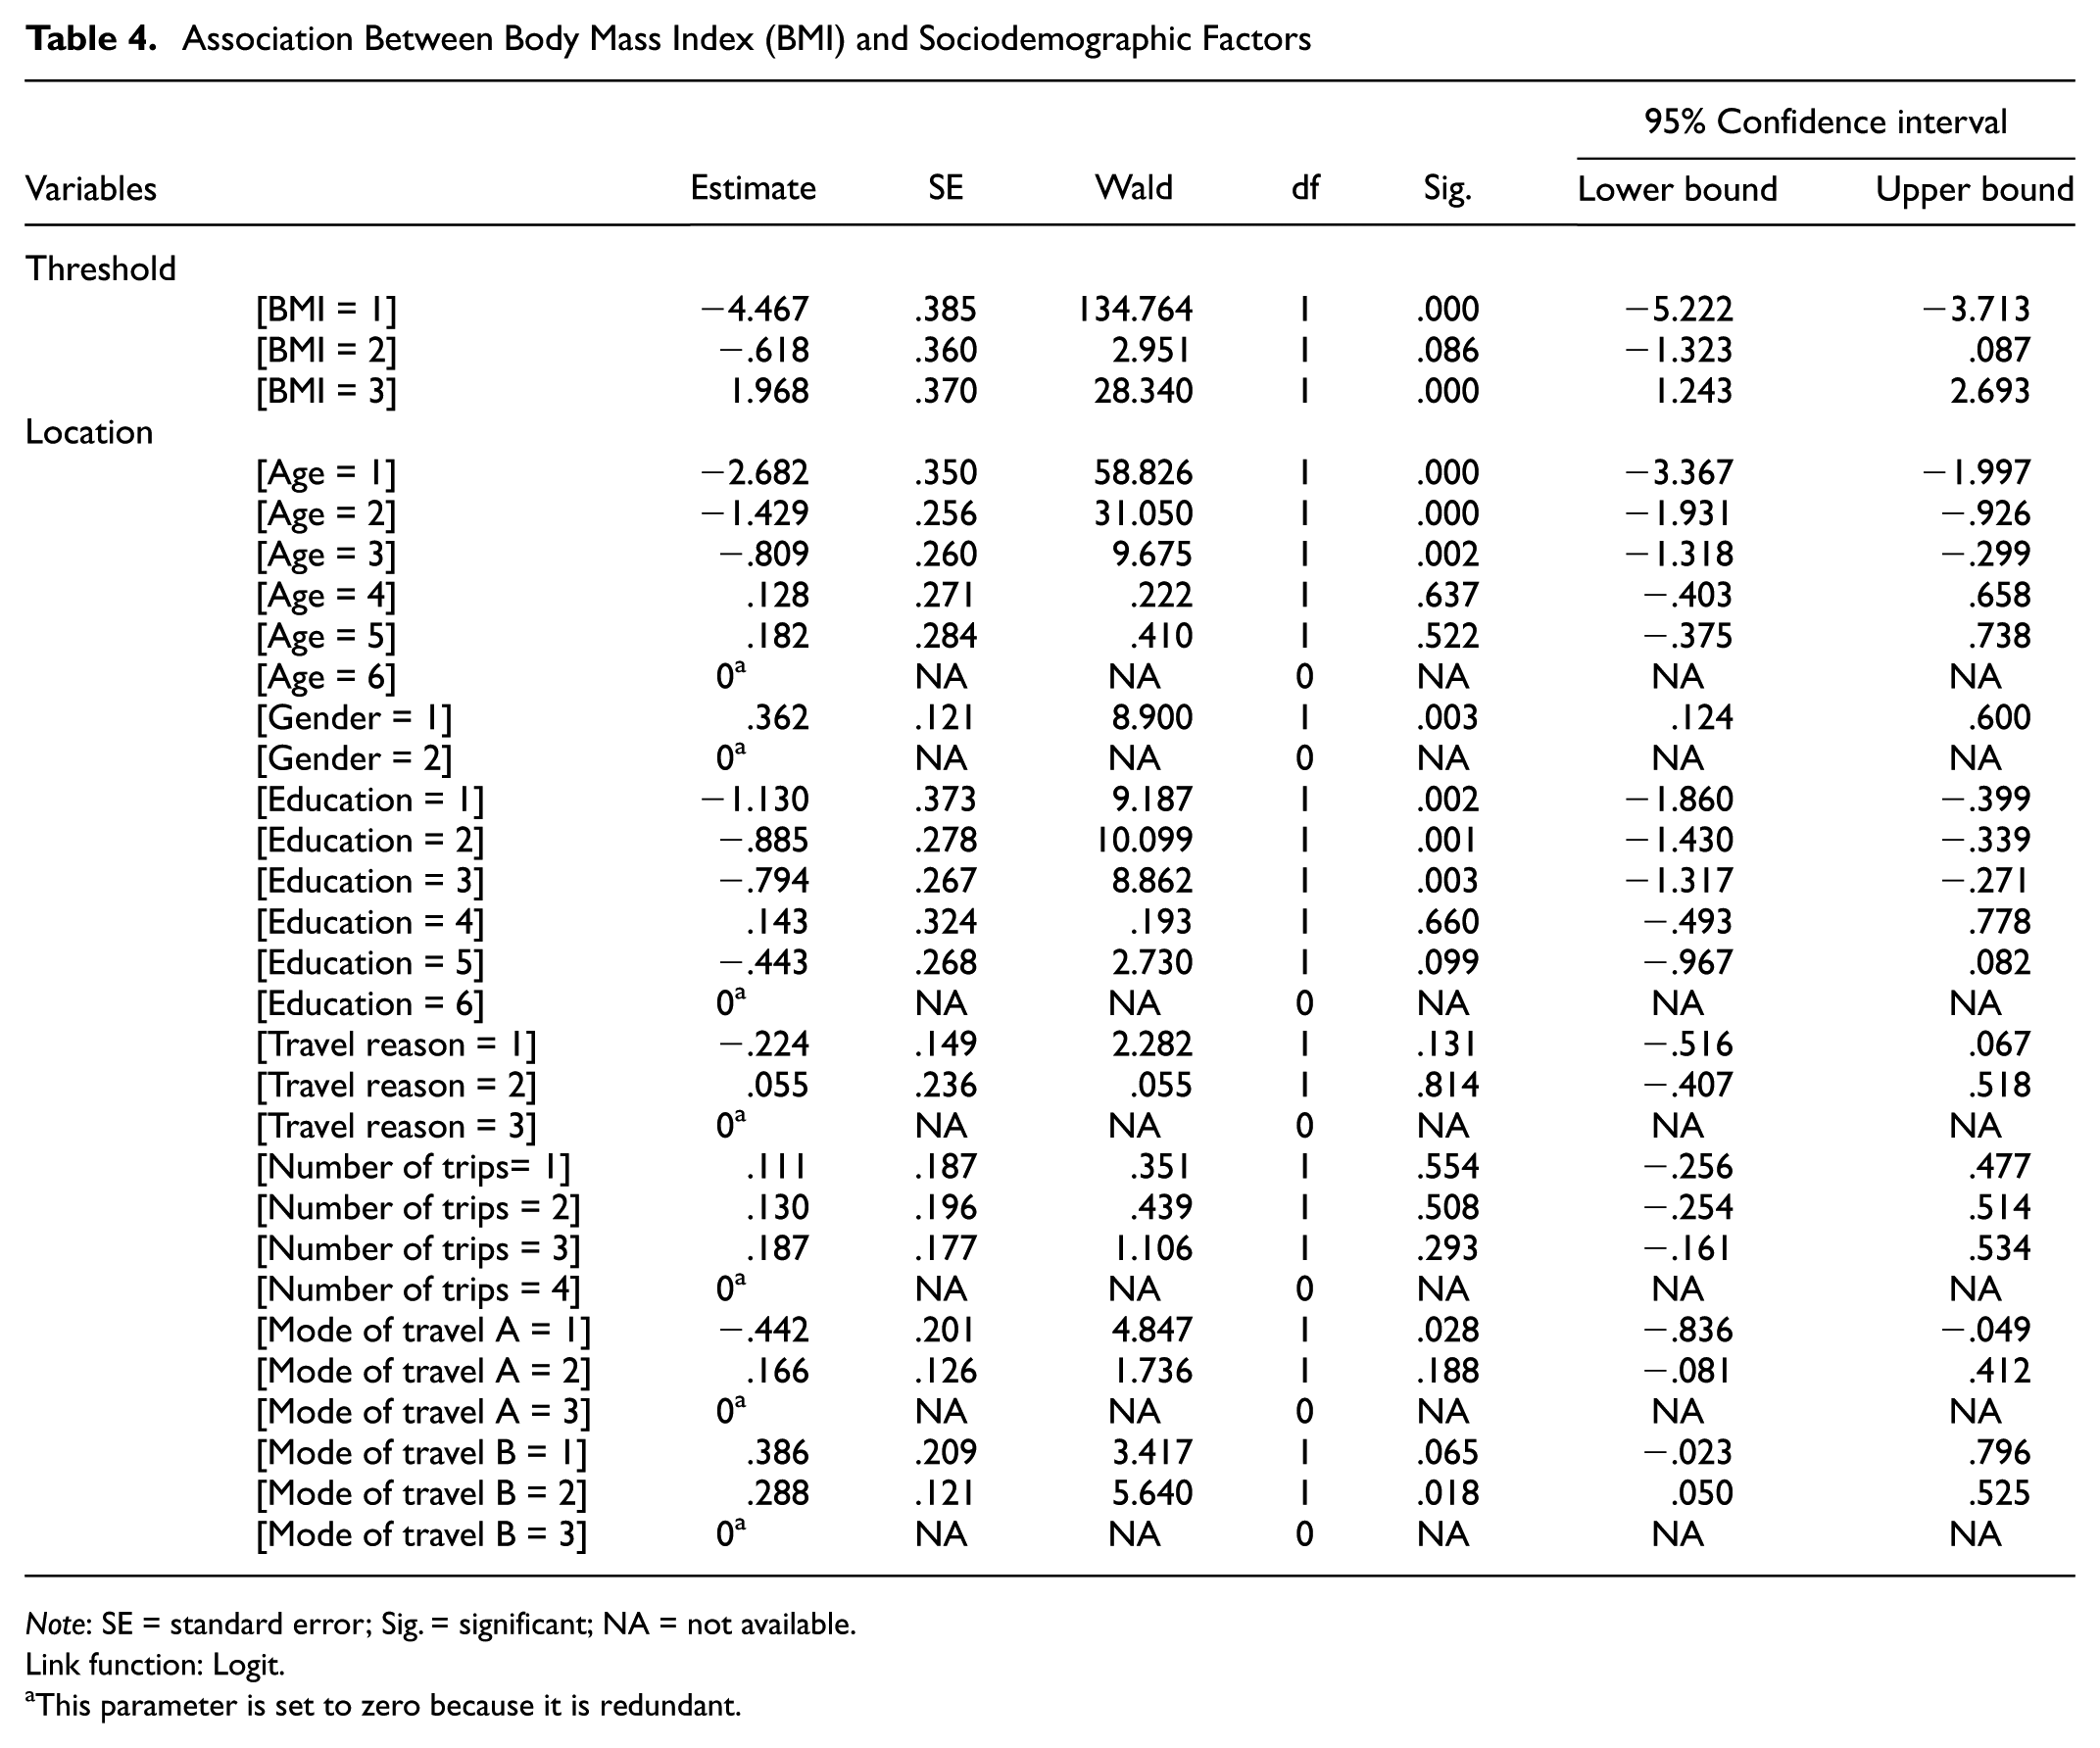
Note: SE = standard error; Sig. = significant; NA = not available.
Link function: Logit.
This parameter is set to zero because it is redundant.
The findings reveal a significant negative correlation between age and BMI, indicating that younger adults are more likely to be overweight and obese, while older adults are less likely to be obese. The same pattern can be observed in the relationship between education level and BMI, with passengers having higher academic qualifications being less likely to be overweight. The results also suggest that males are more prone to obesity compared to females. Moreover, individuals who travel by car are more likely to be overweight, whereas the correlation between bus travelers and BMI is negative, suggesting that they are less likely to be obese (Table 4).
Discussion and Conclusion
This study aims to assess individuals' modes of travel before and after the opening of the new metro station, Meydan-e-Sanat, and to analyze how this change has influenced their walking behavior and body mass profile. Our findings are consistent with Heinen et al. ( 17 ) and Sun et al. ( 3 ), which indicate that a transport intervention not only alters travel patterns but also leads to various modal shifts on arrival at the destination.
Although Sun et al. ( 3 ) suggested that the introduction of a new metro station may not result in a positive shift toward active travel or reduced car usage, our analysis suggested that the opening of a new metro station was associated with a reduction in the use of private cars and buses, as well as an increase in the frequency and duration of walking among the study population when traveling to and from the station. This difference in findings may be attributed to differences in statistical methods and research design. By focusing on metro users, our study was able to examine not only the change in transportation modes resulting from the new infrastructure but also the changes in modes used to access the metro station and reach final destinations.
In contrast to previous research conducted by Panter et al. ( 13 ), our study examines the correlation between travel purposes and the shift from personal cars to active transportation within this sample. Our findings indicate that the opening of a new metro station has a greater impact on reducing the use of private cars for leisure and study trips compared to work trips. This may be because transportation for non-commuting purposes is less time-sensitive and more flexible compared to work trips. In addition, the poor network of the Tehran metro, which does not cover the entire city and lacks sufficient wagons on certain lines, leads to long delays. This results in the stress of arriving at work on time, making the metro less appealing for commuting.
Our study builds on the research of Patterson et al. ( 20 ) and Xiao et al. ( 9 ), which highlights the benefits of using public transport for physical activity. We found that 46% of new metro users met the World Health Organization's recommended level of physical activity by walking during their trips. Unlike previous studies, we analyzed the walking minutes of new users by age and gender. Our findings indicate that both the elderly population aged 60 and over and teenagers (aged 20 and under) recorded higher average weekly walking times. This trend may suggest that more retired individuals are engaging in recreational physical activities, as they tend to have more free time compared to younger individuals, who often prioritize commuting for work. Furthermore, our analysis revealed that women and individuals with lower levels of education also recorded higher average weekly walking times. In addition, those who live closer to subway stations tend to utilize the subway more frequently each week.
Our findings indicate that certain demographic factors are associated with lower BMI among travelers. Specifically, older travelers, individuals with higher levels of education, women compared to men, and those who use buses rather than personal vehicles are less likely to be classified as obese and overweight. This trend may be attributed to several factors. Educated individuals often possess a greater awareness of health risks and have access to supportive social networks that encourage wellness. They are more likely to utilize resources that promote healthier lifestyle choices. Ini addition, bus and rail users tend to walk part of their journey to their transit stations, which contributes to their overall physical activity levels. In addition, older adults typically have more free time to engage in physical activities such as walking, compared to working adults who may have more sedentary lifestyles because of job commitments. Consistent with our findings, the study by Oguoma et al. ( 21 ) indicated that the odds of being overweight were 26% higher for men compared to women. In addition, it revealed that higher educational attainment and increased physical activity were linked to lower odds of obesity and central obesity.
Based on the findings, several implications can be drawn for policymakers and urban planners. Firstly, expanding the metro system to cover key locations across the city, including the development of additional metro lines and upgrading metro cars in Tehran, can significantly encourage walking and decrease reliance on private vehicles. This shift has the potential to lower obesity rates and mitigate associated health risks. The results also support the expansion of the bus system, as the findings indicate that bus travelers have lower odds of being obese and overweight in the sample study. Integrating bus routes with pedestrian-friendly infrastructure promotes active travel, further supporting community health initiatives. Furthermore, the results underscore the importance of transit-oriented development (TOD). The data indicates that individuals who walk shorter distances to reach metro stations tend to use the metro more frequently each week. Therefore, integrating TOD principles into urban planning can enhance accessibility and promote healthier commuting habits among residents. Moreover, developing a software application that allows travelers to track metro arrival and departure times can significantly reduce their stress about arriving at work on time. By providing real-time information, this tool can empower commuters to plan their trips more effectively. In addition, if the distances between their home and the metro station, as well as from the metro station to their final destination, are manageable, it may encourage them to walk those shorter distances. This not only promotes a healthier lifestyle but also contributes to a more sustainable urban environment by reducing reliance on private vehicles.
Limitations and Future Directions
This study has several limitations. Firstly, it uses a cross-sectional design, capturing data at one point in time, which restricts the ability to observe changes in travel modes over time. Future research should consider longitudinal studies to track behavior shifts.
Secondly, the study population is limited to metro users, which may not represent broader transportation patterns. Including residents within a 1-km radius of the metro station in future studies could provide a more comprehensive understanding of how transportation interventions affect modal choices in Tehran. Plus, the survey was conducted at peak morning and evening commuting times (7–10 a.m., 5–8 p.m.), which may have skewed the respondents to be more likely to be traveling for work rather than for leisure.
Thirdly, future research could explore the influence of built environment factors on individuals' choices of transportation modes when traveling from their home to the metro station. For instance, it would be valuable to examine whether the presence of green spaces encourages more people to walk to the metro station. Understanding these relationships could provide insights into how urban design can promote sustainable travel behaviors.
This study did not delve into the underlying reasons and driving factors behind individuals' shifts in transportation modes. By identifying the barriers and motivations that influence the transition from private car use to public transportation, we can significantly improve the effectiveness of urban transportation policies, especially in regions where low fuel costs and cultural norms heavily favor personal vehicle usage ( 22 ). This line of inquiry would be particularly beneficial in Persian Gulf or Middle Eastern countries, such as Iran, where fuel is remarkably inexpensive—approximately U.S.$ 0.018 per liter—and metro fares are low, at around U.S.$ 0.051 for a one-way trip. Gaining a deeper understanding of these dynamics is essential for comprehending the factors that shape transportation choices in this unique context.
Fifthly, while the current study concentrated on the frequency and duration of walking, it did not take into account the intensity of walking. In addition, self-reported measures may lead to inaccuracies, as individuals often struggle to accurately estimate both the duration and frequency of their walking activities. This limitation highlights the need for more objective methods of assessment to capture a comprehensive understanding of walking behavior.
Lastly, the research fails to differentiate between the starting points of trips, which is a significant oversight. Recent studies, such as those by Wang et al. ( 23 ), have demonstrated that accounting for the origins of travel can yield a more nuanced understanding of how interventions influence travel behavior. Moreover, consideration of the land-use context is essential: if the area surrounding the new station is primarily residential, home is likely to be the predominant trip origin, whereas a mixed-use area could serve equally as an origin or destination.
Footnotes
Author Contributions
The authors confirm contribution to the paper as follows: study conception and design: M.S. Shahmiri, A. Gharaei; data collection: S. Sadeghnejad, M.A. Soleh; analysis and interpretation of results: M.S. Shahmiri, P. Boujari; draft manuscript preparation: P. Boujari, M.S. Shahmiri. All authors reviewed the results and approved the final version of the manuscript.
Declaration of Conflicting Interests
The authors declared no potential conflicts of interest with respect to the research, authorship, and/or publication of this article.
Funding
The authors received no financial support for the research, authorship, and/or publication of this article.