
Abstract
This study proposes an optimized mix design for pervious concrete and develops a discrete element method (DEM) model to analyze the microstructure of aggregates coated with cement paste. When the parameter ki is set to 1.3, the coating thickness (CT) reaches the optimal CT (OCT), which is 0.65 mm (for aggregates 4.75–9.5 mm), 0.91 mm (for aggregates 9.5–16 mm), and 1.17 mm (for aggregates 16–19 mm). The optimal aggregate mix ratio of 4.75–9.5 mm to 16–19 mm, which is 7:3, was determined using the simplex centroid method. The designed pervious concrete achieved a compressive strength of 26 MPa and a permeability coefficient of 1.68 mm/s, thereby meeting the pavement standards of ≥25 MPa and ≥0.5 mm/s, while simplifying the mix design process. A DEM model incorporating OCT was developed and compared with a non-coated model, demonstrating an increase in accuracy of 10.26%. The DEM model of pervious concrete with a cement coating effectively captured the stress-strain behavior, compressive strength, and permeability characteristics of pervious concrete, aligning well with experiment data and exhibiting a relative error of 8.32%, which is within 10%. Its accuracy exceeds that of the non-coated model by 10.26%, significantly enhancing the reliability of numerical simulations. This approach reduces dependence on extensive laboratory testing, thereby streamlining the mix design process while maintaining practical feasibility. This study provides a valuable numerical tool for optimizing the performance of pervious concrete in engineering applications.
Pervious concrete pavement helps mitigate environmental issues, such as urban heat islands, waterlogging, and pollution, by enhancing stormwater infiltration, improving urban hydrological balance, and supporting ecological sustainability ( 1 ). Coarse aggregates, coated with cement paste, form a bonded network with interconnected pores, allowing efficient pavement water infiltration ( 2 ). Currently, pervious concrete is widely employed in parks, plazas, parking lots, and low-traffic roads ( 3 – 5 ).
Pervious concrete consists of coarse aggregates, a cementitious binder, and voids, with paste ensuring cohesion. Stability depends on adhesion strength between the paste and aggregates, which bear mechanical loads ( 6 ). Acceptable void content in the concrete can be maintained by using single-sized coarse aggregate or aggregate gradation within the range of 4.75–19 mm ( 7 , 8 ). A uniform aggregate gradation helps increase porosity; by adjusting gradation, size, and proportion, the target porosity can be more precisely achieved ( 9 ). Although larger aggregates significantly enhance porosity and water permeability, they also lead to a decrease in compressive strength ( 10 , 11 ). In contrast, smaller aggregates can improve paste–aggregate bonding and overall strength ( 12 , 13 ). Kim and Lee found that specimens with smaller aggregates exhibited a higher total number of pores ( 14 ). Furthermore, using either single particle size or mixed particle size is crucial for forming effective interconnected pores, which improves permeability while maintaining stable strength ( 15 , 16 ).
To optimize mix designs, researchers have gradually introduced statistical models into mix proportion studies. In 1958, Scheffe proposed the theory of mixture experiment design, leading to improved methods such as the simplex centroid design ( 17 ). Although widely used in the fields of agriculture, food processing, and chemical engineering, its application in civil engineering remains relatively limited ( 18 ). In the 1990s, Douglas and Pouskouleli were the first to apply the simplex centroid design method to predict the compressive strength of cement-slag-fly ash composite mortars ( 19 ). Wang and Chen, and Chung et al. established quantitative relationships between compressive strength and the composition of cement-slag-fly ash ( 20 , 21 ). Zhou et al. developed a mix design method for mineral admixture concrete ( 22 ). Further studies have used the simplex centroid design to evaluate heat of hydration, porosity, and calcium hydroxide content in ternary systems ( 23 , 24 ). Kabagire and Yahia demonstrated, via full factorial design simulations, that inter-particle porosity most significantly affects both permeability and strength development ( 25 ). Research employing two-level factorial designs and response surface methodology (RSM) suggests that the water-to-binder ratio, cement content, coarse aggregate content, and their interactions are key factors influencing concrete performance ( 26 ). Zhang et al. optimized aggregate gradation and admixture dosage using RSM ( 27 ). Jiao et al. further confirmed that the simplex centroid design effectively optimizes concrete mix proportions based on rheological properties ( 28 ). In summary, this method enables the optimization of mixed aggregate ratios in pervious concrete to achieve desired performance through well-designed experiments, parameter analysis, mathematical modeling, and prediction.
At the microstructural level, aggregate size significantly influences pore characteristics and paste coating thickness (CT) in pervious concrete, thereby affecting its compressive strength and permeability ( 29 , 30 ). Deo and Neithalath found that higher paste volume fractions enhance compressive strength ( 31 ). As paste thickness increases, compressive strength rises gradually while permeability and porosity decrease ( 12 , 32 , 33 ). When the paste thickness reaches about 1.15 mm, the compressive strength stabilizes and further increases, primarily by reducing porosity ( 34 ). Studies by Dittmer and Beushausen, and Sánchez-Mendieta et al. have shown that excessive paste increases the spacing between aggregates, weakening friction and interlocking, which leads to reduced mechanical properties and durability ( 35 , 36 ). Although a moderate increase in paste thickness can improve compressive strength, excessive coating may clog pores and undermine the design intent of pervious concrete ( 37 – 39 ). If the paste uniformly coats the aggregates, pervious concrete can potentially achieve both high strength and high permeability simultaneously ( 40 ).
The conventional finite element method (FEM) assumes material continuity, making it less effective for simulating materials such as pervious concrete, which inherently contain discontinuities. As a result, FEM often struggles to accurately capture the cracking behavior in pervious concrete structures ( 41 ). To address these limitations, researchers have developed discrete modeling approaches as alternatives to continuum methods, especially for quasi-brittle, heterogeneous materials such as cementitious composites, where failure is primarily governed by fracture mechanisms ( 42 ).
The discrete element method (DEM), first proposed by Cundall in 1971, is a numerical analysis technique based on contact mechanics between spherical particles and planar surfaces ( 43 ). It was initially applied to rock mechanics and soil mechanics. Although originally developed for geotechnical engineering, DEM has since been widely adopted across various disciplines, including agriculture, mining, mechanical engineering, and civil engineering ( 44 ).
In civil engineering, DEM is employed to simulate structural dynamic responses and seismic behavior, as well as crack initiation and propagation within concrete ( 45 ). These simulations enable the assessment of structural stability and safety, support design optimization, and improve the seismic performance and resilience of buildings ( 46 ). Liu et al. employed DEM to simulate the vibratory compaction process of two-layer roller-compacted concrete, analyzing the interlocking behavior of aggregates of varying sizes under different compaction forces, and providing recommendations for improving construction quality control ( 47 ). Peng et al. developed a porosity-based heterogeneous model using DEM to explore how aggregate distribution affects crack formation and propagation in concrete ( 48 ). Ansari and Mahajan demonstrated that DEM is more suitable than FEM for establishing mechanical and fracture models of pervious concrete ( 49 ).
Particle Flow Code in Three Dimensions (PFC3D), a DEM-based tool, simulates granular kinematics and contact mechanics to develop micromechanical constitutive models for pervious concrete ( 50 ). The core technological advantage is the ability to geometrically reconstruct multi-scale particle shapes ( 51 ). PFC enables cross-scale simulation of crack evolution in pervious concrete, offering microscopic insights into its damage and failure mechanisms ( 52 ).
Wen et al. developed a three-dimensional (3D) micromechanical model integrating aggregates, mortar, interfacial transition zone (ITZ), and pores; simulated strength values differed from the experimental results by less than 15% ( 53 ). Zhou et al. developed a 3D DEM model replicating the stress-strain curve of pervious concrete, with a compressive strength error <10% ( 54 ). Yang et al. found PFC 2D and DEM predictions differed by 0.39%–0.42%, with a systematic error of 3.2%–7.4% versus experiments ( 55 ). Concerning modeling strategies, the adoption of viscoelastic contact models together with the parallel bond model (PBM) effectively represents the mechanical behavior of 3D virtual specimens of pervious concrete ( 52 ). Huang and Wang demonstrated, using a contact damage model based on a random pore topology algorithm, that the crack propagation paths and failure modes in numerical specimens closely resemble those in physical specimens ( 56 ).
Although pervious concrete has been increasingly applied in engineering practice, challenges remain in optimizing its mix design. Existing methods, such as single-factor and orthogonal experiments, often fail to capture the coupled effects among aggregate gradation, cement paste CT, and pore structure. As a result, achieving a balance between mechanical strength and permeability remains difficult. Moreover, many numerical models simplify the material as a continuous medium or neglect ITZ and the presence of the cement paste, limiting their ability to represent the discontinuous skeleton and interface-driven failure mechanisms in pervious concrete.
To address these issues, this study proposes an integrated approach that combines statistical mix design, validation by experiment, and DEM. A CT scaling factor (k i ) is introduced to account for size-dependent cement paste coverage. A 3D DEM model is developed to explicitly simulate interface effects and cement-coated aggregates, enabling comparison between coated and uncoated models in crack propagation and strength prediction. This enhances the physical realism and practical applicability of the simulation framework.
The ultimate goal is to establish a digital twin framework for pervious concrete, enabling efficient mix optimization and customized design under complex traffic and environmental conditions, while reducing experiment workload and material consumption.
Research Objectives and Novelty
This study aims to develop a digital design–simulation framework for pervious concrete by combining systematic mix proportioning with micromechanical modeling. It focuses on quantifying the optimal cement paste CT for various aggregate sizes and integrating these parameters into a 3D DEM model to simulate the material’s mechanical and permeability behavior.
This study introduces several key innovations:
1) CT Optimization for Pervious Concrete Aggregates
A novel approach is developed to quantify the cement paste CT based on aggregate size, using a newly defined proportion factor k i . This enables a dynamic and size-dependent control of CT, addressing the performance trade-off between compressive strength and permeability.
2) Incorporation of Cement Coating into DEM
This research pioneers the integration of coating effects into DEM modeling, where cement-coated aggregates and their ITZs are explicitly represented. This allows realistic simulation of crack development, inter-particle bonding, and structural failure under load.
3) Digitalized Mix Design Workflow
By combining the simplex centroid mix design method with DEM simulation, this study proposes an efficient, reproducible, and customizable digital framework for pervious concrete design, significantly reducing experiment workload and enhancing predictive accuracy.
Compared with the authors’ previous studies, which focused on the mechanical properties, freeze–thaw resistance, and clogging behavior of pervious concrete, this study offers a significant improvement in numerical modeling accuracy. In earlier work, DEM was used to simulate material behavior, but the models did not consider the effects of ITZ or the presence of a cement paste coating on the aggregate surface. As a result, the simulated strength and failure modes often deviated notably from experiment observations.
To overcome these limitations, this study incorporates a more realistic DEM framework by explicitly modeling the cement paste CT and interface behavior between aggregates. Combined with a statistically optimized mix design using the simplex centroid method, the new approach enables accurate simulation of aggregate bonding, failure propagation, and structural response.
This integration of experiment data, statistical design, and meso-scale modeling provides a clearer mechanistic understanding of pervious concrete, bridging the gap between empirical performance and digital prediction. The improved model achieves significantly better agreement with experiment results, enhancing the credibility and application potential of DEM in simulating complex cement-based porous materials.
Experiment Program
Experiment Design Principles
Pervious concrete constituent materials are similar to those of conventional concrete, but do not include fine aggregates. Instead, coarse aggregates occupy most of the volume, with cement paste evenly coating their surfaces, enabling water to flow through the interconnected pores. This study introduces three assumptions as follows:
Assumption 1: The cement paste uniformly coats the aggregates without any excess that could block the pores of pervious concrete.
Assumption 2: It is assumed that the aggregates are spherical, with the diameter of the sphere corresponding to the aggregate size.
Assumption 3: The CT varies with different aggregate gradations.
Experiment Material
This study used cement, natural coarse aggregates, and tap water to prepare pervious concrete, with P.O 42.5 cement, and the natural coarse aggregates consist of basaltic gravels in three different particle size ranges: A: 4.75–9.5 mm, B: 9.5–16 mm, and C: 16–19 mm.
Experiment Methodology
The mix design adopted a volumetric approach focusing on CT calculation to prevent pore blockage while maintaining permeability. Simplex centroid design optimized aggregate gradation ratios to achieve dual objectives: compressive strength ≥25 MPa and permeability ≥0.5 mm/s. Unlike conventional porosity-targeted methods, cement paste volume was determined inversely through CT values specific to each aggregate gradation.
Water-to-Cement (w/c) Ratio Optimization
The water-to-cement (w/c) ratio is a critical parameter that influences the coating performance of the cement paste, the packing structure of the mixture, and, ultimately, the mechanical and permeability properties of pervious concrete. In this study, a single-factor experiment was conducted to investigate the effect of w/c ratio on concrete properties, using single-sized coarse aggregates with a particle size range of 4.75–9.5 mm and a target porosity of 20%.
Three representative w/c ratios were selected for evaluation: 0.25, 0.30, and 0.35, which fall within the typical range (0.25–0.35) used in pervious cement concrete applications. For each ratio, paste–aggregate mixtures were prepared and assessed based on both qualitative observations and quantitative mechanical and permeability testing. The aim was to determine a w/c ratio that achieves adequate workability and uniform paste coating while preserving the designed pore structure and strength.
The differences in the mixture states under the three w/c ratios are shown in Figure 1.
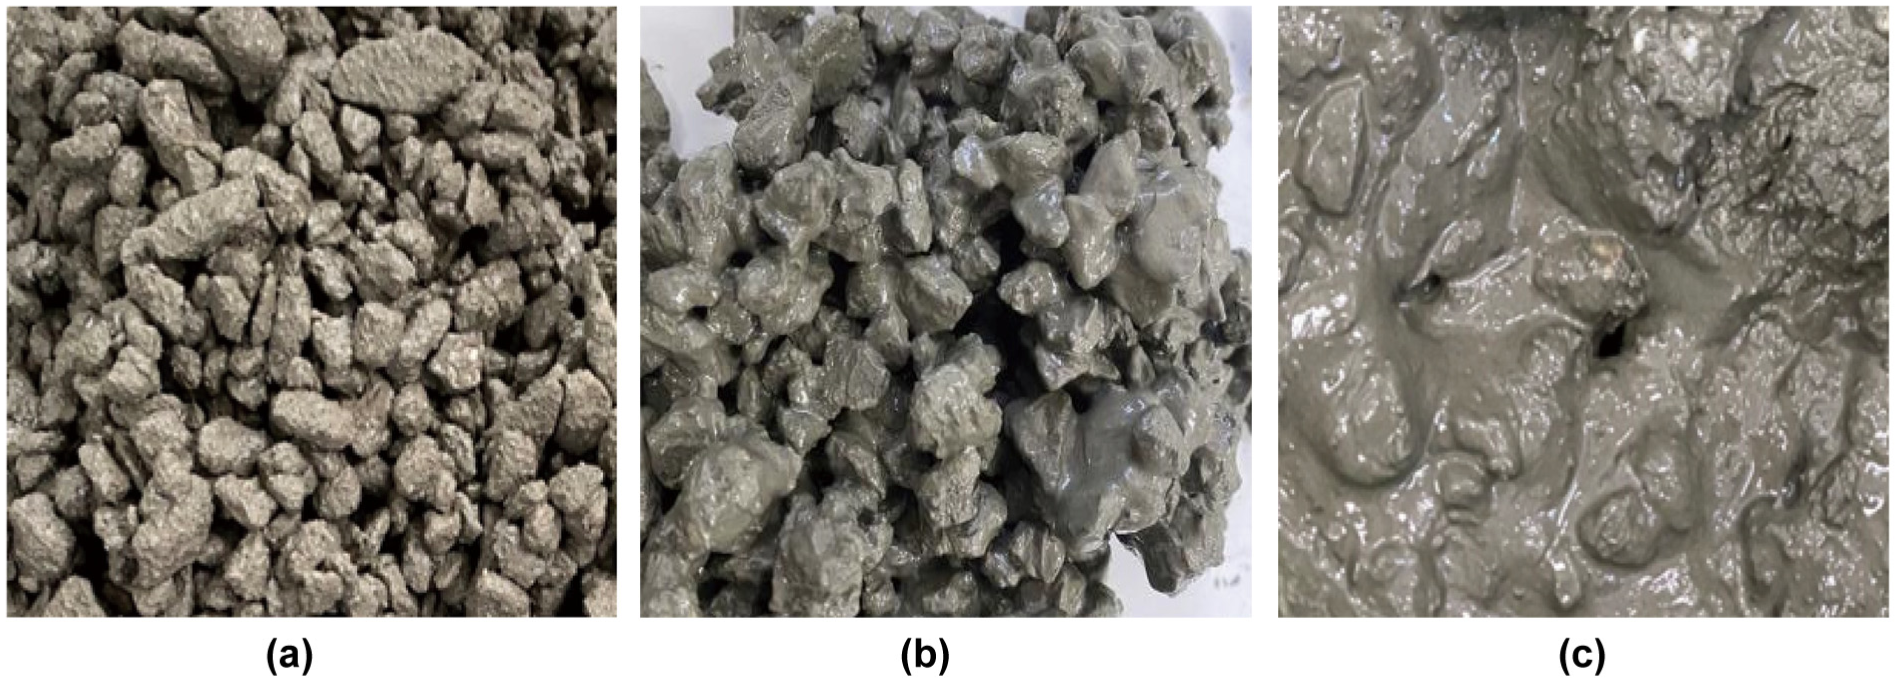
Workability evaluation of pervious concrete with different water-to-cement ratios: (a) 0.25, (b) 0.3, and (c) 0.35.
Based on the analysis of the coating uniformity of the cement paste on coarse aggregates, as well as the paste consistency and adhesiveness, the following observations were made:
1) At w/c = 0.25, the mixture was dry and stiff, and the paste lacked sufficient moisture for uniform hydration and coating. As shown in Figure 1a, the aggregate surfaces were irregularly coated with dry patches of cement paste, indicating poor workability and potential for weak interfacial bonding.
2) At w/c = 0.35, the paste exhibited high fluidity, but its adhesive capacity was significantly reduced. As shown in Figure 1c, although the mixture was easy to mix and place, a portion of the cement paste flowed into the interconnected pore network, partially clogging the voids and reducing the effectiveness of the pervious structure.
3) At w/c = 0.30, the paste demonstrated balanced behavior. It possessed moderate fluidity and good adhesion, enabling even and continuous coating on the aggregate surfaces without blocking the pore structure, as observed in Figure 1b. This ratio provided optimal workability and microstructural cohesion.
The compressive strength and permeability coefficient of pervious concrete specimens with three different w/c ratios were tested; the testing methods are described in Experiment Performance Tests
As shown in Figure 2, the results show a non-linear relationship between w/c ratio and both mechanical and hydraulic performance. As the w/c ratio increased from 0.25 to 0.30, compressive strength increased because of improved coating uniformity and paste bonding. However, further increases to 0.35 led to a decline in strength, likely because of pore clogging and reduced paste stiffness. A similar trend was observed in permeability: it decreased slightly from 6.68 mm/s at w/c = 0.25 to 6.27 mm/s at w/c = 0.30, but dropped significantly to 5.03 mm/s at w/c = 0.35, indicating that excessive paste flow led to substantial blockage of the interconnected pores.
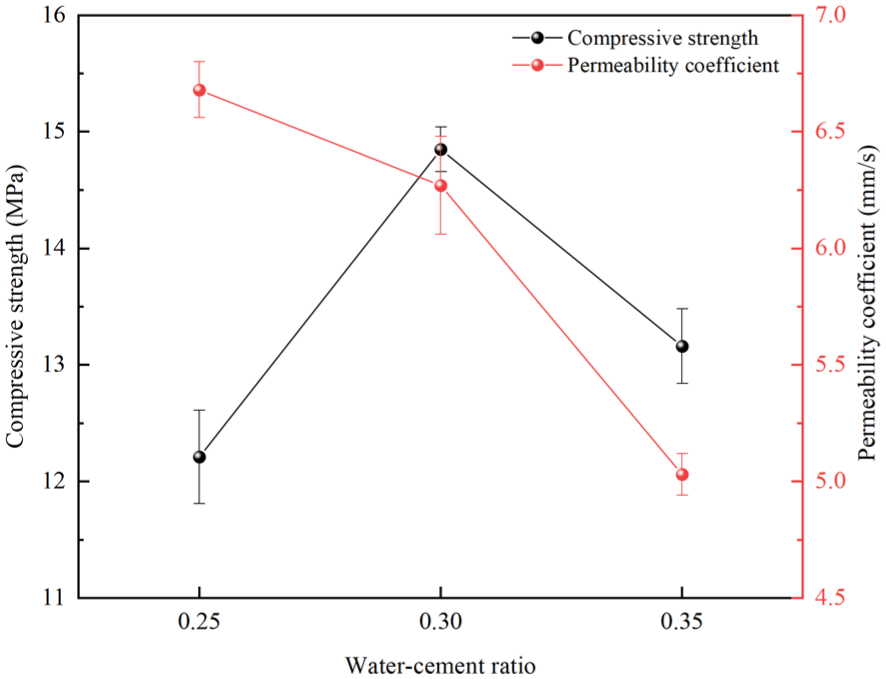
Compressive strength and permeability coefficient of permeable concrete with different water-to-cement ratios.
These results confirm that w/c = 0.30 offers the most balanced performance for strength and permeability. The selected ratio enables sufficient paste mobility for aggregate coating without excessive bleeding, maintaining the integrity of the designed pore structure.
Calculation of the Specific Surficial Area for Coarse Aggregate
In this study, coarse aggregates are considered as spherical particles when calculating:
Single particle surface area:

Single particle volume:

Single particle mass:

Specific surface area per particle:

Specific surface area of a certain aggregate gradation:

After calculating the specific surface area of coarse aggregate, it closely matches the value from Equation 6. Simplifying Equation 5 allows precise determination of the cement paste thickness on the aggregate surface:

where
Establishing the Thickness of Cement Paste Coating
To approximate the ideal condition where cement paste is uniformly distributed over the aggregate surface, the CT on the coarse aggregates’ surface was determined via the cement coating method. The detailed steps are as follows:
1)Preparation of Clean Aggregates
Coarse aggregates were first washed and dried to eliminate dust and moisture, which could otherwise affect coating adhesion. A fixed quantity of 300 g of dried aggregates was used per batch.
2)Preparation and Mixing of Cement Paste
A cement paste with a w/c ratio of 0.30—determined through pre-experimentation for optimal coating flowability—was mixed separately until a uniform consistency was achieved. The paste was then poured into the mixer containing the aggregates and stirred thoroughly for 2 min. As shown in Figure 3a, this ensured full surface contact between the paste and the aggregate particles.
3)Sieving to Remove Excess Paste and Stabilize Coating
After mixing, the coated aggregates were first placed on a 2.36 mm sieve and allowed to rest for approximately 2 min. This step allowed the cement paste to settle and solidify on the aggregate surfaces, forming a stable coating layer. Then, to remove any free-flowing excess paste and further refine the coating uniformity, the aggregates were passed through a second sieve corresponding to the minimum particle size of the target gradation. This two-step sieving process helped ensure that the cement paste coating remained consistent while minimizing the intrusion of surplus paste into the pore structure, thus preserving the permeability of the final concrete.
4)Mass Determination for CT Evaluation
The sieved, coated aggregates were weighed, and the mass of adhered cement paste was determined by subtracting the initial dry aggregate mass, as shown in Figure 3b. This data was used to calculate CT. The CT is computed thus:

where m1 = the mass of cement paste attached to the aggregate surface, m2 = the mass of dry aggregate, and ρ = the density of cement paste.
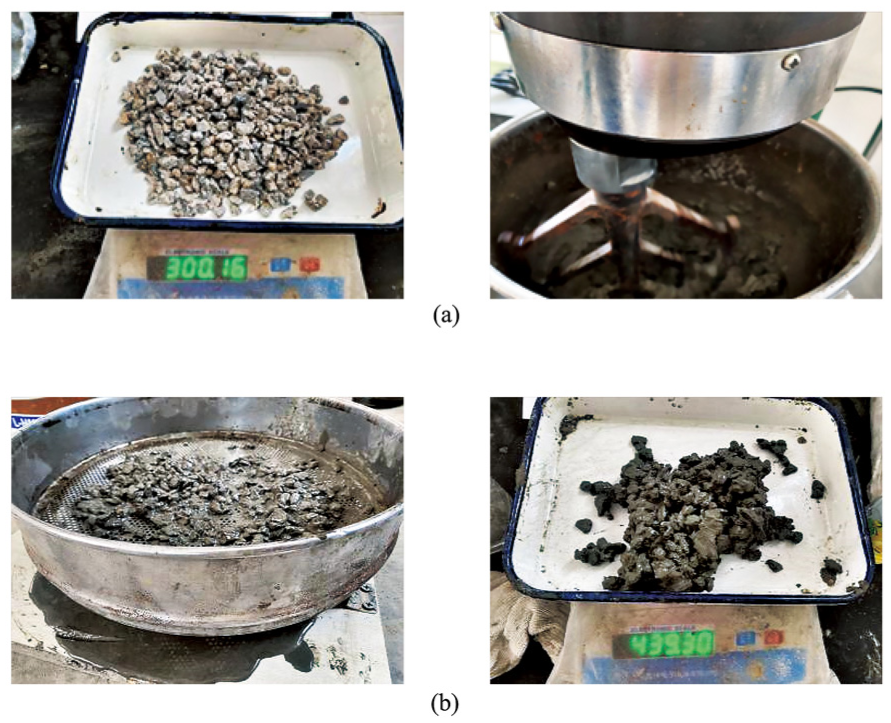
Coating thickness test process: (a) drying and stirring of stones and (b) cement paste wraps and weighing.
This method produces aggregates that visually exhibit uniform coating with minimal excess paste, helping to replicate the idealized condition assumed in the numerical model. While perfect uniformity cannot be guaranteed, this protocol minimizes coating variation and offers consistent experiment results for compressive strength and permeability. The process also reflects practical feasibility for engineering applications, providing a realistic foundation for modeling assumptions.
Determination of Cement Paste Volume
Paste volume prediction model derived from Table 1 data:

where
Combining volume conservation equations:


where


Experiment Results of S(d) and Coating Thickness
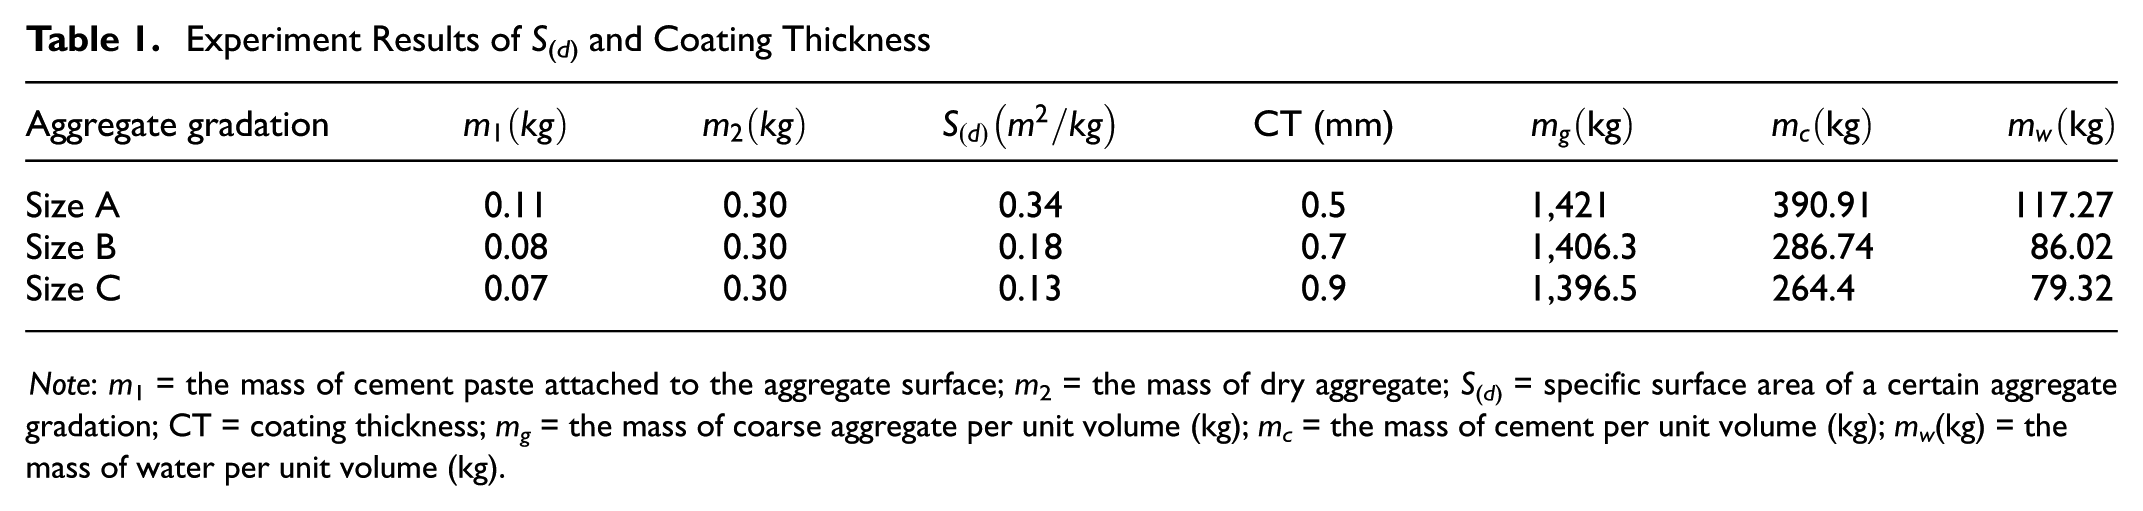
Note: m1 = the mass of cement paste attached to the aggregate surface; m2 = the mass of dry aggregate; S(d) = specific surface area of a certain aggregate gradation; CT = coating thickness; mg = the mass of coarse aggregate per unit volume (kg); mc = the mass of cement per unit volume (kg); mw(kg) = the mass of water per unit volume (kg).
Experiment Design of Mixture
To optimize the blend of three aggregate size groups (A: 4.75–9.5 mm, B: 9.5–16 mm, and C: 16–19 mm) in pervious concrete, this study adopted the simplex centroid design method, a widely used form of RSM tailored for mixture experiments. Li et al. applied RSM to analyze how aggregate size, w/c ratio, and target porosity affect the compressive strength and permeability of recycled aggregate pervious concrete ( 57 ). Compared with traditional design methods such as single-factor tests or orthogonal arrays, this approach offers several distinct advantages that make it particularly well-suited for the objectives of this study.
The simplex centroid design is specifically designed for mixture systems, where the total amount of components is constant and only the proportions vary, exactly matching the condition in concrete mix design, where the total volume of coarse aggregate remains fixed.
Unlike single-factor experiments, which isolate one variable at a time and ignore interaction effects, or orthogonal experiments, which are limited to analyzing fixed levels with less flexibility, the simplex centroid method can efficiently evaluate both main effects and interaction effects of all three aggregate sizes across a continuous design space. This capability is crucial for understanding how different combinations of aggregate sizes affect both compressive strength and permeability, which often exhibit trade-off behavior.
RSM requires fewer experiment runs than full factorial designs while still allowing the construction of accurate regression models for performance prediction. These models can then be used for visualization through contour plots and surface graphs, and, more importantly, to identify optimal mix proportions through numerical optimization techniques.
Finally, RSM methods are widely recognized in engineering and materials science as reliable tools for multi-objective optimization, making them ideal for this study’s goal of simultaneously optimizing strength and permeability. By selecting representative design points and fitting the resulting data, a global relationship between mixture variables and performance indicators can be established and used to guide practical design.
The mixture design and analysis of mixed coarse aggregates were conducted using the Design-Expert software. Mixture design requires selecting a small number of experiment points. By performing tests with different component ratios, regression equations were obtained to determine the correlation. These equations, along with their graphical representations (response surfaces), provide statistical conclusions.
For a mixture system with p components, the proportional constraints are expressed as:
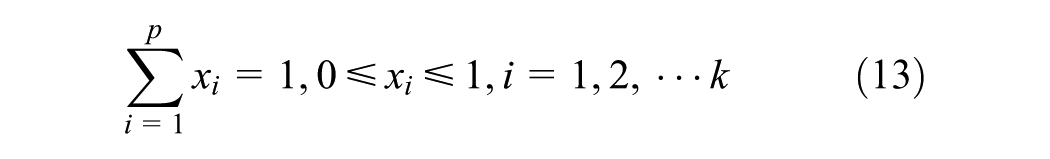
A {p, d} simplex centroid design generates 2p−1 design points, structured as follows:
The simplex centroid design method was applied to optimize the mix proportions of coarse aggregates (A, B, C). A {3,3} simplex centroid design was adopted, resulting in seven design points, as shown in Figure 4a. The software automatically adds three axial design points and four duplicate design points to enhance the model’s precision, as shown in Figure 4b. Table 2 lists these 14 design points.
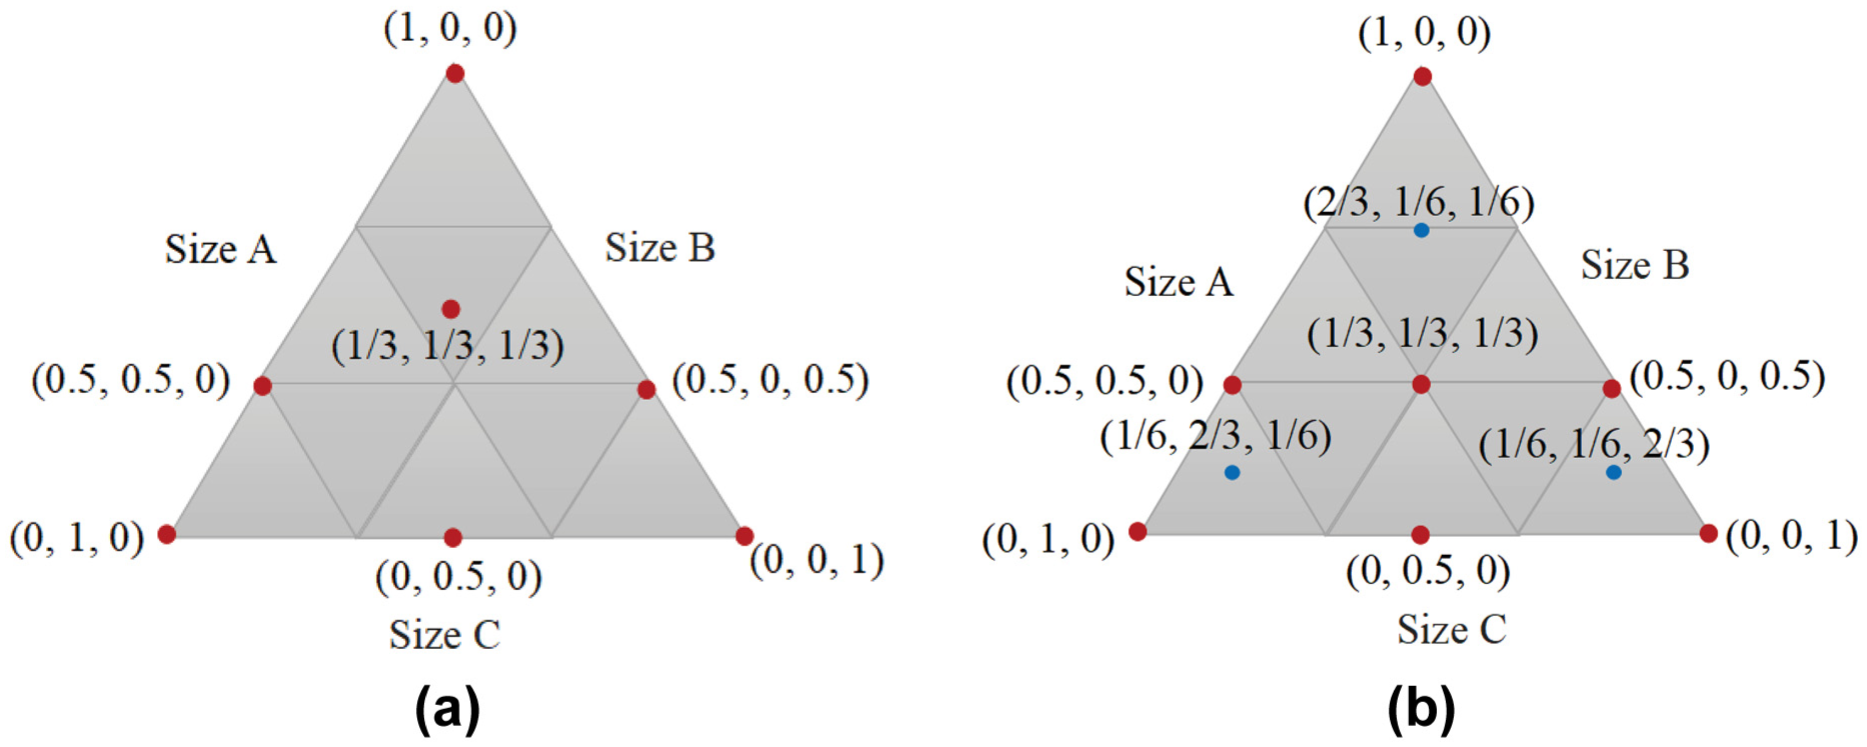
Simplex centroid design of ternary mixtures: (a) initial model and (b) accurate model.
Experiment Results and Analysis
Experiment Performance Tests
Test of Compressive Strength
To ensure consistent hydration and performance, all specimens were prepared and cured in a controlled environment. Specimens were cured in a room maintained at 20°C ± 2°C using an air-conditioning system. Regular water spraying was used to maintain sufficient ambient humidity and prevent premature drying. These conditions ensured a stable temperature–humidity environment throughout mixing, curing, and testing, thereby enhancing the reliability of experiment results.
Compressive strength was evaluated using a 3,000 kN electro-hydraulic servo testing machine per GB/T 50081-2019, with three specimens per group and averaged results.
Test of Permeability Coefficient
Permeability was measured using the constant head method (CJJT 135-2023), with three specimens per group, and the average result was recorded. The formula for calculating is as follows:

where
t = the permeation time of the specimen (s).
Response Surface Analysis
The steps for the response surface analysis are as follows:
Experiment Design: The experiment design model used in this study is the simplex centroid design.
Response Surface Model Development: Based on the experiment data, a response surface model was formulated to assess how the aggregate mix ratio affects the performance of pervious concrete.
Analysis of Variance: A binary three-phase regression model was developed to correlate the compressive strength and permeability coefficient of pervious concrete using three different aggregate sizes. Goodness-of-fit tests serve to confirm the accuracy of the equation.
Optimization of the Response Surface Model: The experiment results are optimized by selecting target values.
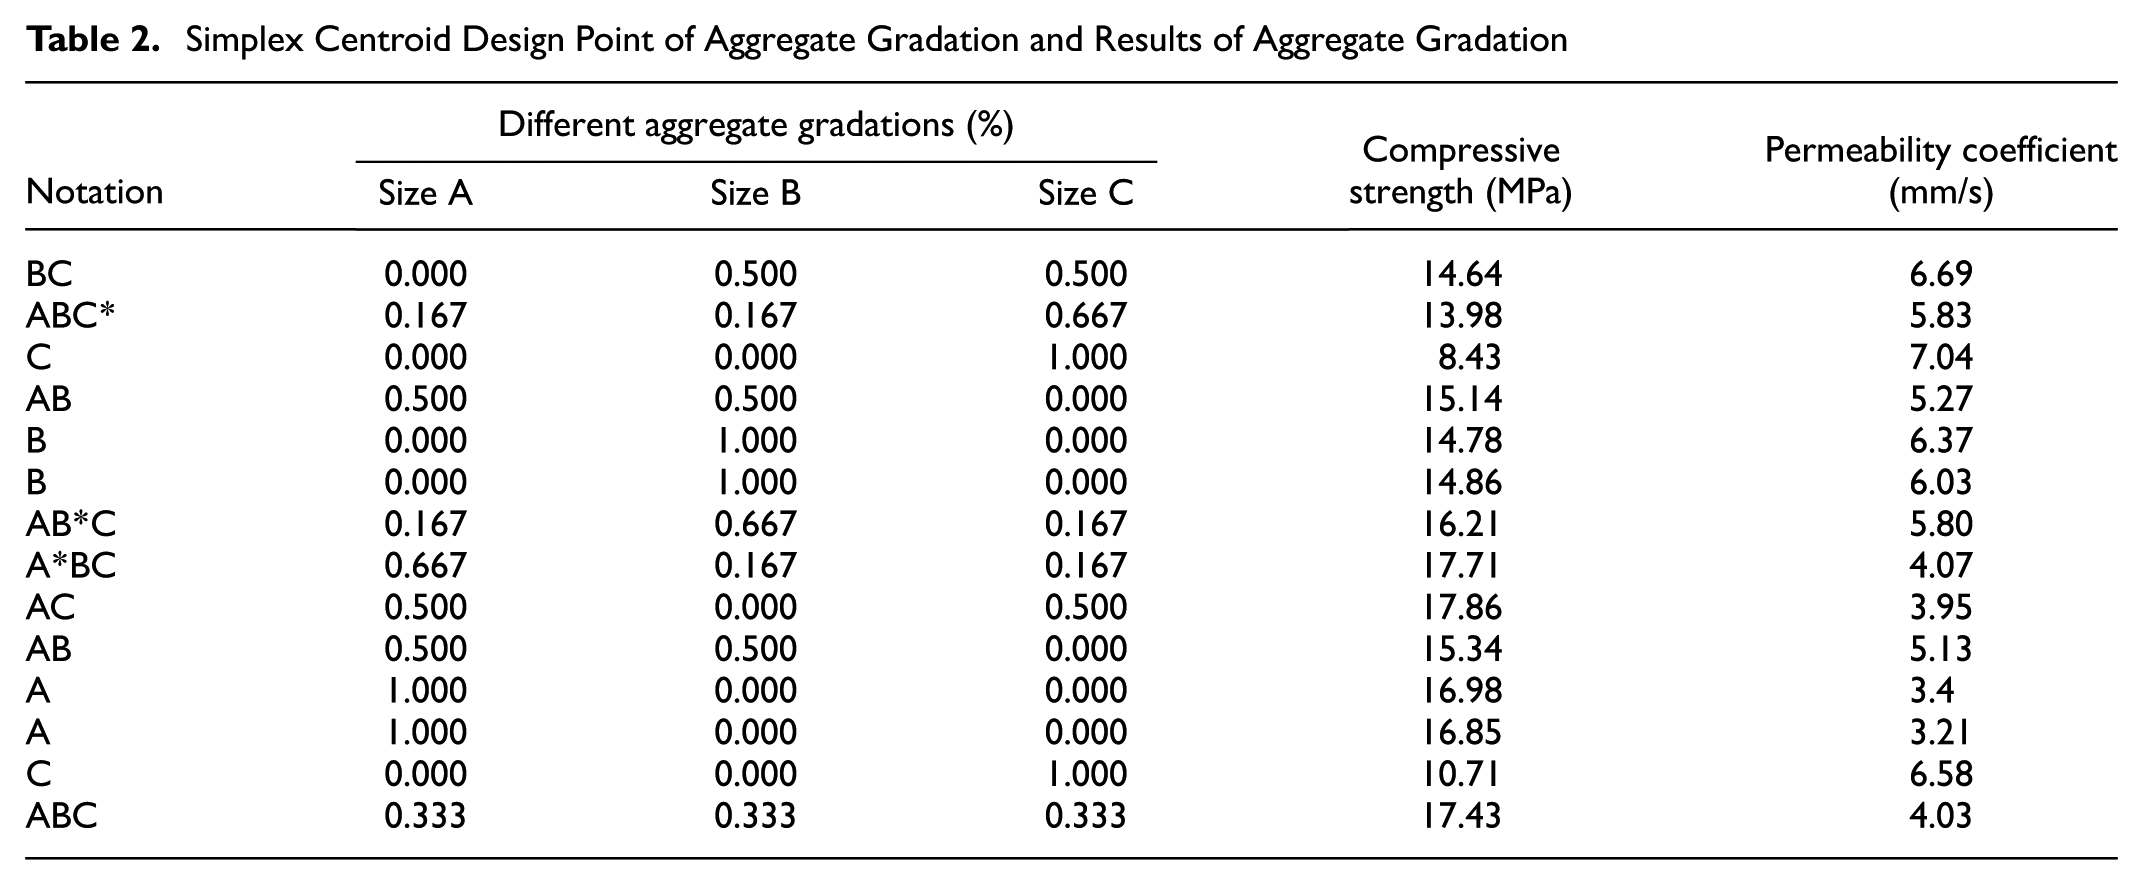
The experiment results of the simplex centroid design of coarse aggregates using multiple regression analysis in Design Expert are shown in Table 2, leading to regression models for compressive strength and permeability. The previous study focused on experiments testing the impact of different aggregate gradations on the anti-blocking performance of pervious concrete, thereby providing optimized mix design recommendations for blocking tests and simulations of permeable pavements ( 58 ).
Simplex Centroid Design Point of Aggregate Gradation and Results of Aggregate Gradation
In this study, based on prior experiment data, we employed the simplex centroid design method to optimize the optimal cement paste CT for aggregates of different particle sizes. The analysis results were further applied to construct a 3D DEM model of aggregates coated with cement paste to simulate the mechanical behavior and micro-destruction mechanisms of pervious concrete under coated aggregate structures. The innovation of this study lies in the first-time introduction of cement CT as a variable into the DEM modeling process, enabling a deeper understanding of how interfacial bonding properties influence macroscopic performance at the particle scale, thereby enhancing the physical realism and predictive accuracy of numerical simulations.
Response Surface Model of Compressive Strength
To evaluate the validity and significance of the regression model, the F-value and P-value are used. A higher F-value combined with a lower P-value signifies a more robust explanatory capability of the model and higher reliability. Table 3 shows the variance analysis of the compressive strength regression model. Its P-value is P < 1.00 × 10⁻⁴, which indicates that the model is highly significant and suitable for subsequent optimization design. The lack-of-fit term (P = 0.7183, P > 0.05) indicates no significant difference, confirming high correlation between the model and the experimentally derived data, and strong reliability.
Figure 5a illustrates the response surface for compressive strength, with contour line shapes indicating interactions. Elliptical lines suggest strong interactions, while circular cones show weak interactions. The pronounced curvature along the AC axis implies a significant interaction between A and C.
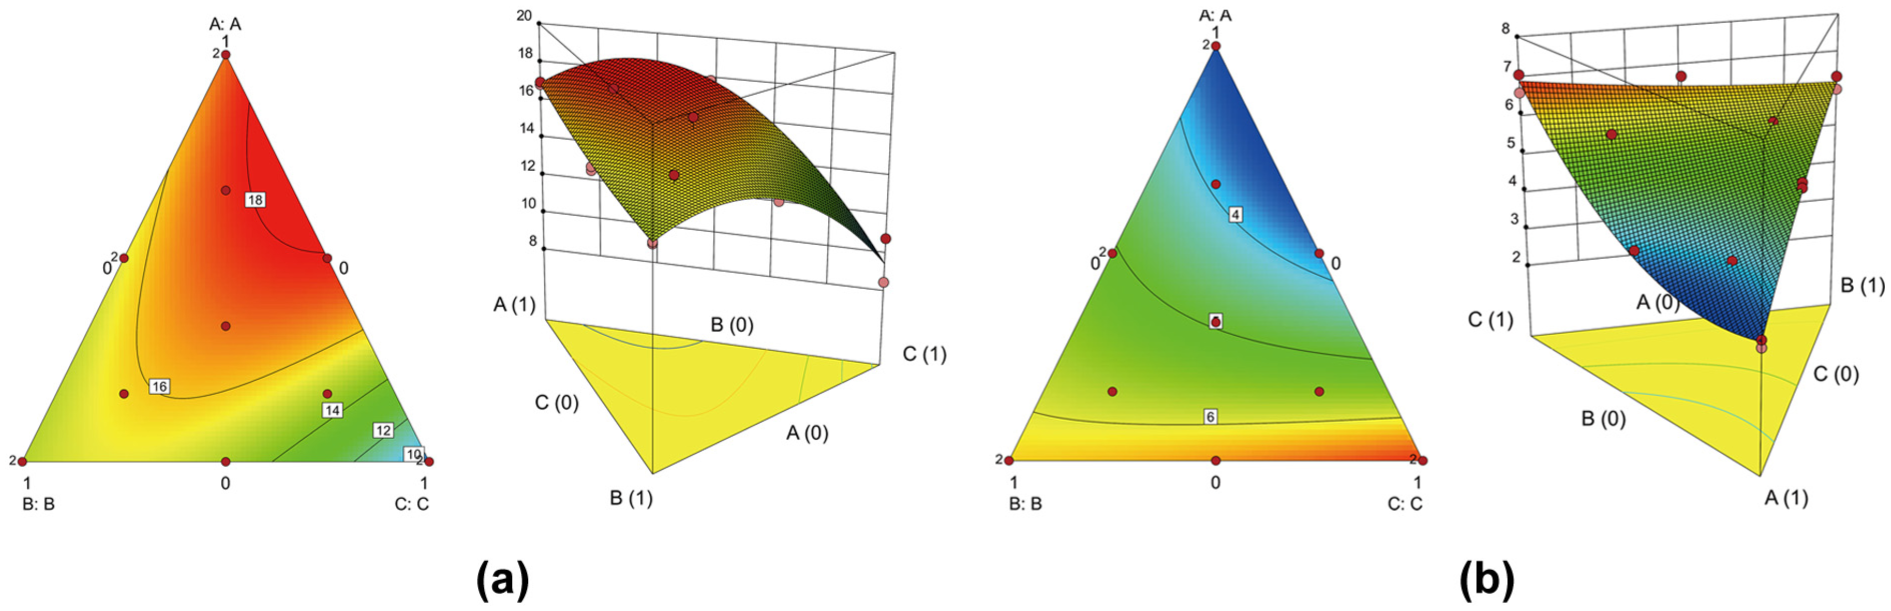
Response surface models of: (a) compressive strength and (b) permeability coefficient.
The P-values of the quadratic terms AC and BC in Table 3, are both below 0.01, reflecting their highly significant impact on the F-value. The P-value for the AC term is 0.0001, the smallest, which means the interaction between A and C exerts the greatest impact on compressive strength. According to Equation 15, each unit increase in AC corresponds to an increase of 18.93 MPa in compressive strength. This effect is attributed to smaller aggregates filling the voids between larger ones, thereby reducing inter-aggregate pores and enhancing compressive strength. The effect of the AB term on compressive strength is comparatively lower significant strength.
Results of Analysis of Variance for the Compressive Strength Response Model
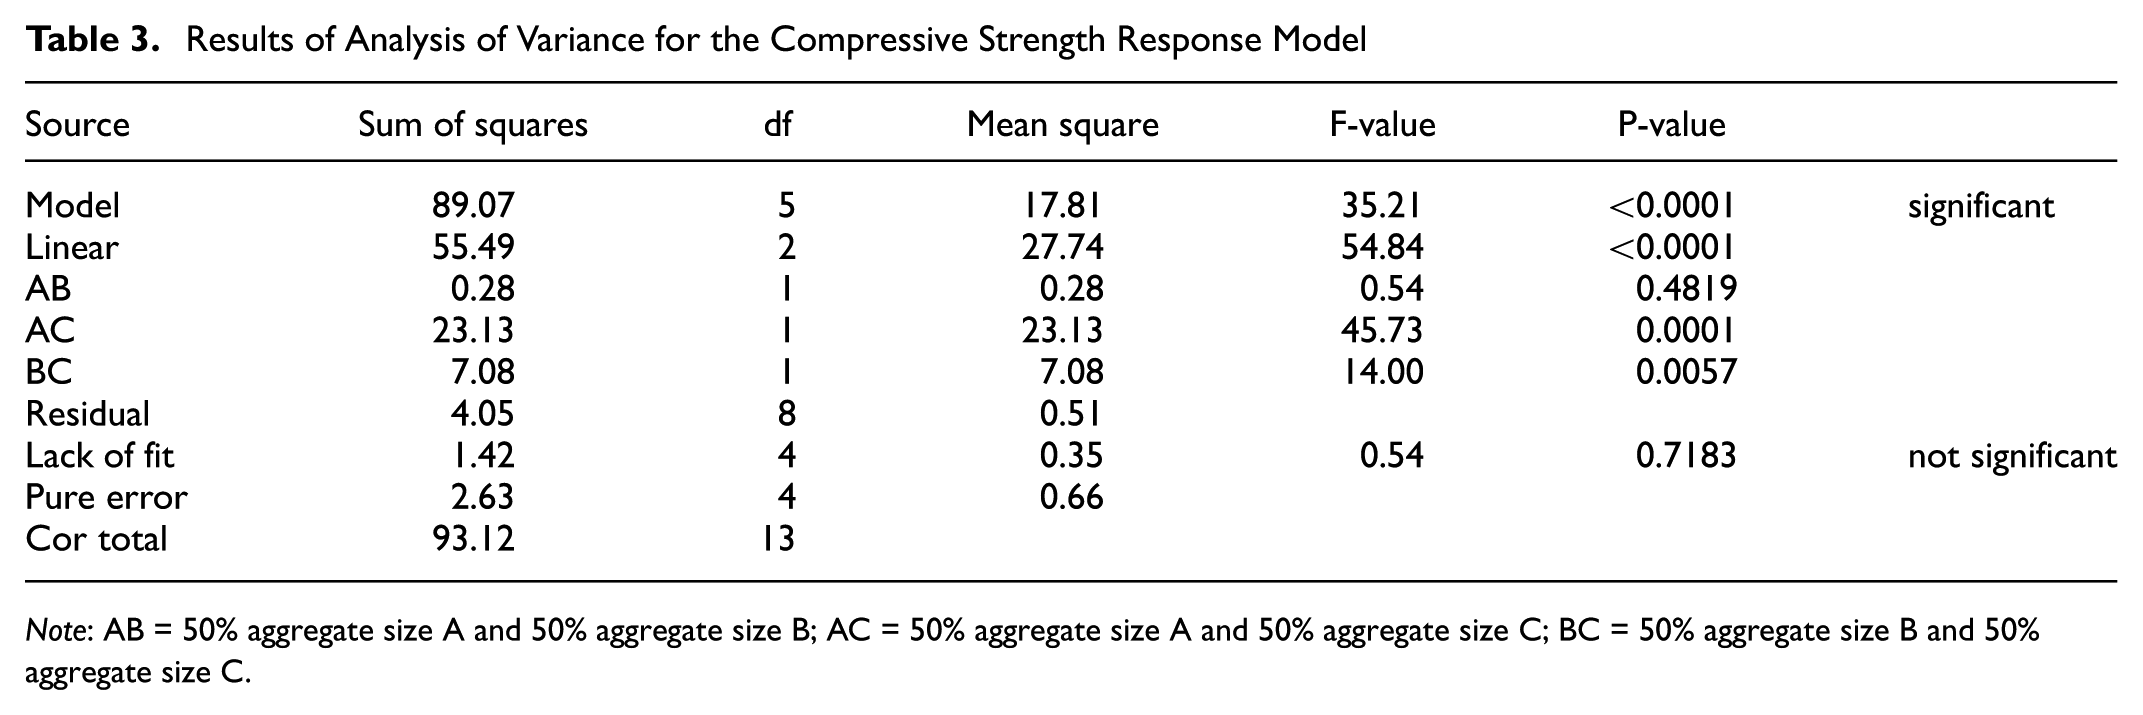
Note: AB = 50% aggregate size A and 50% aggregate size B; AC = 50% aggregate size A and 50% aggregate size C; BC = 50% aggregate size B and 50% aggregate size C.
One primary reason for the higher strength observed in mixtures containing smaller aggregate sizes is the enhanced packing density and interlocking effect. Fine aggregates (size A: 4.75–9.5 mm) can effectively fill the voids between larger aggregates (size C: 16–19 mm), forming a more compact and mechanically stable skeleton. This interlocking improves internal load transfer, restricts aggregate movement under loading, and delays crack initiation, thereby enhancing compressive strength. As the content of small-sized aggregates increases, the internal structure becomes denser, contributing to better mechanical integrity.
In our experiment results, as the particle size decreases, the specific surface area of the aggregate increases, leading to a more extensive contact interface between the cement paste and aggregates. This promotes a denser ITZ network and improves load transfer efficiency between particles. On a microscopic level, the smaller aggregates fill voids more effectively, forming a more continuous load-bearing skeleton. This reduces local stress concentrations and delays crack initiation.
As shown in Table 4, the model’s predicted R2 value (Pred R2) is 0.96, indicating a high level of agreement between the predicted and observed values. The adjusted R2 (Adj R2) of 0.93 means the regression model explains 93% of the response value variation. Also, the small gap between the adjusted R2 and predicted R2 (0.03 < 0.20) shows the model effectively handles process-related problems The Adeq Precision value of 18.23 (>4) indicates that the model is reasonable, and the C.V. of 4.72% (<10%) shows the experiment’s high precision and reliability.
The regression model for 28-day compressive strength (f28d) is expressed as Equation 15:
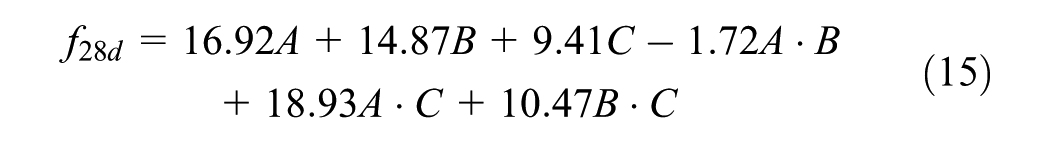
Figure 6a shows points near the line, indicating small residuals and a good fit. Figure 6b and c reveal no residual pattern and close alignment of measured and predicted values, confirming the model’s applicability.
Error Analysis Results of the Regression Equation of Compressive Strength and Permeability Coefficient
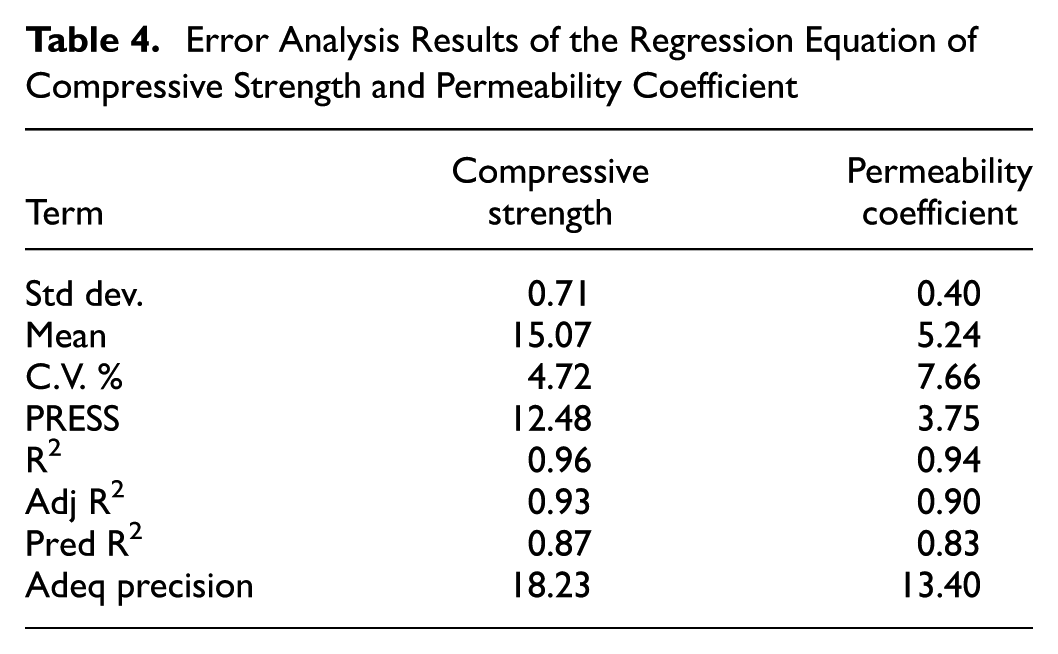
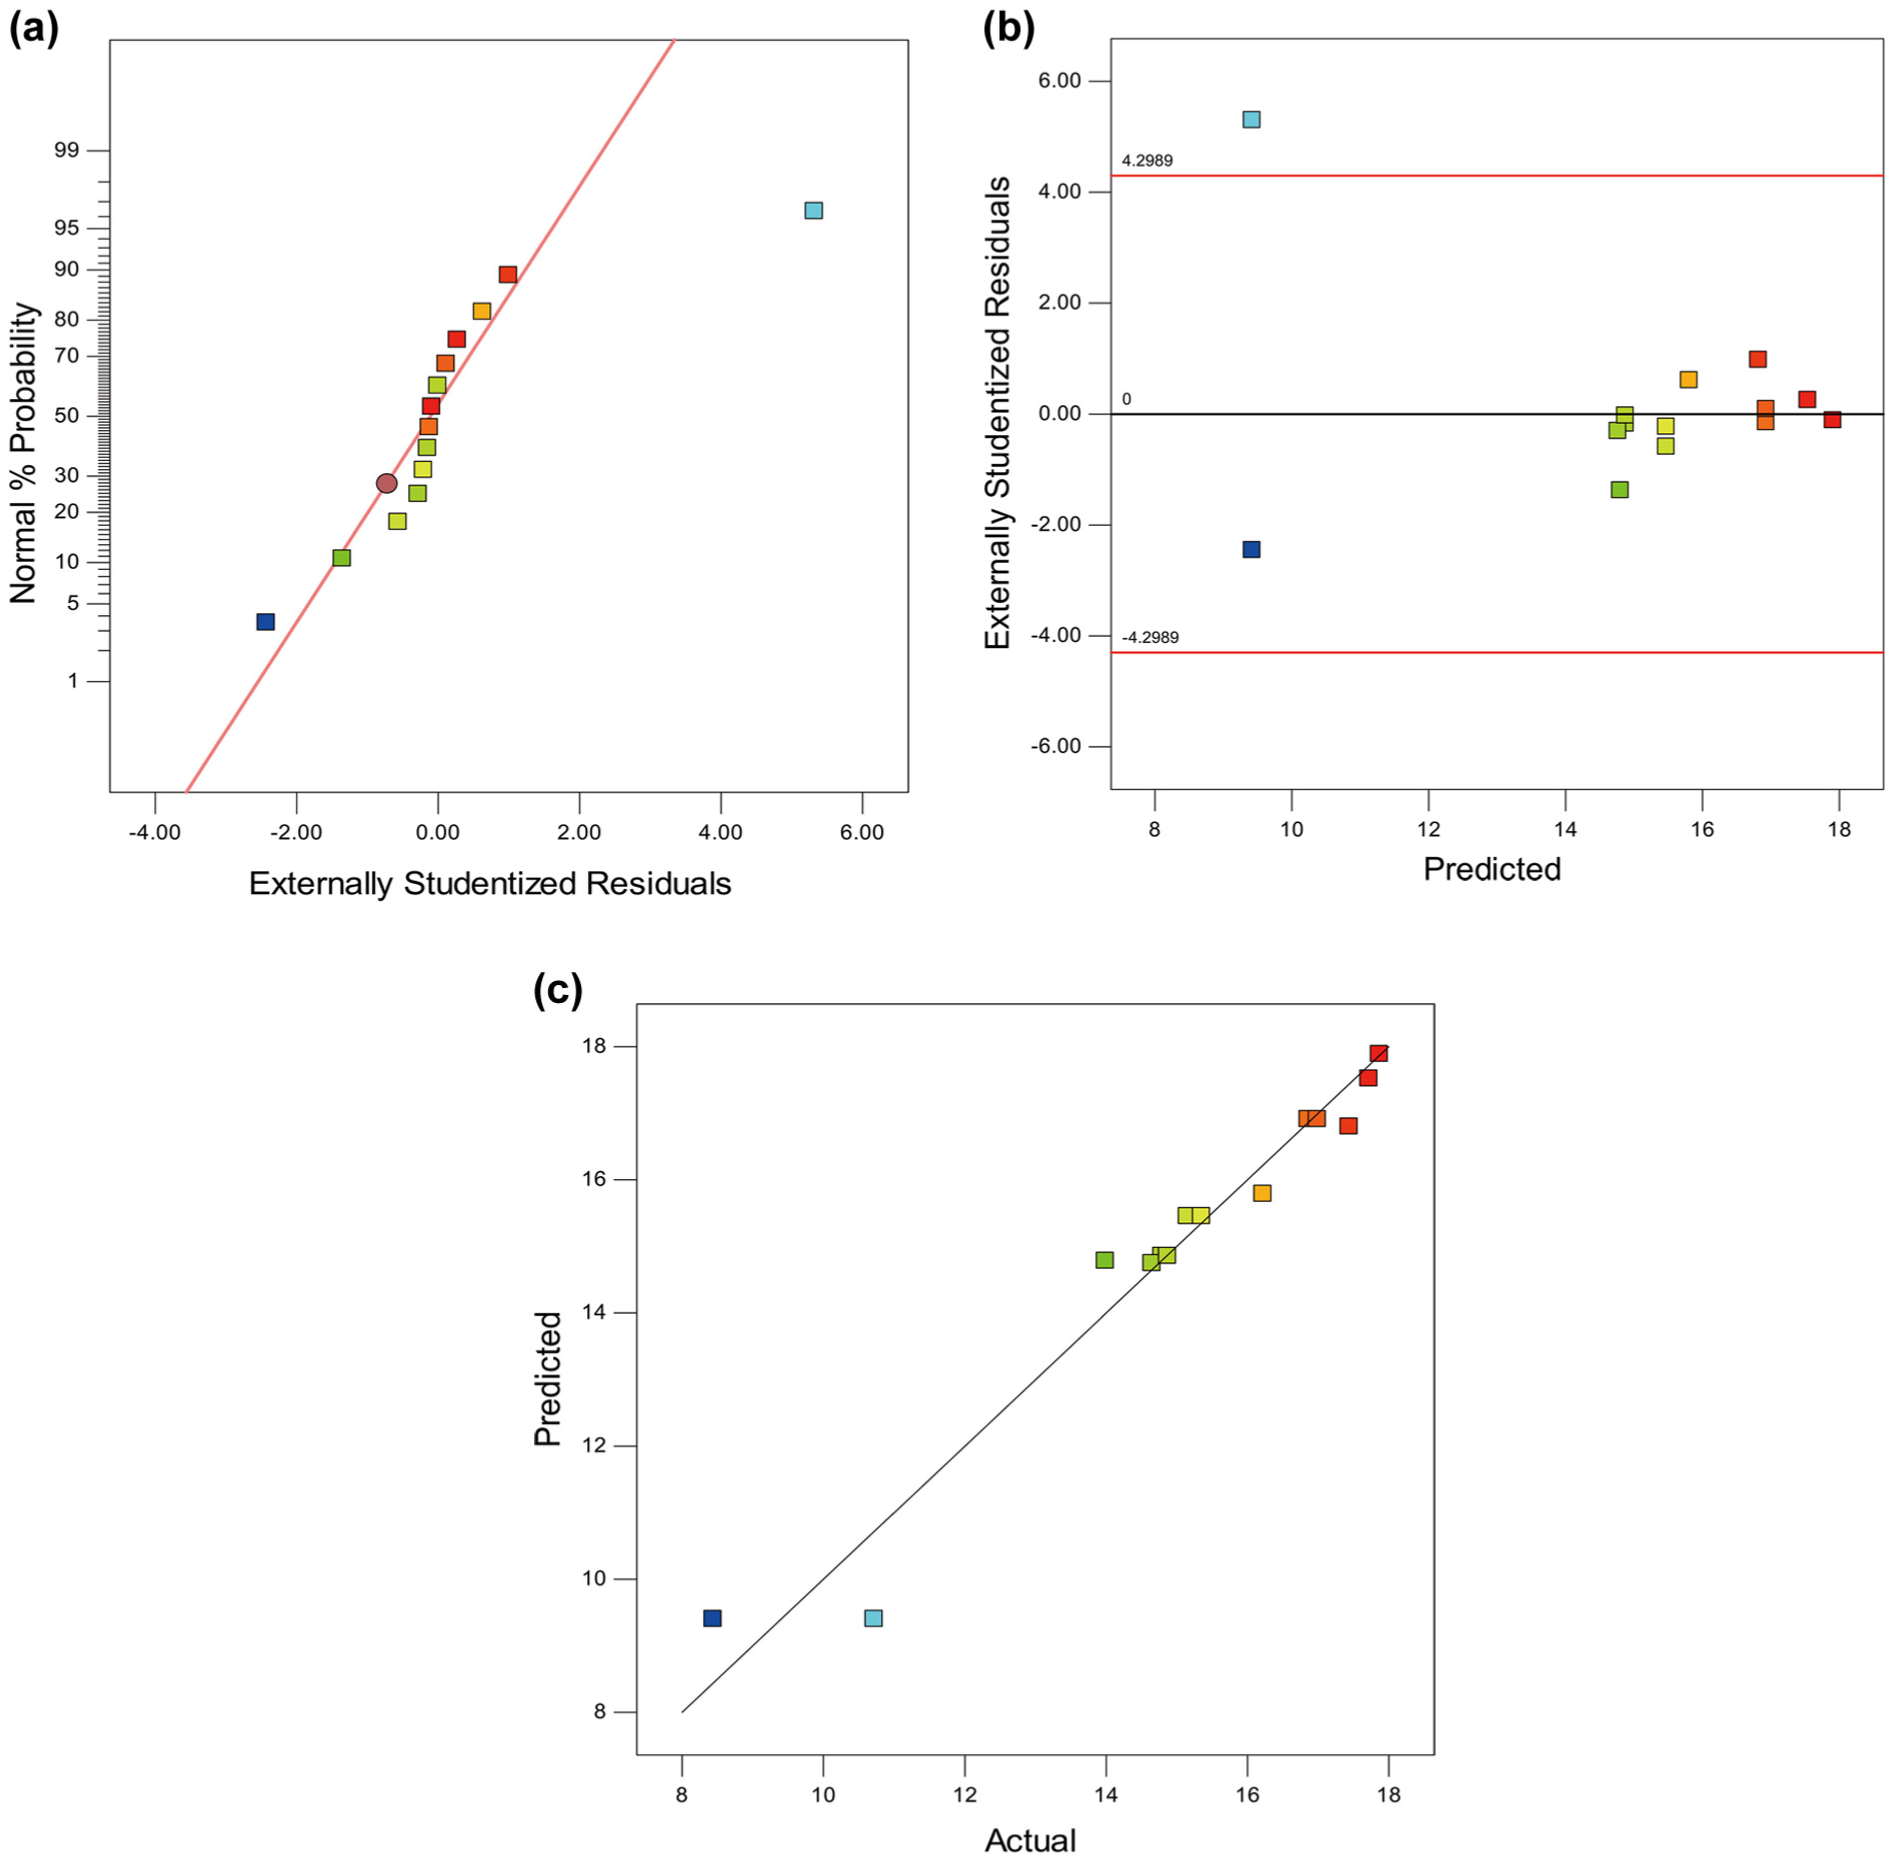
(a) Normal probability distribution of residual, (b) predicted value and residual distribution, and (c) distribution of measured and predicted values.
Response Surface Model of Permeability Coefficient
The regression model fitting formula of the permeability coefficient Kt is shown in Equation 16:
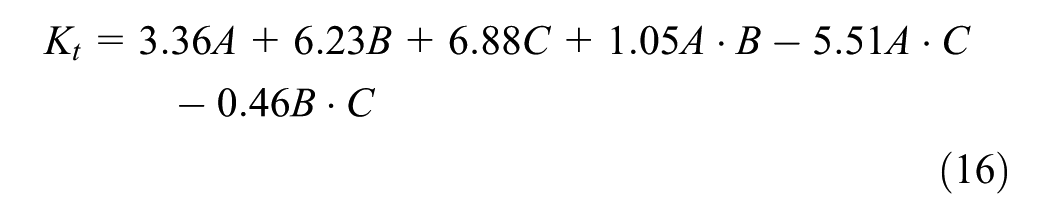
Table 4 shows the variance analysis of the permeability coefficient regression model, with an F-value of 56.66 and a P-value of 1.00 × 10⁻⁴ (P < 0.05). indicating the model’s significance and effectiveness. The P-value for the lack-of-fit term is 0.0594 (P > 0.05), suggesting a significant correlation between the experiment data and the model, thus making the model reliable. Table 6 shows a Pred R2 of 0.94, indicating a strong alignment between predicted and actual values. The Adj R2 of 0.90 demonstrates that the regression equation accounts for 90% of the variability in response. An Adeq Precision of 13.40 (>4) indicates model robustness, while a C.V. of 7.66% (less than 10%) suggests high experiment accuracy and reliability.
Figure 5b shows the 3D response surface and contour plots based on the fitted permeability coefficient model. The 3D response surface plot reveals a steeper surface along the mixed aggregate AC axis, while the surfaces along the AB and BC axes are more gradual. This suggests that, for permeability, the effect of mixing aggregates with A and C particle sizes is more pronounced. The contour plot shows denser lines along the AC axis, indicating that the AC mixed aggregate significantly influences the permeability coefficient. Along the AC axis, as the proportion of C increases, the permeability of the pervious concrete improves, reaching its maximum when the proportion of C is 1.
The better bonding between A and C aggregates enhances compressive strength, which in turn leads to a reduction in the permeability coefficient. The denser packing structure also results in reduced pore size and lower pore connectivity. While this contributes positively to strength, it negatively affects permeability. The reduction in void space restricts fluid flow, as observed in the decreased permeability coefficients for smaller-aggregate mixes.
Optimization and Verification of the Model
Using Design-Expert software, the response surface model was globally optimized by considering the corresponding variable weights and upper and lower limits in actual engineering applications. The test parameters were further optimized using the experiment outcomes and model fitting. The 28-day compressive strength failed to meet the required criteria. The optimized solution for compressive strength and its corresponding predicted values were selected and verified by experiment.
Under the condition of ensuring good permeability, the compressive strength reached its maximum value. Thus, its weight was set to the maximum value of 5+, with the compressive strength range set to f28d ≥ 18.0 MPa and the permeability coefficient range set to Kt ≥ 3.21 mm/s.
The optimal mixed aggregate ratio is size-A:size-C (A:C) = 7:3. Based on this ratio, CT, and specific surface area, the required specifications were calculated. The comparison of results shows that the relative and absolute errors for compressive strength are 4.75% and 0.93 MPa, respectively, while the relative and absolute errors for the permeability coefficient are 4.4% and 0.15 mm/s, respectively. All relative errors are within 5%, indicating that the optimized results from the response surface design can effectively predict the experiment data for pervious concrete with high accuracy.
Analysis of Cement Paste CT
To ensure that pervious concrete meets the required pavement performance standards, CT must be optimized. Based on the optimal mixed aggregate ratio (A:C = 7:3), the CT ratio factor (ki) is introduced to quantify CT. By examining the relationship between CT and the performance of pervious concrete, the optimal CT (OCT) that meets the pavement performance requirements of pervious concrete is determined. The cement paste thickness (CT i ) of a certain aggregate size is as shown in Equation 17:

The values of ki are 0.6, 0.7, 0.8, 0.9, 1.0, 1.1, 1.2, 1.3, and 1.4, where i = 1, 2… 9.
The cement and water requirements for each group were calculated based on a fixed mixed aggregate ratio, different CTs, and specific surface areas. After curing the test specimens for 28 days, their performance was tested, with the results shown in Table 5. Figure 7 shows the appearance of pervious concrete specimens under different ki values. As ki increases, the mortar thickness increases proportionally, and the compressive strength also increases accordingly. This is because, as the cement mortar thickens, some excess mortar fills the voids between the coarse aggregates, increasing the density of the pervious concrete and thereby enhancing its compressive strength. The maximum increase in compressive strength was 3.77 MPa when ki increased from 1.2 to 1.3, and the strength reached a peak value of 29.14 MPa at ki = 1.4. Meanwhile, the permeability coefficient exhibited a continuous decline with increased CT. Specifically, as ki varied from 1.3 to 1.4, there was a sharp reduction in the permeability coefficient by 1.68 mm/s, decreasing to 0.43 mm/s, which falls below the minimum standard of 0.5 mm/s specified in CJJT-2009.
Experiment Design of Coating Thickness of Cement Paste
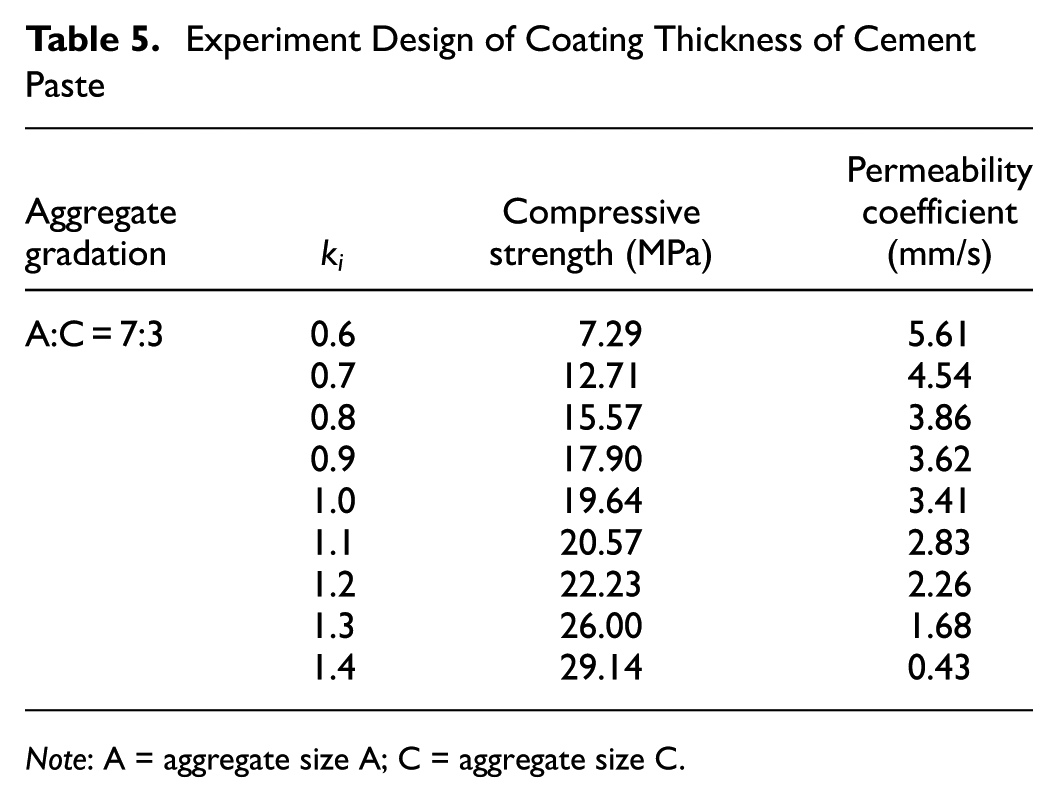
Note: A = aggregate size A; C = aggregate size C.
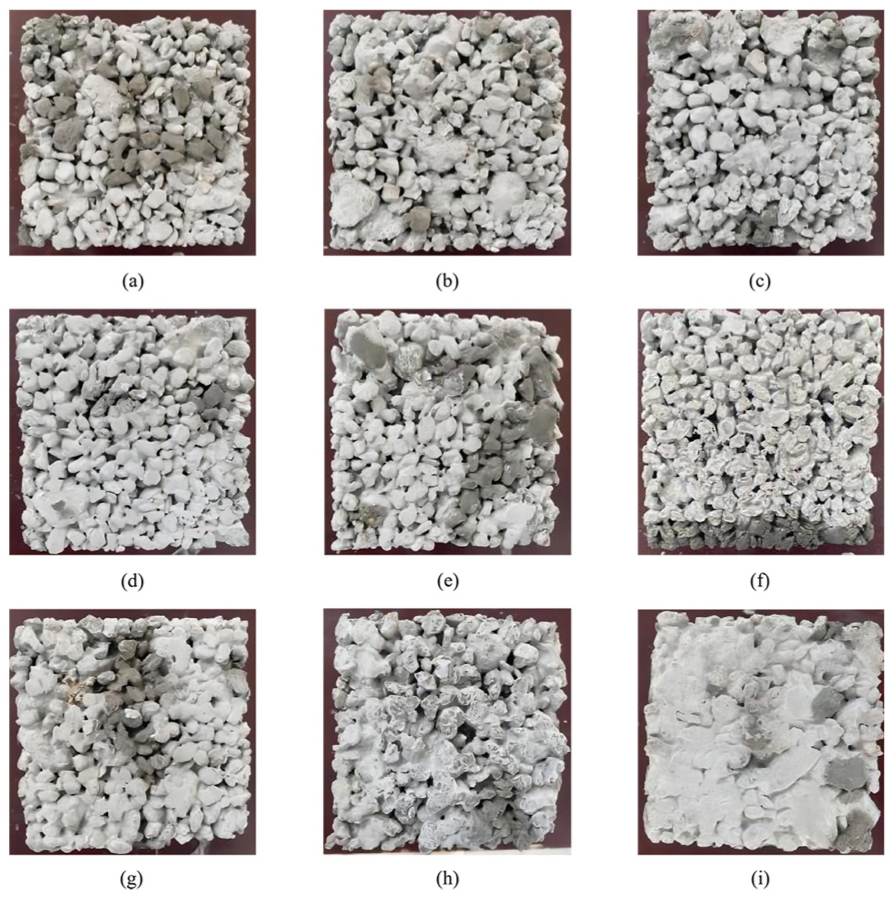
Pervious concrete specimens with different ki values: (a) ki = 0.6, (b) ki = 0.7, (c) ki = 0.8, (d) ki = 0.9, (e) ki = 1.0,(f) ki = 1.1, (g) ki = 1.2, (h) ki = 1.3, and (i) ki = 1.4.
Figure 8 illustrates the relationship between compressive strength and permeability coefficient at various ki levels. Both properties vary linearly with ki: compressive strength increases while permeability decreases inversely. High R2 values of 0.97 and 0.95 confirm a robust fit and validate the model’s predictive capability. At ki = 1.3, the permeability coefficient reaches 1.68 mm/s, meeting the minimum standard, and the compressive strength attains 26 MPa, satisfying the 25 MPa requirement for pavements.
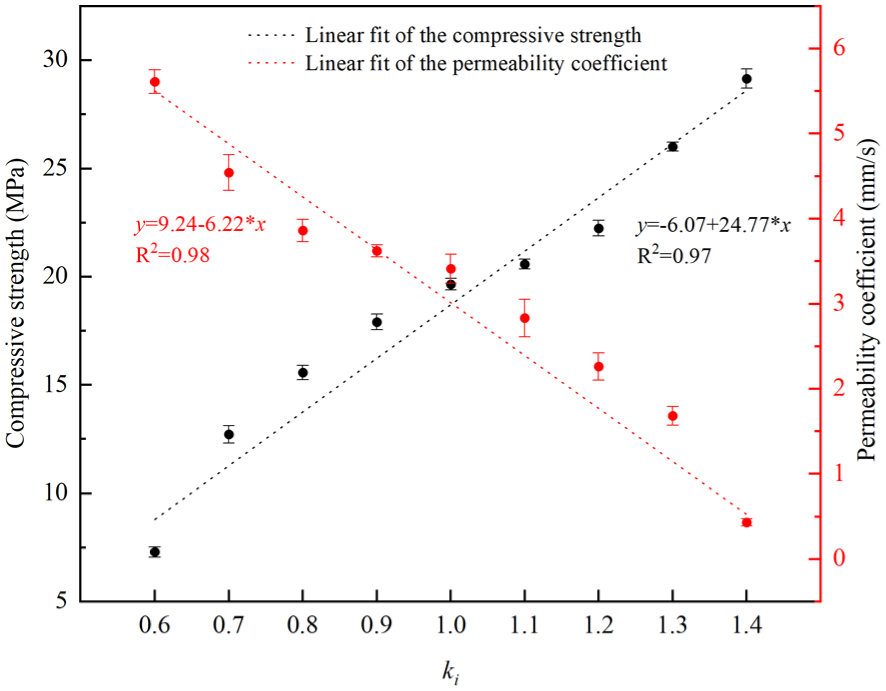
Linear fitting of compressive strength and permeability coefficient with different ki values.
Our experiment results showed that an optimal CT leads to significantly higher compressive strength. Thicker coatings enhance adhesion between aggregates, increase the contact area, and improve stress distribution throughout the structure. However, if the coating becomes too thick, excess cement paste may begin to flow into the interconnected pores, leading to partial obstruction of the water channels. As the coating becomes thicker, the bonding area between adjacent aggregates increases, improving inter-particle adhesion and stress distribution. A thicker coating also contributes to better stress bridging across the ITZ, which is generally the weakest region in concrete. Thus, specimens with thicker coatings exhibit higher strength.
However, the increase in CT has a negative impact on permeability. The paste tends to migrate and partially block the interconnected pore channels during compaction, especially when the w/c ratio is high. As a result, specimens with thicker coatings or excessive fine particles show reduced permeability, as some of the originally open pores become filled or constricted by excess cement paste.
DEM Model Design and Mechanical Testing Verification
DEM Model Development
In experiments, it is difficult to observe pervious concrete’s internal changes in real-time. To explore the failure mechanisms and runoff behaviors of the internal structure of pervious concrete in greater detail, it is necessary to establish a numerical model for simulation.
Given the complexity of the material’s internal pore network and discontinuous structure, choosing an appropriate simulation approach is critical. Traditional numerical methods, such as finite element analysis (FEA), assume material continuity and are better suited for homogeneous, isotropic materials. In contrast, DEM provides a more physically realistic framework for modeling quasi-brittle, porous materials such as pervious concrete. The key advantages of DEM over FEA in this context can be summarized as follows:
1)Model Assumptions and Structure Representation: FEA assumes material continuity and usually requires a predefined homogeneous constitutive model for stress–strain relationships. This approach is well-suited for dense, continuous, and isotropic materials, but struggles to accurately capture materials with high internal porosity, discontinuous skeletons, and complex fracture behavior.
Pervious concrete is composed of coarse aggregates loosely bonded by a thin layer of cement paste, with large interconnecting voids. Its mechanical behavior is governed more by inter-particle contact, interface bonding, and void-induced stress concentration, than by bulk material elasticity. FEA cannot easily incorporate explicit pore structures, nor does it represent contact failure or cracking between discrete particles. Furthermore, defining a unified constitutive relationship for such a highly heterogeneous system is extremely challenging.
In contrast, DEM models the material as an assembly of discrete particles, each interacting through contact forces and bonded interfaces. Fracture and deformation naturally emerge from the breakage of contacts, allowing for a realistic simulation of crack initiation and propagation, especially along interfaces such as ITZ. This approach is well-aligned with the physical mechanisms observed in pervious concrete failure.
2)Fracture and Damage Simulation: DEM naturally captures crack initiation and propagation based on contact breakage, without needing predefined crack paths. This is essential for materials where fractures develop along weak interfacial zones, which FEA cannot accurately resolve.
3)Porosity Representation: FEA typically uses homogenization or equivalent material properties to simulate porosity, which oversimplifies the behavior of pervious concrete. DEM treats each particle and pore individually, providing better resolution of pore structure and stress transmission paths.
4)Computational Trade-Off: Although DEM can be computationally demanding, it provides significantly higher fidelity in simulating microstructural failure mechanisms, making it more appropriate for the complex and discontinuous nature of pervious concrete.
PFC software was therefore selected as the simulation tool. Pervious concrete, with its granular skeleton bound by cement paste, can be regarded as a cemented granular material, making it well-suited for modeling via the particle flow method. PFC has been widely used to investigate the micromechanical behavior of granular materials and is extensively applied in geotechnical and civil engineering fields.
Coarse Aggregate Modeling
Coarse aggregates are an important component of pervious concrete, and their shape and particle size significantly affect the mechanical properties of the material. However, PFC3D cannot directly generate coarse aggregate particles with complex shapes. To create a model in PFC3D that closely resembles the real shape of the coarse aggregates, this study used the user-defined modeling program in PFC3D to import 3D graphical files to generate irregular polyhedra. Specific-sized particles were then generated inside these polyhedra to represent the coarse aggregates. The process is as follows: first, the shape characteristics of six different types of limestone aggregate were captured using a 3D scanner. After image processing, a 3D skeletal model representing the external contours of the aggregates was created, as shown in Figure 9a. Then, discrete element spheres of various sizes were randomly filled into the aggregate skeleton. After the filling process, the skeleton was removed, forming clumps that closely resembled the external shape of the aggregates, as depicted in Figure 9b. Finally, the spheres were assigned physical and mechanical properties such as density, Young’s modulus, Poisson’s ratio, and friction coefficient. A virtual 3D coarse aggregate model library was established for subsequent use in generating pervious concrete, incorporating the unique characteristics of the coarse aggregates.
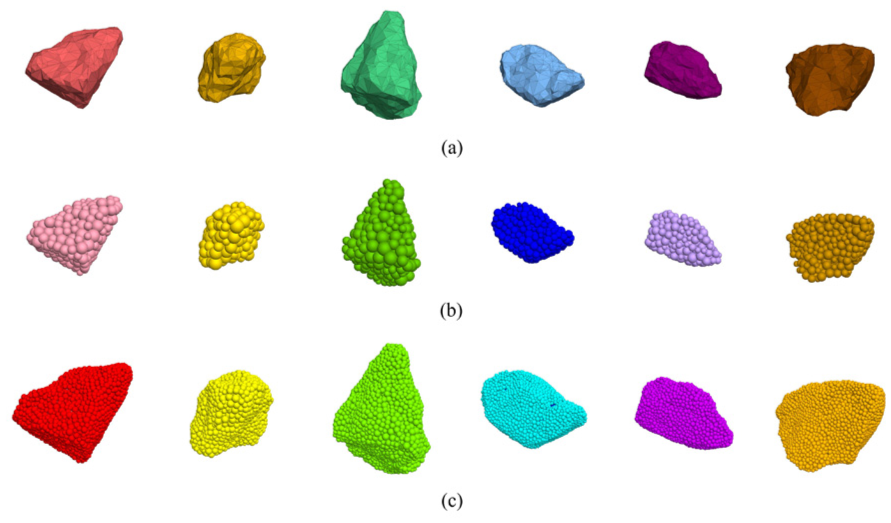
(a) Coarse aggregate 3D skeleton modeling, (b) discrete element method (DEM) modeling of coarse aggregate, and (c) DEM modeling of coarse aggregate coated cement slurry.
Modeling of Cementitious Materials
Based on the optimal CT from the experiments in Analysis of Cement Paste CT, a particle layer with a thickness of 0.65 mm is applied as the mortar surrounding the 4.75–9.5 mm aggregate model. A 1.17 mm-thick particle layer is used as the mortar coating around the 16–19 mm coarse aggregate model, as shown in Figure 9c. To balance model accuracy and computational efficiency, the particle radius and smoothness are controlled. Since the number of discrete elements affects computational efficiency, the radius of the coarse aggregate elements is set between 0.6 and 0.8 mm, while the radius of the cement paste elements is between 0.3 and 0.4 mm, with smoothness set to 150. This coarse aggregate coating model effectively restores the experiment model while improving computational efficiency.
Pervious Concrete Modeling Using Coating Method
A 100 × 100 × 900 mm box is created, inside which six different shapes of coating aggregate with particle size C are generated, ensuring adequate space for subsequent particles. Next, aggregates of particle size A and various shapes are generated, with a volume ratio of A:C = 7:3. To compress the model to the required height, a gravity field is applied in the discrete element system with a vector direction of (0, 0, −9.8), and excess aggregates are removed. Wall boundaries are then created, and the model is compressed to a height of 300 mm. The modeling process for axially compressed pervious concrete specimens with slurry is shown in Figure 10a to c . The process of specimens without cementitious materials is similar, except that the clump does not contain cementitious materials. Figure 10d and e show the comparison between granular flow models considering and excluding gelled material after converting clumps to balls.
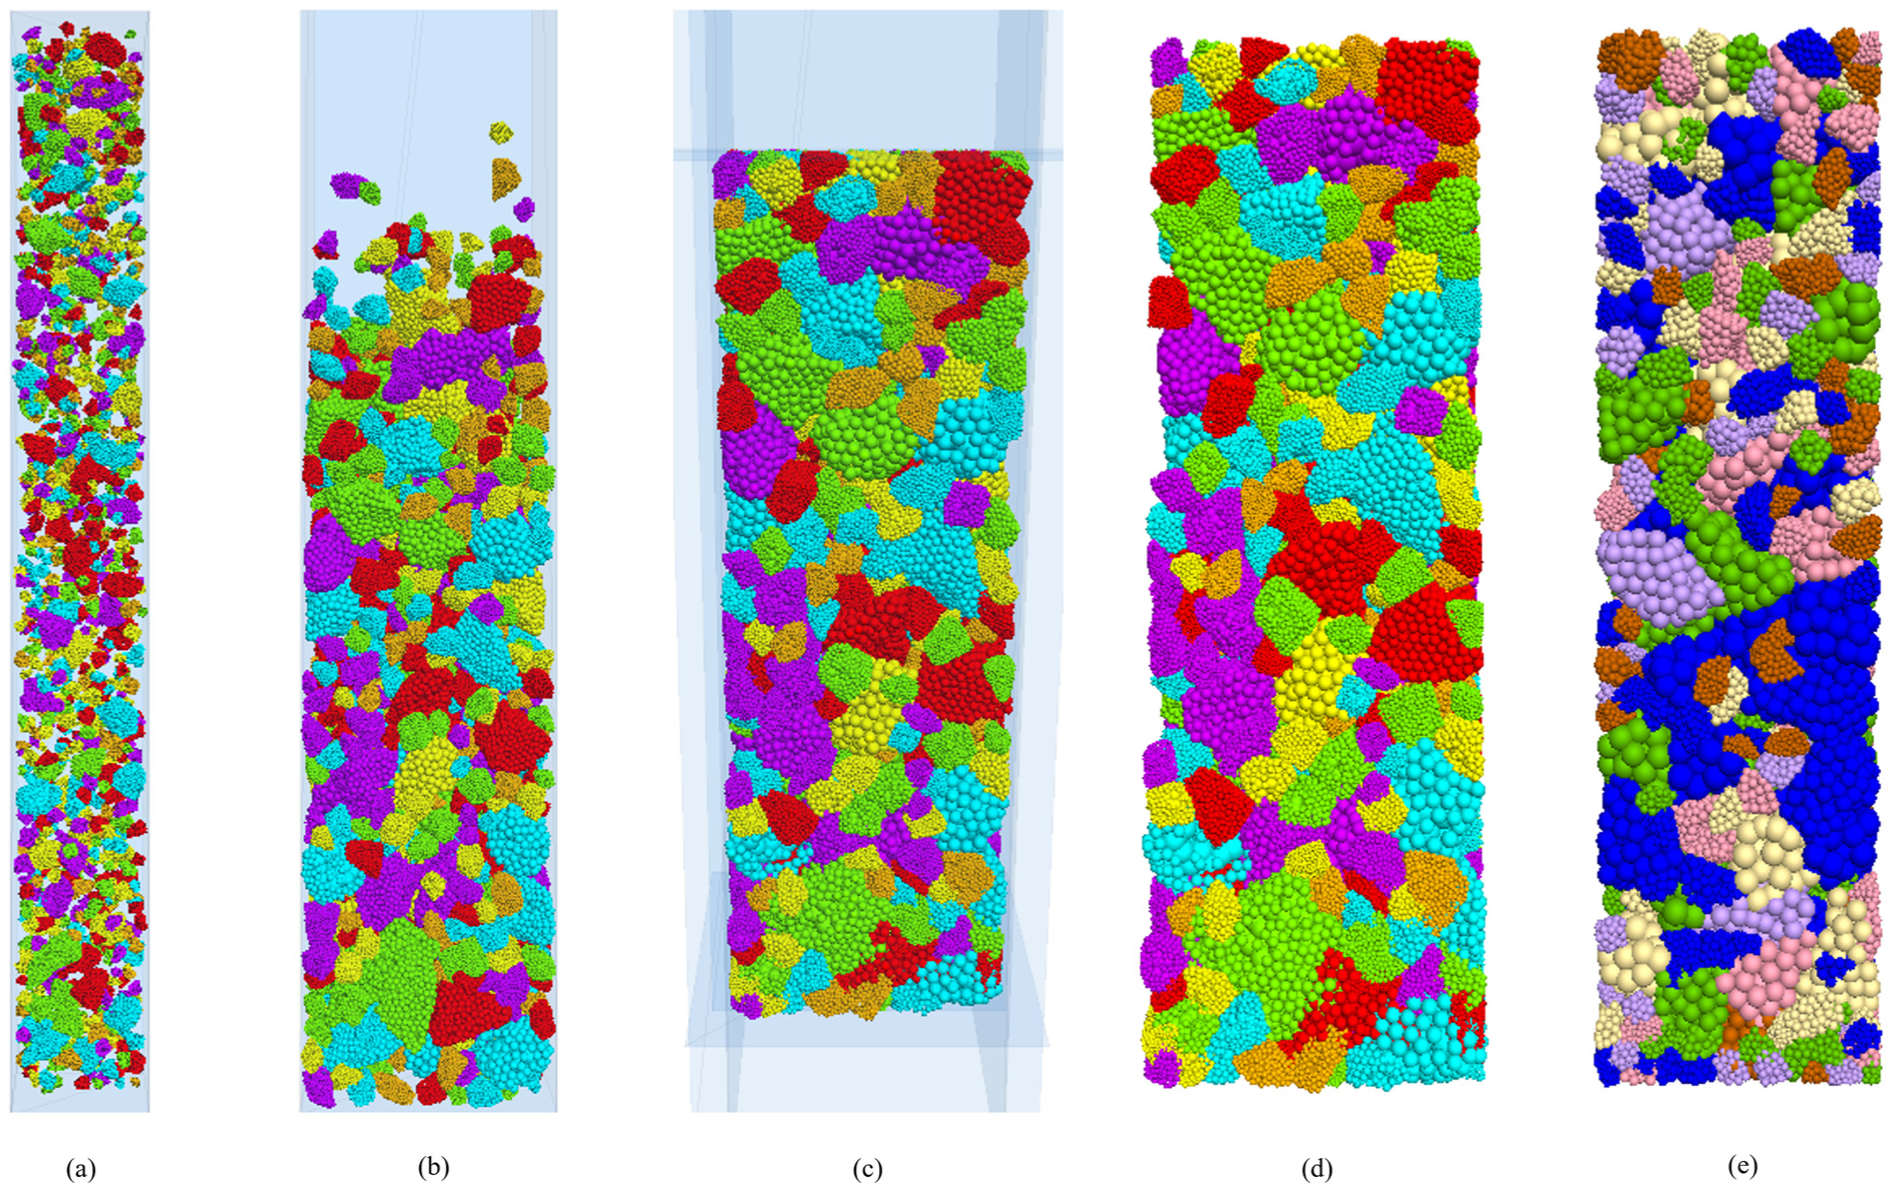
Particle Flow Code modeling process for axial compressive specimens: (a) aggregate generation, (b) aggregate accumulation under gravitational force, (c) aggregate compaction, (d) pervious concrete model with slurry, and (e) slurry-free pervious concrete model.
Contact and Parameter Settings
Selection of Contact Models
Pervious concrete is a complex three-phase composite material composed of aggregates, cementitious matrix, and weak ITZs. Containing aggregate particles and cement paste, the ITZ has cement particle distribution influenced by aggregate surface properties. Pervious concrete contains numerous inherent microcracks, and under external loading, failure typically initiates at the ITZ, the weakest region of the material. Therefore, accurately modeling the strength of this zone is essential, as it significantly affects the overall mechanical properties and failure behavior of pervious concrete.
Three main contact types were considered: 1) aggregate-to-aggregate contact, 2) cementitious material contact, and 3) aggregate-to-cementitious matrix contact. Appropriate contact models were chosen to accurately simulate the mechanical behavior of pervious concrete.
Aggregate-to-Aggregate Contact
The flat-joint model (FJM) simulates contact between coarse aggregates. It represents a bonded or frictional interface that can undergo partial failure while maintaining rotational resistance. As shown in Figure 12b, FJM discretizes the interface into small elements, which may be bonded or unbonded. When stress exceeds bond strength, local failure occurs, causing progressive interface damage. This model effectively captures aggregate interactions.
Cementitious Material Contact
PBM was used to simulate contact behavior within the cementitious matrix. It consists of elastic springs arranged on the contact plane with constant normal and shear stiffness, enabling force and moment transmission. As shown in Figure 11a, this model accurately captures the micromechanical response of cement-based materials under external loads. When the peak normal or shear stress exceeds the bond strength, the parallel bond fails, and its mechanical properties are removed from the model.
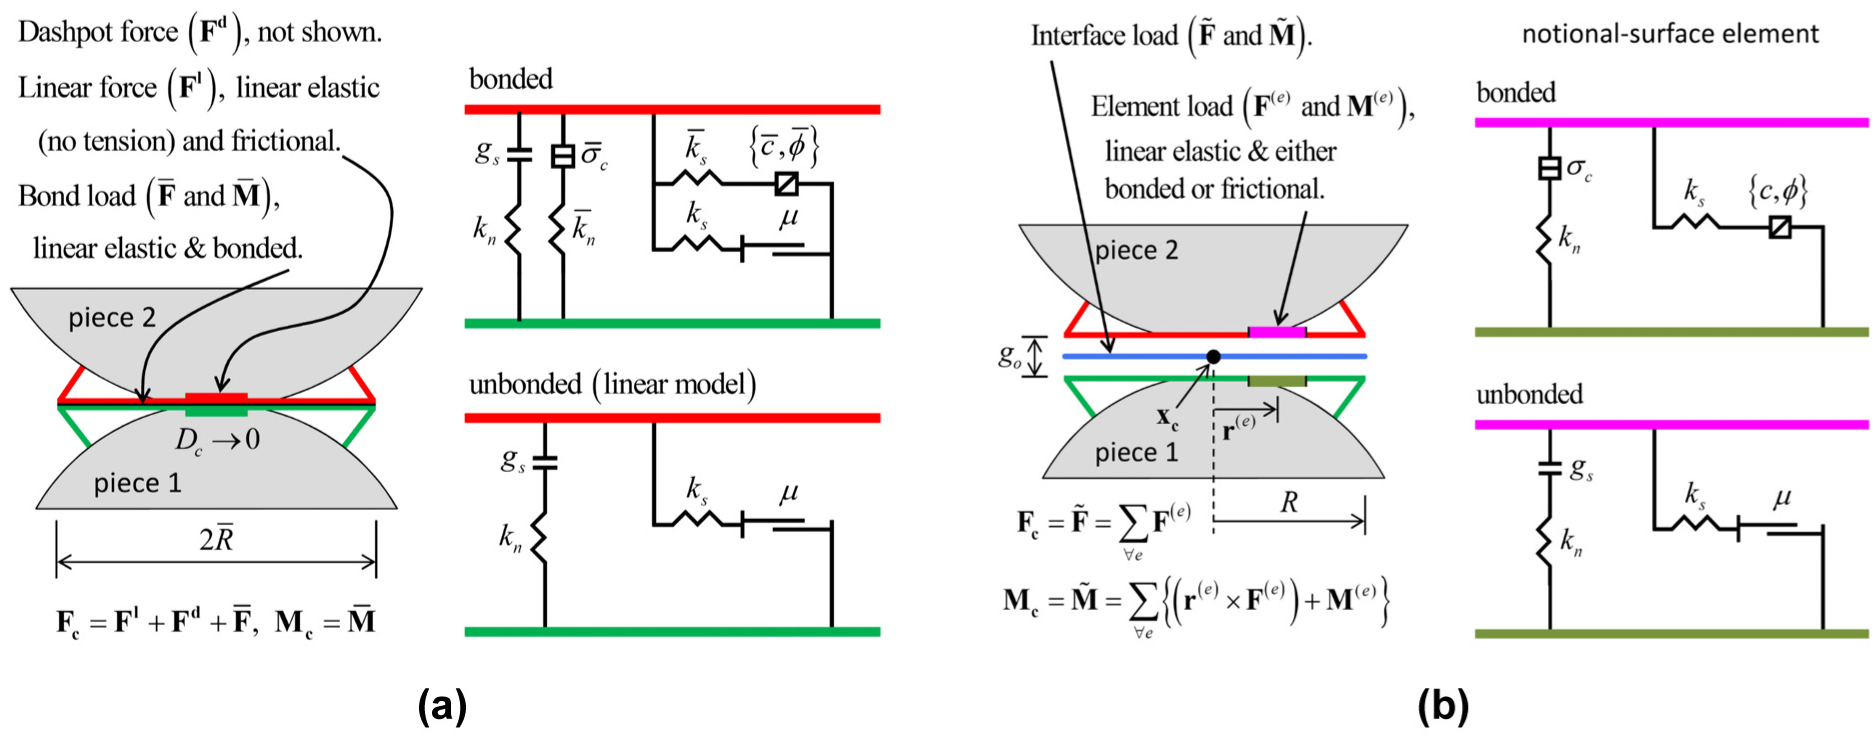
Contact model relationship diagram: (a) parallel-bond model; (b) flat-joint model.
Aggregate-to-Cementitious Matrix Contact
PBM simulates contact in cement. It uses elastic springs on the contact plane with constant normal and shear stiffness for force and moment transmission. Figure 11a shows that the model captures the micromechanical response of cement under external loads. When peak normal or shear stress exceeds bond strength, the bond fails and its mechanical properties are removed.
Calibration of Pervious Concrete Parameters
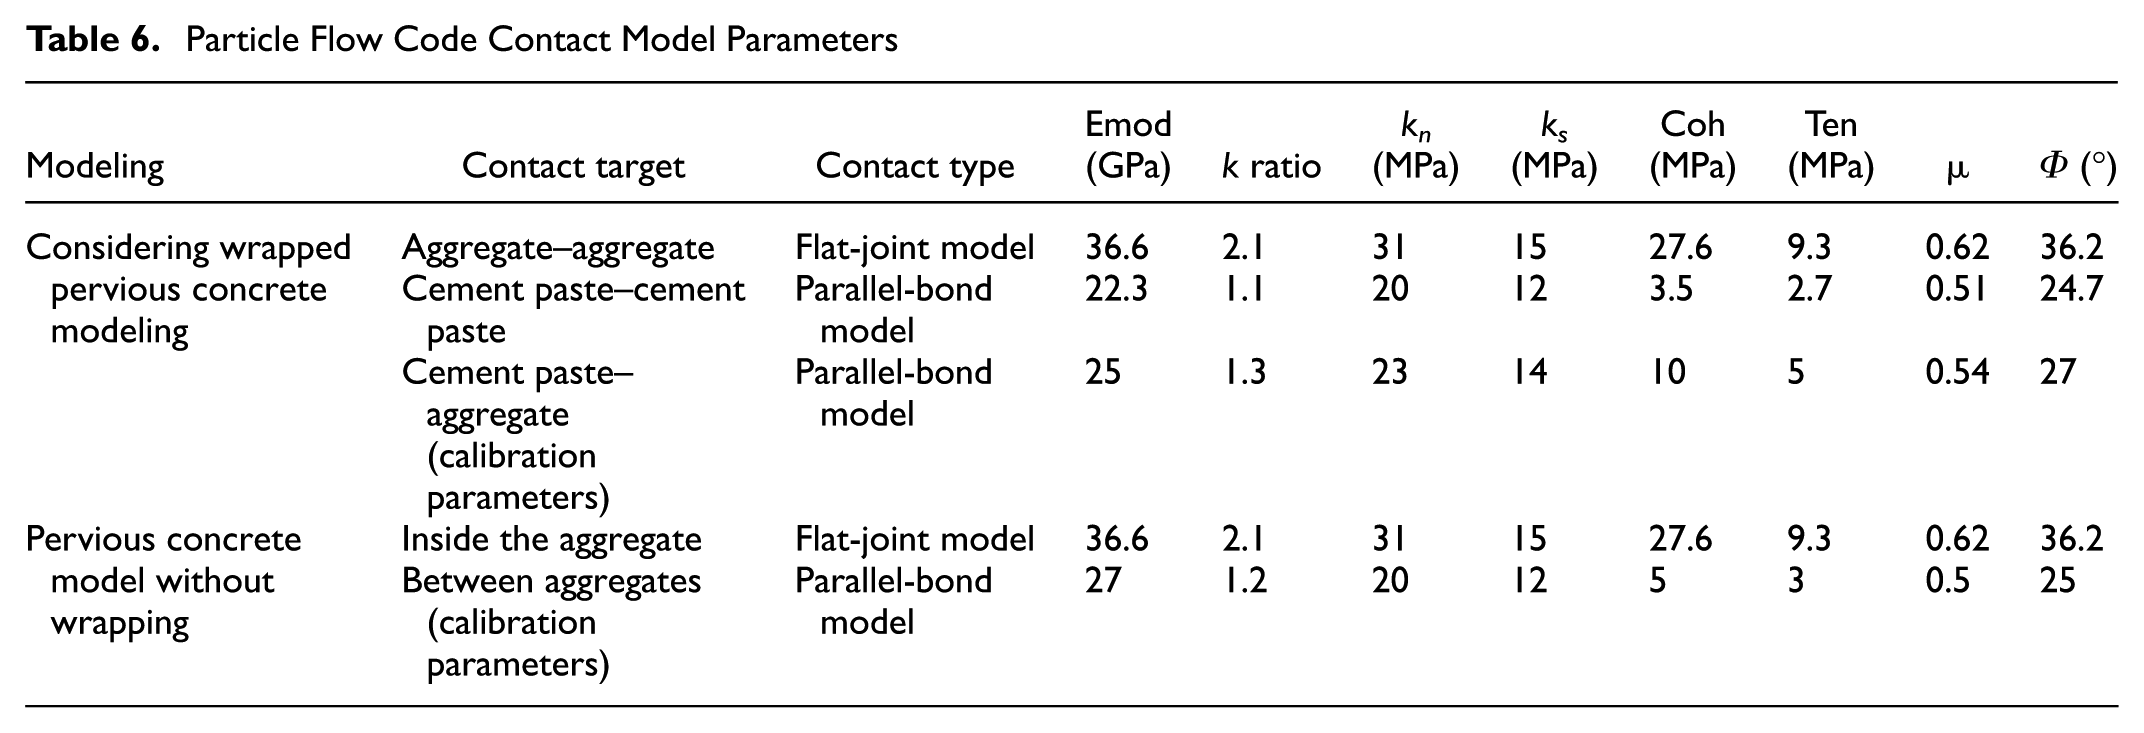
To ensure the accuracy of the PFC3D model in representing the mechanical properties of pervious concrete, meticulous parameter calibration is essential. This research integrates multiple tests, PFC’s internal formulas, and prior research findings to establish the initial model parameters (refer to Table 6). The model calibration involves comparing the outcomes of cubic compressive strength test results with PFC3D simulations to enhance accuracy and reliability.
Particle Flow Code Contact Model Parameters
Parameter Calibration Strategy
The mechanical response of pervious concrete is mainly controlled by the interface attributes between aggregates and the cementitious matrix. Therefore, two models were calibrated separately:
1)Coated Aggregate Model: The contact parameters between aggregates and cement paste were calibrated to accurately reflect the impact of the ITZ on mechanical properties.
2)Aggregate-Only Model: The contact parameters between aggregates were calibrated to assess the mechanical behavior of the aggregate skeleton without cement paste.
Table 6 summarizes the parameters of the final calibration. The particle model and contact model for the pervious concrete cube specimens with cementitious materials are shown in Figure 12a. The model without cementitious material is shown in Figure 12b.
Cubic specimen discrete element modeling: (a) modeling of slurry-containing particles and contacts and (b) no slurry particles and contact modeling.
PFC3D Cubic Compressive Strength Modeling
To calibrate the contact parameters of the pervious concrete, a numerical cube specimen (100 × 100 × 100 mm) was created for uniaxial compressive simulation.
FJM is used for aggregate-to-aggregate contact, capturing physical bonding and friction characteristics. PBM is used for cement paste-aggregate interactions to ensure a viscoelastic response at the ITZ.
Rigid loading plates were positioned at the top and bottom of the specimen, with normal contact stiffness adjusted to ensure uniform loading. For uniaxial compression testing, displacement-controlled loading was applied at 0.01 mm/step, with the deformation process recorded. The overall stress-strain curve was monitored to extract key mechanical properties such as compressive strength and crack count. Experimentally derived and simulated stress-strain curves were compared, and material parameters were adjusted to ensure that the numerical model accurately predicted the compressive strength of pervious concrete. An error analysis was performed, and the simulated and experimentally derived curves were compared with Figure 13. After adjusting the parameters of both models, the peak error was kept within 1% to verify the reliability and applicability of the models.
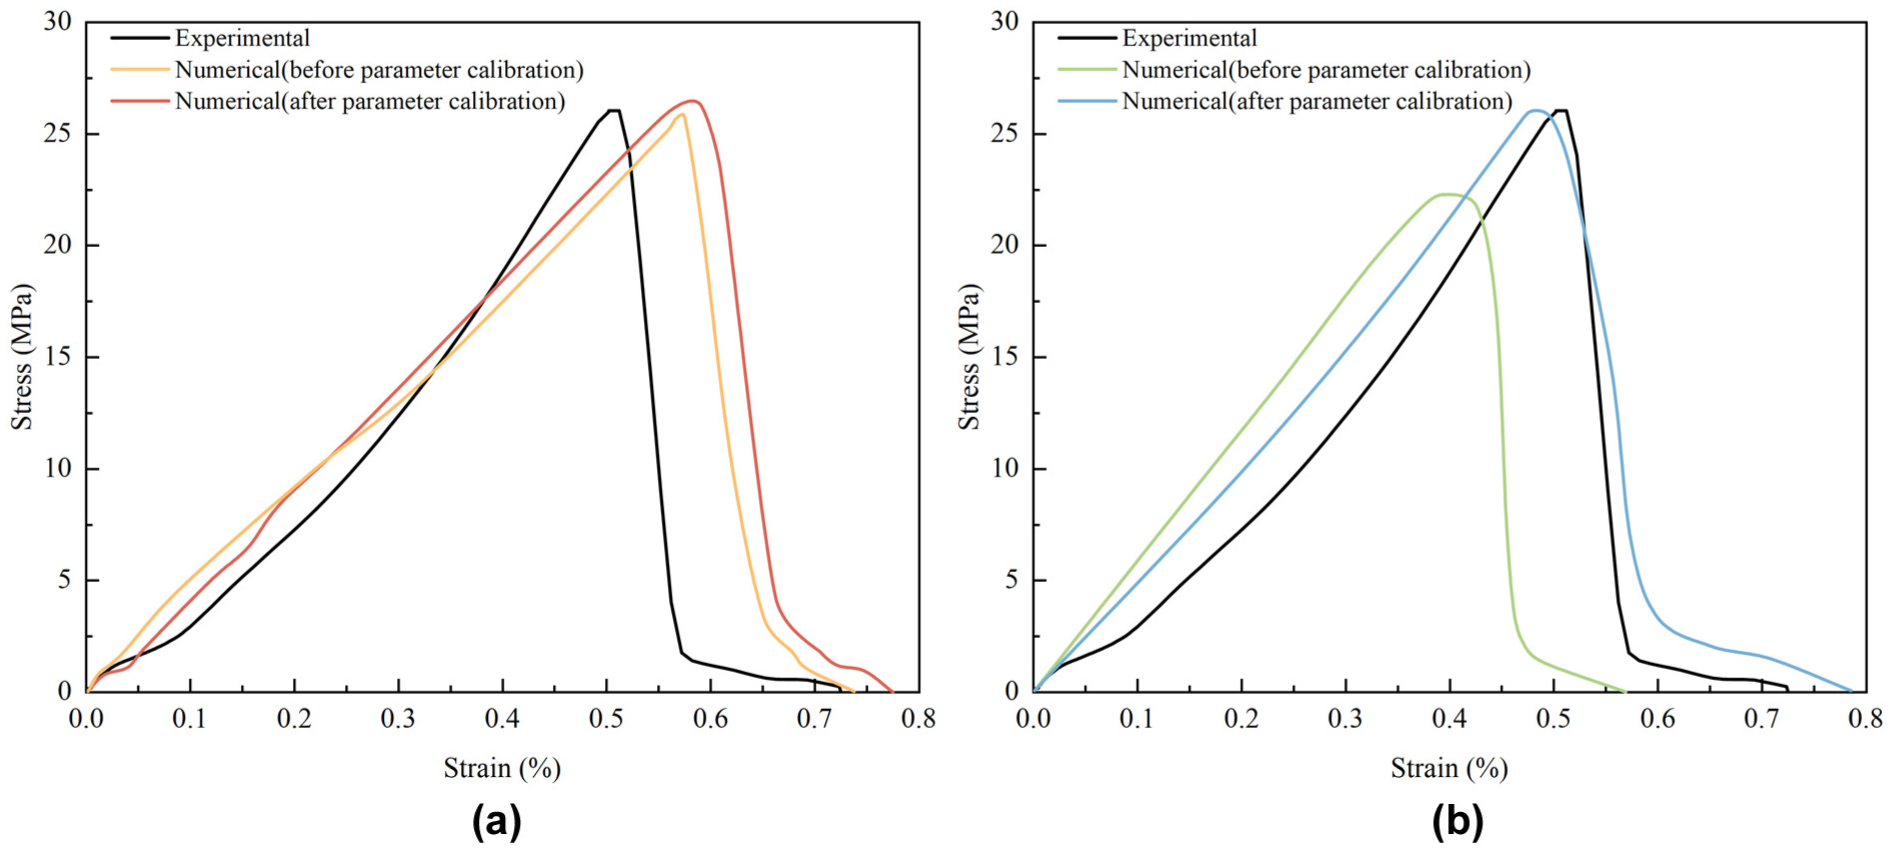
(a) Calibration results of slurry model parameters and (b) calibration results of slurry-free model parameters.
Simulation of Axial Compressive Strength of Uncoated and Coated Pervious Concrete PFC3D Models
Research Overview
To explore the effect of cement coating on the accuracy of the mechanical properties of the DEM model of pervious concrete, this study was conducted by developing two distinct models in PFC3D: the uncoated model (which considers only the aggregate skeleton) and the coated model (which includes aggregates coated with cement paste and ITZ). The contact parameters were calibrated and applied to axial compressive tests based on comparisons with the results of cubic compressive experiments. By simulating the axial compressive strengths and comparing the results with experiment data, the study examined the compressive strengths, damage modes, and stress-strain characteristics to assess the accuracy of the two models in predicting mechanical properties.
Results and Comparisons
Axial Compressive Strength Comparison
The results of the axial compressive strength curves for the uncoated model, coated model, and experiment specimens are shown in Figure 14b.
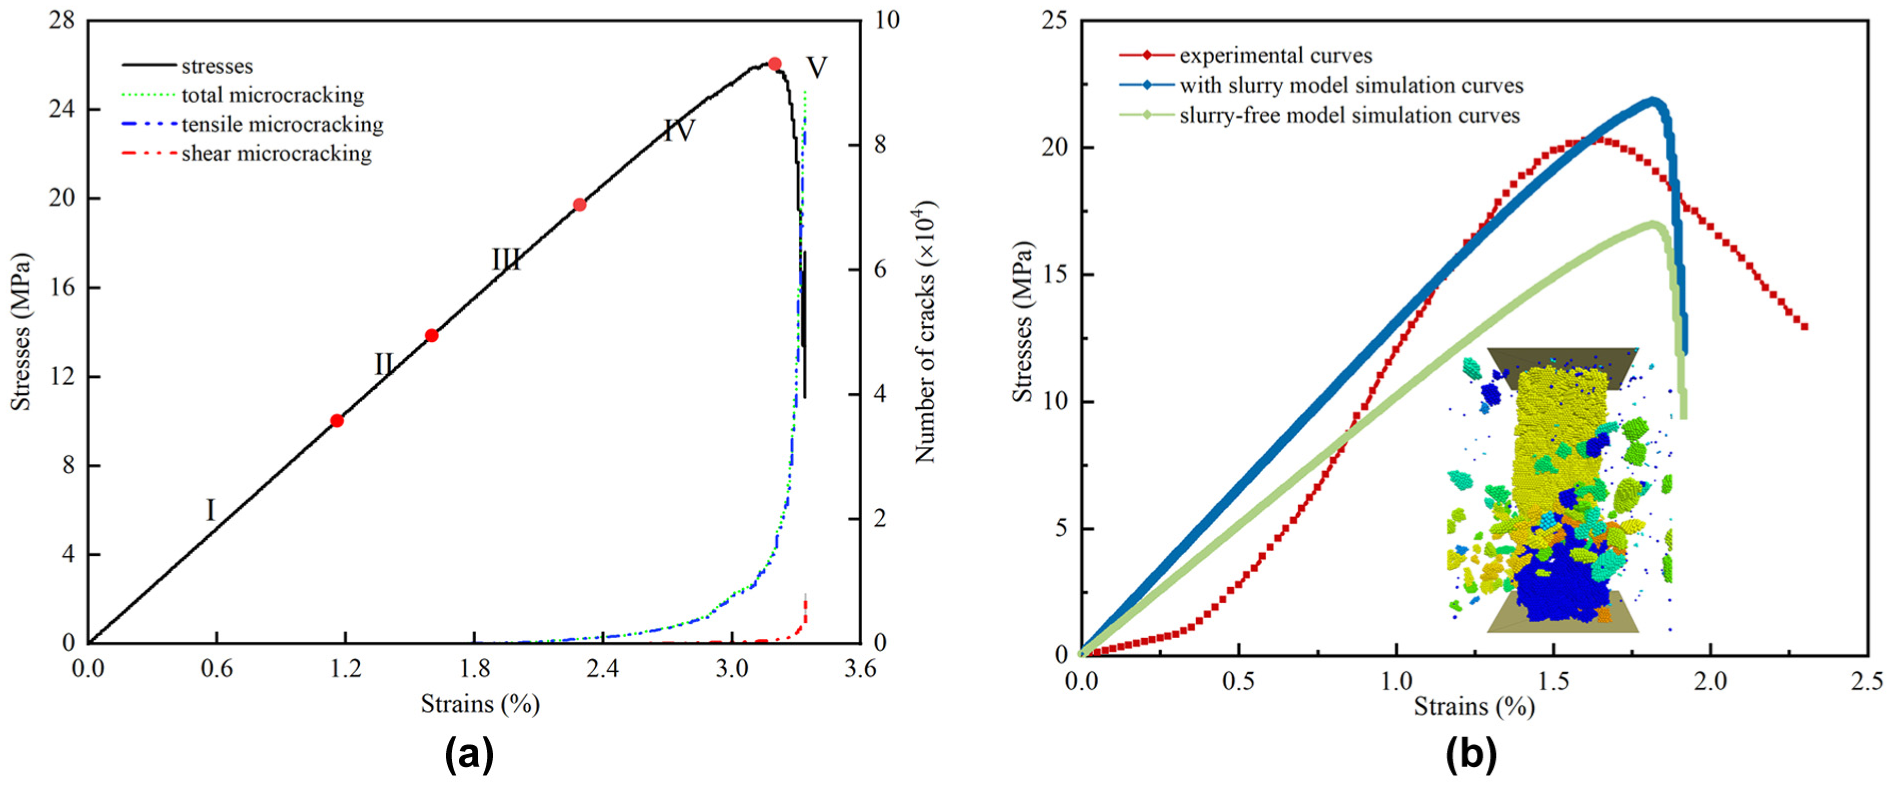
(a) Model simulation results and crack development and (b) comparison of simulation and experiment results of the two models.
The images show that the compressive strength of the uncoated model is 16.74 MPa, significantly lower than the experiment value of 20.56 MPa, with a relative error of 18.58%. This indicates that aggregate interaction alone is not enough to accurately predict the mechanical properties of pervious concrete. Conversely, the compressive strength of the coating model is 22.27 MPa, which is in better agreement with the experiment data, and the relative error is reduced to 8.32%, which confirms that this model can more accurately represent the pervious concrete and the contribution of ITZ to its overall mechanical properties. Additionally, the prediction error of the coating model remains within 10%, which makes it suitable for estimating the mechanical properties of pervious concrete.
Failure Mode Analysis
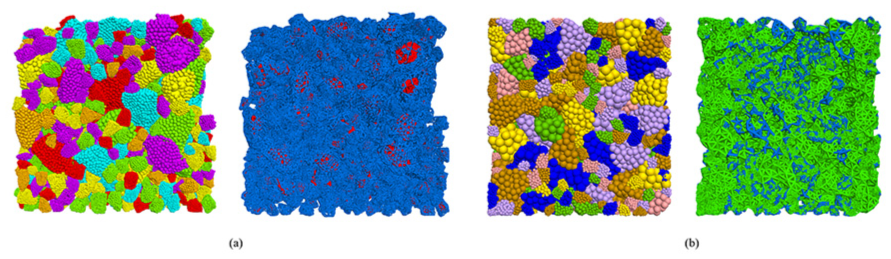
Figure 14a shows the crack development and failure mode of the coated model.
Coating Model: Cracks primarily formed along the ITZ and gradually spread throughout the entire structure, showing a more representative damage pattern of pervious concrete. The cement coating significantly strengthened the bond between the aggregates and improved the integrity of the structure. This prevents direct interfacial damage between aggregate particles and promotes a more gradual crack propagation process within the ITZ.
Uncoated Model: The damage is mainly concentrated at the aggregate contact points, and the cracks extend along the aggregate interface, eventually leading to a more discontinuous fracture pattern. Because of the lack of cement paste confinement, the interlocking between aggregates is weak, leading to premature localized aggregate failure and overall structural instability. This damage pattern highlights the critical role of the ITZ in improving aggregate bonding.
The study of the damage patterns revealed that the cracking patterns of the coating model were very similar to those of the experiment specimens, indicating that the cement paste coating effectively enhanced the structural stability of the pervious concrete and resulted in a more realistic mechanical response when subjected to compression.
Stress-Strain Characteristics Comparison
Based on the stress-strain curves of the two models, it can be found that the peak stress of the uncoated model is lower, and the stress-strain curve decreases sharply after reaching the peak value, which indicates that there is insufficient interaction between the aggregates, which limits their load-bearing capacity. The lack of cement paste bonding leads to premature failure of the structure. The coating model shows higher peak stresses and a more pronounced plastic phase, which is in better agreement with the experiment data. The increase in ductility suggests that the ITZ structure effectively enhances the load-bearing capacity of the pervious concrete, allowing it to withstand greater strains before failure.
From the stress-strain relationship analysis, the coating model can not only predict the compressive strength of pervious concrete more accurately, but also better simulate its damage process and deformation characteristics.
Results and Discussion
In the coated-aggregate model, where the cement paste coating is explicitly modeled, cracks initiate and propagate primarily along the ITZ—the region between the coated surface and adjacent aggregates. This behavior is consistent with experiment observations, where failure typically originates at the weak interface because of stress concentration. The model effectively captures this phenomenon, showing progressive crack growth, crack coalescence, and eventual macro-fracture through the connected ITZ paths. This mechanism reflects realistic stress redistribution and energy dissipation in the material and confirms the role of the coating in enhancing strength and delaying failure. Moreover, the presence of the coating improves the contact condition between aggregates, increases bonding stiffness, and helps simulate the ductile-fragile transition observed in the experimentally derived stress–strain curves. The stress field distribution is also more continuous and aligned with the aggregate geometry, supporting the physical validity of the DEM representation.
In contrast, in the model without cement paste coating, cracks initiate randomly between aggregates and often propagate through the aggregate interiors, which is inconsistent with experimental fracture mechanisms. This unrealistic behavior arises from the absence of the ITZ and cohesive bonding layers. Without cement paste, the contact points between particles are minimal, leading to lower stiffness and higher stress localization. As a result, the model produces dispersed and fragmented crack patterns, which overestimate micro-crack density and underestimate peak strength. Additionally, in the uncoated model, aggregates behave more like isolated rigid bodies, and the load transfer paths are short and discontinuous. This leads to premature crack initiation and unrealistic damage evolution, diverging from the typical fracture surface observed in tested specimens.
Overall, the coated DEM model not only reflects more accurate failure morphology but also produces compressive strength results that are in closer agreement with the experimentally derived values. The incorporation of paste CT and ITZ behavior thus significantly enhances the physical realism and predictive capability of the simulation. This comparison validates the necessity of including microstructural elements, such as the ITZ and coating, in DEM simulations for cement-based porous materials. It also demonstrates that simplified aggregate-only models are insufficient to reproduce the complex damage evolution and structural response of pervious concrete.
Conclusion
This study investigated the impact of CT and aggregate gradation on the mechanical and permeability properties of pervious concrete. The optimization approach was verified through experiments and DEM. The two-stage optimization process first used a statistical model to optimize the aggregate mixture ratio, minimizing trials and enhancing efficiency; the second stage analyzed the influence of CT on pervious concrete performance and established a DEM model incorporating aggregates coated with cement paste, which was then compared with a non-coated model.
Optimization of Aggregate Gradation and Mechanical Performance Prediction
A simplex centroid design method was used to develop a response model correlating aggregate gradation with the compressive strength and permeability coefficient of pervious concrete. The results showed that, under optimal CT conditions for different aggregate sizes, the ideal aggregate mixture ratio was A:C = 7:3, achieving an optimal balance between permeability and compressive strength. At this ratio, the compressive strength reached 18.64 MPa, while the permeability coefficient was 3.26 mm/s, ensuring both structural stability and adequate drainage performance for permeable pavements.
Relationship between CT and Pervious Concrete Performance
The relationship between CT and the mechanical and permeability properties of pervious concrete was analyzed based on the optimal aggregate gradation. A mathematical model was established, showing that compressive strength increases linearly with CT, while permeability decreases inversely, with a high degree of correlation. These models enable the accurate prediction of concrete properties for various CTs. The study identified the OCT that meets permeable pavement specifications:
4.75–9.5 mm (size A) granite aggregates: OCT = 0.65 mm
9.5–16 mm (size B) granite aggregates: OCT = 0.91 mm
16–19 mm (size C) granite aggregates: OCT = 1.17 mm
Under these conditions, the compressive strength increased to 26 MPa, while the permeability coefficient was 1.68 mm/s, fulfilling the required performance criteria for permeable pavements.
DEM Modeling and Model Accuracy Verification
A DEM model incorporating aggregates coated with cement paste was developed using the optimal CT and calibrated based on cubic compressive strength tests to enhance numerical accuracy. In axial compressive strength simulations, the coated model demonstrated a 10.26% higher prediction accuracy than the non-coated model, with an overall error within 10% of the experiment data. This confirms that the DEM model, incorporating cement paste coating effects, can more accurately represent the mechanical behavior of pervious concrete while significantly reducing the experiment workload, providing a reliable numerical simulation tool for engineering applications.
Footnotes
Author Contributions
The authors confirm contribution to the paper as follows: study conception and design: Q. Xiao, Y. Liu; data collection: Q. Xiao, Y. Liu, L. Cai; analysis and interpretation of results: Q. Xiao, Y. Liu, J. Zhao; draft manuscript preparation: Q. Xiao, Y. Liu. All authors reviewed the results and approved the final version of the manuscript.
Declaration of Conflicting Interests
The authors declared no potential conflicts of interest with respect to the research, authorship, and/or publication of this article.
Funding
The authors disclosed receipt of the following financial support for the research, authorship, and/or publication of this article: This research was supported by the Excellent Teaching Case Project of Professional Degree Postgraduates in Henan Province (Grant No. 2022-115), the Special Projects of Key R & D and Promotion in Xinyang City (Grant No. 20220055), the Key Scientific and Technological Projects in Henan Province (Grant No. 232102320196), and the Postgraduate Education Reform and Quality Improvement Project of Henan Province (Grant No. YJS2025GZZ31).
Data Availability
All data generated or analyzed during this study are included in this published article.
All claims expressed in this article are solely those of the authors and do not necessarily represent those of their affiliated organizations, or those of the publisher, the editors and the reviewers. Any product that may be evaluated in this article, or claim that may be made by its manufacturer, is not guaranteed or endorsed by the publisher.