
Abstract
This study investigates the impact of technological innovations and regulatory updates on the safety outcomes of autonomous vehicles (AVs), aiming to identify which machine learning algorithms yield the most reliable results in analyzing AV crash data. With advancements in robotics and artificial intelligence, AVs have the potential to significantly reduce damages from driving crashes by eliminating human error, thereby enhancing safety. Utilizing the synthetic minority over-sampling technique (SMOTE) for data balancing, the research assesses its effects on predictive accuracy. This study addresses safety gaps by examining crash mechanisms related to AVs using machine learning methods and association rules such as Apriori and classification and regression trees (CART), exploring limitations in current research, particularly the lack of AV crash data, the relationship between land use and crash severity, and interactions involving driverless vehicles. To bridge these gaps, a dataset of 606 reported AV crashes from the California Department of Motor Vehicles (CA DMV) is analyzed to evaluate the current safety status of AVs and identify essential factors for acceptable safety performance levels in the future. Results show that 15.4% of crashes led to bodily injury, with intersections featuring traffic lights identified as primary locations for severe crashes, especially affecting vulnerable users like cyclists. Most driverless vehicle collisions and AV-to-AV incidents were classified as sideswipe collisions. While driverless vehicles reduce rear-end and broadside collisions, their interactions with human-driven vehicles present unique challenges that necessitate technological innovations, the development of vehicle-to-vehicle (V2V) communication, and legal updates. This study provides valuable insights for planners, transportation engineers, and researchers to enhance mixed traffic safety.
Keywords
Introduction
Transport automation is increasingly recognized as a pivotal solution to persistent challenges in traffic safety, congestion, and mobility. The deployment of fully autonomous vehicles (AVs) operating at Level 4 SAE (Society of Automotive Engineers) and above is anticipated to result in a substantial reduction in crash frequency by effectively eliminating avoidable errors associated with human behavior ( 1 , 2 ). Furthermore, the integration of AVs is expected to enhance the stability of traffic flow, thereby contributing to more efficient transportation systems ( 1 ). The potential of AVs to transport individuals with minimal intervention or without a driver presents significant opportunities for enhancing mobility, particularly for individuals with physical disabilities and the elderly ( 3 , 4 ). As part of the European Union’s initiatives, the world’s first technical regulation was enacted in 2022, allowing member countries to approve the registration and sale of a limited number of highly automated vehicles at the SAE level. According to the law, car manufacturers must equip vehicles with advanced emergency braking systems capable of detecting other vehicles. This requirement is expected to be extended to include cyclists and pedestrians starting in 2024 ( 5 ). As of October 15, 2024, no information has been found concerning the implementation or non-implementation of this regulation. However, the successful deployment of AVs in complex traffic environments raises critical safety concerns, necessitating a thorough understanding of the dynamics involved in reported crashes involving these vehicles.
Since 2014, the California Department of Motor Vehicles (CA DMV) has facilitated the testing of AVs on public roads through the Autonomous Vehicle Testing (AVT) program. This initiative, which mandates the reporting of crashes via the standard OL316 form, aims to promote innovation while fostering transparent and data-driven deployment practices. Notably, a license for testing AVs without a human driver in the seat was introduced in 2018. As of October 2023, AV testing operations in California have recorded a total of 606 crashes ( 6 ).
The selection of California DMV data for this study is based on its comprehensive nature and the state’s leadership in AV regulation. California’s dataset provides a robust framework for analyzing AV fault and crash outcomes, offering advantages over alternative datasets owing to its depth, regulatory context, and the volume of reported incidents. The dataset encompasses a wide range of crash scenarios, enabling a nuanced understanding of AV interactions in mixed traffic environments.
It is important to note that Level 5 AVs, which are fully autonomous and require no human intervention, are not yet commercially available. This study focuses on Levels 2 to 4, where human oversight is still required in certain situations.
One of the foremost challenges facing transport automation is the interaction between AVs and human-driven vehicles in mixed traffic scenarios. This interaction introduces uncertainty into traffic safety, as human drivers exhibit unpredictable behavior, often deviating from established traffic rules ( 7 ). In contrast, AVs are programmed to adhere strictly to traffic regulations. The interplay between the predictability of AVs and the unpredictability of human drivers presents significant safety risks ( 8 ).
The rising incidence of fatalities associated with AV-related crashes poses a threat to the technology’s deployment potential within mixed traffic environments ( 9 ). Moreover, the impact of AVs on the nature and severity of crashes remains inadequately understood, particularly concerning factors that influence crash severity during nighttime and adverse weather conditions ( 10 , 11 ). Existing control systems for AVs often lack effective mechanisms to address the challenges posed by severe weather ( 12 ).
While previous research has primarily focused on aspects such as routing ( 13 ), technology acceptance ( 14 ), pedestrian safety ( 15 ), and traffic impacts ( 16 ), there is a notable deficiency in studies examining the collision mechanisms of AVs, the relationship between land use and AV collisions, and the dynamics of collisions involving driverless vehicles ( 11 , 17 ). The scarcity of comprehensive crash data further complicates these issues ( 18 ).
To address these gaps, this study aims to extract and analyze a dataset comprising 606 crash reports from the CA DMV, evaluating the current safety status of AVs and identifying critical factors necessary for ensuring acceptable safety performance levels in the future, particularly in mixed traffic contexts. By identifying trends and patterns in the severity of bodily injuries, this research seeks to enhance the safety of mixed traffic environments populated by human-centric vehicles. The insights gained will provide valuable guidance for researchers and planners in developing effective safety measures and traffic control strategies.
This study contributes uniquely to the literature by integrating advanced analytical techniques, such as classification and regression trees (CART) and the Apriori algorithm, to assess crash mechanisms. By focusing on the interplay between machine learning models and association rule mining, patterns and dependencies within AV crash data that have been inadequately addressed in previous research are uncovered. The findings provide critical insights into crash severity factors, including disengagement events and collision types, which are often overlooked in traditional statistical analyses.
The overall structure of this study encompasses a literature review, methodology, results, discussion, limitations, suggestions, and conclusion.
Literature Review
Research in the field of AVs is experiencing significant growth, driven by the technology’s successful integration into public transportation and its pivotal role in enhancing road safety. Studies indicate that human error is a contributing factor in most transportation crashes ( 19 ). Consequently, both governmental and private sectors are increasingly committed to initiatives aimed at reducing casualties and serious injuries caused by motor vehicle crashes in the United States. Many experts advocate for the automation of vehicles as a viable approach to significantly mitigate these risks and move toward the vision of zero fatalities (20–22).
This study specifically addresses crashes involving conditional and fully AVs, classified under SAE Levels 2 to 4. The SAE automation levels range from Level 0, indicating “no automation,” to Level 5, signifying “full automation” ( 2 , 23 ). The intermediate levels include “driver assistance” (Level 1), “partial automation” (Level 2), “conditional automation” (Level 3), and “high automation” (Level 4). At Level 4, an AV can perform driving tasks without a driver present, functioning autonomously under specified conditions ( 24 ).
Despite the advancements in AV research, significant gaps remain in our understanding of AV crashes, primarily owing to limitations in available data ( 25 ). The scarcity of comprehensive crash data has hindered the exploration of factors influencing the severity of crashes involving autonomous driving-capable vehicles, which is essential for identifying critical patterns and variables ( 26 ). Previous studies have employed various statistical modeling and machine learning techniques to investigate the relationships between contributing factors and the outcomes of AV crashes, focusing on collision modes and severity ( 7 , 27 , 29 ). Recent research has further enhanced our understanding of AV-human interactions and safety technologies ( 28 ). For instance, Leilabadi and Schmidt ( 29 ) found a strong correlation between adverse road conditions and increased severity of AV damage, noting that 80% of crashes involving AVs in autonomous mode resulted in bodily injuries. Similarly, Wang and Li reported that when AVs are at fault, the severity of crashes tends to escalate; however, they also noted that AVs were deemed at fault in only 13% of 133 examined crashes. This finding underscores the necessity of understanding AV error probabilities to foster public confidence in this emerging technology ( 17 ). Das et al.’s ( 30 ) research identified specific collision types, such as those occurring at roundabouts and during low-light conditions, as being associated with higher damage levels. Xu et al. ( 31 ) utilized bootstrap logistic regression to analyze factors affecting AV crash severity, highlighting the significance of driving modes, collision locations, and roadside parking. Their findings indicated that the severity of AV crashes is generally lower than that of conventional crashes. Boggs et al. ( 32 ) observed a heightened probability of rear-end collisions when AVs operated in autonomous mode compared with manual driving scenarios, with injury crashes positively correlating with roadside parking and intersections. Chen et al. ( 27 ) employed the extreme gradient boosting (XGBoost) model to assess crash severity, discovering that mixed land-use areas positively affected the occurrence of bodily injuries. Xu et al ( 33 ) noted an increased likelihood of injury crashes under severe weather conditions, while other studies highlighted the prevalence of side-impact crashes involving vulnerable road users such as pedestrians and cyclists ( 34 ). Some of the literature related to the research topic is presented in Table 1.
Research Background Summary
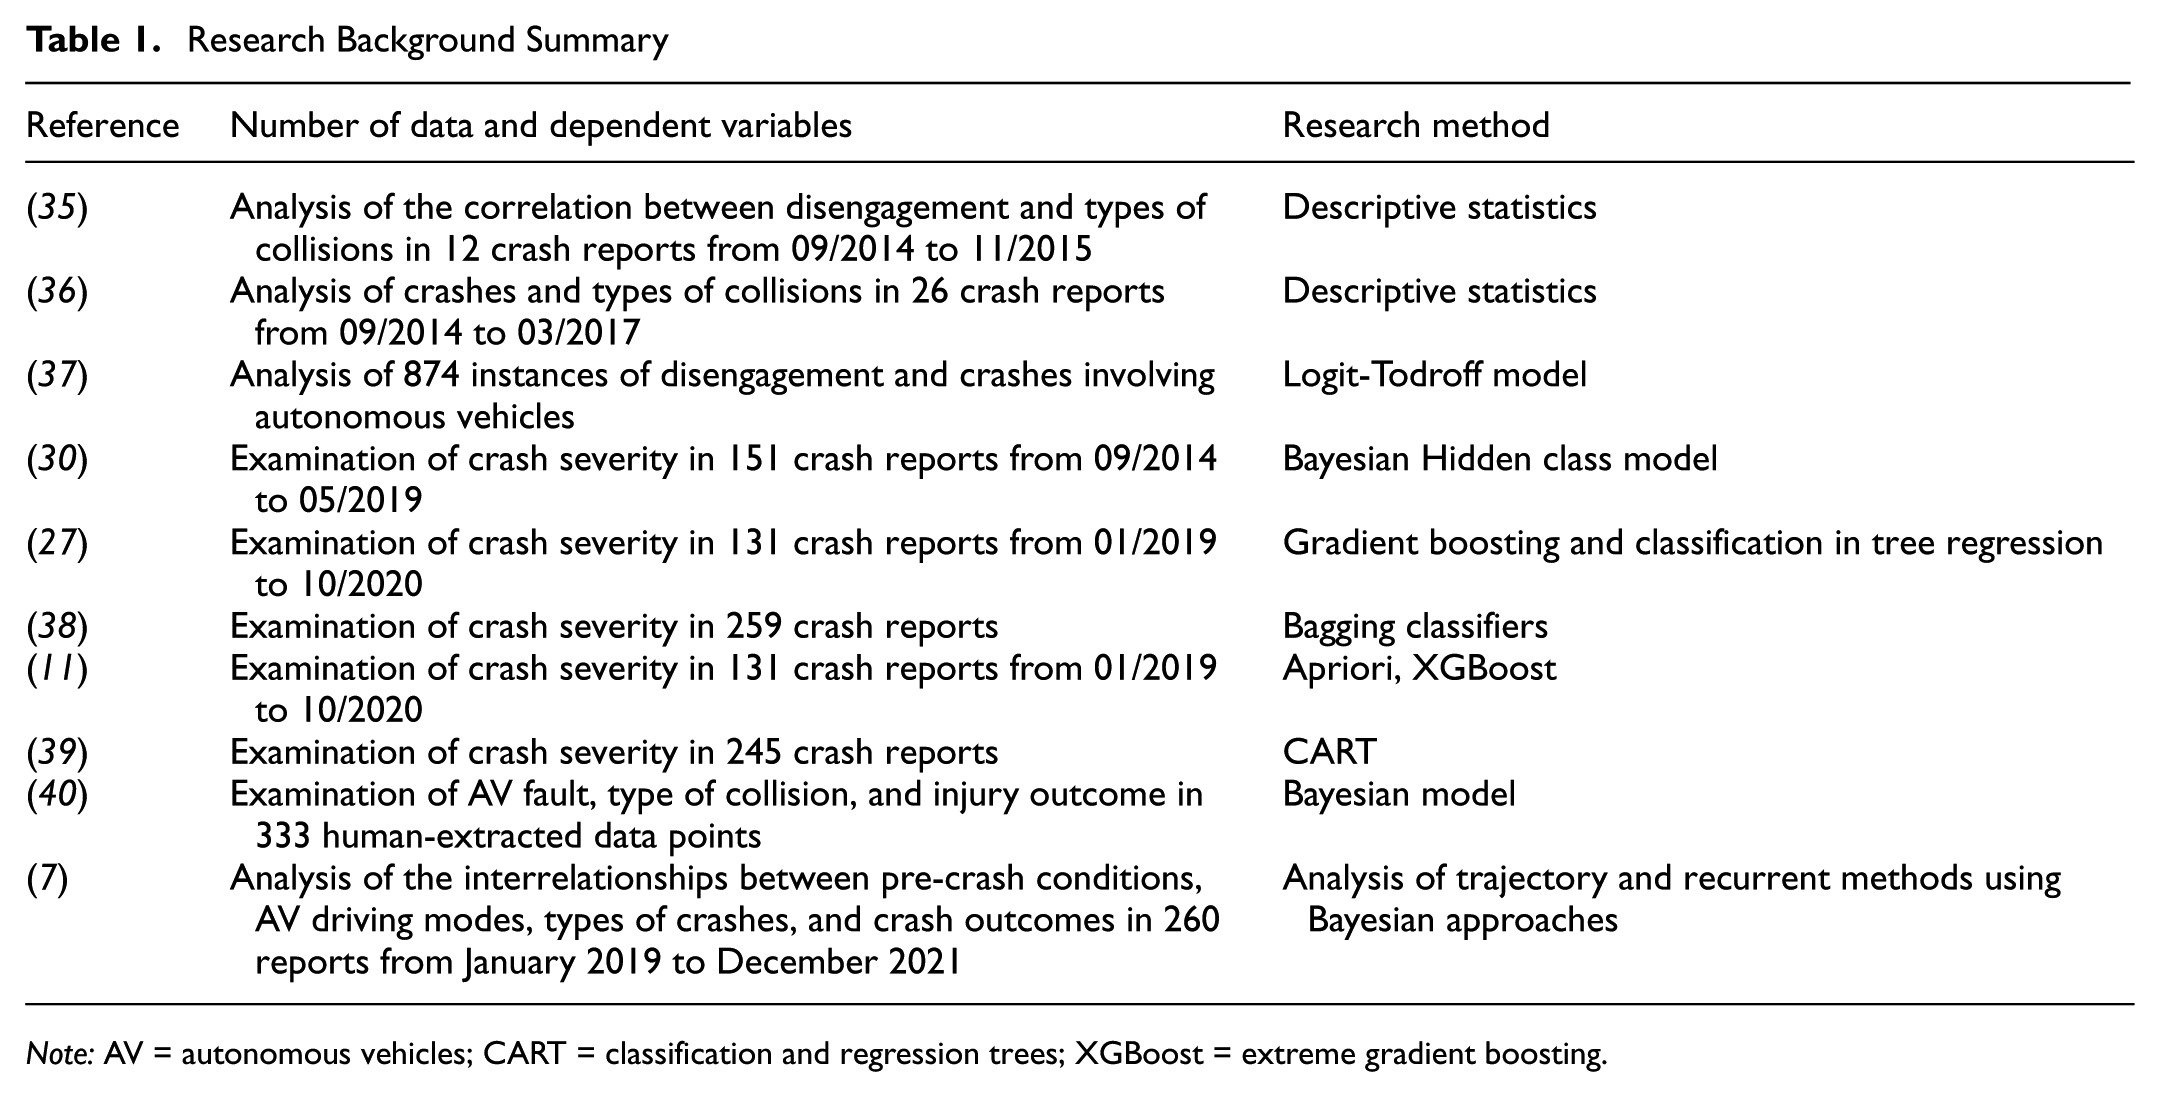
Note: AV = autonomous vehicles; CART = classification and regression trees; XGBoost = extreme gradient boosting.
Despite the wealth of studies, there remains a notable absence of research focusing specifically on driverless car crashes between AVs. Identifying the causes of traffic crashes is crucial for implementing effective preventive measures ( 11 ). The Apriori algorithm, a widely recognized tool for association rule mining, has seen limited application in traffic safety analysis ( 41 , 42 ). Notably, Xu et al. ( 43 ) applied the Apriori algorithm to investigate serious traffic crash causes in China, while Qu et al. ( 44 ) utilized it to analyze near-crash incidents and extract frequent event patterns.
The existing literature on data balancing indicates that class imbalance is a common challenge in crash severity studies, where the number of severe crashes is often much lower than that of minor crashes. Various techniques, such as synthetic minority over-sampling technique (SMOTE), random under-sampling (RUS), and random over-sampling (ROS) have been proposed to address this issue. In this study, we employ SMOTE to balance the dataset and ensure that our models are not biased toward the majority class.
Recent studies have also begun leveraging Shapley additive explanations (SHAP) to interpret machine learning models in traffic safety contexts ( 11 ). For example, Hu et al. ( 45 ) employed SHAP to assess variable importance in the risk of crashes involving connected vehicles at intersections, and Hasan et al. ( 46 ) utilized it in 2023 to explore crash features related to young drivers.
In light of these findings, the current study aims to extract and present updated AV crash data, thereby deepening the understanding of trends and factors influencing the severity of crashes involving AVs. The methodology incorporates the CART model and the Apriori algorithm to generate and identify key combinations of factors affecting AV-related crashes, facilitating a thorough analysis of the impact of contributing factors on crash severity based on established model performance criteria.
Methods
Conceptual Framework
This study consists of two main tasks: (1) converting and organizing the AV crash report forms into a processable format, and (2) data mining of association rules, statistical analysis, and machine learning, as illustrated in Figure 1.
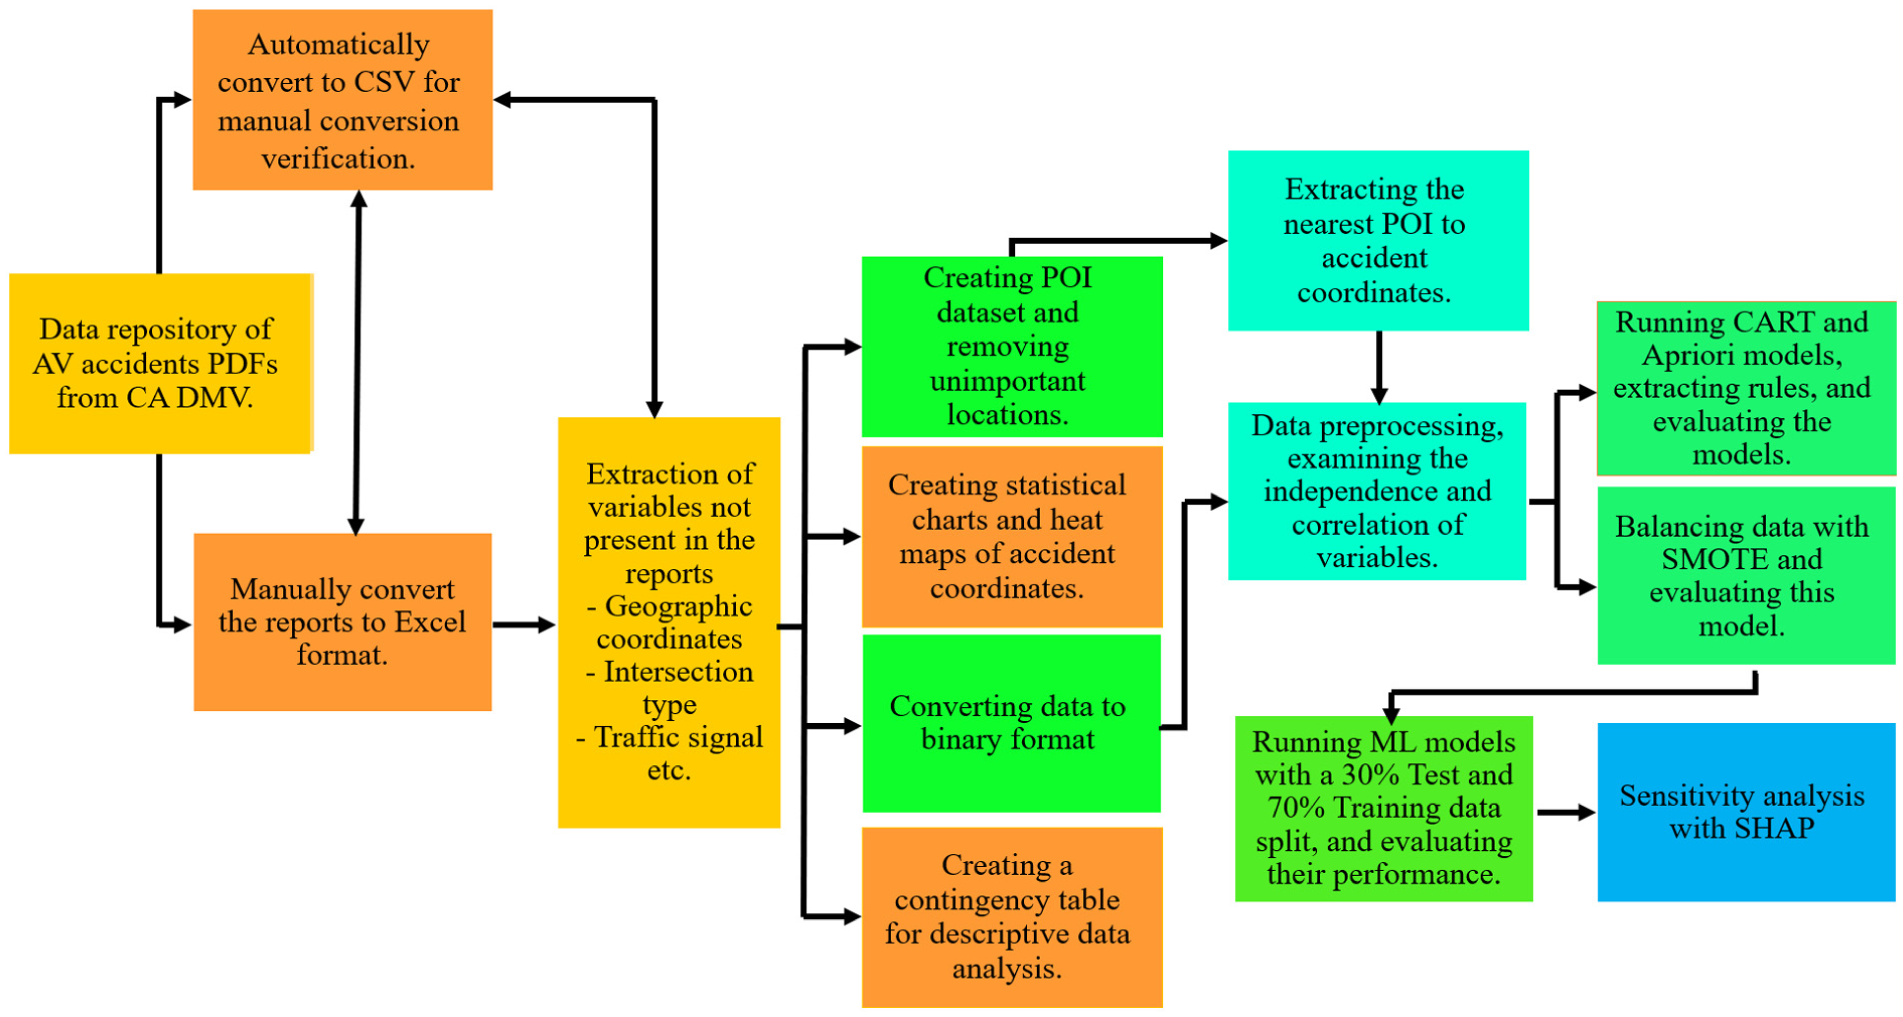
Conceptual framework: from crash data extraction to modeling.
As shown in the conceptual framework of Figure 1, the models used in this study are machine learning models, data mining models, and statistical models. Every AV crash is caused by a mix of different factors that affect the crash, and each crash can be represented as a logical combination of factors in the shape of conditional statements. These conditional statements are referred to as crash rules. This research extracts crash rules through non-parametric decision tree models and association rule mining using Apriori ( 11 , 26 ). Owing to the relatively limited size of the AV crash database, the results obtained from non-parametric models provide a better visual and direct correlation, which can help analyze the mechanisms of self-driving car crashes, identify patterns and trends between variables, and lead to appropriate mitigation measures to improve the safety performance of AVs during the critical evaluation and deployment initiation phase, leading to technological development ( 26 ). Treatment of imbalanced data is done using SMOTE, and machine learning models, including random forest (RF), XGBoost, and decision tree, are used to assess the importance of variables in modeling. Additionally, SHAP is used to assess and interpret machine learning models’ importance. For all algorithms, the training data size is 70%, and the test data size is 30% of the dataset. All models and results are extracted using the mlxtend, Scikit-learn, pandas, numpy, and apriori libraries, as well as coding in the Python 3.9 programming language. The theoretical foundations of these models and evaluation criteria are explained further in this section.
Data Collection
Study Area
This study uses AV crash reports provided by the CA DMV. The crashes occurred in 28 cities in the state of California, but based on the data distribution, three general areas for study, including San Francisco, Mountain View, and Los Angeles, can be considered, as shown in Figure 2. Most AV technology companies in California operate in the areas of San Francisco, Mountain View, Santa Clara, San Jose, and Los Angeles ( 35 ).
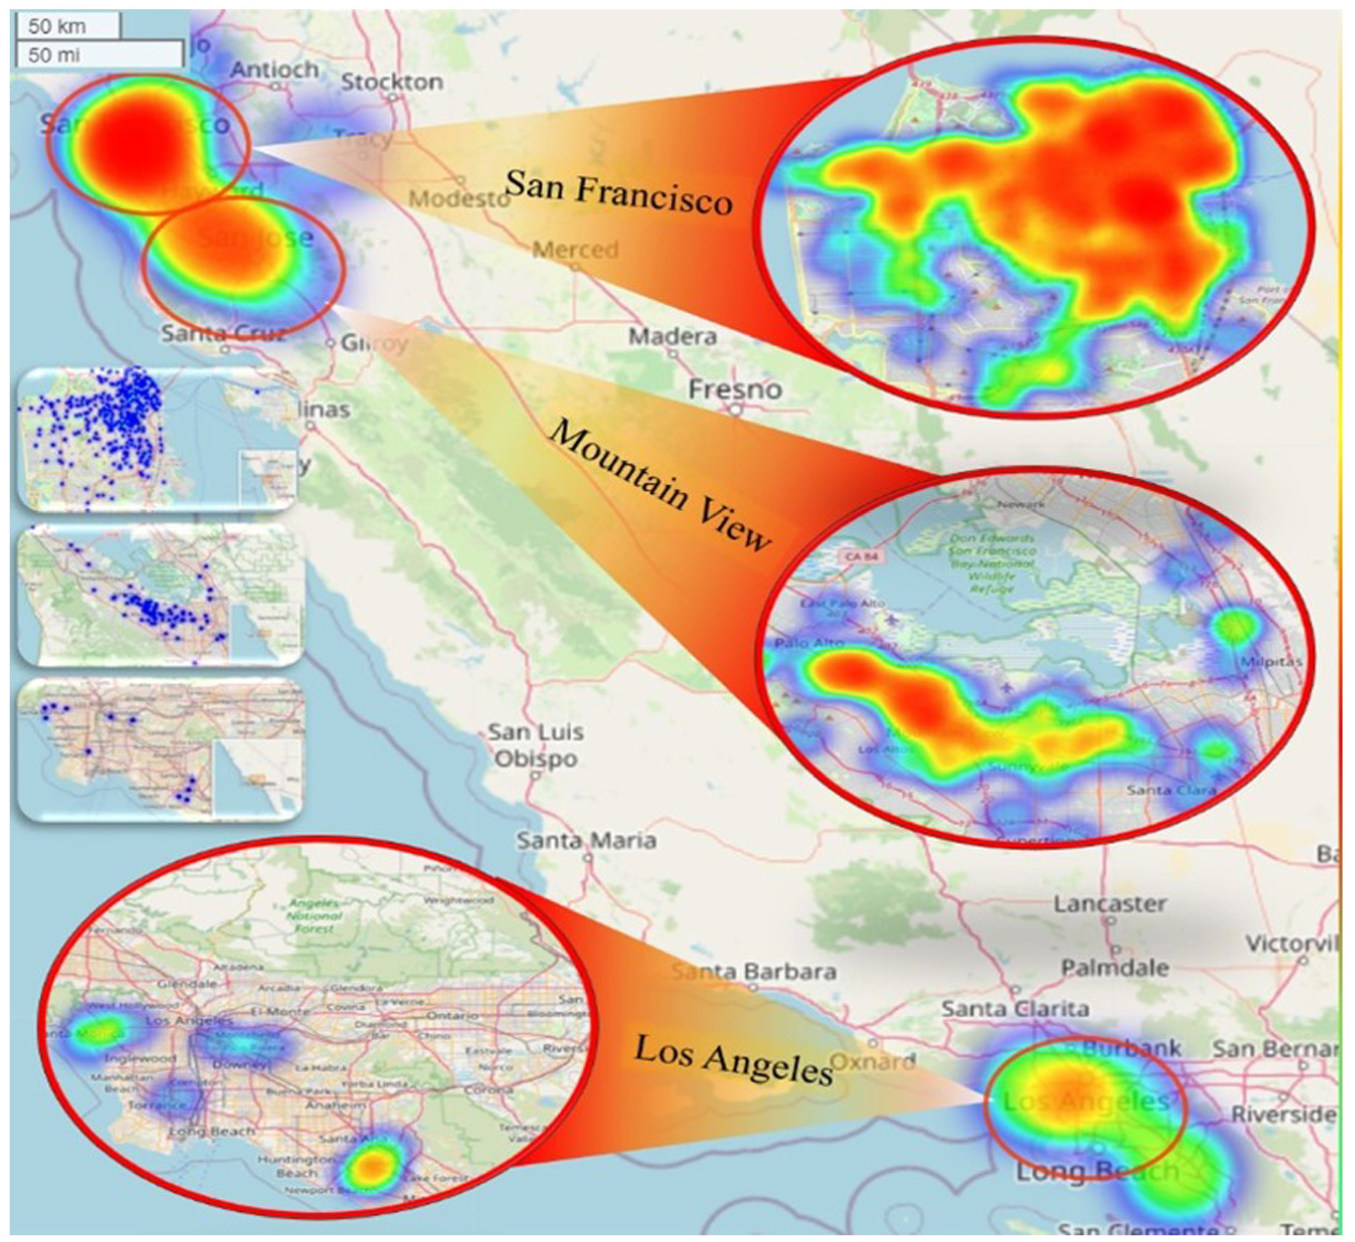
Heat map of autonomous vehicles (AV) crashes in the test areas.
Population and Sample
Based on the explanations provided so far, the study population includes all self-driving cars registered in California. The study sample consists of all data related to self-driving car crashes during the period from September 2014 to September 2023. For self-driving car crash data, we consider the population and sample sizes to be equal, meaning that all available data in the population are considered for analysis. This method is applicable when high precision is required in data analysis.
Data Sources
Although several states in the United States are conducting AV experiments on public roads ( 47 ), the most reliable and comprehensive source of self-driving vehicle crash data is the OL316 report forms provided by the CA DMV, which are publicly available ( 6 ). The report form includes details related to the type of collision, crash location, severity of injuries, and scene information such as weather, light conditions, road surface conditions, pre-crash conditions, and other factors. Crash reports are available on request. The completed dataset for creating a research resource for future researchers in xlsx and csv formats is available for download via our GitHub repository at https://github.com/kohanpour1/AVs (accessed on May 30, 2025).
Crash Data
The current analysis includes 606 AV crash data reported from September 2014 to September 2023 ( 6 ), which were extracted and converted into a processable format by us. The frequency of crash variables is presented in the Results section. The articles by Kohanpour et al. ( 48 , 49 ) also support these data.
Dependent Variable: Crash Severity
Based on crash narratives, crash severity was mentally categorized into classes of crashes without bodily injury, minor injury, moderate injury, severe injury, and fatal injury. In this study, crashes without bodily injuries to individuals, referred to as property damage, and other classes that included at least one injured party with minor, moderate, severe, and fatal injuries, were classified as bodily injury. In crashes with property damage, only vehicles and infrastructure are damaged, but in crashes with bodily injuries, there is an accompanying injury, and vehicles may suffer severe property damage or, as in the case of collisions with pedestrians or scooters, may suffer minor or no damage ( 6 ).
In this study, portable document format (PDF) forms are first converted into a processable format. According to Figure 3, crash location information, points of interest (POI), and other variables are extracted based on the conceptual model in Figure 1.
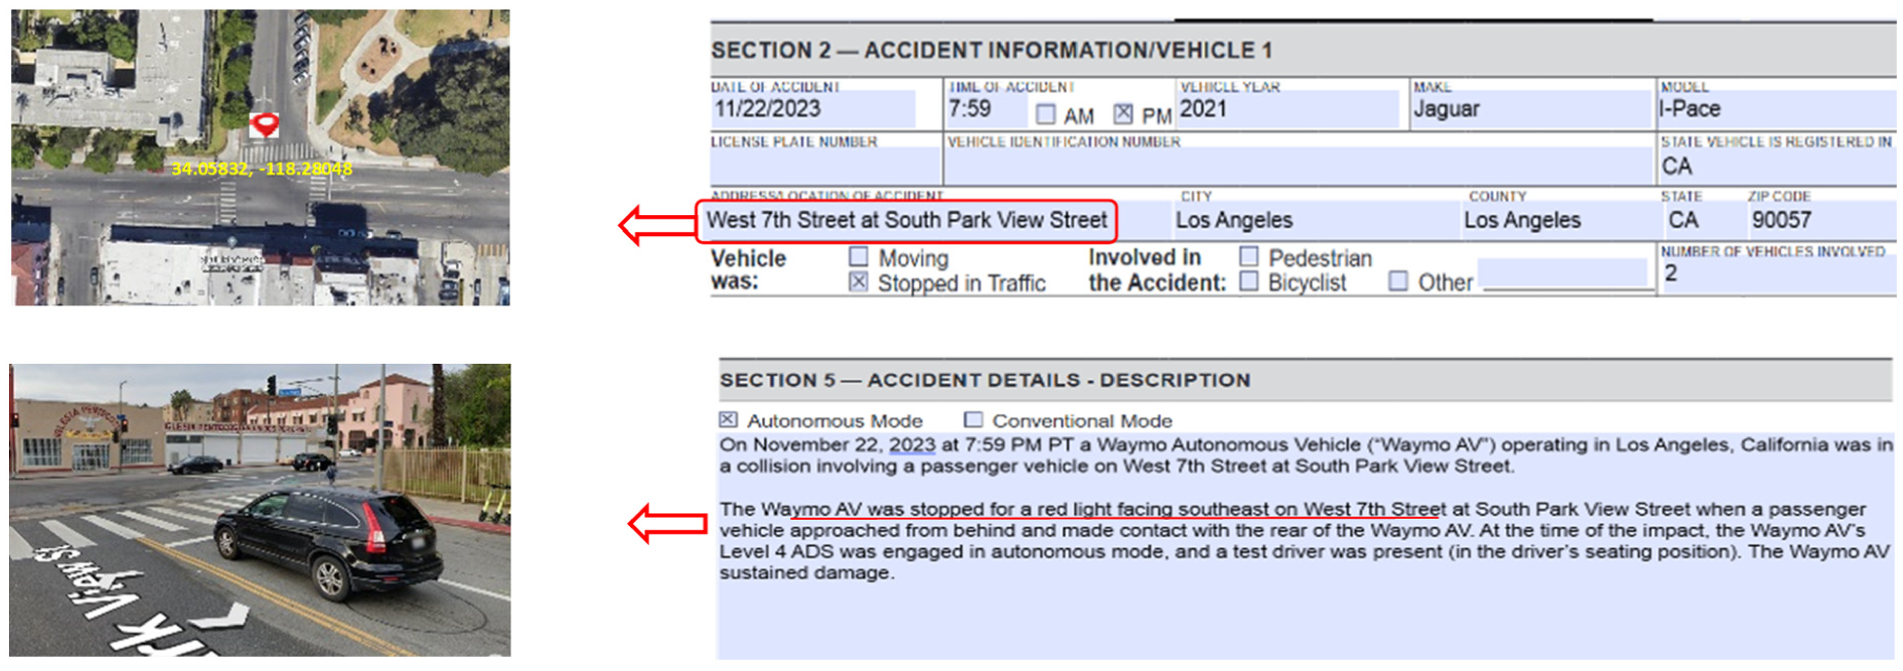
Extraction of crash location data from report OL 316.
Extraction of Land-Use Data and Secondary Variables
Land-use data in the form of POI, such as restaurants, clinics, banks, and so on, were extracted from OpenStreetMap using the request library in the Python programming language. Then, for the crash coordinates, the nearest POI was extracted, and these points were added to the data as POI variables. In addition to POI, variables such as season, days of the week, peak traffic hours in the morning and afternoon, night (9 p.m. to 5 a.m.) ( 48 ), weekends, and official holidays were also added to the data as secondary variables. Points of interest were classified into four categories: public use, transportation use, administrative use, and residential use.
Data Preprocessing
To achieve accurate and confident results in any study, it is necessary to perform data cleaning first, and then adjust the data according to the conditions of each study and conduct necessary checks. In this section, we examine the data preprocessing process, which includes checking for missing data, outliers, data with inappropriate scales, and also examining the variables for correlation and independence. The dataset should be prepared in a way that is suitable for each algorithm used in this study, as some algorithms can only run with binary data, and some with categorical data. To check for correlation, we compute the variance inflation factor (VIF) for the random variables ( 11 ). In the next step, we convert the data into binary form so that it can be used for machine learning algorithms. For data balancing, methods such as over-sampling, under-sampling, hybrid methods, and artificial data generation can be used. Owing to the relatively small dataset, we employed techniques such as SMOTE (version 0.9.1) for data balancing and cross-validation to ensure the reliability of our machine learning models. These methods help mitigate the risk of overfitting and improve the generalizability of the results. These methods are implemented using the Python programming language version 3.9 and libraries such as statsmodels, matplotlib, imbalanced-learn, and scipy.stats. In addition to SMOTE, we also experimented with RUS and ROS to address class imbalance. However, SMOTE provided the best results concerning model performance and was therefore selected for the final analysis.
Analysis Methods
Theoretical Foundations of CART
The CART model is an important non-parametric model in data mining and machine learning, which does not necessitate prior probabilistic knowledge of the phenomena being studied and can be utilized for classification and regression modeling (prediction) objectives (
49
). Various techniques can be employed to build a decision tree. The primary distinction among these techniques lies in the splitting criteria used in the tree construction (
50
) Of all the techniques, the CART model was developed by Breiman et al. and is the most widely used method in analyzing traffic crash data (
17
). In this model, tree nodes (parent) are divided into sub-nodes (child) based on the threshold value of a variable. The CART model does this by searching for the best homogeneity for the sub-nodes, using the Gini index criterion (
26
). The Gini index measures the impurity level in each node until its purity (homogeneity) does not increase with further division. The Gini index

Furthermore, it presents a simple hierarchical graphical structure, which is used to extract rules and determine the influence of different explanatory variables (i.e., variables that influence the crash) on the dependent variable (i.e., the severity of the crash). In this model, each node represents a variable, and each branch represents one of its conditions. The last nodes of the tree are called tree leaves and represent the expected value of the target variable. Each leaf of the tree, to which all previous nodes are connected, represents a rule. These rules are defined as “if A then B.” Here, A is the antecedent or independent variable, and B is the consequent and represents the class of the dependent variable. Each tree leaf (branch) provides the probability of each crash type. These rules and probabilities can indicate trends and patterns leading to crashes, including property loss or bodily harm.
To filter out important rules, three parameters (support [S], population [Po], and probability [P]) can be utilized to filter out significant rules. Support represents the proportion of the dataset where (A) and (B) co-occur, population indicates the percentage of the dataset where (A) occurs, and probability (P) denotes the accuracy percentage of the rule. To address data imbalances, the class weight parameter (w) can be employed. In this research, a 30% value is applied for the binary decision tree concerning crash severity ( 26 , 49 ). The optimal value of this parameter is contingent on the dataset’s characteristics (balanced or unbalanced), rare occurrences, and sample size. For instance, Montella et al. opted for a low probability value (P) owing to their imbalanced data, and Ashraf et al. utilized a 40% value ( 26 ), while De Oña et al. employed a higher P value owing to their balanced data ( 50 ). To prune and create a stopping criterion to prevent overfitting of the model, parameters such as the maximum number of leaves, the minimum sample size for splitting, and the maximum tree depth are used.
Random Forest
The RF model is a machine learning model used for classification and regression. In this model, several decision trees are randomly constructed, and their outputs are combined to be considered as the final output of the model ( 51 ). RF has hyperparameters similar to decision trees and bagging classifier, and its evaluation is also done using the Gini criterion ( 46 ). In this study, the RF model is used to assess the importance of variables. In this approach, the importance of each variable is determined based on the amount of error reduction in the decision tree ( 11 ).
XGBoost
The XGB model is an ensemble model, meaning that this model has been developed by combining several other models using the Boosting method to improve the accuracy and performance of the algorithm. XGB is used as one of the strongest and most effective machine learning models. This model is used for classification and regression problems and can create high-precision and overfitting-resistant predictive models (
52
). Chen and Guestrin made some improvements based on gradient boosting and introduced XGBoost in 2016. XGB is used in the classification and prediction of dependent variables, such as crash severity, to assess the importance of variables (
11
). The important parameters of this algorithm include: the number of trees used (n_estimators) in the ensemble (number of iterations), the maximum depth of the trees (max_depth), the learning rate (learning_rate) that affects the training process, and the slope of the Gaussian function (gamma). XGB adds an optimization to suppress model complexity and prevent overfitting. This cost function consists of two parts: the first part, which is related to the cost function, is usually an error function such as squared error or logistic error, and the second part is related to the penalty function. The penalty function is used to control model complexity and prevent overfitting. The new cost function for
Here, we have three main parts: the first part
Other relationships in the XGB model include relationships related to optimizing the cost function, weighting the samples, and optimizing the structure of decision trees. These relationships improve the performance and accuracy of the algorithm in predicting data ( 51 ).
Association Rule Mining
Association rule mining, also known as frequent itemset mining, is a widely used non-parametric data mining technique employed in analyzing causality within traffic safety research. A key benefit of association rule mining is that the dependent variable for rule generation does not have to adhere to a specific distribution ( 53 ). The rules generated can aid in devising strategies to disrupt the link between factors influencing accidents, thereby reducing accident risks ( 54 ). The process of discovering association rules typically occurs in two phases. Initially, factors that are optimal and prevalent (such as AV movements, locations, AV operational states, etc.) with a support value exceeding the minimum threshold are chosen using the Apriori model. These variables are categorized into antecedents and consequents. Among the factors affecting crashes, crash severity is considered the consequent, while other factors are set as antecedents and represented as conditional rules referred to as crash rules. The rules generated in the first phase are structured based on their lift values using the Apriori model and subsequently refined based on minimum confidence and support criteria ( 11 , 26 , 41 ).
The Apriori Algorithm
The Apriori algorithm was discovered by Agrawal and his colleagues at the IBM research center and can be used to generate all frequent itemsets or association rules (
11
). In this research, the Apriori algorithm analyzes the connections among factors and investigates the mechanism of crashes caused by AVs concerning the dependent variable of crash severity. Association rules are extracted from the crash database obtained from CA DMV reports using Python with the mlxtend and apriori libraries. The working principles of this algorithm are discussed below. Let I = {g1,g2,g3,......,g
n
} be a set of variables such as driving condition, lighting condition, and so on and let D = {c1,c2,c3,......,c
n
} be a set of crash events. Each crash event in D occurs owing to a unique combination of variables in I, which we call its crash rule. Therefore, each consequence in D consists of a subset of antecedents (items) in I. A rule is defined as an implication of the form
In this study, for the dependent variable, crash severity (bodily injury and property damage) is considered as the consequence or outcome, and various factors influencing crashes like crash location, driving condition, and so on, are viewed as antecedents. To distinguish significant rules from the complete set of rules produced by the Apriori algorithm, diverse criteria can be employed. In the Apriori algorithm, three key indicators are vital for uncovering association rules. The most recognized criteria for determining the minimum threshold are lift (L), support (S), and confidence (C) ( 44 , 55 ). The support of a rule represents the percentage of the entire dataset encompassed by the rule and is denoted as Equation 3.

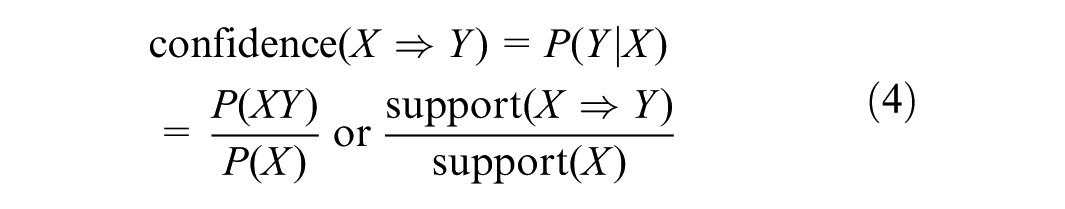
The confidence of an association rule is the conditional probability of the consequence occurring when the antecedent(s) have occurred, and is defined by Equation 4.
Additionally, the lift value is used to measure the mutual dependence between the antecedents and the consequence of a rule. Lift measures the ratio of the confidence of a rule to the expected confidence of a rule, given the occurrence of the antecedent(s), and is expressed as Equation 5.
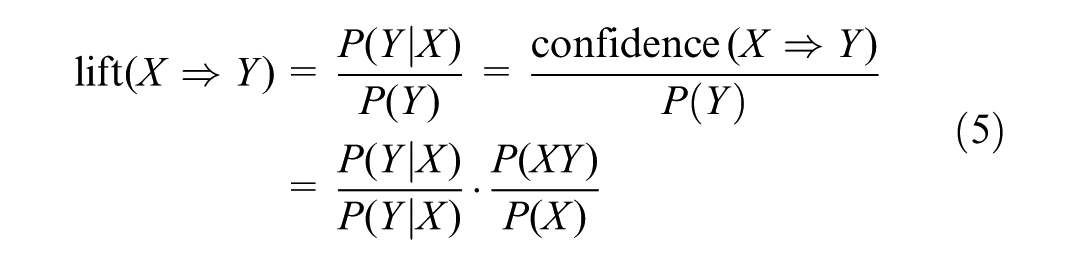
Equation 4 shows that when the value of L is greater than one, the occurrence of X increases the likelihood of Y occurring. Otherwise, the rule is invalid ( 54 ). Lift is more important than support and confidence in determining the strength of an association rule ( 26 ). In this study, a minimum lift value of 1 is considered, and the criteria of support and confidence must be obtained through trial and error ( 26 ). In summary, the algorithm for extracting rules is according to Figure 1. The RF model has similar hyperparameters to decision tree and bagging classifier, and its evaluation is also done using the Gini criterion ( 46 ). In this study, the RF model is used to assess the importance of variables. In this method, the importance of each variable is based on the amount of error reduction in the decision tree.
Statistical Algorithms
Contingency Table
A contingency table is a two-dimensional table in which we simultaneously examine two or more variables. This table is utilized to explore the correlation between a dependent variable and other variables. The dependent variable is listed in the columns, while the independent variables are listed in the rows. Each cell in the table shows the percentage of observations in which the classes of each variable were involved. This table is executed using the pandas library in Python. Information extraction from a contingency table is done using the formula of the chi-square test statistic and calculating the P-value and Degrees of Freedom. This method is also known as Pearson’s chi-square test (
56
). The formula for calculating the (

where O is the observed frequency and E is the expected frequency under the null hypothesis. The degrees of freedom (df) are calculated by the following Equation 7:

In the above formula, r is the number of rows and c is the number of columns. In this study, a contingency table is calculated for each dependent variable of crash severity and other variables.
Default Values for Model Parameters
For the CART model, hyperparameters such as maximum depth, minimum samples split, and minimum samples leaf were optimized using Grid Search Cross-Validation (Grid Search CV). Similarly, for other machine learning models, parameters including learning rate, max depth, and number of estimators were fine-tuned to achieve optimal performance.
Table 2 shows the parameters used for running each of the machine learning models in the Python programming language.
Parameters of Machine Learning Models
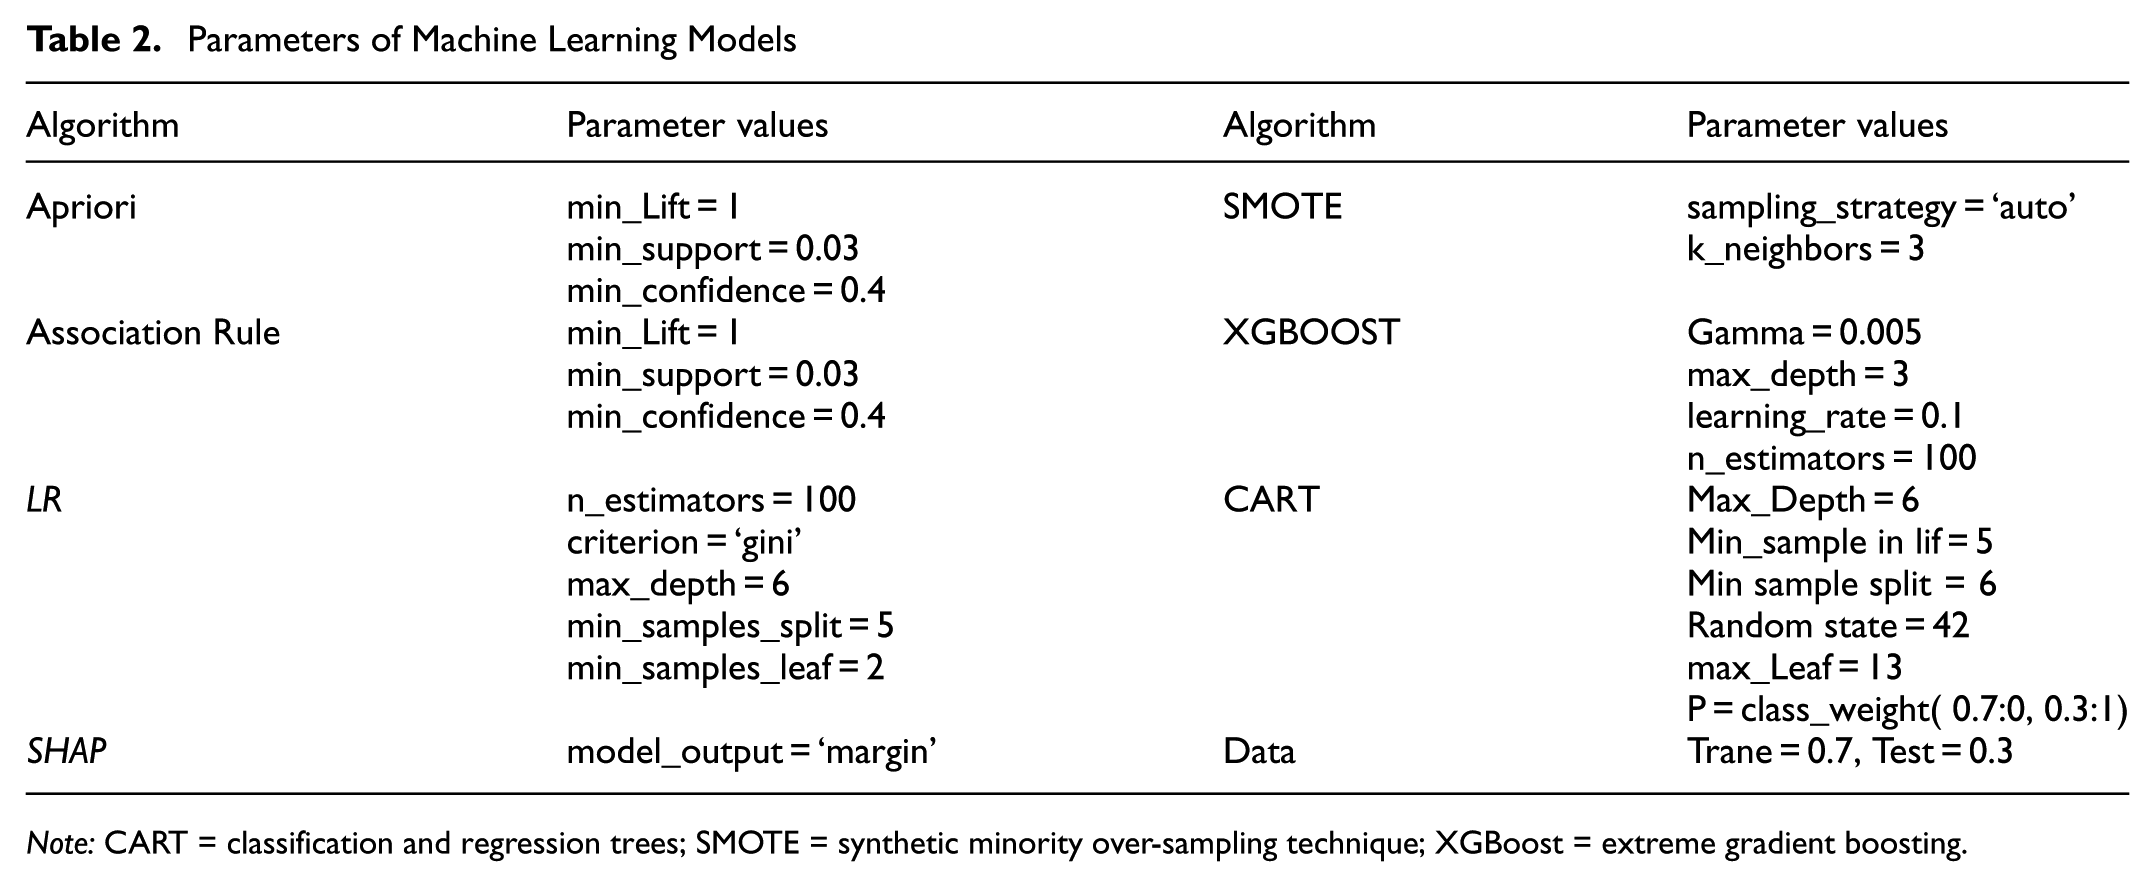
Note: CART = classification and regression trees; SMOTE = synthetic minority over-sampling technique; XGBoost = extreme gradient boosting.
To optimize the hyperparameters of our machine learning models, we employed Grid Search CV. This method systematically explores a range of hyperparameter values to identify the optimal configuration for each model.
Evaluation Metrics
Confusion Matrix
The confusion matrix, or error matrix, is used as an evaluation tool in classification problems to measure the accuracy of different models. This matrix mainly helps us compare the classification result with the actual measured value to understand how well our model has succeeded in detecting severity classes of crashes. This matrix consists of four main values: TP, TN, FN, and FP. Using these values, various evaluation metrics such as accuracy, sensitivity or recall, precision, and the G-Mean can be calculated.
Accuracy: in Equation 8 The ratio of the number of correctly classified samples (TP + TN) to the total number of samples (TP + TN + FP + FN).

Precision: in Equation 9 The ratio of the number of positive samples correctly identified (TP) to the total number of samples that the model identified as positive (TP + FP).

G-Mean: This is a logical measure for evaluating unbalanced data by balancing the classification accuracy of minority and majority cases ( 52 ). G-Mean is calculated as in Equation 10.
To calculate the G-Mean, we first need to calculate recall and specificity.

Additional Explanation of SHAP
In data mining and data analysis, interpreting the results of classification models to justify model predictions and understand their causes is very important. In fact, interpretability is as important as accuracy and precision. In this study, we use the SHAP method to interpret our machine learning models. SHAP is a valid method for interpreting predictive models based on cooperative game theory. It was introduced by Simon and his colleagues in 2017. The purpose of this part of the research is to investigate in detail the effect of input variables on the predictions of a machine learning model for the dependent variable of crash severity. By conducting this study, we can determine which variables have the greatest impact on our model’s predictions and how these variables contribute to the generation of output for crash severity models and collision types. These results can help us make decisions and interpret the interpretability of machine learning models ( 11 ). Equation 11 calculates the SHAP values.

where
Results
Descriptive Statistics of Crash Data
A bar chart in Figure 4 shows the frequency distribution of crashes in different driving modes (including autonomous driving system [ADS], manual driving, and driverless) between September 2014 and September 2023. The AV mode refers to vehicles operating with a human driver present, while driverless mode refers to fully AVs without a human driver. The penetration of AVs has increased significantly over the years, with a notable rise in crashes involving driverless vehicles since 2022. The highest number of crashes with active ADS occurred in 2022, and from 2022 onwards, it has the highest crash rate. From 2019 to 2021, owing to the restrictions imposed owing to COVID-19, the testing of AVs was also limited ( 57 ), which is clearly evident in the chart. Crashes involving driverless vehicles have been reported since 2022. An important point between the crash statistics of 2021 and 2022 is the equal number of crashes in manual driving mode, while the number of crashes with active ADS showed considerable growth in 2022. This could indicate users’ confidence in the ADS system. Possibly owing to the improvement of AV systems, users prefer to hand over control to the autonomous system ( 35 ).
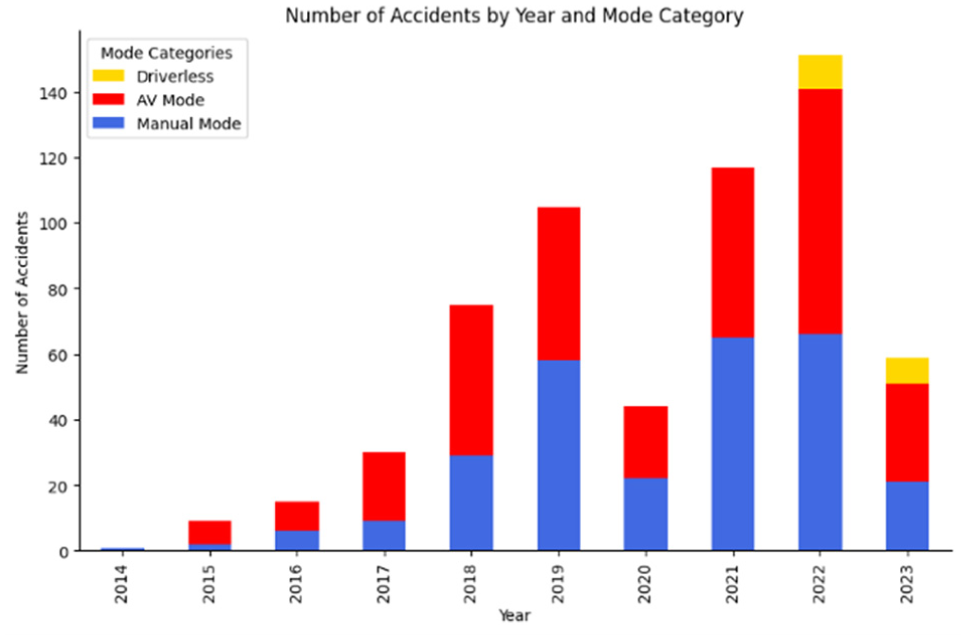
Descriptive statistics of California Department of Motor Vehicles (CA DMV) data as of December 31, 2023.
Figure 5 shows that AVs have recorded 50.8% rear-end collisions, 23.8% side collisions, 7.92% frontal collisions, and 7.43% angular collisions, while non-AVs have mostly collided from the front and sides. 51% of crashes involve active ADS, and about 3% of crashes involve driverless vehicles.
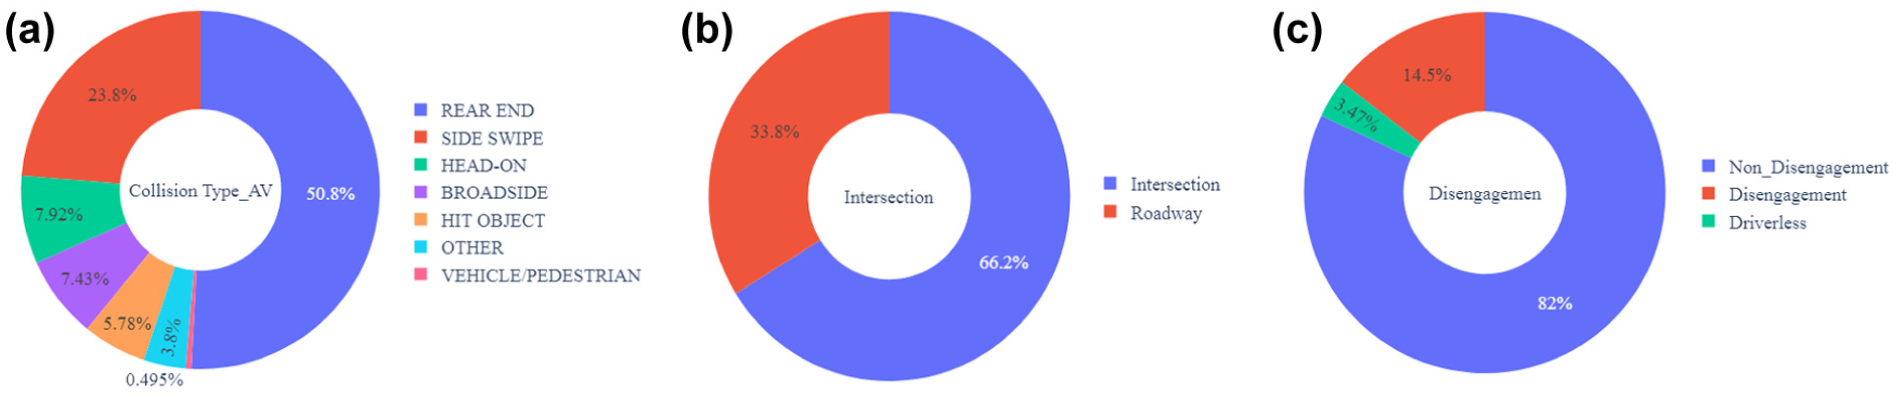
Descriptive statistics of California Department of Motor Vehicles (CA DMV) data: (a) types of autonomous vehicle (AV) collisions; (b) types of intersections at the collision site; (c) types of autonomous driving system (ADS) disengagement.
Data show that 66.2% of crashes occur at intersections, with 53% of them happening at signalized intersections. It is seen that 82% of crashes occur without disengagement, and 14.5% involve disengagement of ADS before the crash occurs.
CART Model Results for Crash Severity
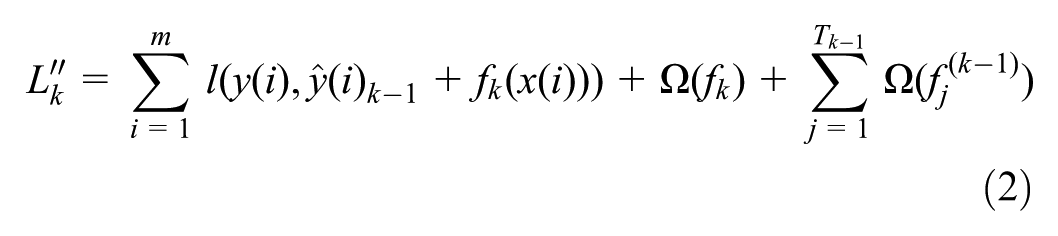
The CART model was developed using the decision tree model, where 70% of the crash data was used for training and 30% for model validation. The accuracy of the CART model was 82%, and the precision was 71%. In this study, we classified crash severity into two categories similar to some previous studies: property damage and bodily injury ( 11 , 30 ). Based on the CART results in Figure 6, trends and rules for crash severity have been extracted in Table 3:
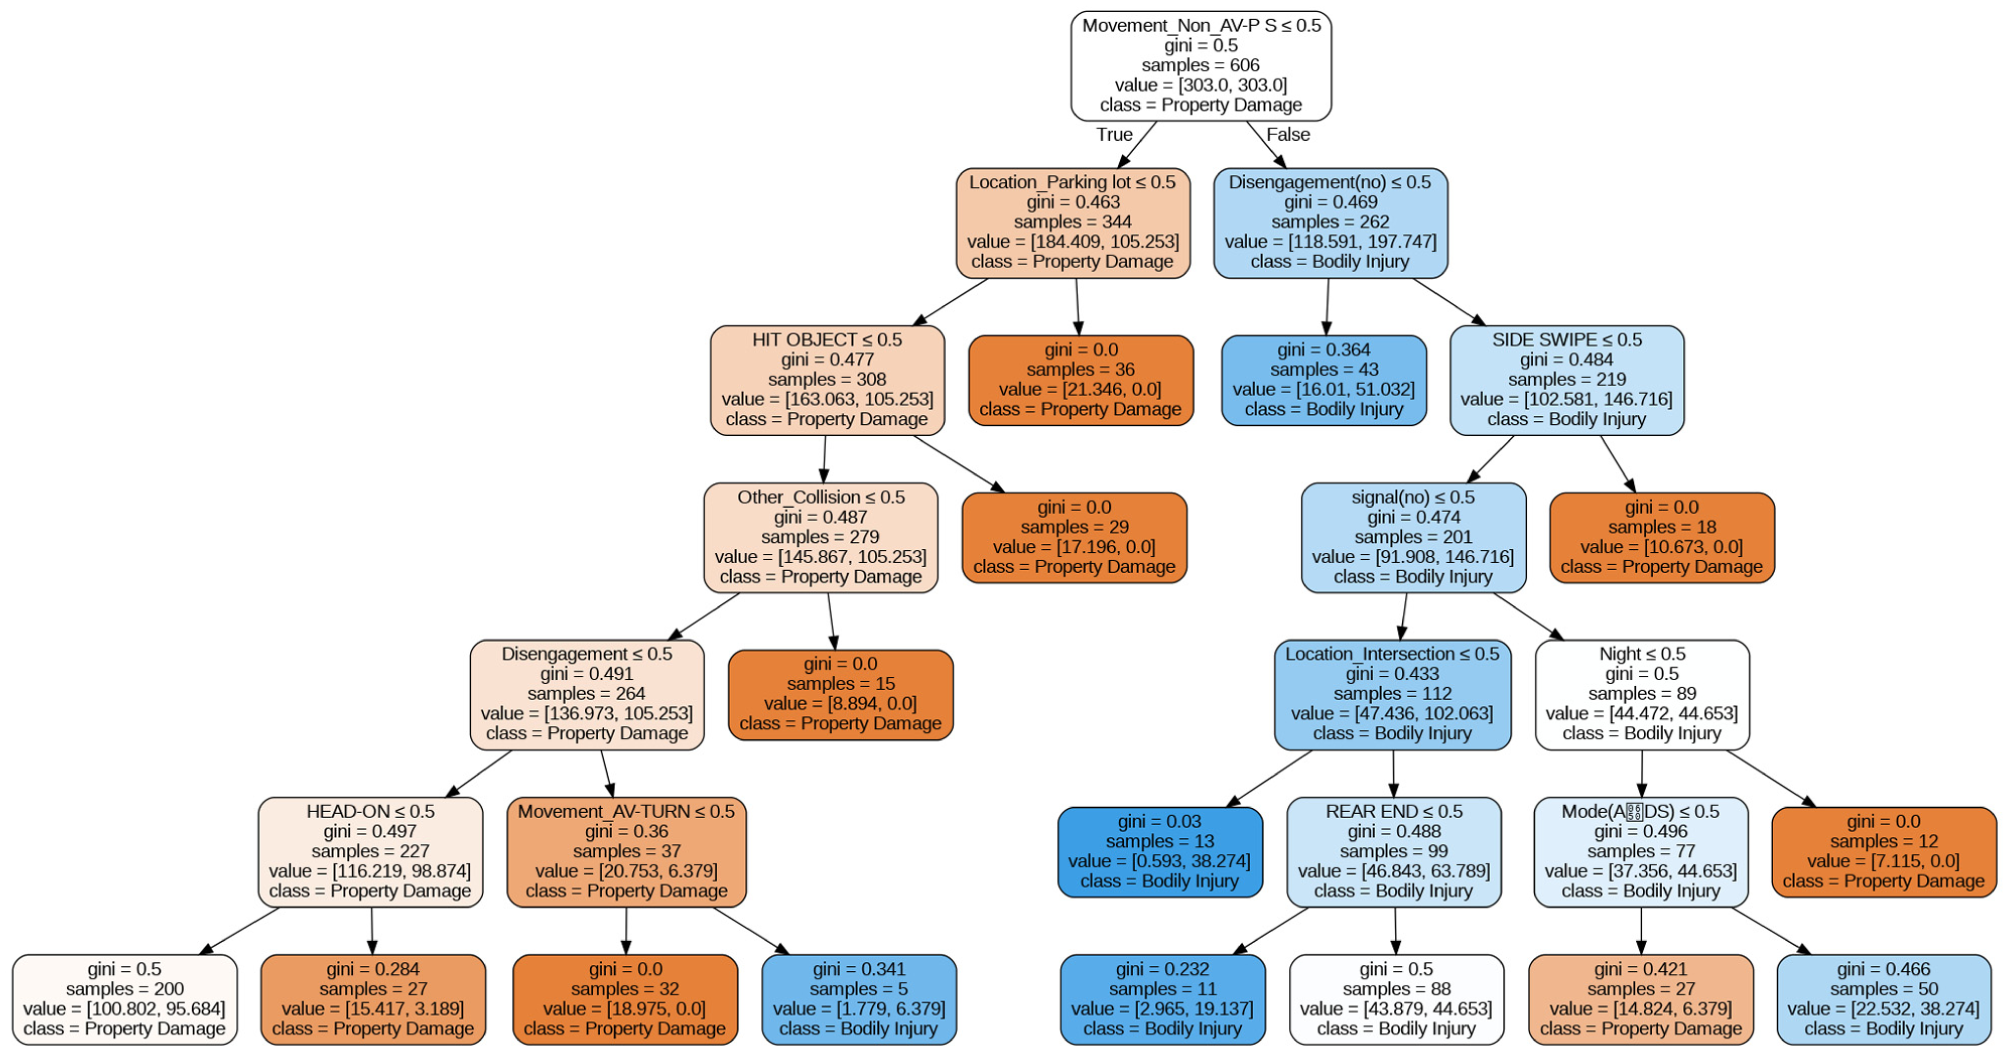
Decision tree for classification and regression for the variable crash severity.
Classification and Regression Tree Results for Crash Severity
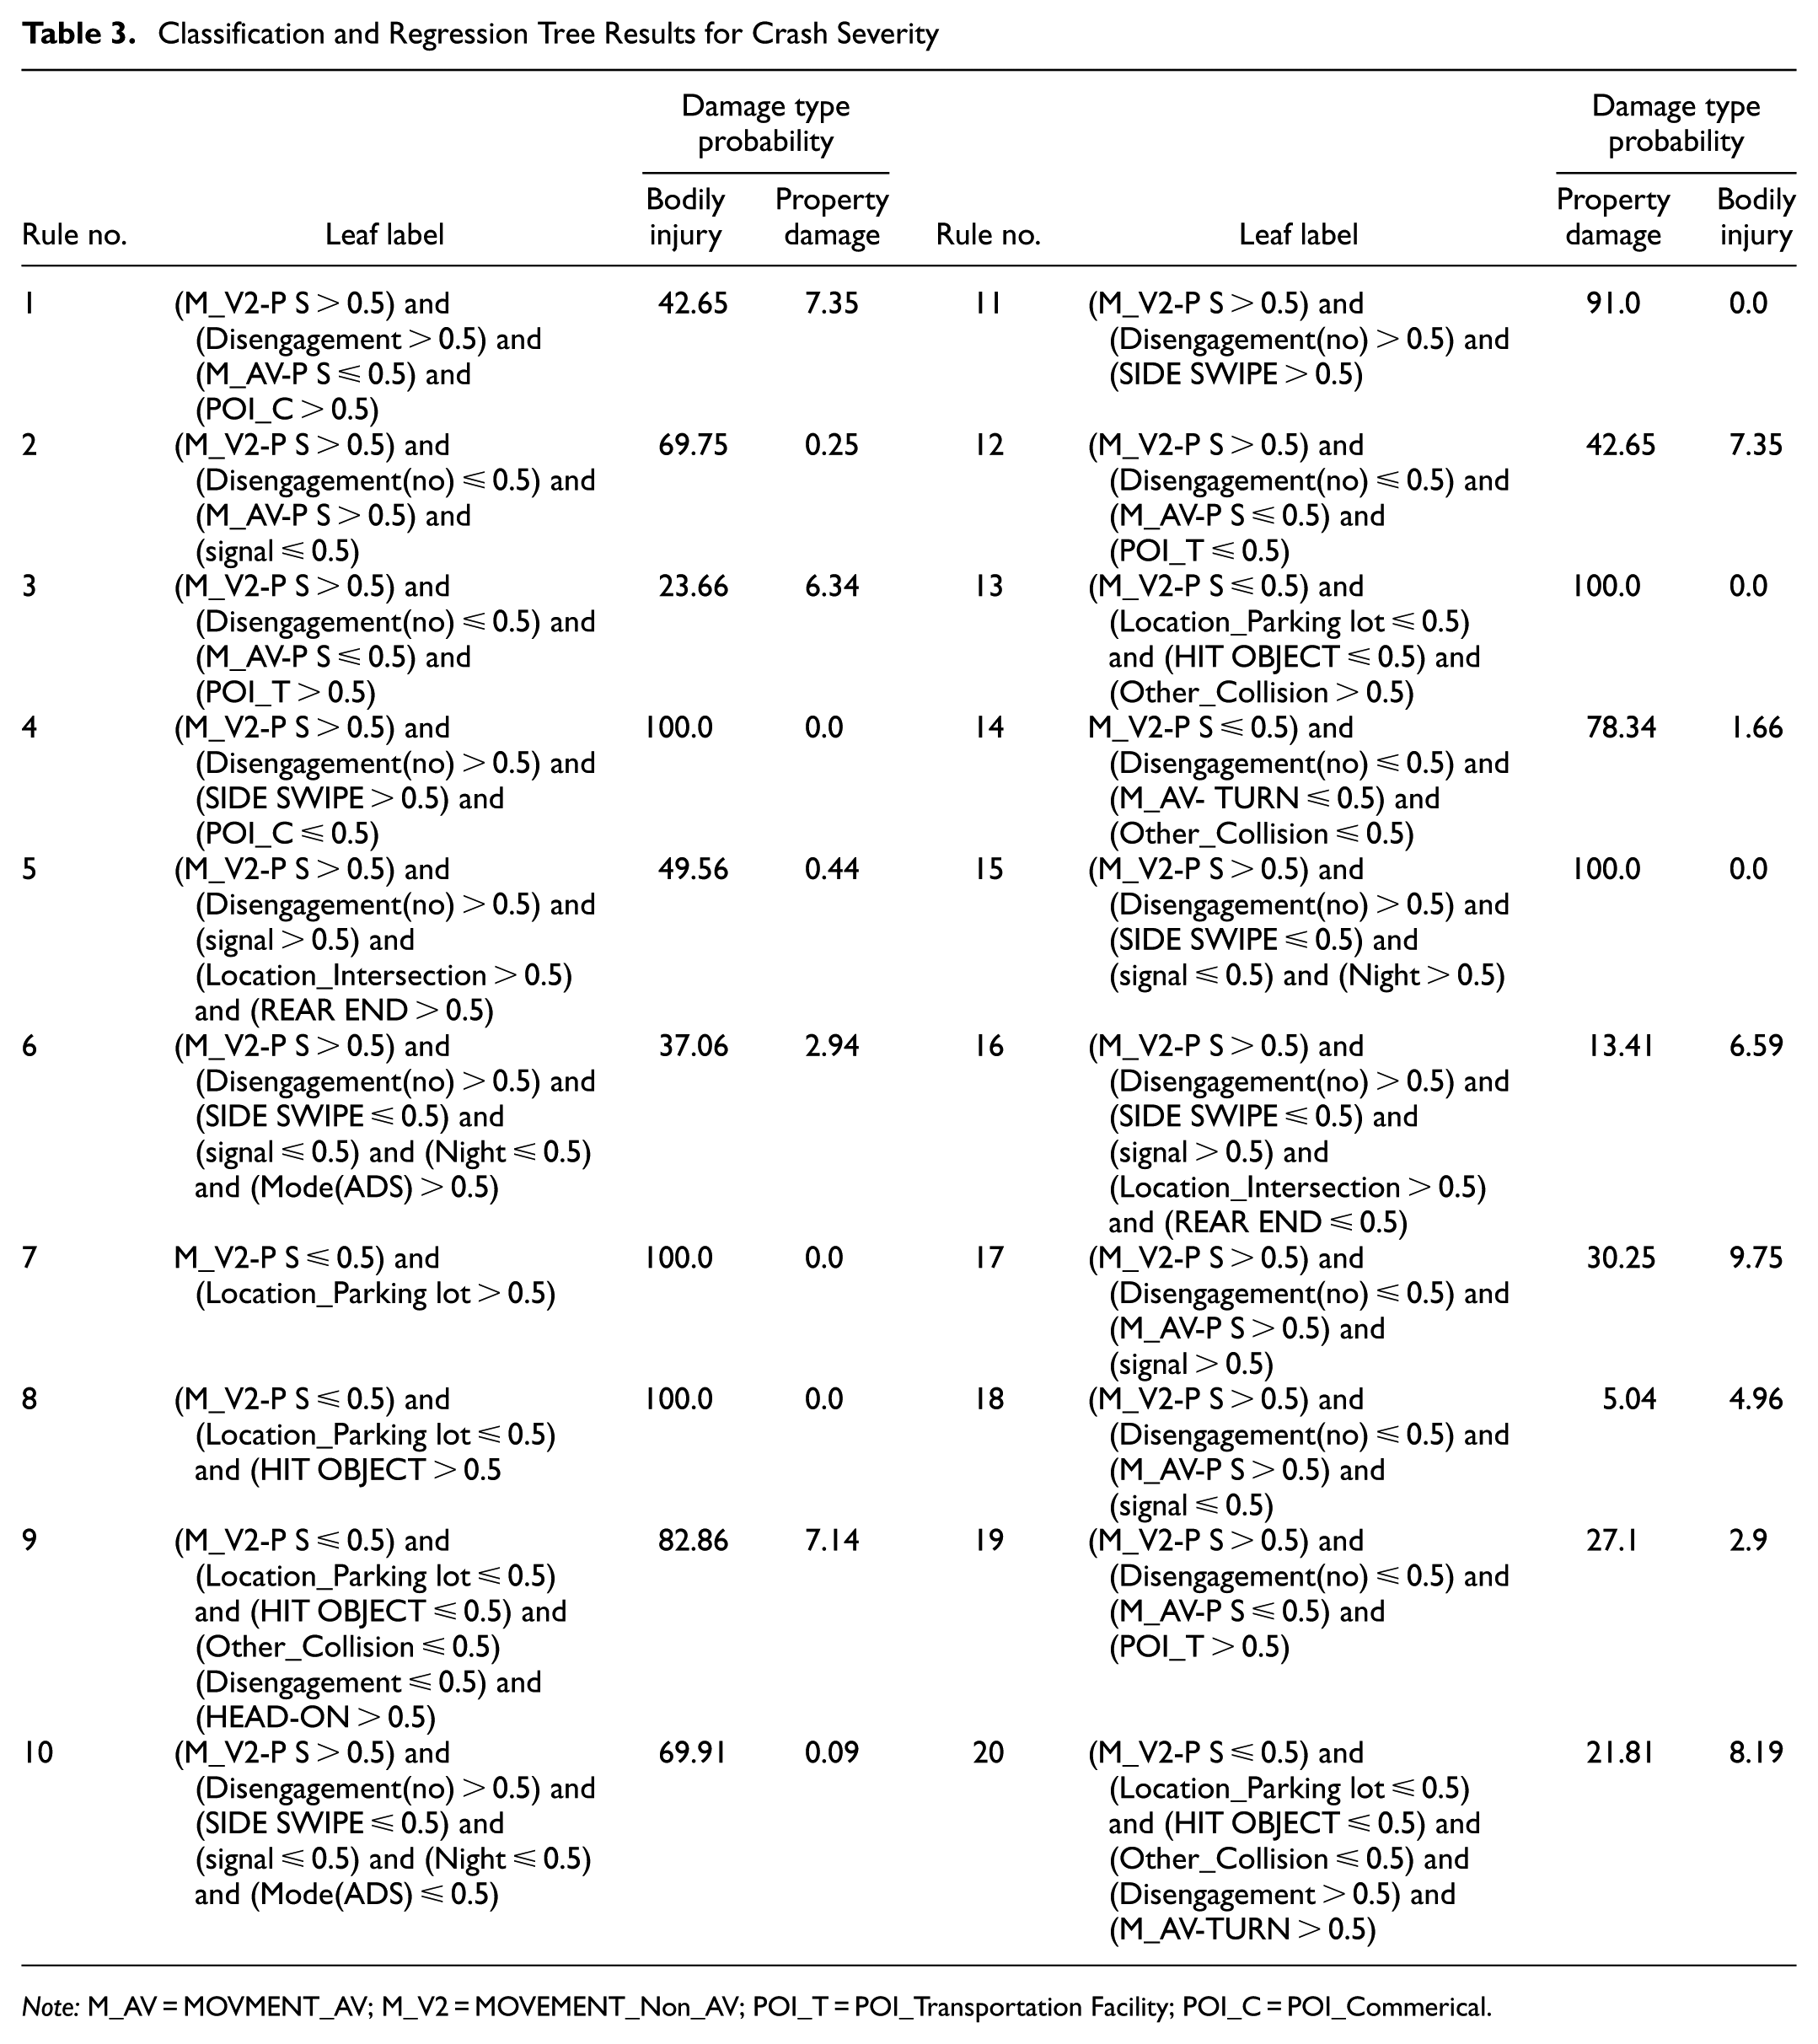
Note: M_AV = MOVMENT_AV; M_V2 = MOVEMENT_Non_AV; POI_T = POI_Transportation Facility; POI_C = POI_Commerical.
Property Damage CART Model
Property damage includes 84.3% of all AV crashes. Examination of the rules shows that disengagement, traffic light, and various collision types are variables influencing property damage. According to CART rules, in most cases, a crash results in property damage if there is no disengagement, if the intersection is without a traffic light, or if the crash location is in parking spaces. Also, if the collision type is sideswipe or involves collision with an object or other less frequent collision types, the probability of property damage is higher than bodily injury. In the case of a rear-end collision, if the non-AV vehicle does not move directly forward, the probability of property damage is higher.
Bodily Injury CART Model
Another type of crash severity is bodily injury, which comprises 15.7% of crashes involving AVs and leads to various degrees of injury, including minor, moderate, severe, and fatal injuries. These collisions usually also involve severe property damage to the vehicles. According to Rule 1 of CART, when the AV was stopped at a POI involving public use, the non-AV was directly in motion, and the ADS was deactivated before the collision, there was a 57% probability of bodily injury. Comparing Rules 1 and 19 of CART shows that the probability of bodily injury increases by 16% near transport utilities. According to Rule 3 of CART, when the AV was stopped at a POI involving transport utilities, the non-AV was directly in motion, and there was no disengagement, the probability of bodily injury was 76%. Comparing Rules 1 and 3 of CART reveals that if the crash location is near transport utilities, the probability of bodily injury increases by 19%. According to Rule 5 of CART, when there was a traffic light at an intersection without disengagement, the non-AV was directly in motion, and the collision type was rear-end, the probability of bodily injury and property damage was 50%. However, when the collision type was not rear-end or sideswipe and other conditions of Rule 5 of CART were met, the probability of bodily injury increased to 87%. According to Rule 6 of CART, when there was an intersection without a traffic light and the weather was clear, while the ADS was active and the collision type was not lateral, the probability of bodily injury was predicted to be 63%.
According to Rules 17 and 18 of CART, when both the AV and the non-AV were directly in motion and there was no disengagement, if the intersection had a traffic light, the probability of bodily injury was 70% (Rule 17 of CART), and if the intersection did not have a traffic light or the crash location did not involve an intersection, the probability of bodily injury increased to 95% (Rule 18 of CART). According to Rule 20 of CART, when the non-AV had movements other than direct movement (such as stopping, turning, merging, overtaking, lane changing, etc.) and the AV was maneuvering, and disengagement occurred in the ADS, a 78% probability of bodily injury was predicted. However, when the AV did not perform maneuvering movements, the probability of property damage was higher (Rule 14 of CART). A comparison of Rules 14 and 20 shows that maneuvering movements of the AV can increase the probability of bodily injury.
A comparison of rules showed that five out of eight rules leading to bodily injury were associated with disengagement, and when the non-AV had movements other than direct movement and the AV had movements other than direct movement (such as stopping, turning, merging, overtaking, lane changing, etc.), the probability of bodily injury was higher. Bodily injury was more observed at intersections with traffic lights and non-lateral collision types. Also, at intersections without traffic lights, if disengagement occurred, the probability of bodily injury was higher.
Evaluation of the CART Model for Crash Severity
The results of the confusion matrix show an accuracy of 82% for the 70% training data and an accuracy of 71% for the 30% test dataset. Other evaluation parameters are shown in Table 4. The model error was calculated at 18%, which is acceptable. The Gini coefficient value indicates that the tree is still expandable, but to prevent overfitting and therefore a decrease in the model accuracy, pruning was performed using stopping criteria.
Evaluation metrics for the classification and regression trees (CART) model of crash severity
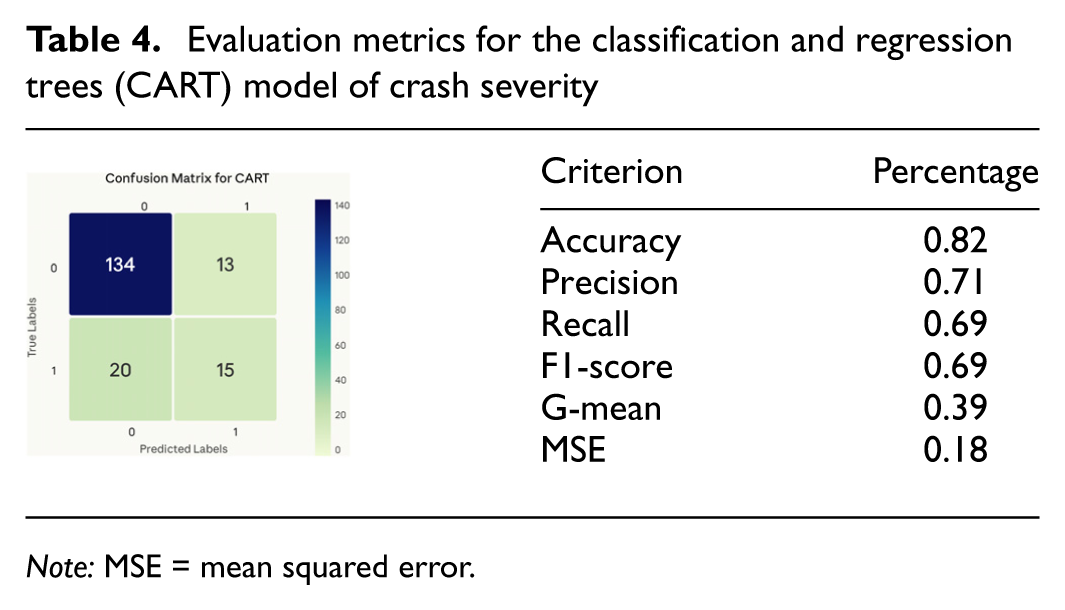
Note: MSE = mean squared error.
Association Rule Model
Association rules are usually extracted using Apriori, Eclat, and FP-Growth models. In this study, we used the Apriori model owing to its history in traffic safety studies ( 11 , 26 ), using the mlxtend library in the Python programming language. In the following section, the results of extracting association rules using the Apriori model for discovering patterns and dependency rules from AV crash data are presented. These rules include frequent variables as antecedents and classes of the dependent variable as consequences.
Results of the Association Rules Model with Apriori
To generate association rules using the Apriori model, 14 crash features (AV crash location, road type, driving mode, ADS disengagement, AV movements during crash, non-AV movements during crash, lighting conditions, weather conditions, POI, peripheral parking space, AV damage severity, peak traffic hour, crash severity, and types of collisions) were used in binary form (41 binary variables). This study used trial and error and a literature review ( 11 ) to select a minimum support of 0.03, a confidence value of 0.4, and a lift value of 1. The lift value for all generated rules was greater than 1, indicating that the antecedents and consequences were positively associated with all rules. In the next step, crash severity, including property damage and bodily injury, as the consequence, and factors affecting crash severity, as the antecedents, were separated and filtered. The extracted rules are presented in Table 5.
Association Rules for Crash Severity
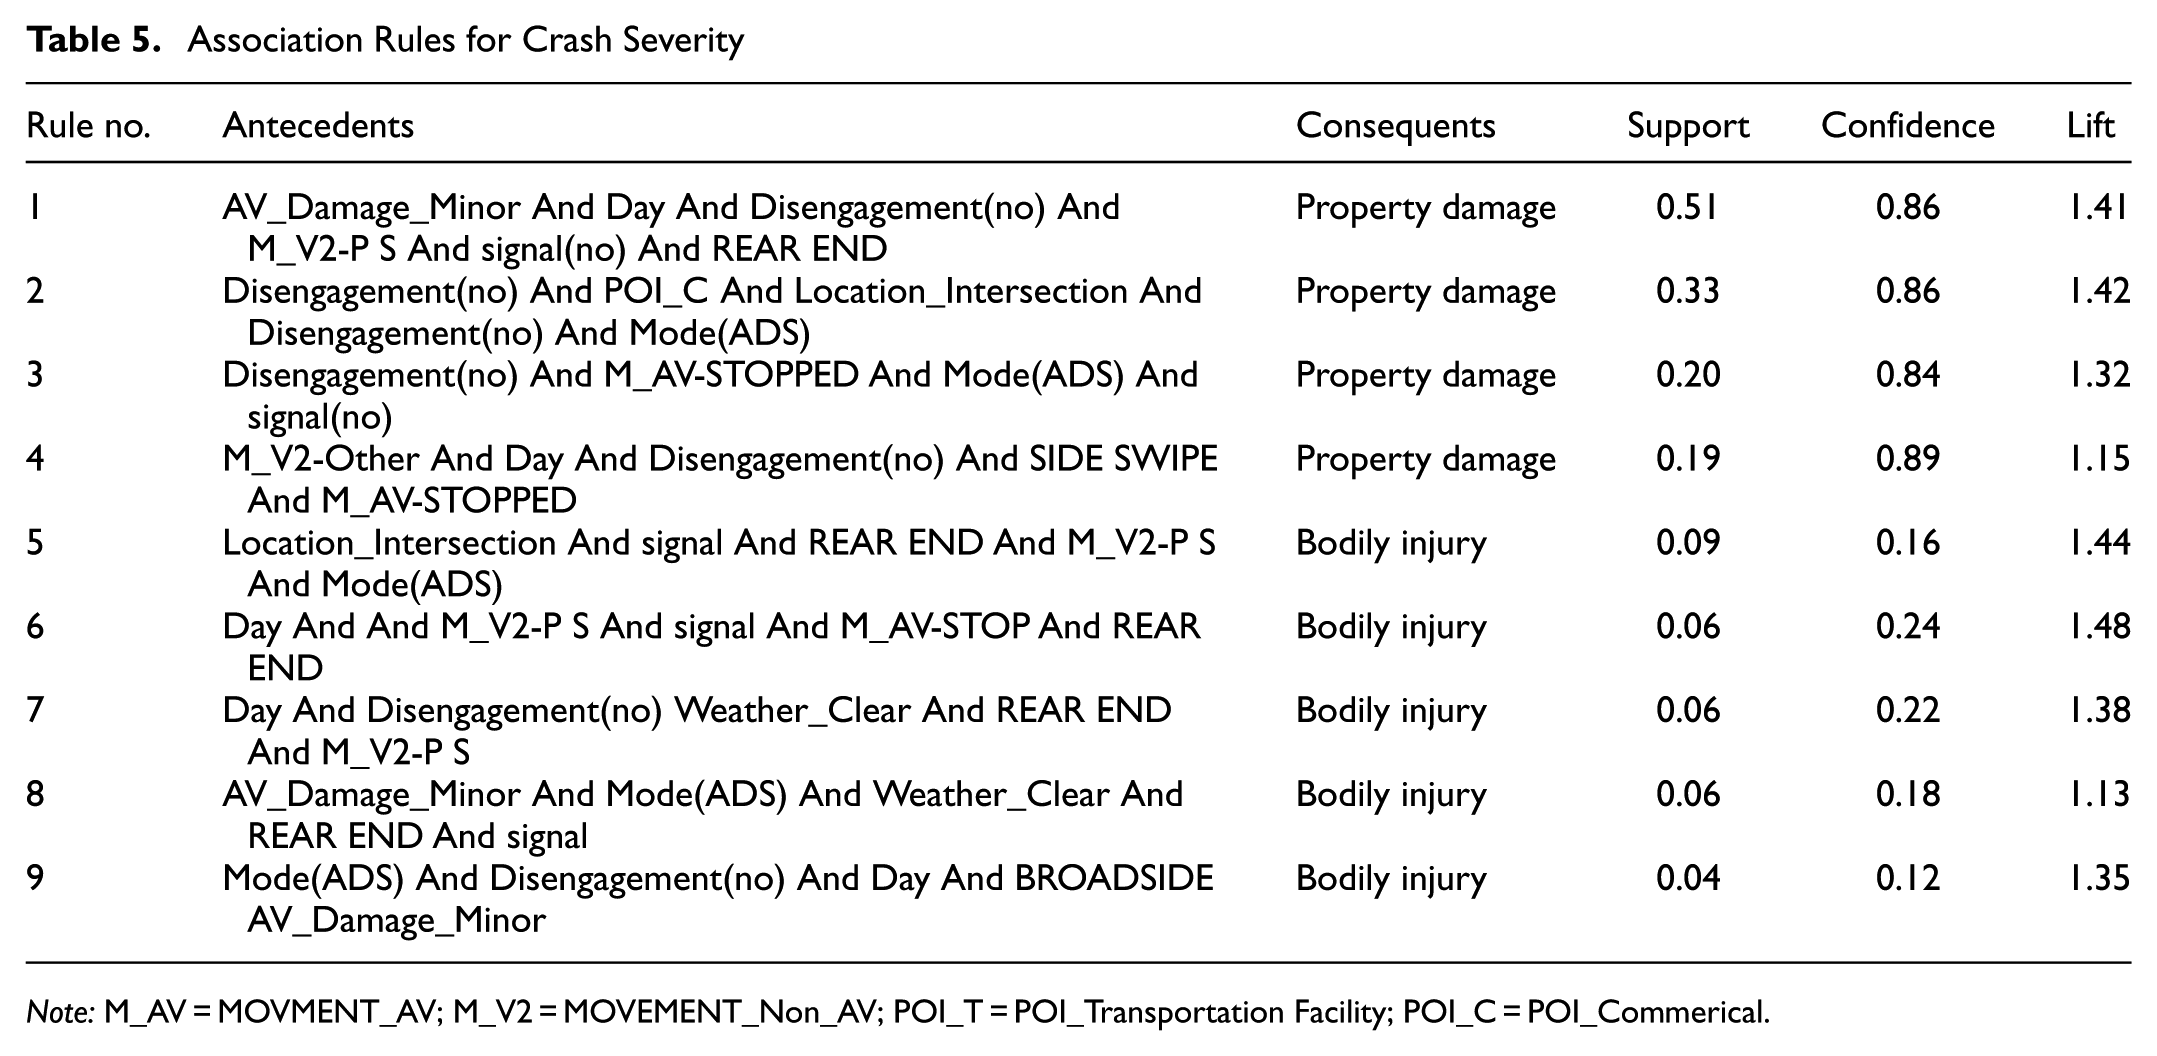
Note: M_AV = MOVMENT_AV; M_V2 = MOVEMENT_Non_AV; POI_T = POI_Transportation Facility; POI_C = POI_Commerical.
Property Damage Association Rules
Rules 1, 2, 3, and 4 (Table 5) are related to crash severity with property damage. These four rules indicate similar findings as revealed by Rules 2, 4, and 7 to 15 of CART (Table 3). Scenario 1 showed that in an intersection without a traffic light, a non-AV vehicle collided with the rear end of an AV, the weather was clear, and ADS disengagement did not occur, and the damage to the AV was less than average (no damage, minor, and moderate). Scenario 2, occurring at an intersection with active ADS and near public amenities, showed a high-confidence pattern for crashes involving the results of statistical models
Property Damage
Rule 4, involving a sideswipe collision type in clear weather, with the AV stopped and the non-AV performing maneuvers such as parking, overtaking, lane changing, merging, exiting traffic, or rotational maneuvers, and no ADS disengagement by AV driving, had a high-confidence level for a crash resulting in property damage. Overall, the extracted association rules show us this recurring scenario: at an intersection without a traffic light, with the POI near public places, the AV was stopped in ADS mode without disengagement, and the non-AV was in direct motion. Also, the type of collision was rear-end to AV (Rule 1) and sideswipe collision (Rule 4). Rule 1 (i.e., when it is a rear-end collision), has a support of 0.505, and Rule 4 has a support of 0.193, indicating that the number of rear-end collisions is much higher than sideswipe collisions. By reviewing crash reports, we also find that 246 collisions with rear-end collision type and 127 sideswipe collisions resulted in property damage.
Bodily Injury Association Rules
Another classification of crash severity is crashes involving bodily injury. Rules 5, 6, 7, 8, and 9 (Table 5) are related to crash severity with bodily injury. These five rules indicate similar findings as revealed by Rules 1, 3, 5, 6, and 16 to 20 of CART (Table 3). Overall, the extracted association rules show us this recurring scenario: at an intersection with a traffic light, while the AV was stopped in ADS mode without disengagement, and the non-AV was in direct motion. Also, the type of collision was rear-end to AV (Rules 5, 6, and 7) and broadside collision (Rule 9). The support of Rule 8 is 0.056, indicating that the number of rear-end collisions is much higher than broadside collisions. Rule 6 indicates that the AV was stopped, the non-AV was in direct motion, at an intersection, in clear weather, and rear-end collisions are variables with higher confidence and lift values. This means that in crashes involving bodily injury, these variables are repeatedly present. By reviewing crash narratives, we find that 60 collisions with rear-end collision type and 14 angular collisions resulted in bodily injury.
Comparison of Apriori Model Results with CART Model
The results of both the decision tree algorithm and association rules complement each other, and their results are almost similar. The most important difference between these two models is that association rules, owing to the lack of CART method restrictions, can use a wider range of variables for rule extraction; however, it is suitable only for examining frequent scenarios. In relation to CART rules, in addition to frequent factors, it can also be used to examine observations with fewer repetitions. In general, the CART model and association rules complement each other; as the results show, each model provides new information that was not mentioned in the other model. Overall, these two models complement each other, and using either alone could not provide a comprehensive insight into the analysis and mechanism of crashes involving AVs. Therefore, the results of these models can be used to develop mutual actions to reduce AV-related crashes in the future and contribute to improving mixed traffic safety.
The extracted rules indicate that rear-end collisions are most frequent, particularly at intersections without traffic lights. Sideswipe collisions, on the other hand, are more common at night and often result in property damage. These findings suggest the need for improved sensor technologies and traffic control measures at high-risk locations.
Cross-Tabulation Results (Pearson Test)
Before conducting statistical analysis, variables with VIF parameters greater than 10 were removed owing to strong correlation with other variables. Then, the independence of variables was checked, and independent variables were selected for statistical analysis. The cross-tabulation table was executed using the Pandas library in Python. Some applications of this method include investigating relationships between variables, examining the frequency distribution of data, and evaluating differences and patterns between variables. The evaluation of this table is done using the Pearson test and the null hypothesis test
Analysis of Cross-Tabulation Results for the Crash Severity Variable
To analyze the variables using this method, the null hypothesis test should first be performed to determine the significance levels of each variable relative to the dependent variable.
Evaluation Criteria for the Cross-Tabulation Table of the Crash Severity Variable
The results of the null hypothesis test in Table 6 showed that at a significance level of 5%, the car manufacturer, type of collision, crash location, and non-AV movements have the greatest impact on crash severity. Lighting conditions, weather conditions, land-use, and road surface conditions are also significantly correlated with crash severity at higher levels. According to the Pearson test results, we should focus on variables with a high correlation with crash severity. Among the three manufacturers with the most AV tests (Cruise, Waymo, Zoox), Cruise has ended 27.6% of its crashes with injuries. The results did not show which types of collisions caused more injuries, but in order, rear-end collision, angle collision, and sideswipe collision were responsible. 31% of crashes with broadside collisions and 20% of rear-end collision crashes resulted in bodily injuries to the occupants of the vehicles. The most damage as regards secondary vehicle type involved in the crash is related to two-wheeled vehicles such as motorcycles, bicycles, skateboards, scooters, and so on, with 46% of these collisions resulting in bodily injuries. In relation to movements before the crash, AV movements such as left turns accounted for 27%, slow or stopping movements for 19%, and direct forward movements for 17% of bodily injuries. Non-AV movements, such as stopping or slow movements, accounted for 27%, direct forward movements for 24%, and movements in the wrong direction for 20% of bodily injuries.
Cross-tabulation Results and Null Hypothesis Testing of Crash Severity with Other Variables
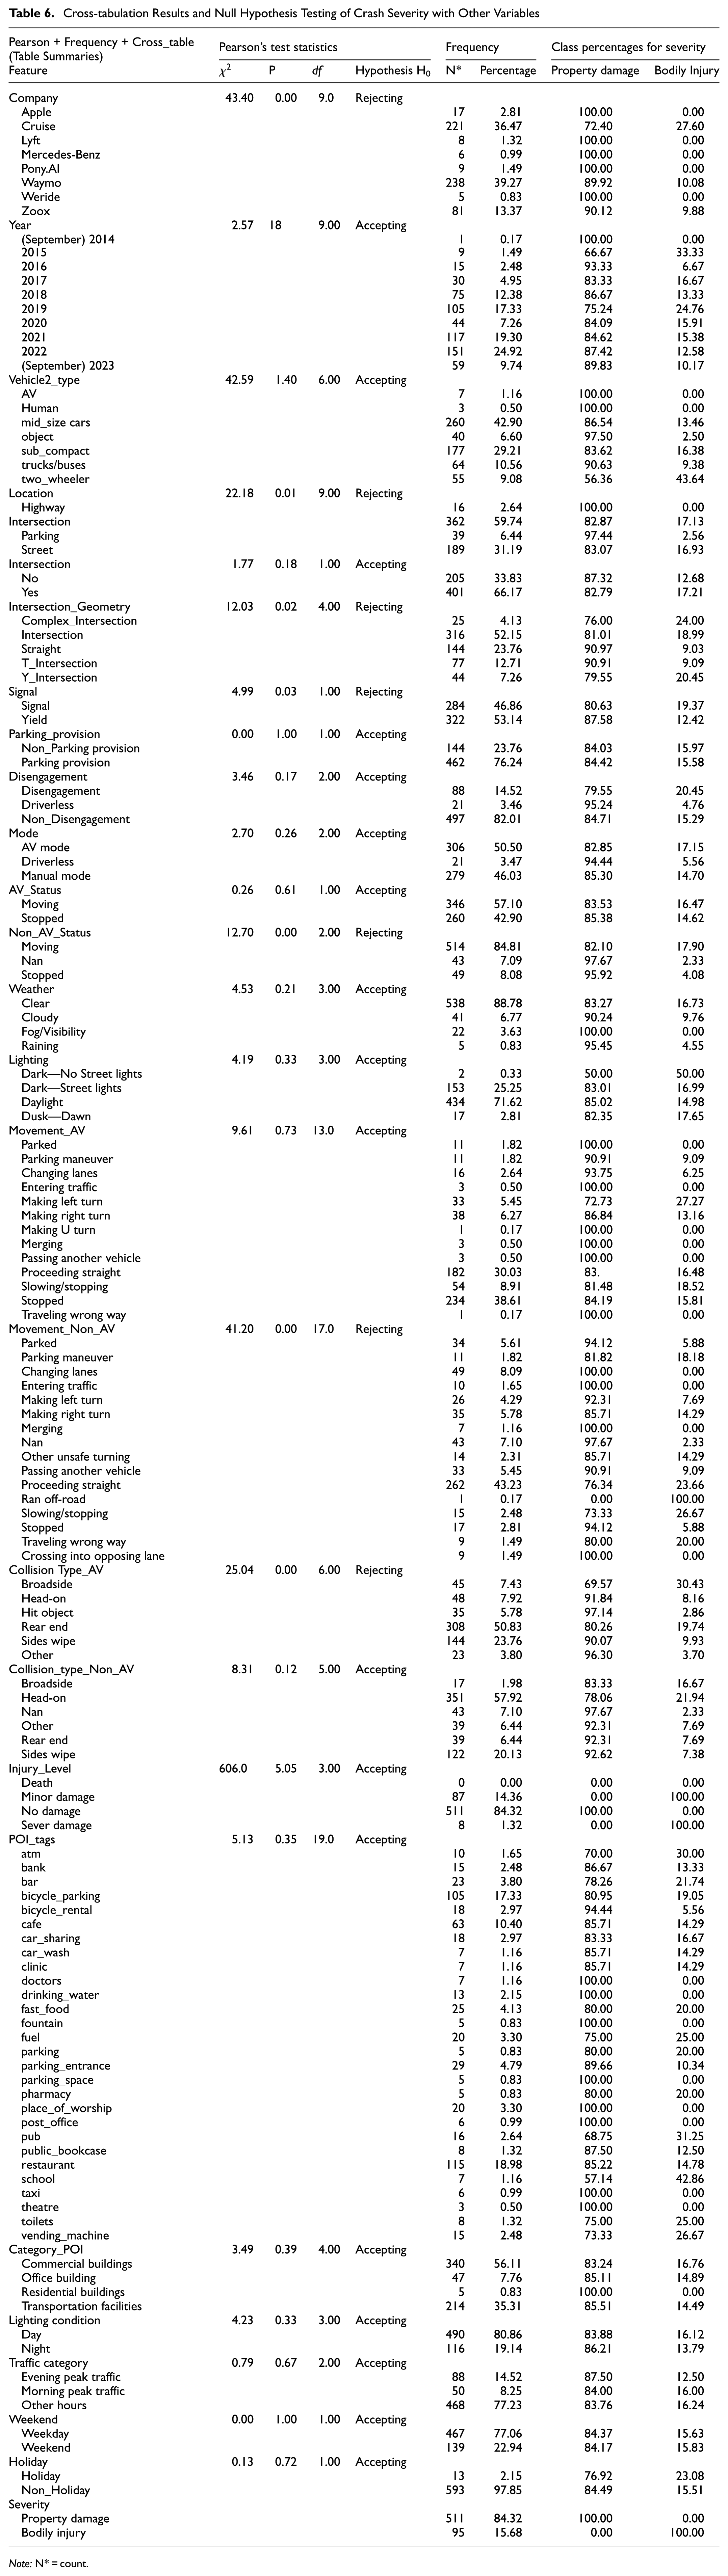
Note: N* = count.
Weather conditions did not have a significant impact on crash severity, but contrary to weather conditions, lighting conditions were very important. 50% of crashes occurred in darkness with no lighting on the roads resulting in bodily injuries, while in conditions where the roads were illuminated in dark weather, the rate of bodily injuries decreased from 50% to 17%. Also, during sunrise and sunset, 18%, and under normal and daylight conditions, 15% of crashes resulted in bodily injuries. In relation to road type, crashes on boulevards resulted in 19% bodily injuries, and all crashes on highways and parking spaces resulted in property damage. The presence of traffic lights at an intersection is associated with 19% of bodily injuries, and the right-of-way sign with 12% of bodily injuries. Also, the type of intersection affects crash severity; if the crash occurs at complex intersections with more than four roads converging, 24% results in bodily injuries. These figures are 20% for Y-shaped intersections and 19% for four-way intersections. Approximately 17% of all crashes in autonomous driving mode and 15% in manual driving mode resulted in bodily injuries.
In relation to points of interest (POI) variables, 50% of crashes in the vicinity of car rental locations, 43% near schools, 33% near dentists, 31% near bars, 27% near vending machines, gas pumps, and public toilets, and 19% near bicycle parking resulted in bodily injuries. In relation to the number of crashes, restaurants, bicycle parking, cafes, and parking entrances had the highest number of crashes, respectively. When disengagement occurs, 21% result in bodily injuries, while if disengagement does not occur, 15% result in bodily injuries, and for Level 4 automation vehicles without a driver, 5% of crashes result in bodily injuries.
Evaluation Criteria for Crash Severity Models
For crash severity, similar collision types with the same models and percentages of training and evaluation data were modeled in Python, and the criteria were extracted. According to Table 7, the results showed that among machine learning models, XGB had the highest accuracy and precision, the lowest MSE value with 0.14, and the lowest TN or predicted false positives with 17 cases, so we used XGB to develop the SHAP model. The accuracy and precision of this model were 85%.
Evaluation Metrics for Crash Severity Models with Balanced Dataset by Synthetic Minority Over-sampling Technique
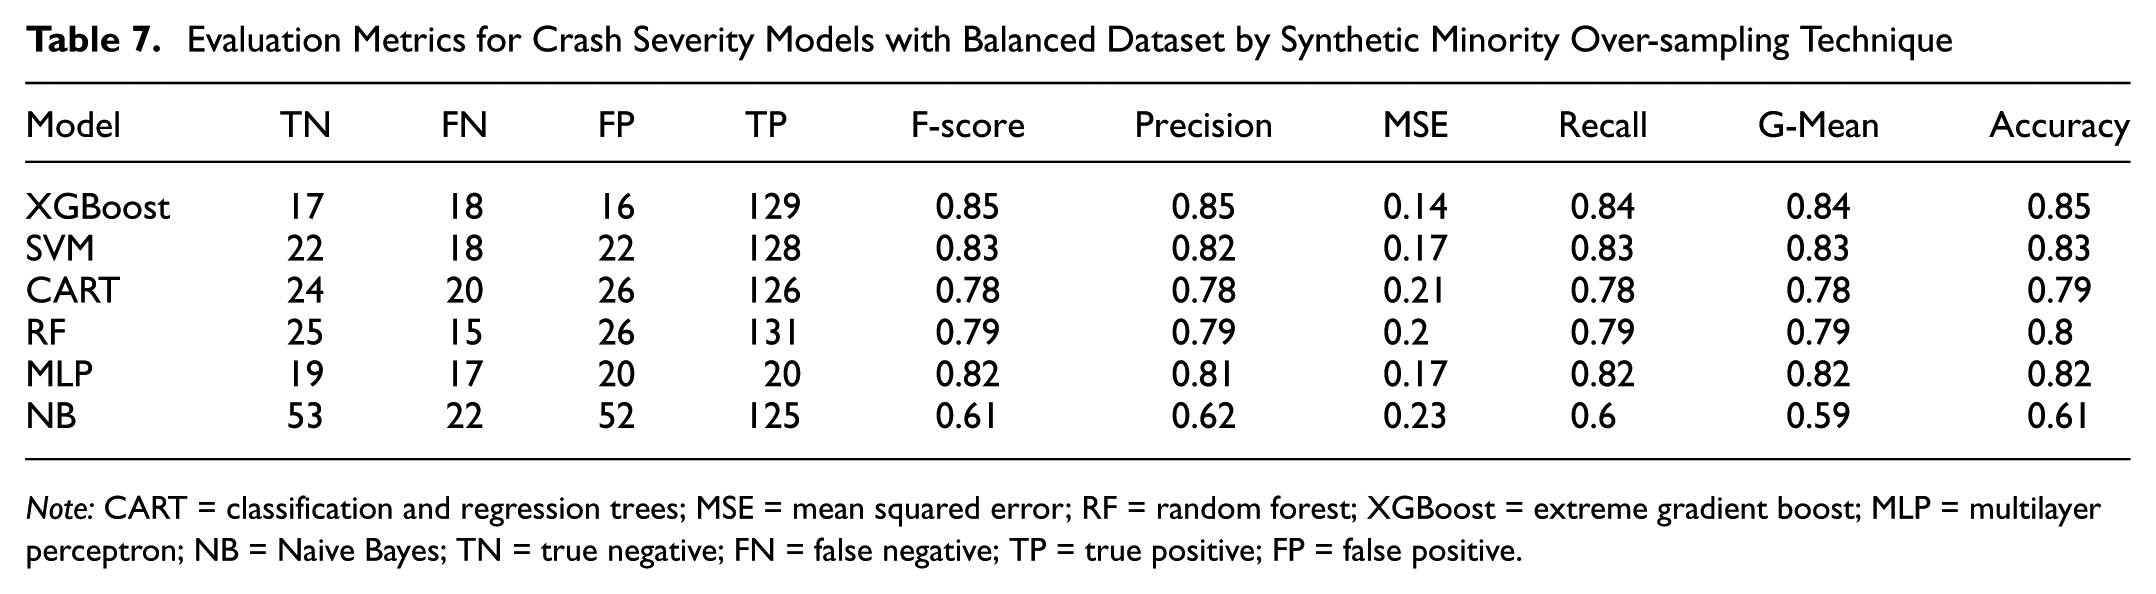
Note: CART = classification and regression trees; MSE = mean squared error; RF = random forest; XGBoost = extreme gradient boost; MLP = multilayer perceptron; NB = Naive Bayes; TN = true negative; FN = false negative; TP = true positive; FP = false positive.
Importance of Variables
Variable Importance with Machine Learning Models
The importance of variables using machine learning models, shown in Figure 7, indicates that the intersection location and then the street have higher importance compared with other locations and variables. Intersections with traffic lights without peripheral parking are also important for all three models. These results showed that manual driving mode, absence of disengagement, as well as cloudy and rainy weather, are more important. AV movements, including stopping or direct movements and non-AV movements such as direct forward movements and other movements (including reverse gear, overtaking, lane change, entering traffic, driving in the wrong direction, etc.) are more important than other movements. The type of collision causing the crash, rear-end collision, broadside collision, and sideswipe collision, includes the most effective collision types
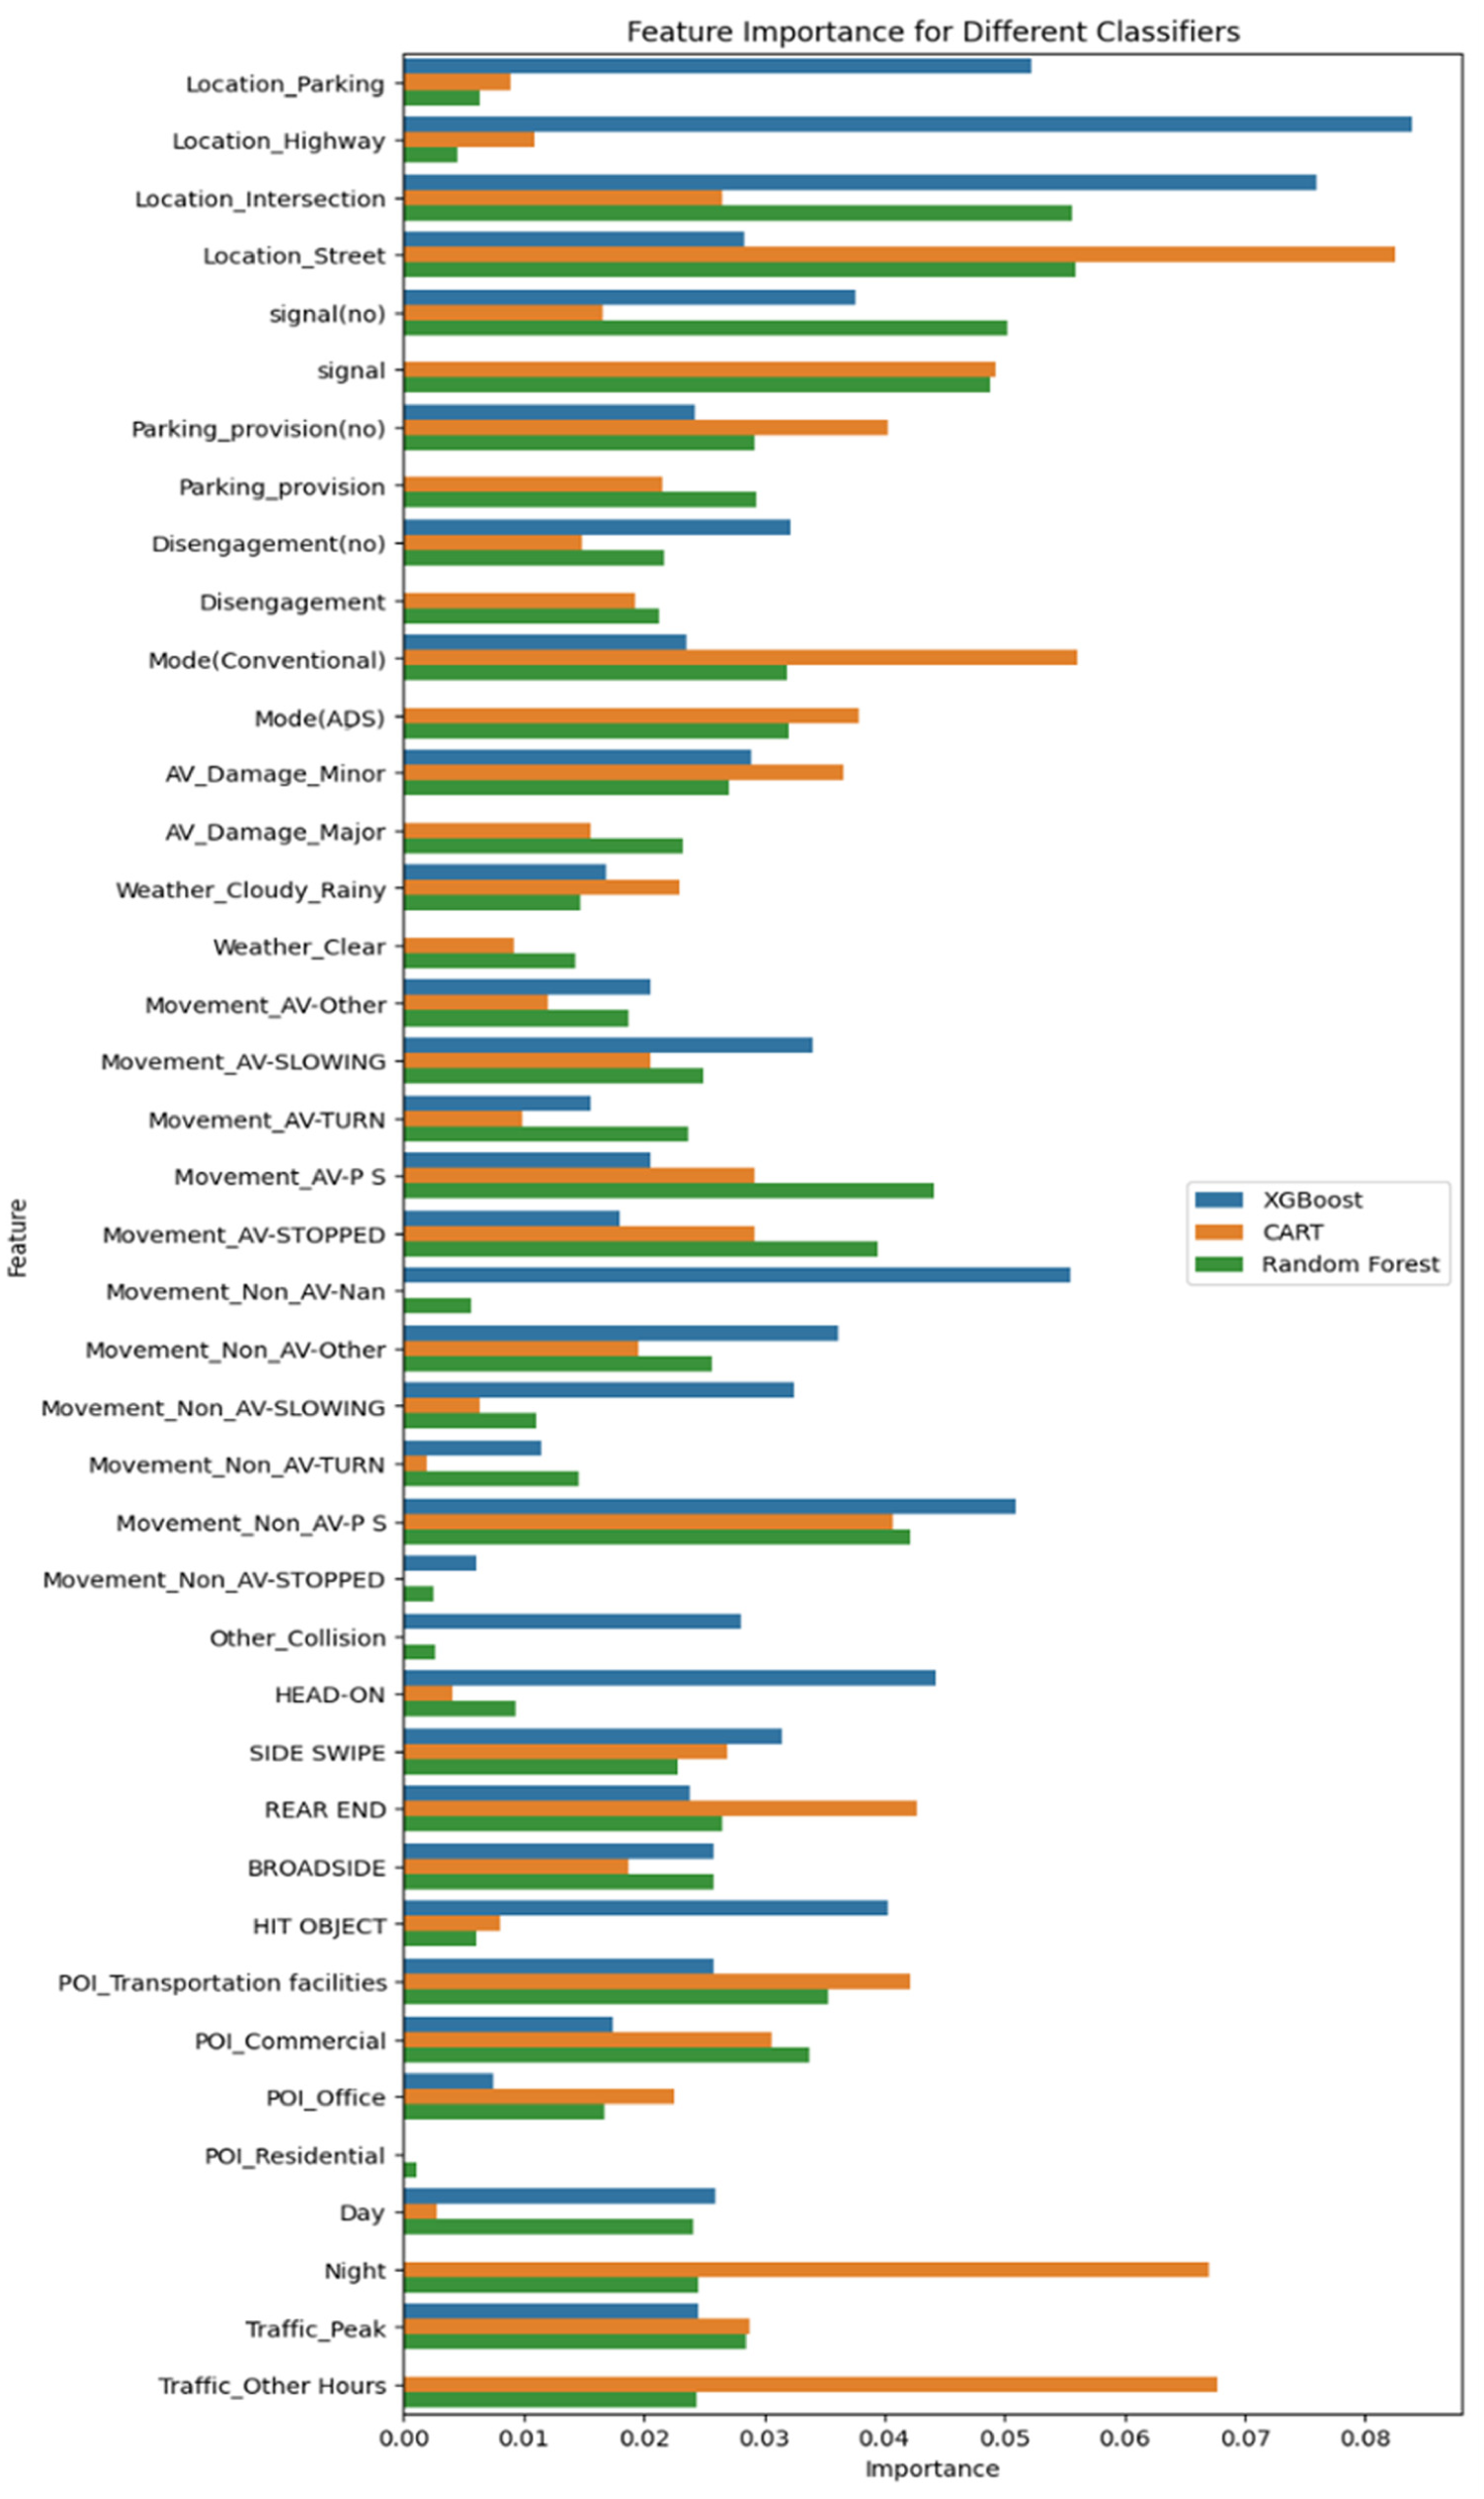
Variable importance for crash severity using extreme gradient boost (XGB), classification and regression trees (CART), and random forest (RF) algorithms.
These variables were of special importance in the results of the CART, Apriori, and cross-tabulation models and were repeated in various patterns and scenarios. Therefore, the results of all models are consistent for examining the crash mechanism. It was also confirmed that the results of balanced data using SMOTE with weighted class and P = 0.3 parameters in CART and Apriori models for detecting crash severity patterns are consistent.
Variable Importance with SHAP
In Figure 8, the higher variables have more importance, and the horizontal position of the points indicates the effect of the variable on the model output. Points on the left side of the chart have a stronger negative effect, while points pulled to the right have a stronger positive effect. The SHAP model showed that when the non-AV does not have a direct movement, it is the most influential variable in predicting crash severity. The presence of an intersection and night, meaning when the weather is completely dark (for California, from 9 p.m. to 5 a.m. [ 58 ]), is also very important. The presence or absence of a traffic light has almost the same importance.
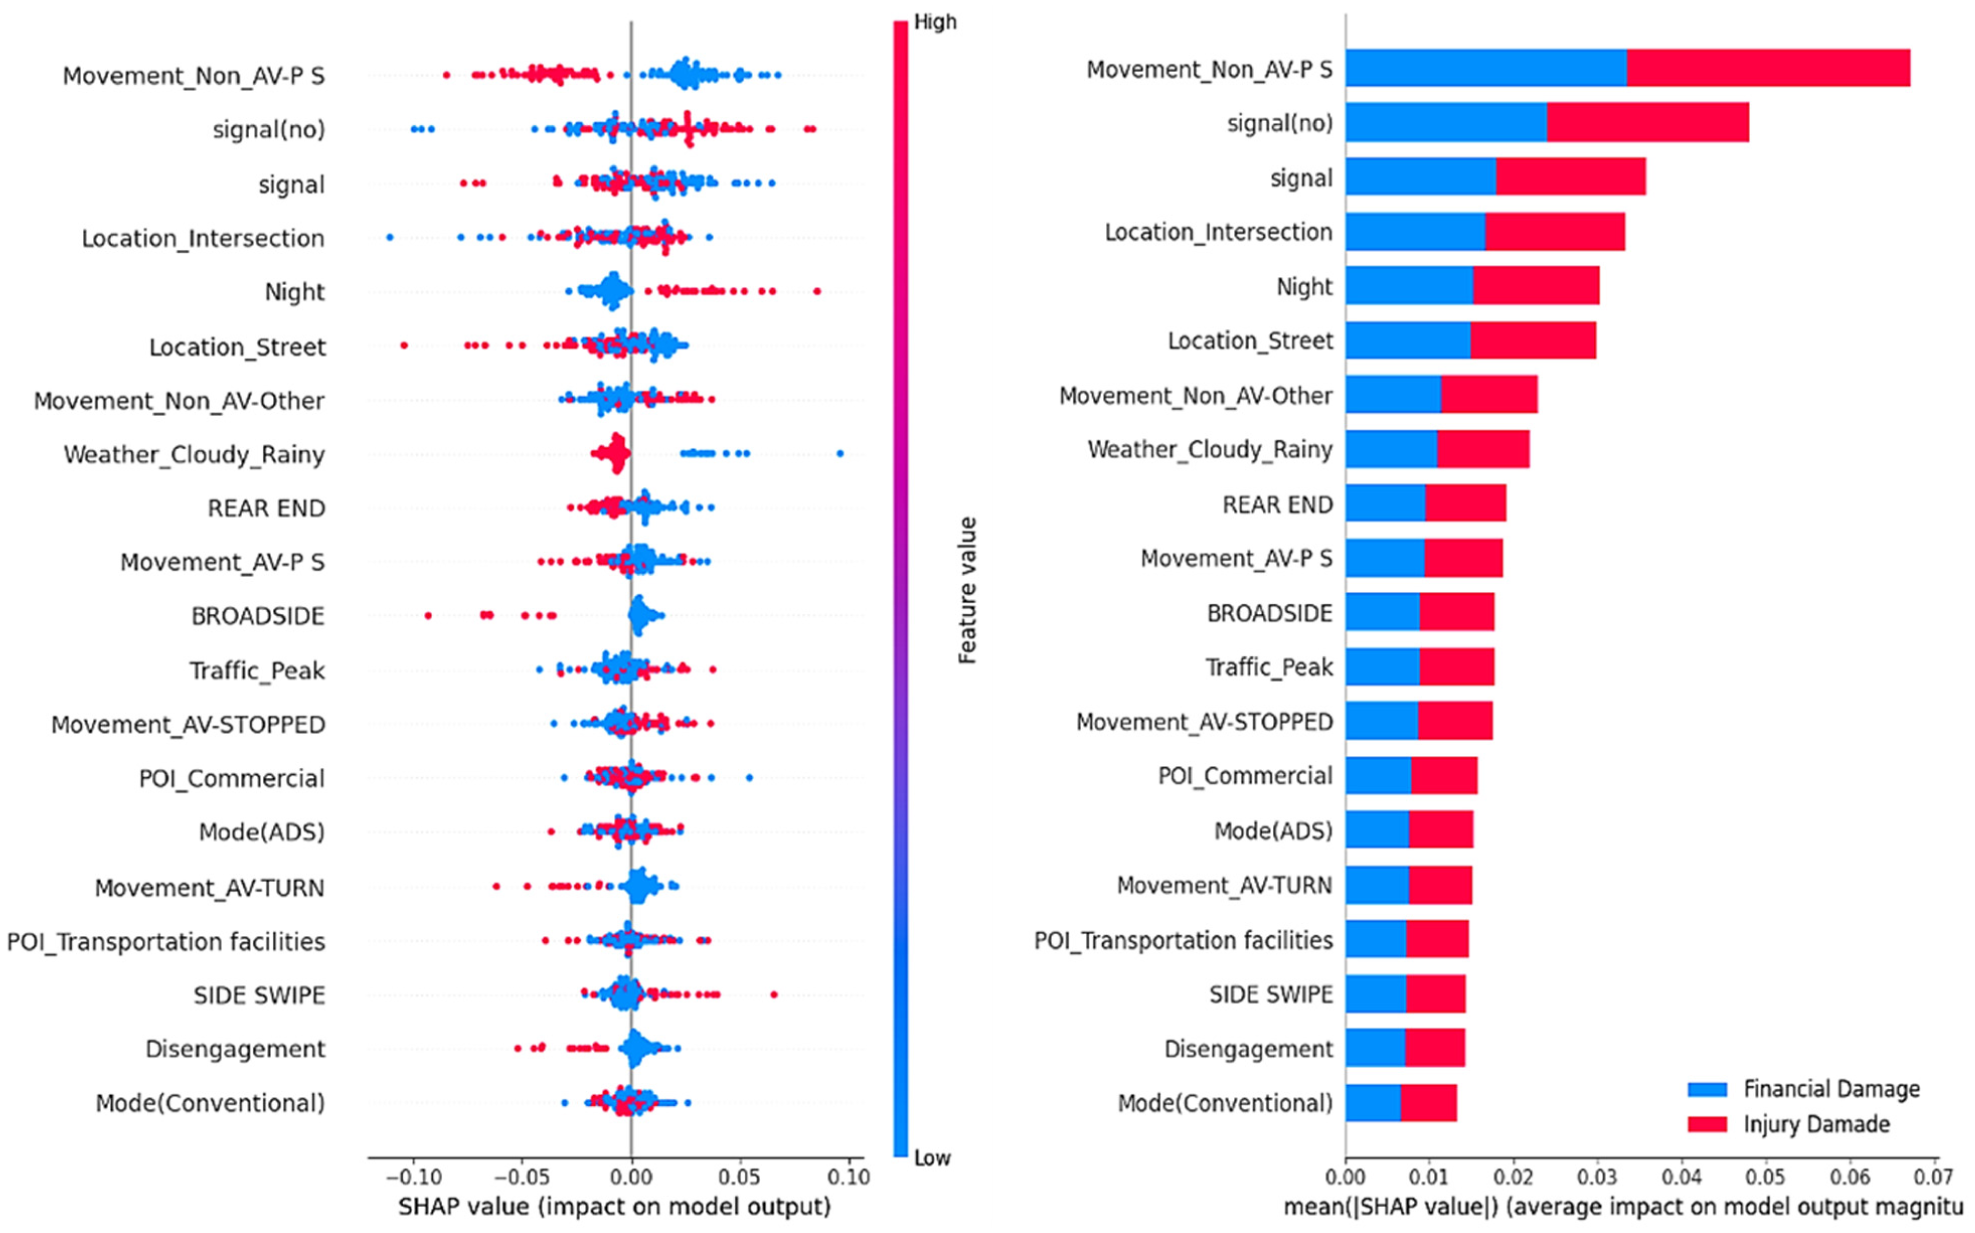
Feature importance for crash severity with Shapley additive explanations (SHAP).
Discussion
In this study, advanced analytical methods such as CART, the Apriori algorithm, and machine learning models like XGBoost and RF were employed to investigate the mechanisms of crashes involving AVs. The results obtained from CART and Apriori indicate that these methods are highly effective in identifying recurring patterns and dependency rules in crash data. Specifically, CART achieved an accuracy of 82% and a confidence level of 71%, successfully extracting meaningful rules that demonstrate significant factors influencing crash severity, such as uncertainty in interactions between autonomous and human-driven vehicles, intersection locations with traffic signals, and types of collisions (e.g., side impacts and rear-end collisions). On the other hand, the Apriori algorithm, using default values of support = 0.03 and confidence = 0.4, identified association rules that underscore the importance of environmental conditions such as weather and lighting in the occurrence of crashes. The integration of statistical analysis with machine learning approaches provides a more comprehensive understanding of AV crash mechanisms. While machine learning models excel at identifying complex patterns, statistical methods offer valuable insights into the significance and reliability of these patterns.
Comparing these findings with previous studies, such as those by Chen et al. and Xu et al. ( 11 , 31 ), reveals that the results of this research align with the existing literature but place greater emphasis on mixed interactions and the role of vehicle-to-vehicle (V2V) communication technologies. These analyses not only represent a significant step toward a better understanding of the safety challenges posed by AVs but also provide strategies for improving traffic control system designs and future policy-making.
Key recommendations include enhancing infrastructure, improving safety at intersections, and raising public awareness of AV safety. Additionally, these insights can guide policies that foster innovative technologies and regulatory updates for a smoother transition to automated transportation.
Property Damage
The Apriori and CART models indicate that crashes at unlit intersections during autonomous driving often lead to increased property damage, typically occurring without disengagement of the autonomous mode during daytime. In such incidents, AVs were often stationary at impact, while non-AVs were in motion. Rear-end and sideswipe collisions predominated, with higher property damage noted when the AV was stationary during head-on collisions. Notably, one-third of property damage incidents occurred on direct routes, contrasting with Wang and Li’s ( 17 ) findings that identified highways as sites of severe injuries. Xu et al. noted a correlation between roadside parking and increased crash severity; however, our study found no significant effect, challenging the conclusions of Xu et al. ( 31 ) and Boggs et al. ( 9 ). Thus, factors like crash location, vehicle movement at impact, and environmental conditions emerge as critical in determining crash severity, with weather not being the dominant factor as suggested by Chen et al. ( 11 ).
Bodily Injury
Using CART and Apriori models alongside SHAP analysis, our study reveals that crashes at traffic-lighted intersections during autonomous driving are more likely to result in bodily injury. These incidents commonly occur in daytime, in public-use areas, and during off-peak hours, with AVs often stationary at impact. The collision types leading to bodily injury included rear-end, broadside, and sideswipe collisions, aligning with previous studies indicating the higher severity of rear-end collisions ( 7 , 9 , 11 ). Recent findings by Abdel-Aty and Ding ( 28 ) in their matched case-control analysis further confirm that rear-end collisions involving AVs frequently stem from human fault in following vehicles. Xu et al. highlighted several factors influencing AV crash severity, with roadside parking increasing broadside collisions by 8%. Our results affirm a significant link between collision type and injury severity, consistent with findings from Xu et al. ( 31 ) and Kutela et al. ( 40 ). Overall, 15.7% of crashes involving AVs resulted in bodily injury, showing a decrease compared with Chen et al. ( 11 ) but in line with Kutela et al. ( 40 ). Notably, disengagement before a collision correlates with increased bodily harm, supporting findings from Xu et al. (59–61) and Wu et al. ( 62 ).The low incidence of bodily injury (5%) in Level 4 AV crashes suggests that eliminating human drivers may enhance safety, potentially leading to zero fatalities ( 63 ). However, with only one minor injury reported among 21 crashes, further evaluation is warranted.
The study highlights a disparity in crash severity based on intersection type, with traffic-lighted intersections associated with a 19% likelihood of bodily injury. Complex intersections increase injury risk, contradicting Xu et al.’s ( 31 ) assertion of a negative correlation with severity. The presence of transportation points of interest also raises the likelihood of bodily injury by 19%, echoing Chen et al.’s findings on dense land use ( 27 ). Common crash locations include restaurants and parking areas, with two-wheeled vehicles significantly contributing to bodily injuries, necessitating improved detection and prediction capabilities in AV systems ( 34 ). Despite the advanced navigation systems equipped in AVs, including light detection and ranging (LIDAR) and ultrasound sensors, nighttime conditions can still pose challenges. Factors such as reduced visibility, unpredictable human driver behavior, and potential sensor limitations in low-light conditions may contribute to higher crash severity at night.
Key Interrelationships
Significant interconnections among pre-crash conditions, collision types, and crash severity were identified:
Disengagement: Reduces rear-end collisions but increases others; its occurrence before a collision escalates bodily harm.
Nighttime severity: Higher likelihood of severe crashes on illuminated roads compared with daytime.
Weather conditions: Most bodily injuries occurred in clear weather; adverse conditions exacerbated specific collision types.
Collision types: Rear-end collisions were most frequent, while broadside collisions posed greater injury risk, particularly to vulnerable road users.
The observation that crash severity may be higher at night, despite the advanced navigation systems equipped in AVs, such as LIDAR and ultrasound sensors, is addressed. This paradox may be attributed to factors such as reduced visibility, increased driver distraction, or the complexity of mixed traffic interactions during nighttime.
Limitations and Suggestions
While this study offers valuable insights, it has limitations. The CA DMV data lack human factors (e.g., driver age/gender) and differentiation between automation levels (L2–L4), which may affect crash pattern interpretations—particularly for rear-end collisions where L4 vehicles may exhibit distinct behaviors. Additionally, crash severity was not assessed using standard scales like KABCO (K = fatal, A = incapacitating injury, B = non-incapacitating injury, C = possible injury, O = no injury) or fatality analysis reporting system (FARS). Future research should collect comprehensive data, including driver characteristics, automation-level specifics, and traffic flow from diverse region to better understand AV-related crashes. Manufacturers should also provide data in accessible formats to facilitate research.
Specific avenues for future research are suggested, including extending analyses to other geographic regions and datasets. Actionable recommendations for AV developers and policymakers are summarized, emphasizing the integration of statistical analysis into machine learning approaches to enhance the interpretability and applicability of findings. Future studies could explore the mechanisms of AV crashes using complex analysis algorithms, assess the impact of increased AV intelligence on safety, and investigate the interactions between AVs and vulnerable road users. Researching driver reactions and utilizing AV camera footage could yield further improvements in AV safety, accelerating their integration into mixed traffic environments.
Conclusion
This study has compiled a unique dataset of 606 AV crashes in California from September 2014 to September 2023, utilizing narratives from crash reports provided by the CA DMV. By employing machine learning and association rules, the research aims to elucidate crash mechanisms and enhance AV safety performance. Key objectives include organizing AV crash reports for data mining and statistical analysis to extract patterns and trends. The findings are intended to inform practical applications and policy-making decisions in the realm of AV safety, while also highlighting future research needs for comprehensive datasets and the examination of vulnerable road users.
The study identifies intersections with traffic lights as high-risk locations for bodily injuries, emphasizing the necessity for improved signage and traffic control measures. It advocates for a macro-level urban planning approach that balances population and transportation needs, alongside technological innovations and regulatory updates to facilitate the transition to automated transportation.
Key findings indicate that rear-end collisions are the most frequent, suggesting AVs should maintain greater distances from other vehicles at intersections. Short-term, AV operators may benefit from manual driving in high-risk areas until the ADS is refined. Manufacturers are encouraged to implement alerts for non-autonomous drivers concerning the proximity and operational status of AVs. Medium-term recommendations include revising driver training programs to enhance awareness of AV interactions and considering specialized licensing for AV operators.
Long-term, the integration of V2V and vehicle-to-infrastructure (V2I) technologies is essential for enhancing communication among vehicles and infrastructure, thereby reducing traffic crashes. The study notes that most sideswipe collisions occur at night on unlit roads, indicating a need for improved perception and control systems in AVs. Although AVs demonstrated lower bodily injury rates in autonomous mode, the need for better interaction between AVs remains critical, as evidenced by recent AV–AV collisions.
Intersections, particularly complex ones, present the highest risk of bodily injury, necessitating targeted improvements. Moreover, the presence of vulnerable road users, such as cyclists and pedestrians, in 43.64% of crashes underscores the importance of developing algorithms that make AV behavior more predictable to human drivers.
In summary, while AVs offer significant potential benefits, their interaction with human-centered vehicles poses challenges that require a multifaceted approach. The insights gained from this study can guide safety assessments and inform the development of V2V and V2I technologies, ultimately aiding traffic management and deployment strategies for mixed traffic scenarios involving both autonomous and conventional vehicles.
Footnotes
Author Contributions
The authors confirm contribution to the paper as follows: study conception and design: E. Kohanpour, S. Davoodi; data collection: E. Kohanpour, S. Davoodi; analysis and interpretation of results: E. Kohanpour, S. Davoodi, K. Shaaban; draft manuscript preparation: E. Kohanpour, S. Davoodi, K. Shaaban. All authors reviewed the results and approved the final version of the manuscript.
Declaration of Conflicting Interests
The authors declared no potential conflicts of interest with respect to the research, authorship, and/or publication of this article.
Funding
The authors received no financial support for the research, authorship, and/or publication of this article.
Data Accessibility Statement
The extracted data for this study are available to assist future researchers and promote research in the field of AVs through our GitHub link (kohanpour1/AVs: AV CRASH (github.com/) Also, raw PDF reports can be obtained through the address ![]() .
.