
Abstract
The rapid increase of ride-hailing services has revolutionized urban mobility in India, but its adoption in medium-sized cities with distinct socioeconomic contexts remains unexplored. This study uses the technology acceptance model and the theory of planned behavior to investigate the factors that influence ride-hailing uptake in Vijayawada, a rapidly urbanizing medium-sized city in India. Data from 450 users were analyzed using structural equation modeling. The findings support the fundamental role of perceived usefulness in influencing attitude and behavioral intention. While social influence encourages adoption, one important finding is the negative impact of perceived behavioral control, which reflects hurdles such as cost, app complexity, and inadequate peripheral coverage. The impact of these elements is mitigated by gender and income, with women and higher-income users having lower adoption intentions. The findings highlight the need for localized initiatives—such as simplified app interfaces, increased safety features, and greater service equity—to be initiated by service providers and policymakers targeting growing urban markets.
Keywords
Introduction
In recent years, India’s urban mobility scene has significantly transformed because of the emergence of ride-hailing services such as Uber, Ola, and Rapido. Facilitated by the extensive use of smartphones and the increasing availability of internet connections, these platforms provide a handy, adaptable, and frequently economical substitute to conventional transportation methods ( 1 , 2 ). Indian cities are confronting issues associated with rising urbanization, escalating population density, and intensifying traffic congestion; consequently, ride-hailing services have become an essential element of modern urban transportation networks ( 3 ).
Notwithstanding their increasing popularity, the utilization of ride-hailing services significantly differs among various user demographics and urban environments. Medium-sized cities exhibit distinct infrastructural, behavioral, and cultural dynamics that affect user behavior ( 4 ). Although numerous studies have examined ride-hailing usage in metropolitan and Global North contexts, a substantial gap persists in comprehending the adoption patterns and influencing factors in Indian medium-sized cities, where travel behavior is influenced by resource limitations, modal preferences, and developing digital ecosystems ( 5 , 6 ). Furthermore, the majority of previous studies have concentrated on either technological factors or behavioral components independently, with minimal incorporation of holistic theoretical frameworks that encompass both dimensions.
This study utilizes two recognized theoretical frameworks to examine these dynamics: the technology acceptance model (TAM) and the theory of planned behavior (TPB). TAM asserts that consumers’ intentions to engage with technology are predominantly influenced by their evaluations of its usability and utility ( 7 ). Conversely, TPB elucidates behavior via three essential constructs: attitude toward the behavior, subjective norms (SN), and perceived behavioral control (PBC) ( 8 ). These models have been extensively utilized in transportation and mobility research to comprehend user goals and decision-making processes ( 9 – 11 ).
This study seeks to bridge the existing gap in research by providing a detailed knowledge of the technological and behavioral factors influencing two-wheeler ride-hailing adoption in a swiftly urbanizing medium-sized Indian city through the integration of these frameworks. This study has three objectives: 1) to identify the primary factors affecting the adoption of ride-hailing services, 2) to analyze the interrelationships among technological and behavioral constructs through structural equation modeling (SEM), and 3) to offer practical insights for service design, marketing strategies, and policy interventions in medium-sized Indian cities.
This analysis enhances the existing literature on urban mobility and technological acceptability, providing context-specific insights pertinent to India’s developing transportation system.
Literature Review
Ride-Hailing Services: Global Trends and Adoption Determinants
Ride-hailing services are revolutionizing urban mobility globally, with forecasts suggesting they will represent 26% of total kilometers travelled by 2030, an increase from 4% in 2015 ( 12 ). The proliferation of smartphones and high-speed internet access in India has expedited adoption via real-time tracking, reliable arrival times, and affordable taxi alternatives. Notably, 32% of Indian consumers utilize ride-hailing services weekly, surpassing the rates in the U.S. (11%) and Germany (4%), while 57% favor it over private vehicle ownership ( 13 , 14 ).
Comprehending the determinants of adoption necessitates an analysis of both global trends and local circumstances. Casado-Sanz et al. employed neural network techniques to analyze consumer preferences, differentiating between taxi and ride-hailing users ( 15 ). Olayode et al. conducted a comprehensive analysis of adoption determinants, categorizing them into sociodemographic, regional, and system-related factors ( 16 ). India faces distinctive issues such as traffic congestion, safety concerns (particularly for women), and digital literacy. Perceived risk is a significant barrier for Indian customers ( 17 ). Bhaduri et al. highlight the importance of mitigating user concerns through targeted informative initiatives and infrastructural improvements ( 18 ). These challenges are especially pertinent in under-researched medium-sized and Tier 2/3 cities where service expansion surpasses scholarly research.
Theoretical Foundations: An Integrated Behavioral Framework
Theory of Planned Behavior (TPB)
TPB (as shown in Figure 1) offers a solid framework for analyzing behavioral intentions based on three key constructs: attitudes, SN, and PBC ( 19 – 21 ). This framework has been successfully used in a variety of transportation contexts, including public transportation, bicycles sharing, walking, low-cost carriers, and electric vehicles ( 22 – 27 ). In ride-hailing, research demonstrates TPB’s effectiveness, with studies showing significant influences of SN and PBC on behavioral intentions, as well as successful integration with complementary frameworks such as the norm activation model in Indian contexts ( 17 , 28 , 29 ).
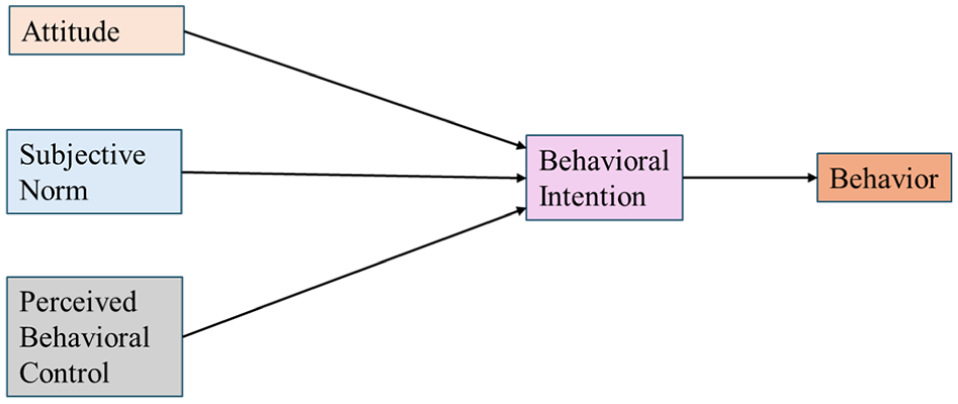
Theory of Planned Behavior ( 21 ).
Technology Acceptance Model (TAM)
TAM (as shown in Figure 2) highlights perceived ease of use and perceived usefulness as key drivers of technological adoption ( 7 ). In ride-hailing contexts, research validates these constructs’ significance, particularly in India where perceived usefulness, ease of use, and trust substantially influence adoption ( 3 ). The model’s integration with other frameworks increases its explanatory power, as evidenced by research that used random utility maximization and TPB to account for social and environmental views ( 30 ). TAM’s importance in understanding user motivation for ride-hailing adoption is supported further by research on collaborative consumption ( 31 ).
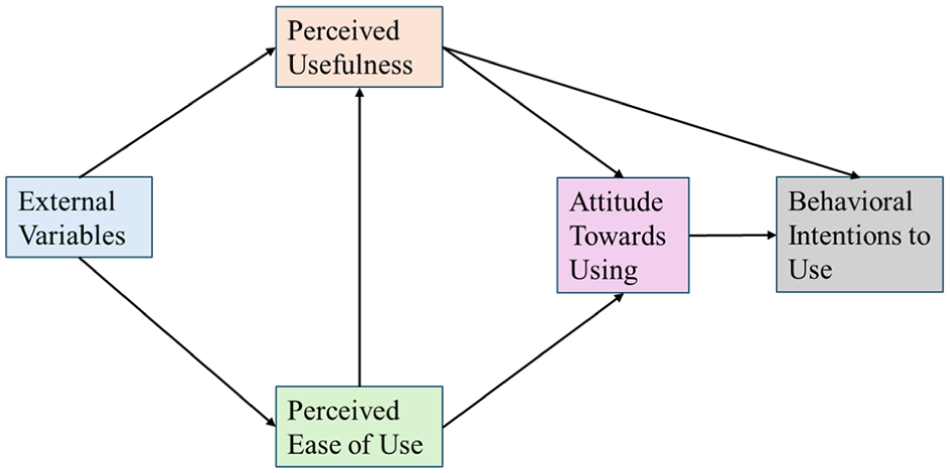
Technology acceptance model ( 7 ).
Unified Theory of Acceptance and Use of Technology (UTAUT)
The unified theory of acceptance and use of technology (UTAUT) (as shown in Figure 3) combines several theoretical models into four key constructs: performance expectancy, effort expectancy, social influence, and facilitating factors ( 32 – 34 ). This integrated paradigm has substantial explanatory power, accounting for about 70% of the variation in technology adoption, and it well captures collaborative consumption dynamics in ride-hailing services ( 35 – 37 ).
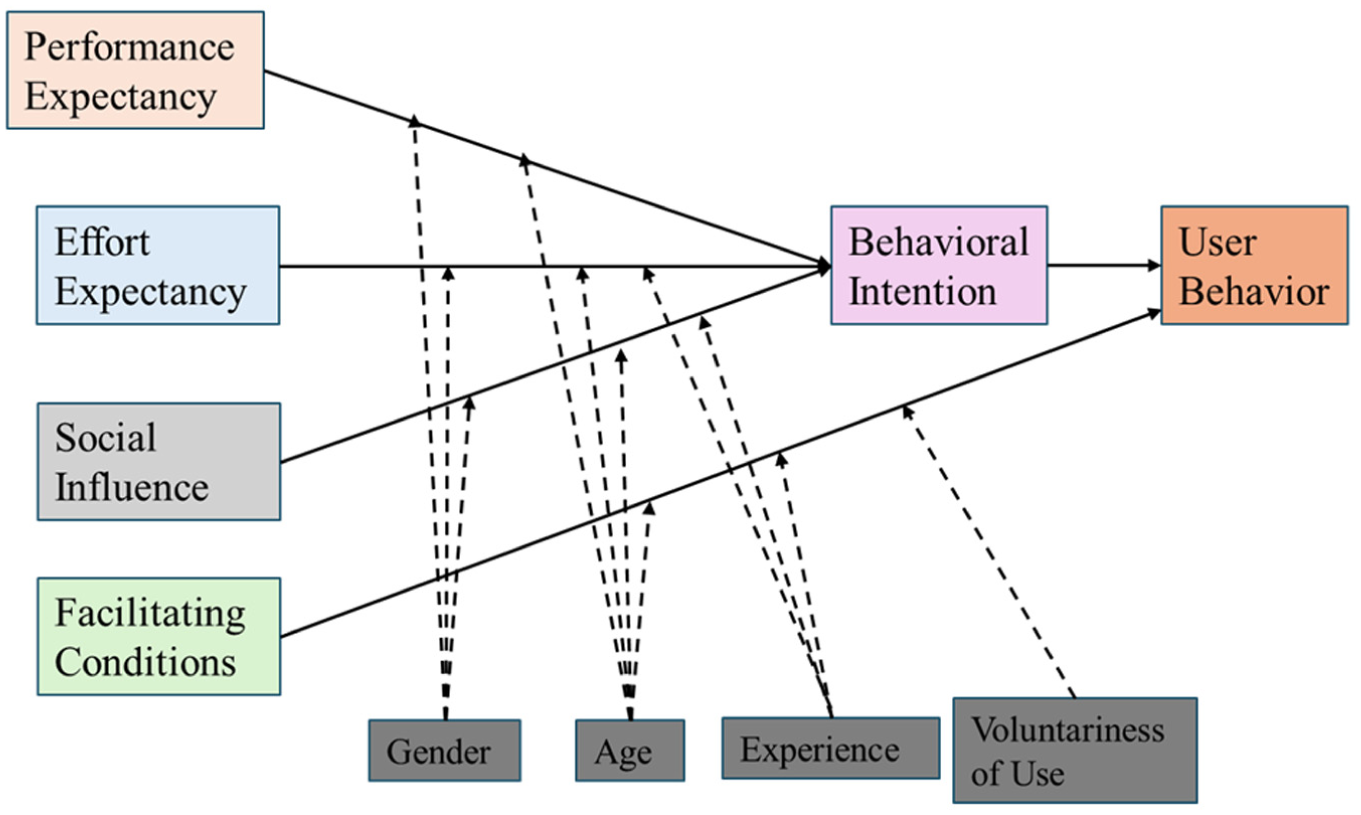
Unified theory of acceptance and use of technology model ( 32 ).
Contextual Factors and Methodological Approach
Applying these theoretical frameworks, various contextual factors may influence ride-hailing uptake in India. Trust emerges as particularly important given safety concerns, while cultural values such as frugality, hedonic motivation, and status considerations also influence decisions ( 37 – 41 ). Service quality and personal values influence consumers’ behavioral attitudes, which have a major impact on their intents ( 43 , 44 ).
The core TAM characteristics of perceived ease of use and utility remain key drivers, whereas SNs have a substantial impact on adoption in India’s collectivist setting ( 20 , 45–49). PBC, including service dependability and safety, has a significant impact on utilization probability ( 8 , 17 , 38 , 50 ). These correlations are consistently moderated by sociodemographic characteristics such as age, gender, income, vehicle ownership, and prior transport experience ( 51 – 54 ). Research combining TPB with different frameworks validates similar correlations in Indian settings ( 17 , 45 ).
Research Gap
Despite comprehensive studies on ride-hailing in major urban centers, substantial knowledge deficiencies remain concerning medium-sized Indian cities such as Vijayawada. Contemporary literature primarily emphasizes urban regions with advanced transit systems and extensive digital access, perhaps misrepresenting the realities of Tier 2 and Tier 3 cities. The utilization of SEM to analyze behavioral intentions in these smaller urban settings is still constrained. This study fills these gaps by adopting SEM to examine the determinants of ride-hailing adoption in Vijayawada, integrating the TPB and TAM frameworks while considering context-specific urban considerations. The research enhances comprehension of urban mobility patterns in growing Indian cities and offers insights for transportation planning in analogous urban situations.
Formulation of Research Framework and Hypothesis Testing
This comprehensive research framework is derived from a rigorous examination of the existing literature on technology adoption, highlighting substantial theoretical and practical shortcomings. TAM has been extensively utilized to clarify users’ first acceptance of technology through attributes including perceived usefulness and ease of use. However, TAM sometimes overlooks broader social and behavioral control factors that influence prolonged usage and enduring behavioral intentions. TPB offers a comprehensive perspective by incorporating attitude, social influence, and PBC; nevertheless, it lacks the technology-specific insights essential for understanding user interaction with digital systems. The UTAUT model presents a wide range of constructs; however, a significant portion of its explanatory strength stems from variables that conceptually intersect with those in TAM and TPB, with its applications frequently focused on organizational or workplace environments. Numerous scholars have emphasized the contextual constraints of UTAUT in accurately reflecting consumer decision-making and personal mobility options ( 14 , 55 , 56 ). Considering this study’s emphasis on personal mobility choices within an urban framework, TAM and TPB were regarded as more suitable for including both technology-related perceptions and wider behavioral dynamics. The explanation of UTAUT has been preserved for contextual background, but the focus is directed toward TAM and TPB, which collectively establish the theoretical framework of the proposed model.
This study provides a cohesive framework that integrates the advantages of both TAM and TPB to overcome these constraints. By amalgamating the cognitive and perception-based elements of TAM with the social, attitudinal, and control-oriented aspects of TPB, the model provides a more comprehensive understanding of the determinants influencing technology adoption and usage behavior. Moreover, the incorporation of demographic variables such as income, gender, age, and education—as external factors—enriches the framework by considering individual characteristics that may affect user decisions.
The graphic depiction of the framework (as shown in Figure 4) elucidates this integration distinctly. The components of TAM, indicated by the blue dashed box, encompass perceived usefulness and ease of use, which affect users’ attitudes toward the system (hypothesis [H]1, H2, H3) (see Table 1 for a list of the hypotheses). The aspects of TPB, denoted by the orange dashed box, illustrate the influence of attitude, social influence, and PBC on behavioral intention (H4, H5, H6), which subsequently forecasts frequency of usage (H8). Moreover, PBC is directly associated with frequency of usage (H7), consistent with fundamental axioms of TPB. The model additionally analyses the influence of demographic variables on behavioral intention, enhancing contextual comprehension.
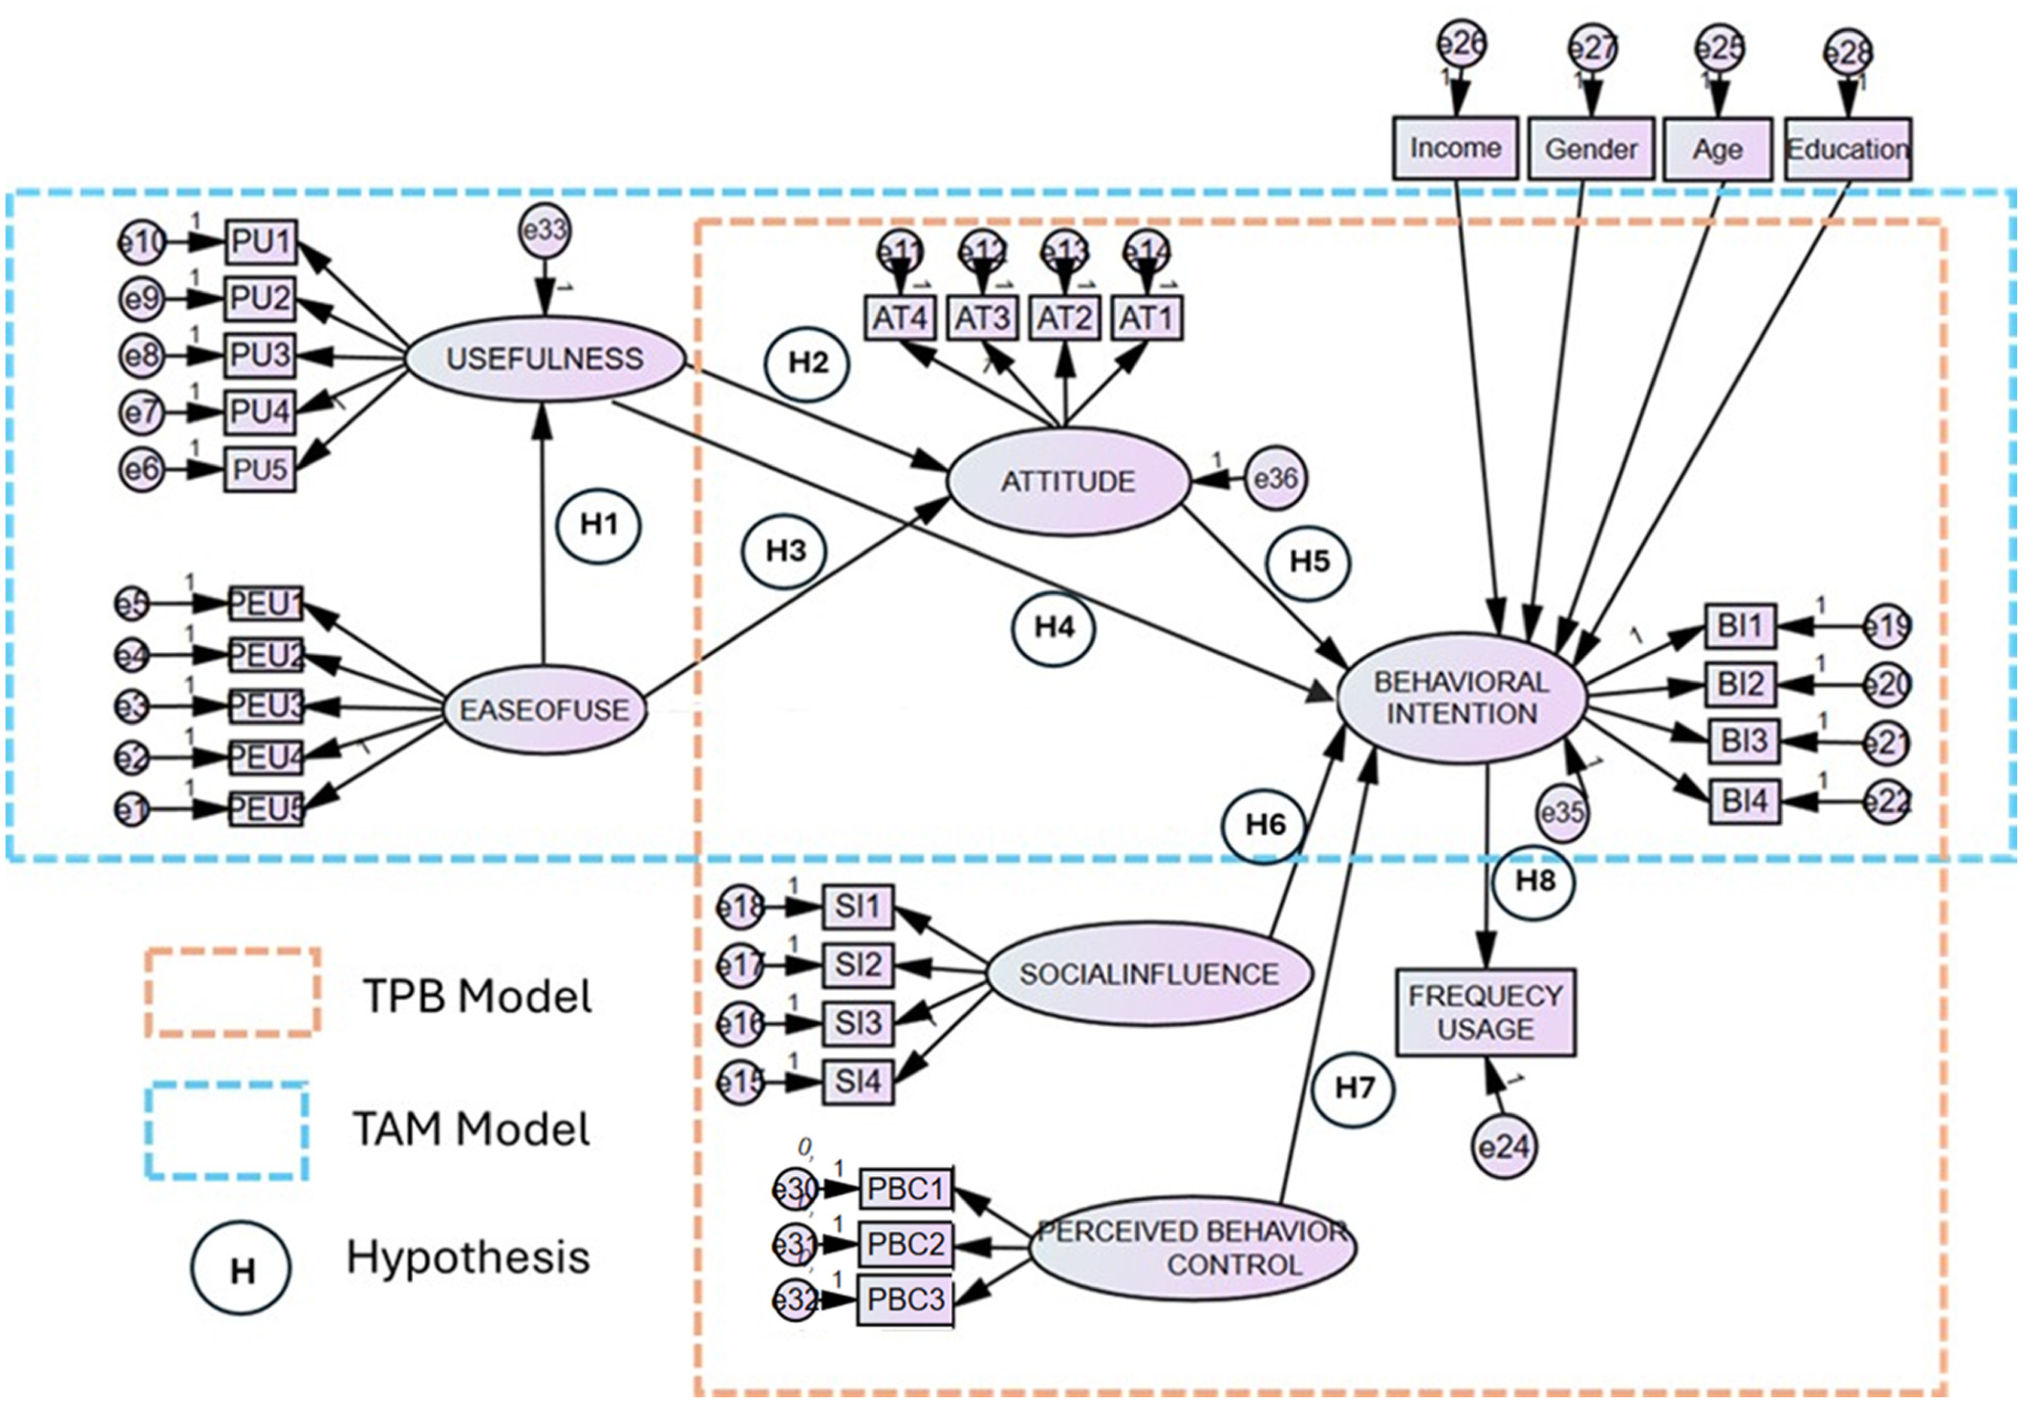
Theoretical modeling framework.
Summary of Hypothesized Path Relationships
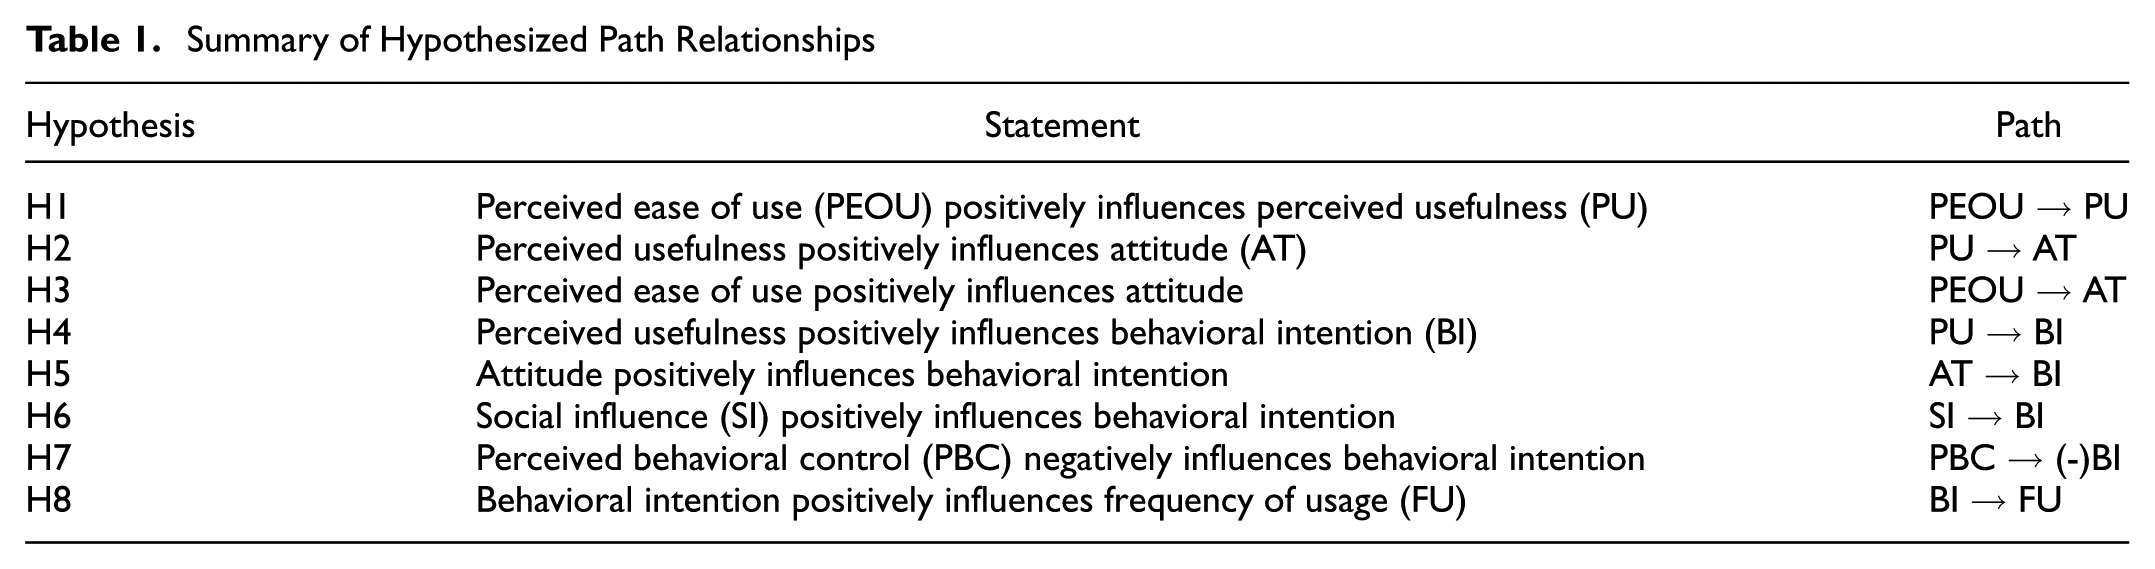
The hypotheses (H1–H8) aim to empirically examine the causal links among these constructs, facilitating a detailed analysis of user behavior. This comprehensive approach addresses significant deficiencies in the literature and offers a solid theoretical basis for comprehending the adoption and continued utilization of technology.
The hypotheses in Table 1 illustrate the integrated model that amalgamates TAM and TPB components to provide a thorough understanding of the factors affecting ride hailing and behavior.
Study Area Profile—Vijayawada City, India
Vijayawada, a densely populated metropolitan hub in Andhra Pradesh with over one million inhabitants, offers a significant opportunity for examining ride-hailing uptake in India’s developing Tier-3 cities. The city’s excellent location as a transportation nexus, situated at the convergence of National Highways NH-16 and NH-65 and one of India’s most active railway junctions, starkly contrasts with its inadequate public transport infrastructure. The transportation system reveals significant trends: motorized two-wheelers account for 40.3% of personal journeys, highlighting their crucial function in daily mobility. This makes two-wheelers an especially vital means of transportation in the city. The targeted emphasis on two-wheeler services is essential, as they represent over 60% of the ride-hailing business in medium-sized Indian cities and address unique mobility requirements in comparison to four-wheeler and three-wheeler services. Walking (17.5%) and bus transportation (22.2%) are significant modes of transit, but auto-rickshaws (10.1%) and bicycles (7.7%) provide essential niche purposes. Private car utilization is limited to 1.6%, indicating little personal vehicle ownership in the context of fast urbanization ( 57 , 58 ). The distinctive amalgamation of high population density, strategic transportation significance, inadequate public transit, and a predominance of two-wheeler mobility establishes an optimal context for analyzing how ride-hailing services address essential connection deficiencies. The advent of platforms such as Ola, Uber, and Rapido tackles both first- and last-mile issues while providing adaptable mobility solutions, rendering Vijayawada particularly significant for analyzing ride-hailing adoption trends in medium-sized Indian cities with related infrastructural limitations.
Methods
Questionnaire Design
The questionnaire was developed to examine factors influencing adoption of ride-hailing, utilizing established theoretical frameworks including TPB and TAM. To precisely capture user behavior, the instrument incorporated both stated- and revealed-preference elements. The survey comprises two primary components. The first data collection encompassed fundamental demographic and socioeconomic information, including age, gender, occupation, education, income, and vehicle ownership. This data facilitated response segmentation and analysis of usage patterns among diverse user segments. The second portion evaluated significant psychological constructs with a 5-point Likert scale from “strongly disagree” to “strongly agree.” This included metrics assessing perceived usefulness, ease of use, attitude, behavioral intention, social influence, and PBC. Before full deployment, the questionnaire underwent pilot testing with a limited sample to ensure clarity and reliability, and was thereafter refined according to respondent feedback.
Data Collection and Sampling Framework
An online survey of active users of two-wheeler ride-hailing services in Vijayawada was conducted between January and March 2024 to obtain primary data. A two-stage sampling strategy was used. In the initial stage, participants were recruited using digital channels such as social media groups, university mailing lists, and community networks, allowing for effective outreach to those who are familiar with app-based mobility platforms. The second stage involved monitoring demographic diversity during recruiting to minimize significant over- or under-representation of important user groups. However, neither stratified oversampling nor statistical weighting methods were used. All following analyses, including the SEM calculation, were performed on unweighted data.
The survey yielded 512 responses, with 450 valid cases retained following data screening, exceeding the minimum need of 370 for a 95% confidence level and a 5% margin of error. The resulting sample size of 450 imparted adequate statistical power for the subsequent SEM. All participants were evaluated to ensure they were active users of two-wheeler ride-hailing services. The resulting sample reflects expected technology adoption patterns in Indian cities, for example, 73% of respondents were aged 18–35 years, compared with approximately 47% in the general city population, which aligns with typical demographic profiles of app-based service users.
Data Analysis Technique
The data analysis employed SEM, a robust multivariate technique that provides numerous benefits compared with conventional regression methods ( 59 ). SEM enables the concurrent assessment of associations between observable and latent variables, allowing for the detection of significant direct and indirect effects. The reliability of the survey items was evaluated by Cronbach’s alpha coefficients to confirm internal consistency.
Consistent with prior research on travel behavior and the uptake of ride-hailing services, SEM was considered suitable for this investigation ( 3 ). The structural model was estimated with the maximum likelihood (ML) approach through SPSS AMOS software. ML estimation is extensively employed and presupposes multivariate normality, yet any violations from this assumption do not much affect the outcomes ( 60 ). ML was particularly appropriate in this scenario, as the study included components based on TPB, requiring a confirmatory factor analysis (CFA).
Measurement models were originally created to analyze the links between observed indicators, depicted as rectangles in path diagrams, and their associated latent constructs, represented by ellipses. The models were subsequently amalgamated to create the comprehensive structural model, in which arrows between latent variables signify structural equations. Arrows from observable to latent variables may indicate structural links based on the model definition.
The statistical significance of both measurement and structural routes was assessed using p-values at the 1%, 5%, or 10% significance levels. The model’s overall suitability was assessed using goodness-of-fit indices, such as the comparative fit index (CFI), goodness-of-fit index (GFI), parsimony ratio, and root mean square error of approximation (RMSEA). Model fit thresholds were established based on prior literature: CFI and GFI values over 0.90, and RMSEA values below 0.08 ( 59 , 61 , 62 ). Further analysis and results section presents the details of structural model development.
Analysis and Results
Descriptive Statistics
The descriptive statistics provide a fundamental overview of the demographic and behavioral characteristics of the 450 respondents retained after data cleaning, thereby contextualizing the forthcoming investigation of factors affecting ride-hailing adoption. Table 2 shows the socio-demographic characteristics of the respondents. The sample is primarily male (76%), which may affect ride-hailing adoption trends, as prior research has indicated gender-related disparities in technology acceptance and safety perceptions. A substantial percentage of respondents are either working (45%) or students (28%), suggesting a considerable demographic with consistent travel requirements who may perceive ride-hailing services as advantageous for everyday commutes. The educational profile is notably elevated, with 79% of respondents possessing at least a graduate degree, indicating heightened awareness and possible receptiveness to app-based mobility solutions.
Sociodemographic Profiles of Respondents (n = 450)
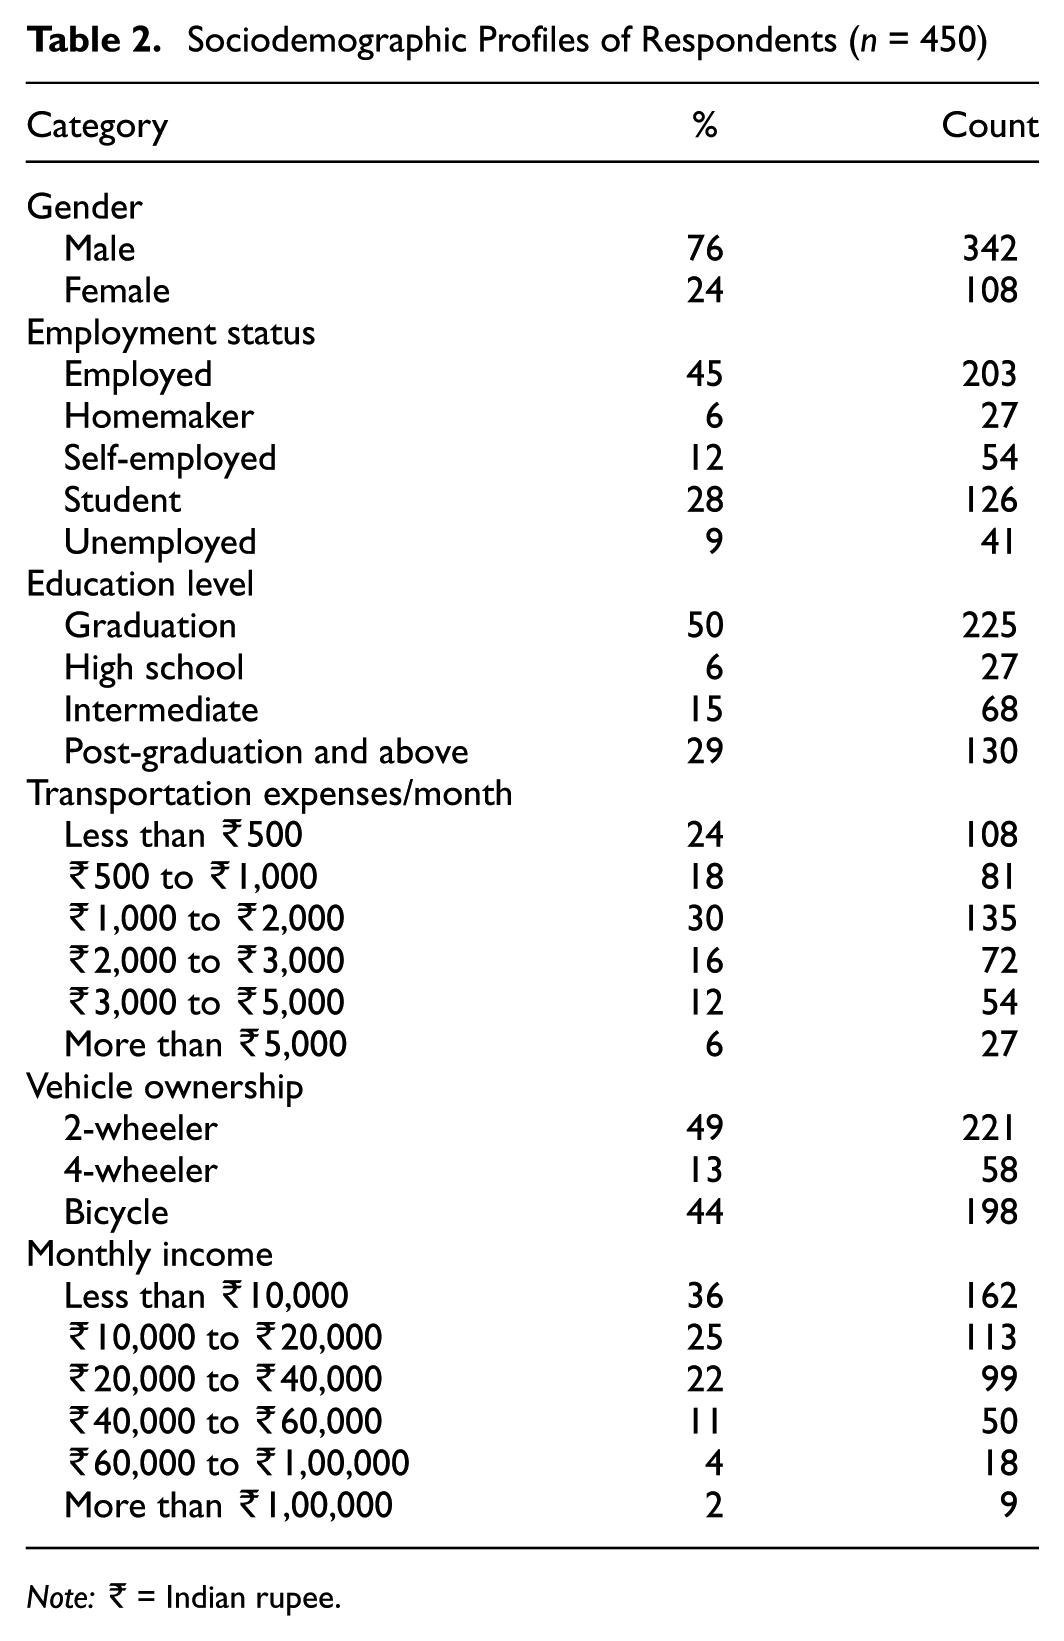
Note: ₹ = Indian rupee.
Concerning transportation expenditures, 30% of the sample allocates Indian rupee (₹)1,000 to ₹2,000 monthly for travel, whilst 24% spend under ₹500, indicating diverse affordability levels that may influence the frequency of ride-hailing utilization. The significant prevalence of two-wheeler (49%) and bicycle ownership suggests a substantial dependence on personal transportation modes, perhaps constraining ride-hailing utilization to certain circumstances such as inclement weather, extended journeys, or comfort-oriented travel. Furthermore, the income distribution indicates that 36% earn below ₹10,000 per month, underscoring cost sensitivity, while the remaining respondents with middle incomes (₹10,000 to ₹40,000) constitute a crucial market sector for economical and flexible ride-hailing services.
Sample Distribution Table (n = 450)
Estimates of Average Responses Behavioral Constructs
Table 3 presents the descriptive data for all behavioral constructs. Analysis indicates that perceived ease of use garnered the greatest scores, especially concerning booking simplicity and interface reliability. Perceived usefulness was significantly affirmed, with access to underserved regions identified as a primary benefit.
Descriptive Statistics for Key Variables and Indicators
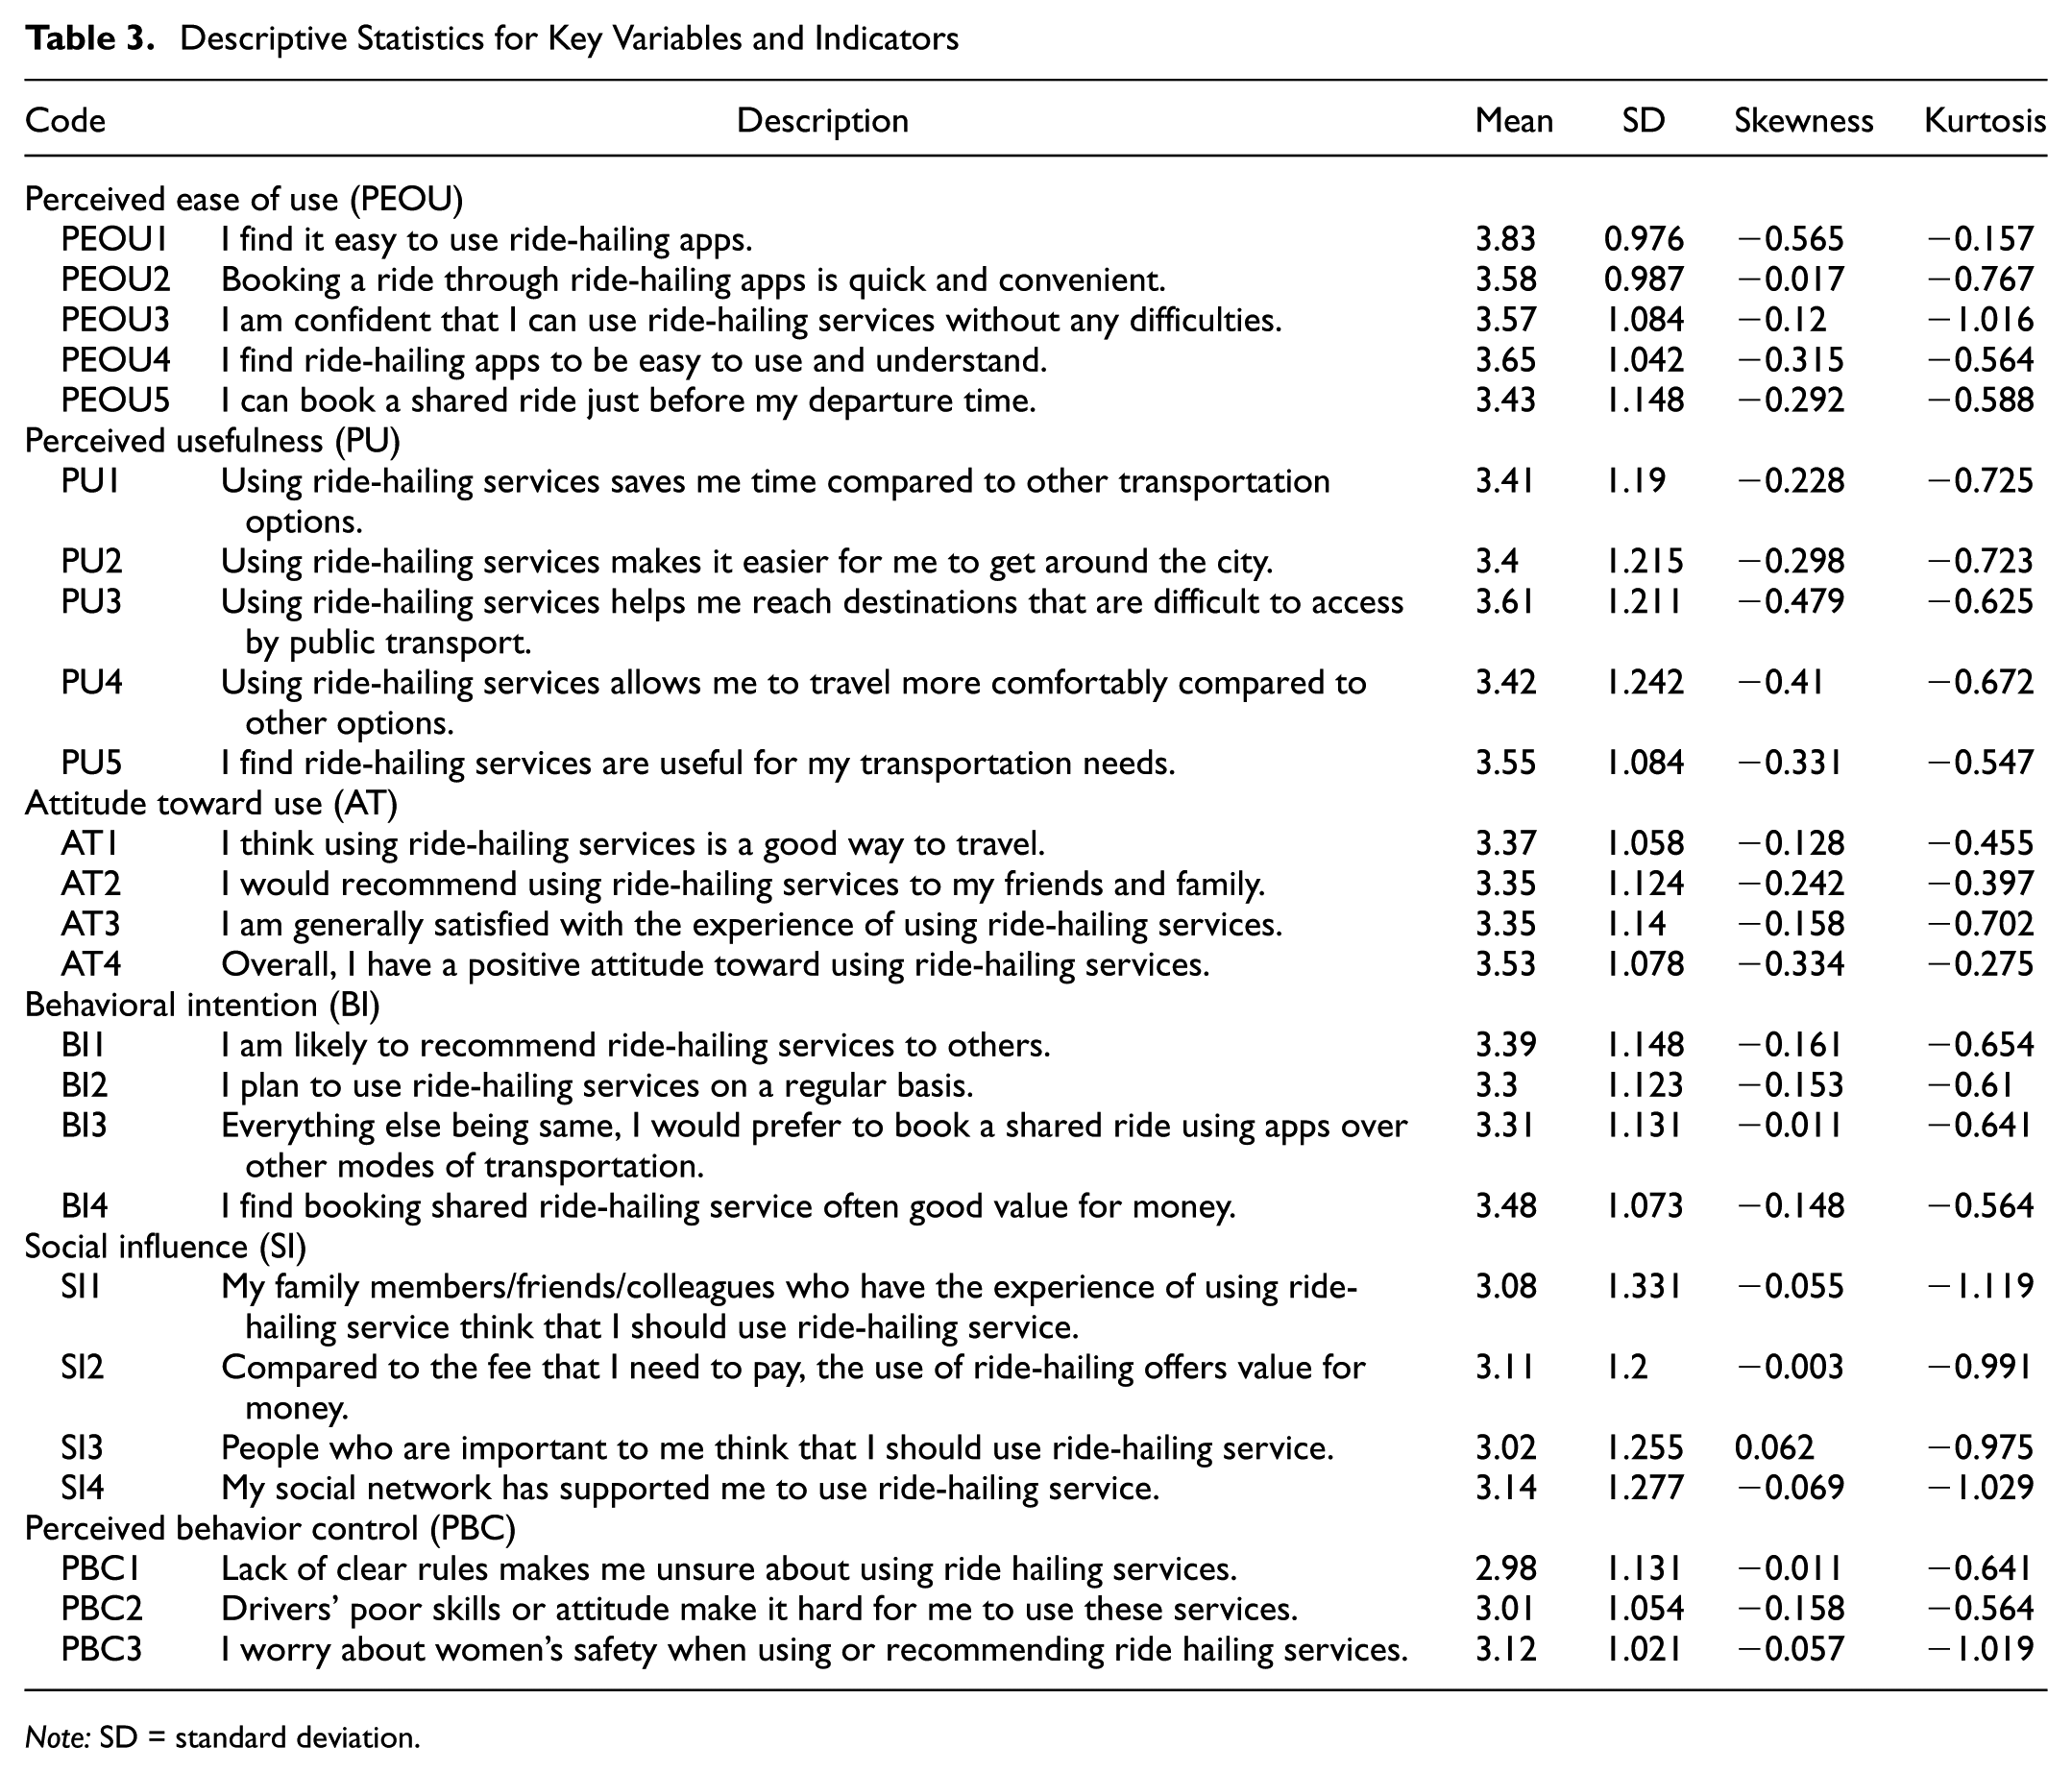
Note: SD = standard deviation.
Although respondents exhibited favorable attitudes and behavioral intentions toward ride-hailing services, social influence recorded the lowest mean scores, indicating a minimal effect of peer pressure on adoption decisions. Significantly, indices of PBC highlighted considerable safety concerns, especially among female users, which may provide a barrier to usage.
The findings indicate that functional benefits—such as perceived ease of use and utility—encourage adoption, whereas safety concerns and restricted social influence uniquely influence the behavioral context of ride-hailing services.
Assessment of Measurement Model
The study’s measuring model was developed to validate six latent factors predicted to influence ride-hailing uptake in Vijayawada. CFA validated the model’s robustness (as seen in Figure 5). The investigation indicated strong psychometric qualities for all constructions (as shown in Table 4). All factor loadings varied from 0.55 to 0.89, much above the 0.50 threshold and indicating high item reliability. The model demonstrated remarkable internal consistency, with Cronbach’s alpha values ranging from 0.844 to 0.922 and composite reliability values ranging from 0.851 to 0.933, far beyond the 0.70 threshold. Convergent validity was solidly demonstrated through average variance. The extracted values ranged from 0.678 to 0.784, above the minimum threshold of 0.50. The Fornell-Larcker criterion was used to determine discriminant validity, and Kaiser-Meyer-Olkin values more than 0.80 were used to establish sample adequacy for all constructs.
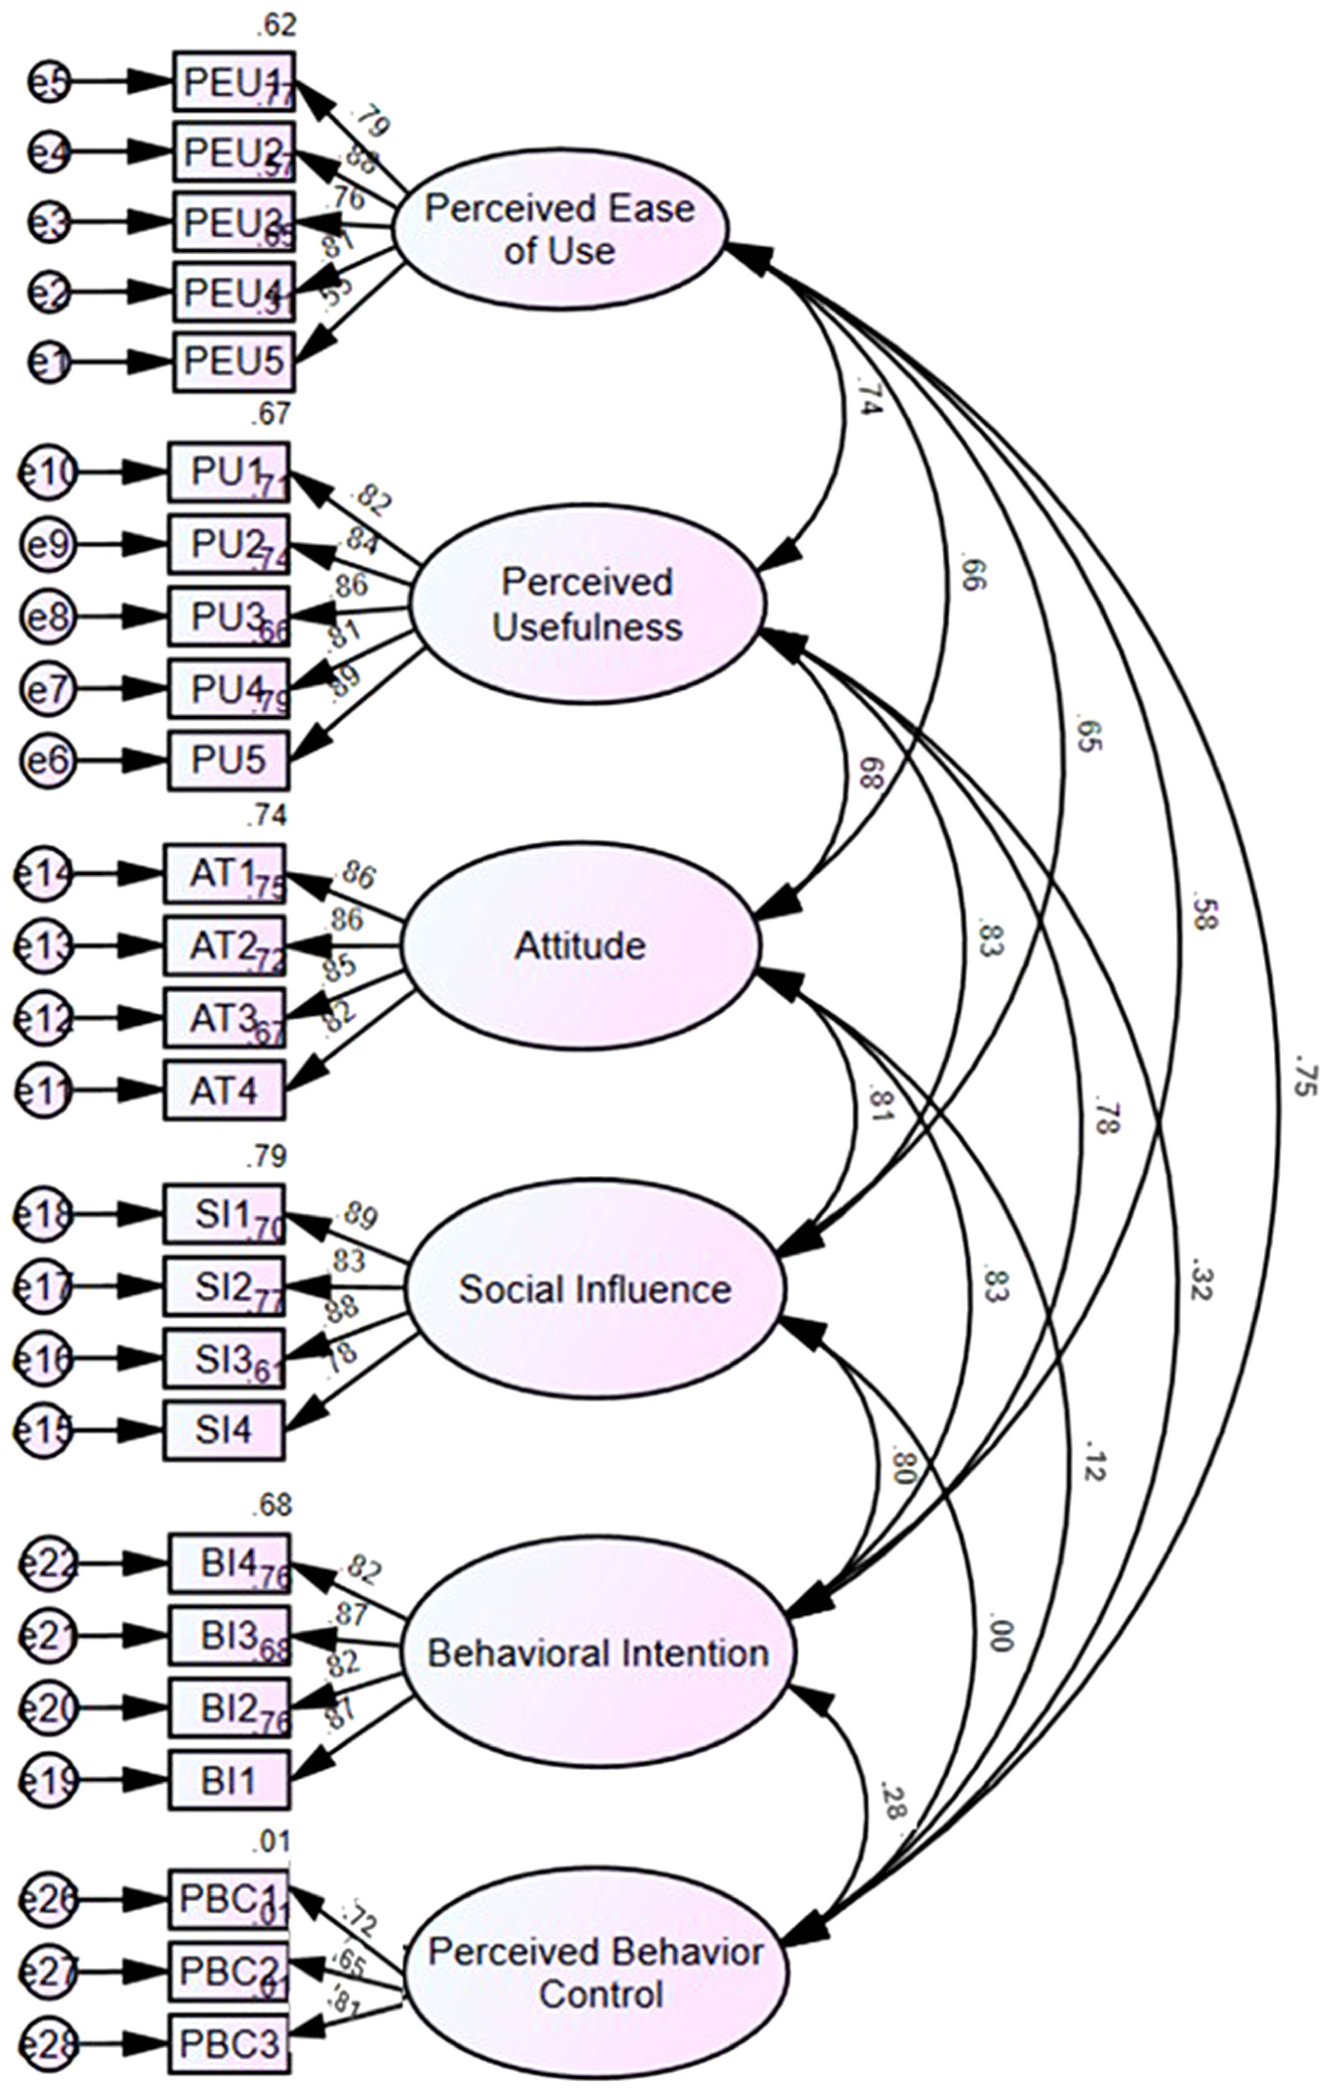
Confirmatory factor analysis measurement model for ride-hailing intentions.
Measurement Model Results: Reliability and Validity Statistics for Latent Constructs
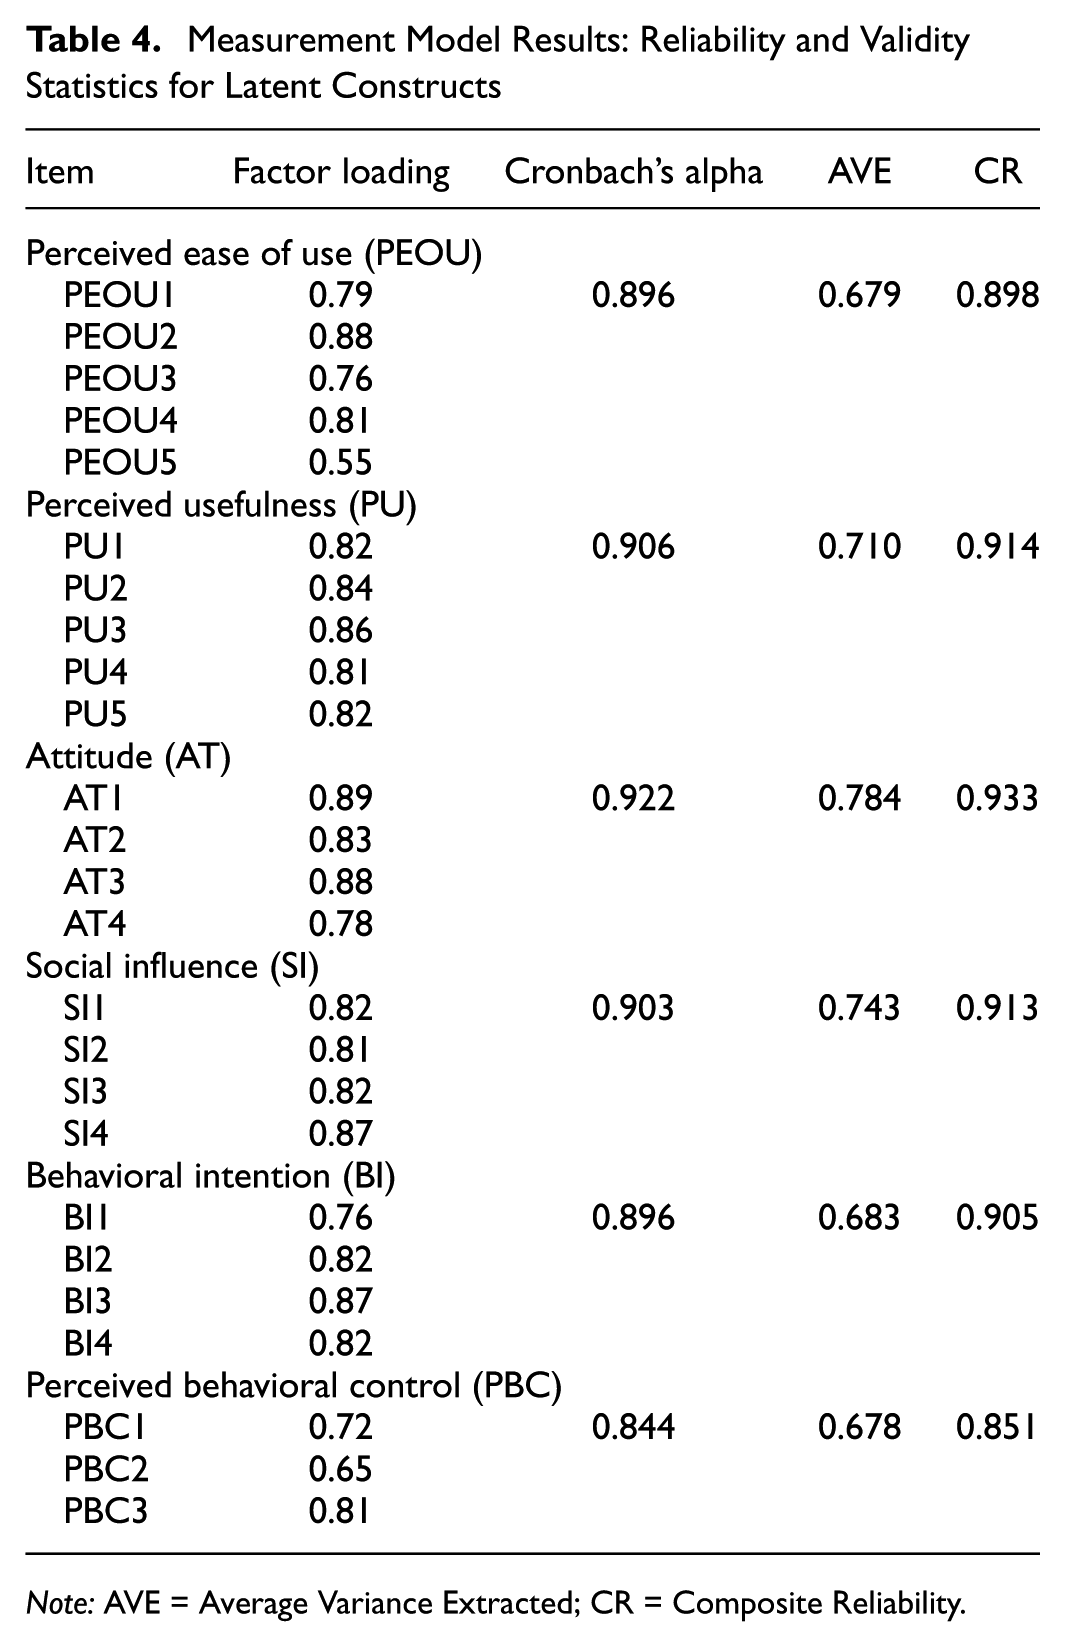
Note: AVE = Average Variance Extracted; CR = Composite Reliability.
Table 4 shows that the attitude construct had the highest measurement qualities (α = 0.922, CR = 0.933, AVE = 0.784), while perceived usefulness (α = 0.906, CR = 0.914, AVE = 0.710) and social influence (α = 0.903, CR = 0.913, AVE = 0.743) also indicated outstanding reliability. Despite having the lowest values among constructs, PBC’s metrics (α = 0.844, CR = 0.851, AVE = 0.678) remained above acceptable levels.
These rigorous validation results demonstrate that all assessment instruments successfully captured their intended theoretical constructs, producing a psychometrically robust measurement model that supports the reliability and validity of the proposed framework.
Assessment of Structural Model
The SEM results depicted in Figure 6 offer compelling evidence about the behavioral intention to utilize ride-hailing services, emphasizing the interconnections among critical constructs including perceived ease of use, perceived usefulness, attitude, social influence, PBC, and demographic variables. The model accounts for a substantial percentage of the variance in behavioral intention (R2 = 0.67), attitude (R2 = 0.74), and perceived usefulness (R2 = 0.64), demonstrating considerable explanatory strength. Consistent with the structural model results shown in Table 5, all hypotheses were statistically accepted, demonstrating that perceived ease of use considerably improves perceived usefulness and attitude, whereas perceived usefulness and attitude jointly influence behavioral intention.
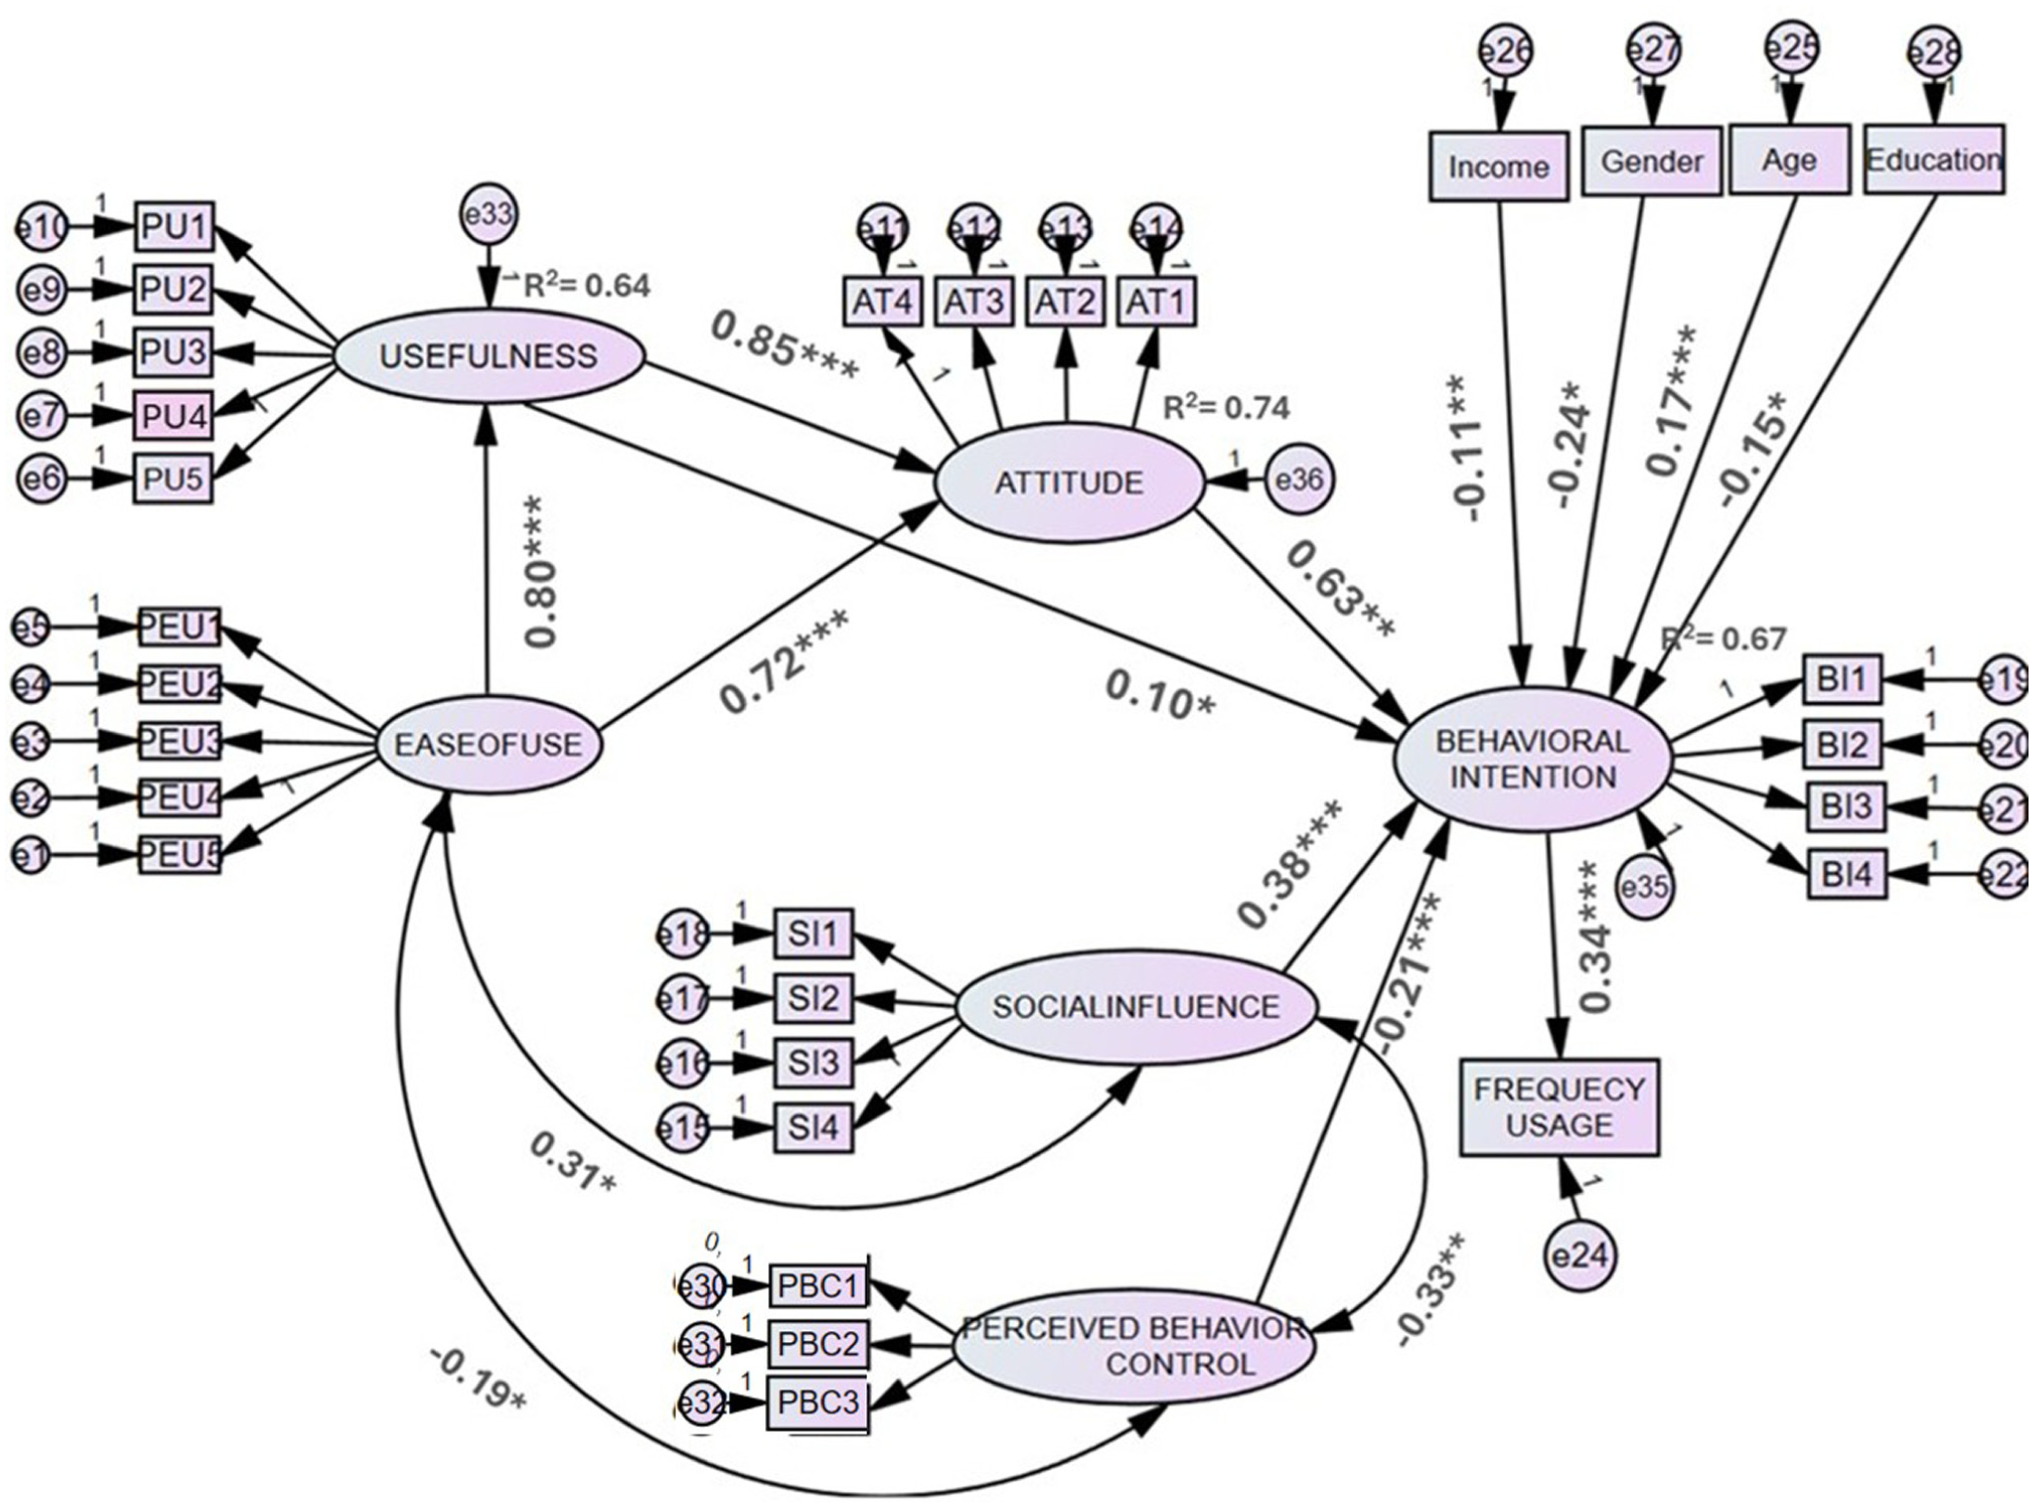
Structural model for ride hailing intentions.
Structural Model Analysis Results and Hypotheses Testing
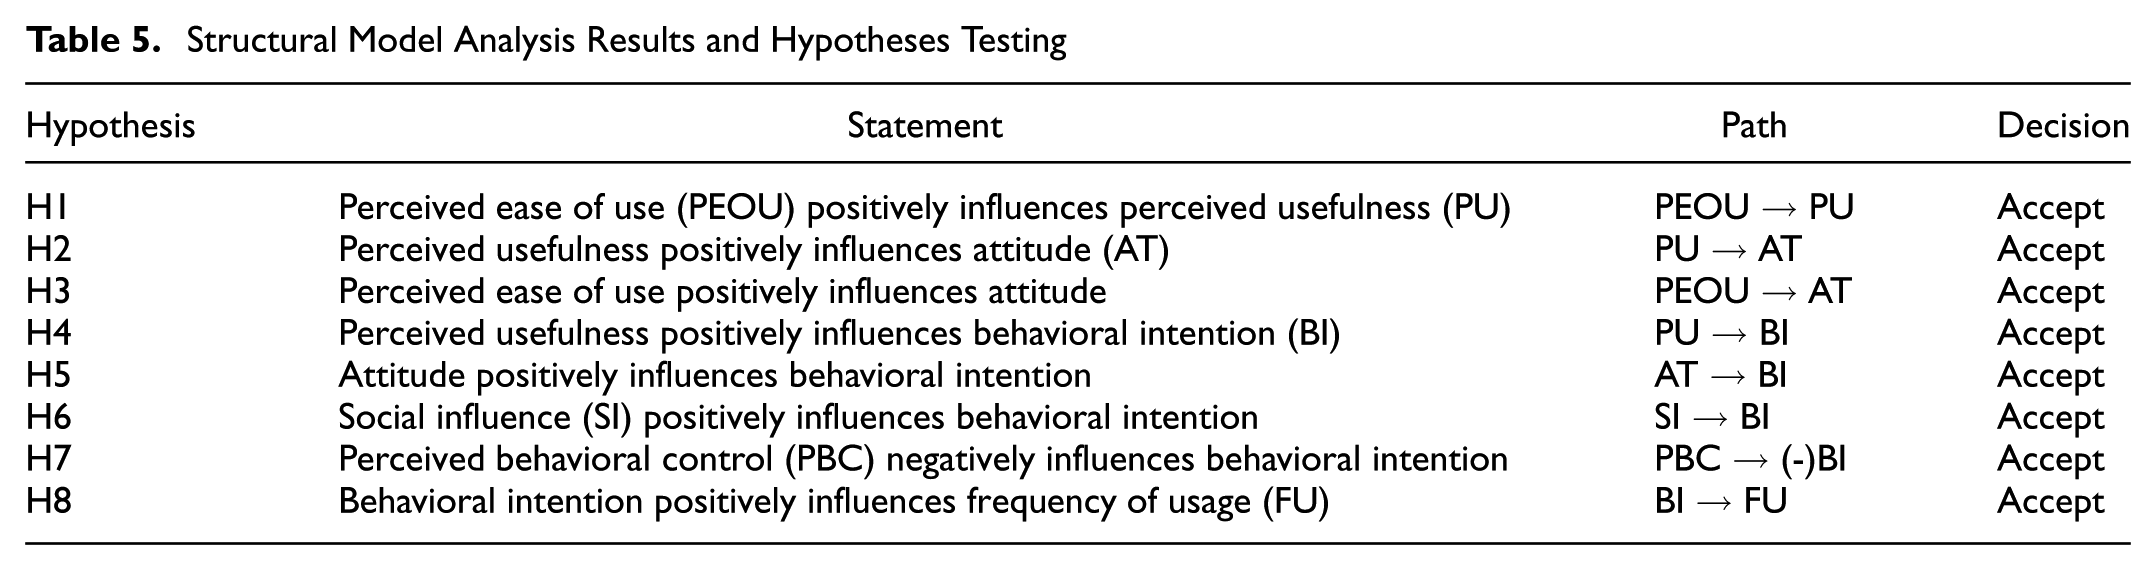
The most significant pathway in the model is from perceived usefulness to attitude (β = 0.85, p < 0.001), followed by the pathway from perceived ease of use to usefulness (β = 0.80, p < 0.001), and from ease of use to attitude (β = 0.72, p < 0.001). The results indicate that customers who see the ride-hailing system as user-friendly are more inclined to deem it beneficial, therefore cultivating a favorable attitude toward its utilization. Attitude is the most significant direct predictor of behavioral intention (β = 0.63, p < 0.001), highlighting the importance of personal assessments in technology adoption choices.
Social influence exerts a considerable impact, markedly influencing behavioral intention (β = 0.38, p < 0.001) and, to a lesser degree, attitude (β = 0.10, p < 0.05), indicating that peer perspectives, societal norms, or digital communities affect individuals’ decisions to utilize ride-hailing services. PBC negatively affects behavioral intention (β = −0.21, p < 0.001) and frequency of use (β = −0.33, p < 0.01), suggesting that individuals who perceive greater constraints or uncertainty about their ability to utilize these services may exhibit diminished intentions and reduced usage frequency. Additionally, the correlation between ease of use and PBC is negative (β = −0.19, p < 0.05), suggesting that a user-friendly interface may not mitigate more extensive external or situational obstacles.
Demographic characteristics exhibit significant influence. Gender (β = −0.24, p < 0.001), income (β = −0.11, p < 0.05), and education (β = −0.15, p < 0.05) have a negative correlation with behavioral intention, although age (β = 0.17, p < 0.05) demonstrates a favorable effect. This indicates that older customers are more likely to embrace ride-hailing services, but persons with more education, higher income, or female gender may demonstrate reduced intention, maybe because of alternative preferences, safety concerns, or restricted service accessibility. Ultimately, behavioral intention significantly forecasts actual usage behavior (β = 0.34, p < 0.001), underscoring the significance of intention as a precursor to action.
The findings indicate that a favorable attitude, influenced by perceived ease of use and perceived usefulness, is crucial for fostering the intention to utilize ride-hailing services. Social influence and behavioral regulation further delineate these linkages, while demographic disparities offer supplementary background for customizing policy and service responses.
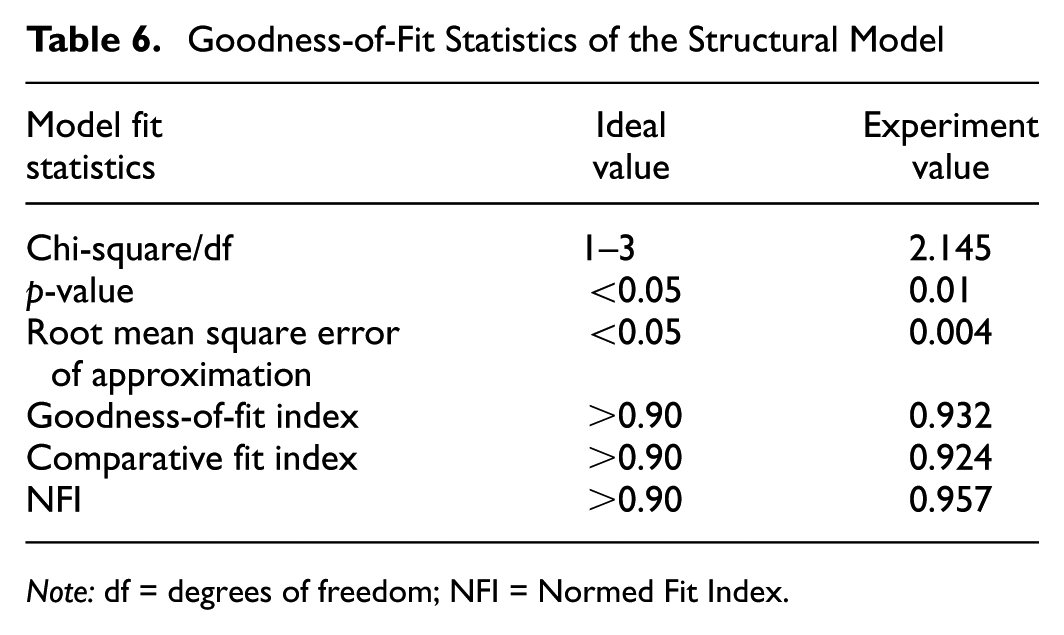
Goodness-of-Fit Statistics of Structural Model
The goodness-of-fit values in Table 6 reveal that the structural model exhibits an excellent fit to the observed data. Principal indices validate this resilience. The chi-square/degrees of freedom (df) ratio (2.145) is within the ideal range (1–3), indicating an acceptable discrepancy between observed and anticipated covariance matrices. The model’s p-value (0.01, p < 0.05) indicates adequate complexity. The RMSEA is exceptionally low (0.005), significantly beneath the 0.05 threshold, indicating robust concordance with the population covariance matrix. The GFI (0.932) and projected Adjusted Goodness-of-Fit Index (AGFI) values further corroborate model soundness. The CFI (0.924) and Normed Fit Index (NFI) (0.957) are above the 0.90 threshold, indicating that the model accounts for significant variance relative to a null model.
Goodness-of-Fit Statistics of the Structural Model
Note: df = degrees of freedom; NFI = Normed Fit Index.
Discussion and Recommendations
The findings of the SEM provide significant insights into the behavioral dynamics affecting the utilization of ride-hailing services in Vijayawada. The model indicates that perceived ease of use strongly affects perceived usefulness, highlighting the necessity for intuitive, user-friendly digital interfaces to improve users’ judgments of functional value. In a city with developing digital literacy, ride-hailing systems could enhance perceived utility by integrating vernacular language options, streamlined user interface, and voice support to accommodate semi-literate customers. In contrast to users in large metropolitan areas such as Chennai or Delhi, who often exhibit higher smartphone penetration and increased digital exposure, inhabitants of medium-sized cities may necessitate more customized and inclusive design elements to promote app utilization.
Perceived Ease of Use and Perceived Usefulness
The structural model reveals that perceived ease of use has a substantial influence on perceived usefulness, emphasizing the importance of intuitive interfaces in determining functional value perceptions of ride-hailing services. This finding is consistent with Bhatt et al., who emphasize the relevance of user-friendly design in improving service usefulness ( 14 ). In environments where digital literacy varies, such as Vijayawada, including local language alternatives and streamlined interfaces becomes critical for enhancing accessibility and perceived value among varied user groups, as Anser et al. found in their study of emerging markets ( 63 ).
Attitude and Behavioral Intention
The study indicates that both perceived ease of use and perceived usefulness significantly affect user attitudes about ride-hailing services, with usefulness furthermore exerting a direct effect on behavioral intention. These findings support the conclusions of Goel and Haldar, and Jang et al., affirming that both usability and functional value drive adoption ( 17 , 43 ).
In the context of Vijayawada, where digital proficiency differs, these linkages underscore the necessity for tailored initiatives. In addition to interface design, fostering trust through city-specific onboarding initiatives which encompass demonstrations and practical support is essential to mitigate initial reluctance and cultivate favorable perceptions of app-based mobility services.
Social Influence and Peer Networks
Social influence strongly predicts behavioral intention, but its moderate strength reflects the developing nature of ride-hailing usage in places such as Vijayawada. While peer behavior and social cues influence migration decisions, the effect is less prominent in metropolitan areas where such services are more established. This is consistent with Pandita et al., who highlight the contextual diversity of social influence in Indian ride-hailing uptake ( 33 ). Localized methods, such as gamified referral programs, group discounts for students and professionals, and ride-sharing connections with popular messaging platforms, could boost peer-driven adoption in developing nations, according to Bhaduri et al. ( 18 ).
Perceived Behavioral Control (PBC)
A significant finding is the inverse correlation between PBC and behavioral intention, suggesting that obstacles such as cost, accessibility, and application complexity hinder ride-hailing adoption. This corresponds with Naseri et al., who recognized analogous limitations in emerging markets ( 34 ). In Vijayawada, restricted service availability in periphery regions and during off-peak hours intensifies these issues. Mitigation techniques may encompass dynamic pricing to encourage driver availability in underprivileged areas, user-friendly app interfaces, and governmental assistance via designated pickup locations and expedited licensing processes. Such techniques would augment perceived control and promote increased service adoption.
Behavioral Intention and Usage Frequency
The favorable impact of behavioral intention on usage frequency substantiates the established intention-behavior correlation. In contrast to metropolitan areas, where frequent usage may be influenced by urban congestion and parking challenges, the frequency of use in medium-sized cities such as Vijayawada is typically limited by economic factors and a habitual dependence on personal two-wheelers. This discovery corresponds with Acheampong et al., who assert that, as customers develop positive intentions to utilize ride-hailing, their frequency of use escalates, particularly when services are customized to local requirements ( 51 ). To mitigate affordability issues and enhance usage frequency, ride-hailing services might implement micro-subscriptions, student packages, or off-peak discounts to convert infrequent customers into regular patrons.
Demographic Effects
The analysis reveals that gender and income have significant moderating impacts on ride-hailing adoption. Women have lower adoption rates, owing primarily to safety concerns. This conclusion is congruent with Pandita et al., who suggest safety measures such as vetted drivers, women-only alternatives, and real-time support to address this obstacle ( 33 ). Higher-income groups also show lower adoption rates, possibly because of a preference for private vehicles ( 64 ). According to Bhaduri et al., introducing premium service levels with greater comfort and amenities may help re-engage this group ( 18 ). Methodologically, categorical variables such as gender and income were included via dummy coding, with negative coefficients showing decreased adoption likelihood among women and low-income groups compared with their reference categories. This method maintains model interpretability while accounting for important sociodemographic impacts on behavioral intention.
In conclusion, although TAM and TPB are still relevant explanatory frameworks, their behavioral constructs exhibit varying manifestations throughout urban hierarchies. In large urban areas, adoption is influenced by congestion reduction, technological proficiency, and service abundance. Conversely, in medium-sized cities, adoption depends on localized usability, trust establishment, and infrastructure inclusion. Adapting ride-hailing techniques to the geographical, sociological, and technological characteristics of these urban areas is essential. Policymakers and service providers must collaborate to establish a conducive environment that encompasses digital access, multimodal integration, and community-based trust mechanisms to realize the full potential of ride-hailing in India’s urban transformation.
Limitations and Future Research
This study acknowledges specific limitations that offer opportunities for further research. The results, obtained from Vijayawada, a medium-sized Indian city, may have restricted applicability to bigger metropolitan areas or smaller urban environments with varying socioeconomic and mobility contexts. Future research may broaden the behavioral model to encompass additional shared mobility alternatives such as bicycles sharing or carpooling, and utilize longitudinal or experimental methodologies to enhance the existing cross-sectional framework. Integrating qualitative methodologies would reveal profound cultural and experience influences, while additional examination of institutional factors, such as municipal policies and public transit integration, could clarify their impact on trust and sustained adoption.
Conclusion
This study examines the determinants affecting the adoption of ride-hailing services in Vijayawada, a swiftly urbanizing medium-sized city in India, employing a hybrid behavioral framework that integrates TAM and TPB. The results enhance comprehension of how socioeconomic, infrastructural, and behavioral factors influence customers’ intentions and utilization of ride-hailing services in developing economies.
Critical insights from the SEM research indicate that perceived ease of use and perceived usefulness are essential determinants of the behavioral intention to utilize ride-hailing services. The study highlights the significance of social influence in influencing user intentions; however, its impact is less significant in medium-sized cities than in metropolitan locations. PBC was identified as a barrier to adoption, highlighting issues such as cost, service accessibility, and application complexity that need to be resolved to promote wider acceptance. Demographic characteristics, including gender and wealth, significantly influence usage intentions, with women and high-income groups exhibiting lower intentions, indicating the necessity for targeted interventions.
This research highlights the significance of localized solutions customized to the distinct attributes of medium-sized cities such as Vijayawada. To enhance acceptance, ride-hailing services must prioritize the simplification of the user experience, the mitigation of safety concerns, and the assurance of service availability in underserved regions. Policymakers and service providers must cooperate to provide a supportive system that encompasses infrastructural enhancements, digital accessibility, and activities for fostering social trust to fully realize the promise of ride-hailing in India’s developing urban environment.
This study enhances the conversation on technology-enabled mobility in emerging economies, providing practical insights for service providers, urban planners, and politicians aiming to extend ride-hailing services in medium-sized cities. The results establish a basis for additional investigation into ride-hailing uptake in smaller urban areas and provide a framework for creating inclusive, user-centric, and contextually relevant solutions to foster sustainable urban mobility in India.
Footnotes
Author Contributions
The authors confirm contribution to the paper as follows: study conception and design: P. Machavarapu; data collection: K. Simhadri; analysis and interpretation of results: P. Machavarapu; draft manuscript preparation: P. Machavarapu, K. Simhadri. All authors reviewed the results and approved the final version of the manuscript.
Declaration of Conflicting Interests
The authors declared no potential conflicts of interest with respect to the research, authorship, and/or publication of this article.
Funding
The authors received no financial support for the research, authorship, and/or publication of this article.
Declaration of Generative AI and AI-Assisted Technologies in the Writing Process
The authors used a language editing tool (Quill Bot) to improve the fluency and readability of the manuscript.
Data Accessibility Statement
The datasets generated and/or analyzed during this study are available from the corresponding author on request.
All intellectual content and interpretations in this article are solely those of the authors.