
Abstract
The development of urban metro networks is crucial for planners and policymakers in addressing sustainable urban development. This study collected metro network data from 34 cities in China and utilized a three-dimensional model to perform a topological analysis of these networks, aiming to identify successful practices. The service degree of population demonstrated a strong correlation with the topology of urban metro networks. The topological analysis revealed three phases in the evolution of metro networks: (1) central densification; (2) outward expansion; and (3) preferential development. Throughout this process, the complexity of metro networks tends to reach saturation, and transfer convenience is enhanced, resulting in a reduction in the number of transfers required during travel. Furthermore, the implementation of ring lines was effective in improving the state features of metro networks during the early stages. Increasing the ratio of radial lines can maintain network simplicity and enhance transfer convenience. The findings of this study provide insights for policymaking in the development of urban metro systems.
Introduction
The urban metro system, as a high-capacity mode of transportation, plays a crucial role in enhancing urban mobility. However, the construction of this system necessitates substantial government investment ( 1 ). Consequently, it is imperative to evaluate whether the decision to invest in and develop metro lines is justifiable. The primary objective is for the metro system to deliver optimal service to urban residents while adhering to budgetary constraints ( 2 ).
Recent research attention has increasingly focused on the network characteristics of urban metro systems. The functionality of a metro system as a network is contingent on the cooperation between all nodes and routes because no single node or a limited number of nodes are solely responsible for passenger transfer. Therefore, the analysis of design and scheduling performance in metro networks has emerged as a pivotal element in enhancing the efficiency of urban public transportation systems ( 3 , 4 ). Conducting a topological analysis is an effective method for quantifying metro network performance ( 5 ). Various attributes, including state, coverage, and serviceability, are considered when interpreting and conceptualizing the topology of urban metro networks. These topological properties accurately depict the static and dynamic characteristics of metro networks ( 6 ).
The implementation of a topological approach to assess metro network performance is well-documented ( 7 – 11 ). This methodology has proven particularly effective in identifying and categorizing different types and structures in metro networks. Despite the diversity in geographical and socioeconomic conditions across cities, urban metro systems exhibit common generic features, such as a core with branches ( 12 ). Further research has explored the evolution patterns of metro networks ( 1 , 2 , 4 , 12 , 13 ). The aforementioned studies indicate a promising direction toward understanding the variations in existing metro network topologies across cities and their evolution into the complex structures observed today. This study will provide insights into current and future urban metro systems, facilitating decision-making among different scenarios and establishing new objectives.
Furthermore, previous research predominantly focused on identifying patterns within a limited number of cities, neglecting to conduct a comprehensive analysis of the evolutionary processes across a broader range of urban areas. This limitation has resulted in conclusions that are less comprehensive and persuasive. In addition, earlier studies focused exclusively on annual changes in metro networks, overlooking disparities in network development across cities. For instance, some cities have long-established, mature metro networks, and others have to develop their systems into fully integrated networks. Consequently, a line-by-line analysis may offer a more compelling perspective on the dynamic evolution of urban metro networks. The primary focus should be on the topological changes within the metro network as the number of metro lines increases.
Ring and radial lines have emerged as significant components in the scholarly discourse on the development of urban metro networks. The integration of these lines into metro systems has been shown to affect network performance, including passenger travel experience and ridership ( 14 – 17 ). Despite the importance of ring and radial lines in metro networks, there is a lack of research on their effect on the topological evolution of these networks. Therefore, the role of these distinctive topological elements in urban metro systems needs to be fully elucidated. To enhance metro network performance, it is essential to gain a deeper understanding of the topological effects of these lines.
In this study, the metro networks in 34 major cities in China are examined. The primary contributions of this study are twofold. First, the overall development process and variations in metro network topology are summarized by conducting a comparative analysis across a substantial sample of cities at different stages of development. Second, the influence of ring and radial lines on the evolution of metro network topology is analyzed. This study provides practical guidance for the future development of urban metro systems, offering recommendations applicable to cities with diverse profiles and stages of metro system development.
Literature Review
Transportation Network Topology
Conceptualizing transportation networks as complex topologies on planar graphs has proven effective for evaluating infrastructure investments ( 18 ). Previous studies have employed the concept of topology to analyze various transportation modes, such as the cruise industry operating within a geographic space. Topology offers tools for examining the operational and geographic dynamics of ports within the cruise network. The research by Tsiotas et al. ( 19 ) suggests that analyzing the competitive positioning of cruise companies and port authorities can facilitate improved operational and investment decisions.
Furthermore, the railway network, acknowledged as a high-capacity mode of transportation, necessitates consideration of accommodating many passengers within a constrained fleet capacity. The network topology facilitates a reduction in the need for interchanges by minimizing the size of the network’s fleet, enhancing the design plan of the rail department ( 20 ). In addition, the location of airports is closely associated with urban hierarchies and significantly affects the site selection strategies of global service companies. Constructing the air network topology and conducting a parallel analysis of the distribution of globalized firms can elucidate the exogenous effects of airports, providing valuable recommendations for airport site selection and investment ( 21 ).
Numerous studies have examined the properties of metro networks using various topological indicators. Derrible and Kennedy ( 13 ) characterized the features of metro systems for state, form, and structure by analyzing 33 metro systems worldwide, identifying three phases, three types of forms, and three types of structures in metro network development. Pei et al. ( 12 ) investigated the dynamic evolution of structural efficiency in metro systems across 14 major cities in China. Their findings indicated that enhancing the global efficiency of metro networks depends on increasing the relative ratio of core stations. Yu et al. ( 2 ) quantified the performance of metro networks based on accessibility, resilience, and serviceability. Their study demonstrated that the metro network evolves from a nascent to a skeleton, and then to a mature stage. The balance between metro development and car popularity determines the choice between a metro-dominant or car-dominant society. Ring lines are essential structural elements of a metro network that enhance its connectivity and directness, increasing transit ridership ( 22 ). These lines are particularly effective in improving mobility in central urban areas. In contrast, radial lines serve as crucial corridors connecting central urban areas with suburbs. There is an anticipated increase in demand for radial lines in metro networks as travel time rises ( 14 ).
Measuring Metro Network Topology
Numerous studies on the topology of metro networks have proposed various topological indicators to assess their performance. Han and Liu ( 23 ) conceptualized metro networks as graphs and conducted an analysis of 10 existing and proposed metro networks. They calculated the size of the largest connected component as a measure of topological vulnerability, which was subsequently employed in planning strategies to enhance the design and operation of metro systems. The research by Pei et al. ( 12 ) utilized the concept of topology to compute efficiency, a comprehensive indicator, to compare the functional stations of metro networks across 14 Chinese cities. Wu et al. ( 4 ) introduced a novel node-occupying probability indicator to evaluate station utilization levels within metro networks, conducting a case study in six major cities worldwide.
Existing research has demonstrated that a singular indicator is insufficient for a comprehensive depiction of metro networks. Therefore, studies should incorporate multiple indicators to elucidate various facets of metro networks. Dong et al. ( 24 ) characterized the development patterns of metro networks by employing four indicators related to geometric morphology, functional use, transportation facilities, and development intensity. Yu et al. ( 2 ) devised a nine-category metric scheme to evaluate the service performance of metro networks concerning accessibility, resilience, and serviceability. Their study employed a visualization tool to depict the growth patterns of metro networks across 42 cities. The aforementioned studies have illustrated the effectiveness of graph indicators in evaluating the performance of urban metro networks. These studies often emphasize the mathematical construction of topological concepts, rendering them complex and abstract. In contrast, Derrible and Kennedy ( 13 ) introduced a three-dimensional (3D) model that categorizes metro network topology into state, form, and structure, simplifying the comprehension of topological concepts. Furthermore, this model offers valuable theoretical insights for the evaluation of metro network topologies. However, existing multi-indicator evaluation frameworks for metro networks predominantly focus on static topological structures, lacking a dynamic perspective on network development. Of note, cities encounter two primary challenges during metro network construction: (1) the current stage of metro network topology remains unclear, and the appropriate direction for its future development is yet to be determined; and (2) during the construction process, different topological indicators often reflect competing characteristics, raising the question of which aspects should receive greater emphasis. Addressing these challenges necessitates a comprehensive understanding of the dynamic evolution of metro networks.
Metro Networks in Chinese Cities
China’s rapid and extensive development of urban metro systems across numerous cities within a brief timeframe has emerged as a significant area of scholarly inquiry. Several studies have focused on various aspects of the Chinese urban metro system. First, researchers have investigated the expansion of metro networks in Chinese cities. Yu et al. ( 2 ) employed an unsupervised machine learning technique to identify expansion trends in metro networks across 42 Chinese cities. Their study identified three distinct stages in the growth process: (1) nascent; (2) skeleton; and (3) mature. Second, researchers have analyzed the effect of metro network expansion on urban development and society. Yang et al. ( 10 ) explored the variation in metro mode share among residents living close to and at a distance from stations in Xi’an as the metro network evolved from a single-line to a multiline system. Their findings indicated that the metro network increases the proportion of commuters using the metro mode who reside further from stations, but not those living nearby. Third, the resilience of urban metro networks has garnered considerable attention from topological and functional perspectives. Zhang et al. ( 25 ) developed a resilience model and applied it to Shanghai’s metro network. Their findings demonstrated that Shanghai’s metro system exhibits varying levels of resilience when subjected to random and intentional disruptions. Utilizing an all-or-nothing assignment rule, Sun and Guan ( 8 ) modeled passenger traffic in Shanghai’s metro network and assessed the effect on passenger flows under different disruption scenarios. Their study revealed that the circular layout of the metro network significantly influences passenger redistribution in the event of a disruption.
As a rapidly developing country investing in urban metro systems at an unprecedented pace, China presents a valuable case for examining the success of metro network development. This study investigates long-term variations in the network topology of metro systems across 34 Chinese cities, considering the dimensions of state, form, and structure. It introduces a novel method to correlate the evolution of metro network topology with the expansion of metro lines, utilizing long-term data from metro systems in Chinese cities.
A substantial body of literature has explored the topological characteristics of metro networks; however, three critical limitations persist. First, most studies have concentrated on well-developed, high-tier cities, leaving lower-tier cities largely underrepresented. Second, although a multiple-indicator framework has proven effective for evaluating topological features, most existing research relies on static assessments of network topology, lacking a dynamic, evolutionary perspective. Third, many studies employ overly complex topological indicators, rendering the concept of network topology abstract and challenging to apply in practical urban planning and decision-making contexts. To address these gaps, this study compiles a comprehensive dataset encompassing the entire developmental history of metro networks in 34 Chinese cities, from inception to maturity. Building on the state–form–structure framework proposed by Derrible and Kennedy ( 13 ), a dynamic evolutionary perspective to systematically analyze the progression of metro networks across all city tiers is introduced. The findings aim to support the identification of a city’s current development stage and the strategic planning of future network expansions, tailored to diverse urban contexts.
Methods
Three-Dimensional Topology Feature Model: State–Form–Structure
A 3D topology feature model, as proposed by Derrible and Kennedy ( 13 ), examines the state, form, and structure of metro systems. The “state” component quantifies network complexity, and the “form” component elucidates the relationship between the built environment and networks, with a focus on metro network coverage. The “structure” component highlights the diversity and convenience for transfers within the metro network.
Within metro networks, stations are categorized as intermediate, transfer, or end stations. Intermediate stations are the most prevalent, followed by transfer and end stations. However, intermediate stations are inadequate for representing the topological features of the metro network ( 13 ). Therefore, a simplified core topology network is required, concentrating on transfer and end stations. In this core topology network, edges are defined as the lines connecting end stations and transfer stations. The primary aim of this approach is to accurately represent the fundamental characteristics of the metro system’s topology (Figure 1).
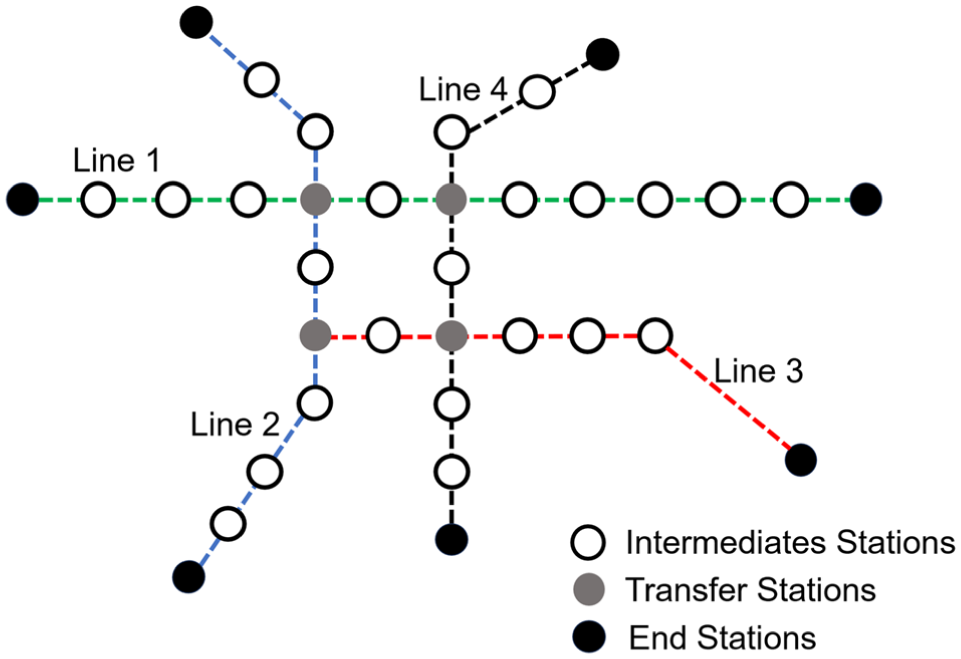
Simplified core topology network.
State of Metro Networks
The state functions as a crucial indicator to demonstrate the developmental stage of the metro system. Two indicators are employed to represent the state: complexity
The total number of stations

The complexity

The degree of connectivity

where
Form of Metro Networks
The form underscores the critical integration between the metro network and the urban environment. Different planning proposals for metro networks play distinctive roles in the urban system, and they can be classified into two key levels: (1) regional; and (2) local. At the local level, the metro network primarily caters to the needs of high-density urban areas, facilitating the movement of residents from their homes to jobs. In contrast, the regional network level is designed to connect high-density urban zones with other areas that generate significant traffic demand, such as suburban transportation hubs and satellite cities. The structure can be gauged through two key indicators: (1) the average line length
The average line length can identify whether a metro network is regionally or locally focused.

The interstation spacing represents the density of transportation services provided by the metro network and is defined as,

where
Structure of Metro Networks
The transfer capacity within a metro network is a crucial indicator of the network’s efficiency in delivering services. To evaluate this capacity, a prevalent method involves calculating the transfer options available at each station and subsequently aggregating these values to ascertain the overall transfer capacity of the metro network. Transfer options are typically evaluated based on the number of metro lines passing each station. Stations with a single line are deemed to possess negligible transfer capacity; however, those with multiple intersecting lines are acknowledged for their substantial transfer capabilities.

where
Two indicators are used to measure the structure of metro networks: (1) the structural connectivity
where
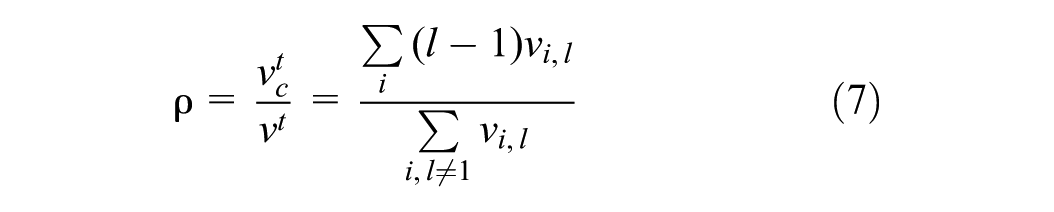
The shortest path quantifies the maximum number of transfers required to travel from one station to another. In addition,

where

Therefore, the factor

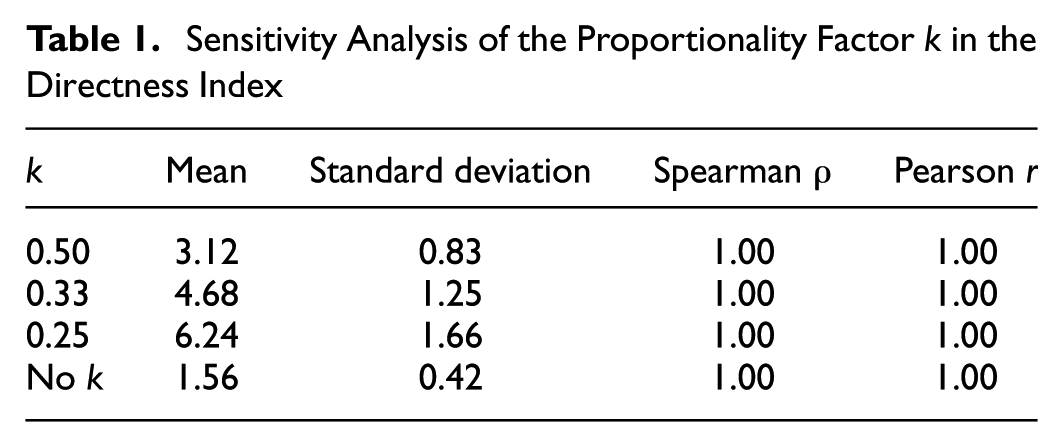
This simplification preserves the comparability of the index across metro systems while ensuring parsimony. To verify this treatment, a sensitivity analysis was conducted by calculating directness under three plausible values of
Sensitivity Analysis of the Proportionality Factor
Data Source and Processing
The metro network data utilized in this study was obtained from Gaode Map, the preeminent map integration provider in China. Data were collected for 34 Chinese cities, encompassing metro stations and their connecting lines. The processing of the metro network data involves three distinct steps. First, the most recent metro network data set is acquired from the map provider, which includes various indicators such as identity (ID), station name, longitude, latitude, city, and associated metro lines. Of note, the IDs in this data set denote the actual sequence of stations within each metro line. Utilizing these IDs, the metro network can be constructed, composed of stations and the lines intersecting each station. Second, the start and end stations are identified based on their IDs, representing the two endpoints of an edge within the network. However, the distance between the start and end stations remains uncalculated. This distance is further determined using the longitude and latitude of the start and end stations. Finally, as shown in Figure 2, stations with only one connecting line and two neighboring stations are removed to establish a simplified core topology network. All three steps are executed using Networkx ( 26 ), a Python-based computational platform grounded in graph theory. In addition, historical data for metro networks are collected and compiled on a line-by-line basis by referencing construction records for metro systems in 34 Chinese cities. The same procedures are applied to extract and clean the historical network data.
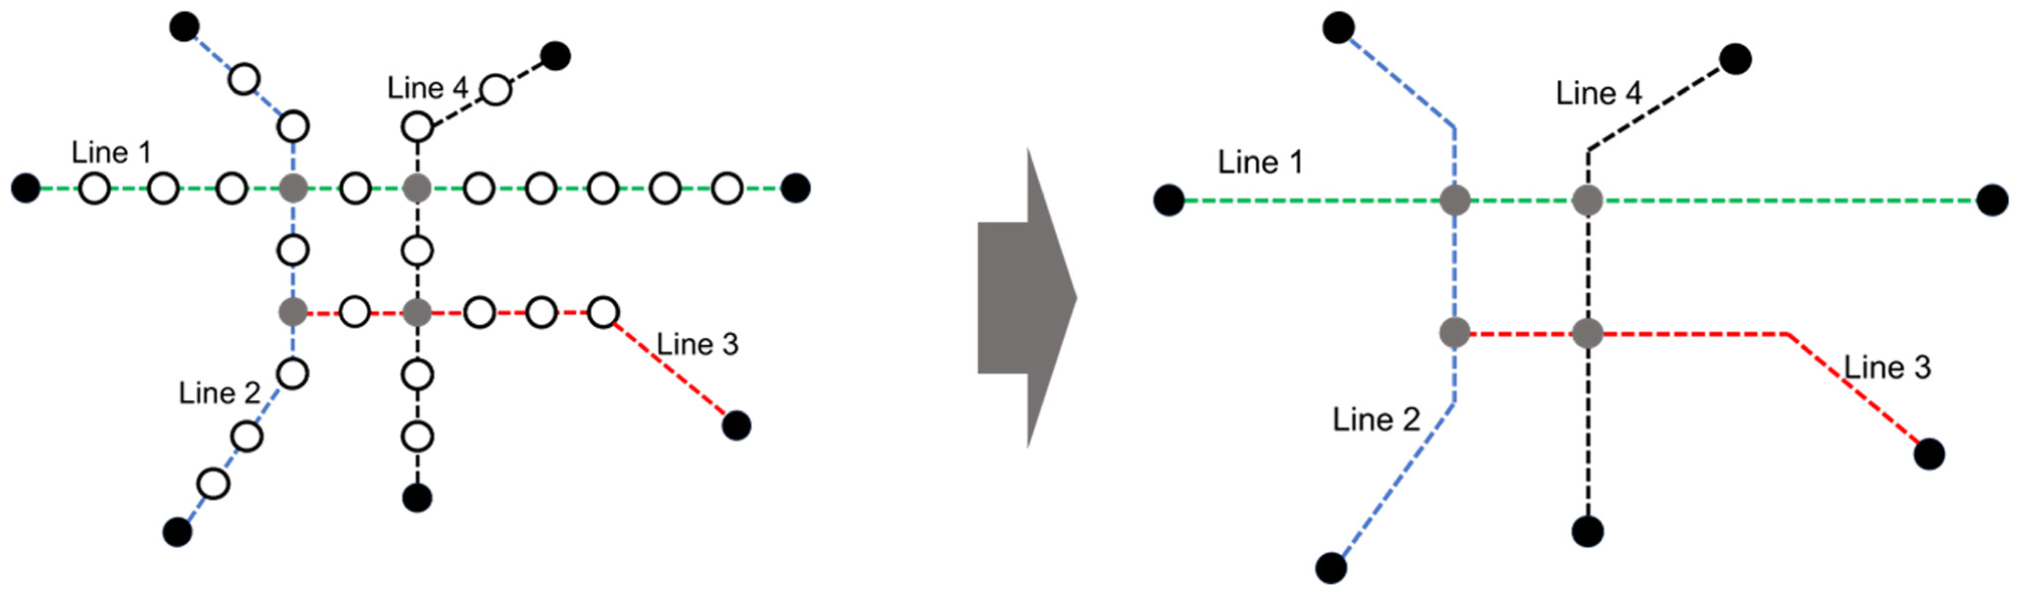
Original metro network and simplified metro network.
Results
Topology of Metro Networks in Chinese Cities
The state–form–structure model is utilized to examine the network topology of metro systems in 34 Chinese cities. Scatterplots are employed to visually depict the diverse metro network topologies among these cities in three dimensions. Subsequently, Chinese cities are categorized into distinct groups based on the characteristics of their metro network topology. To further explore the relationships between topological indicators, a second-order polynomial regression was applied to all relevant scatter plots. The general form of the fitting equation is,

where
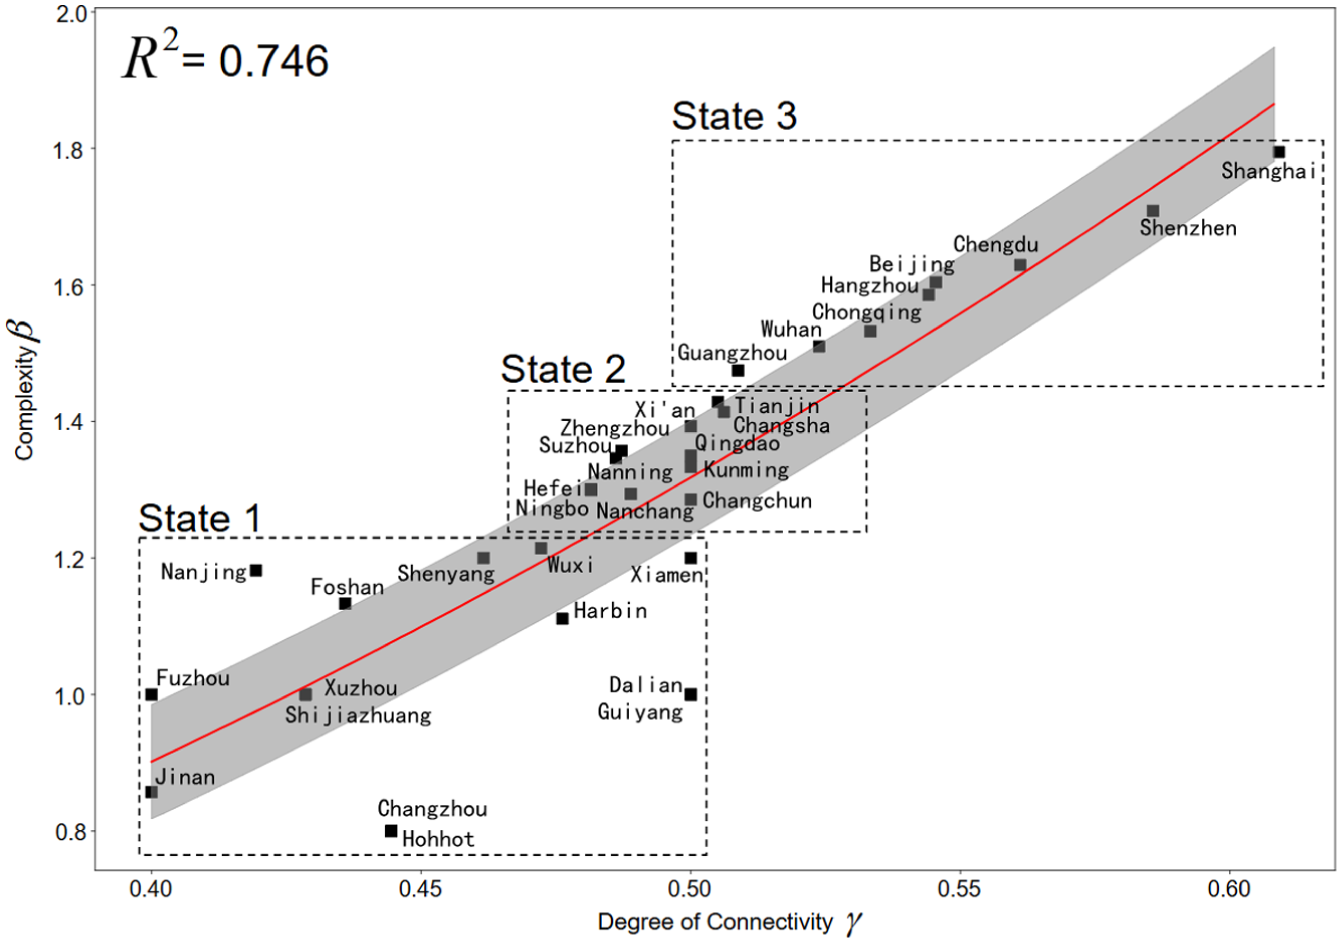
State of metro networks in Chinese cities.
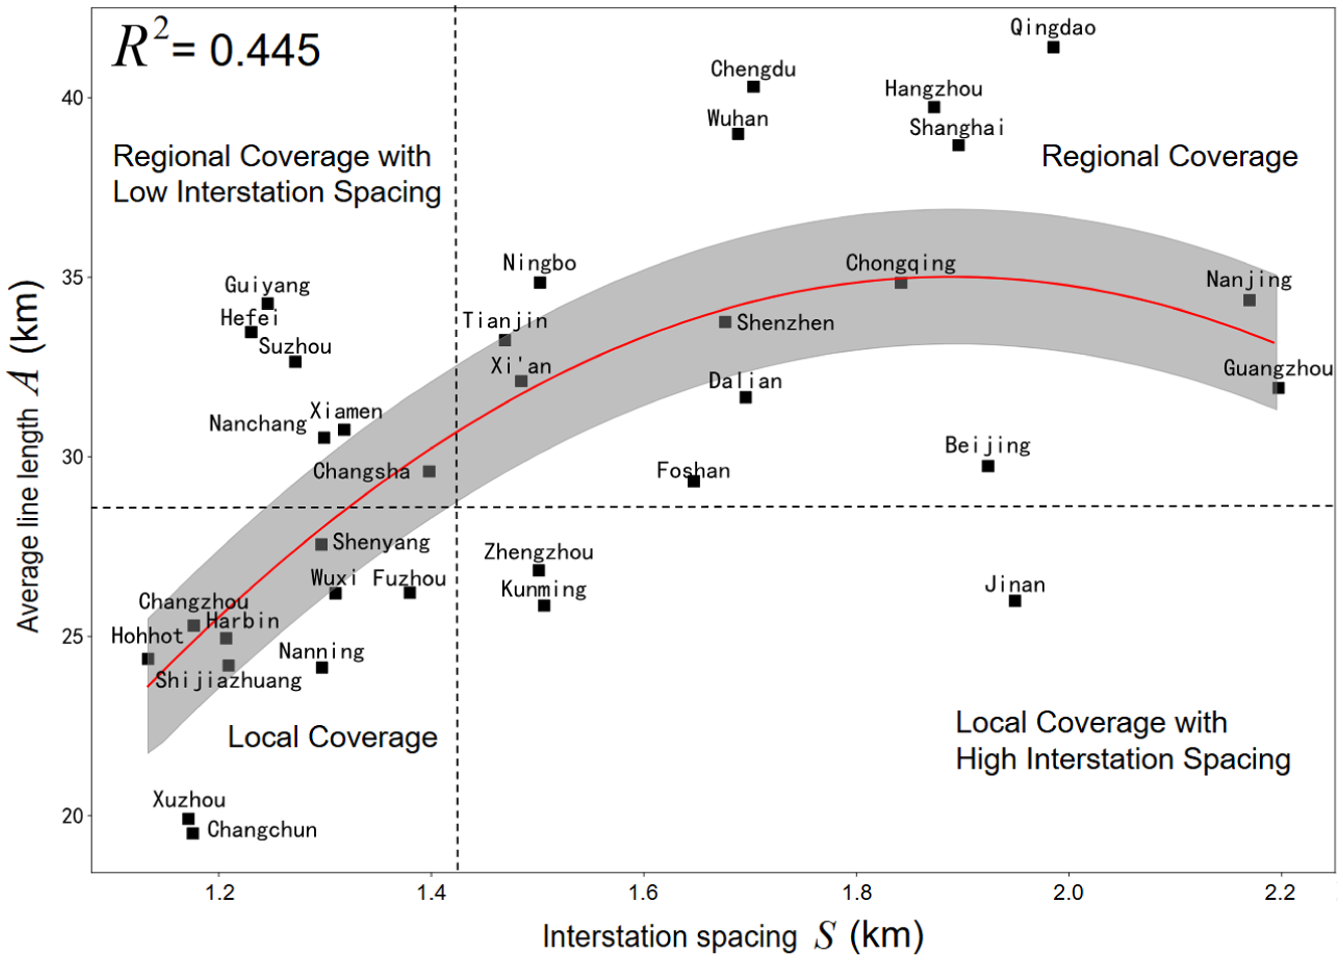
Form of metro networks in Chinese cities.
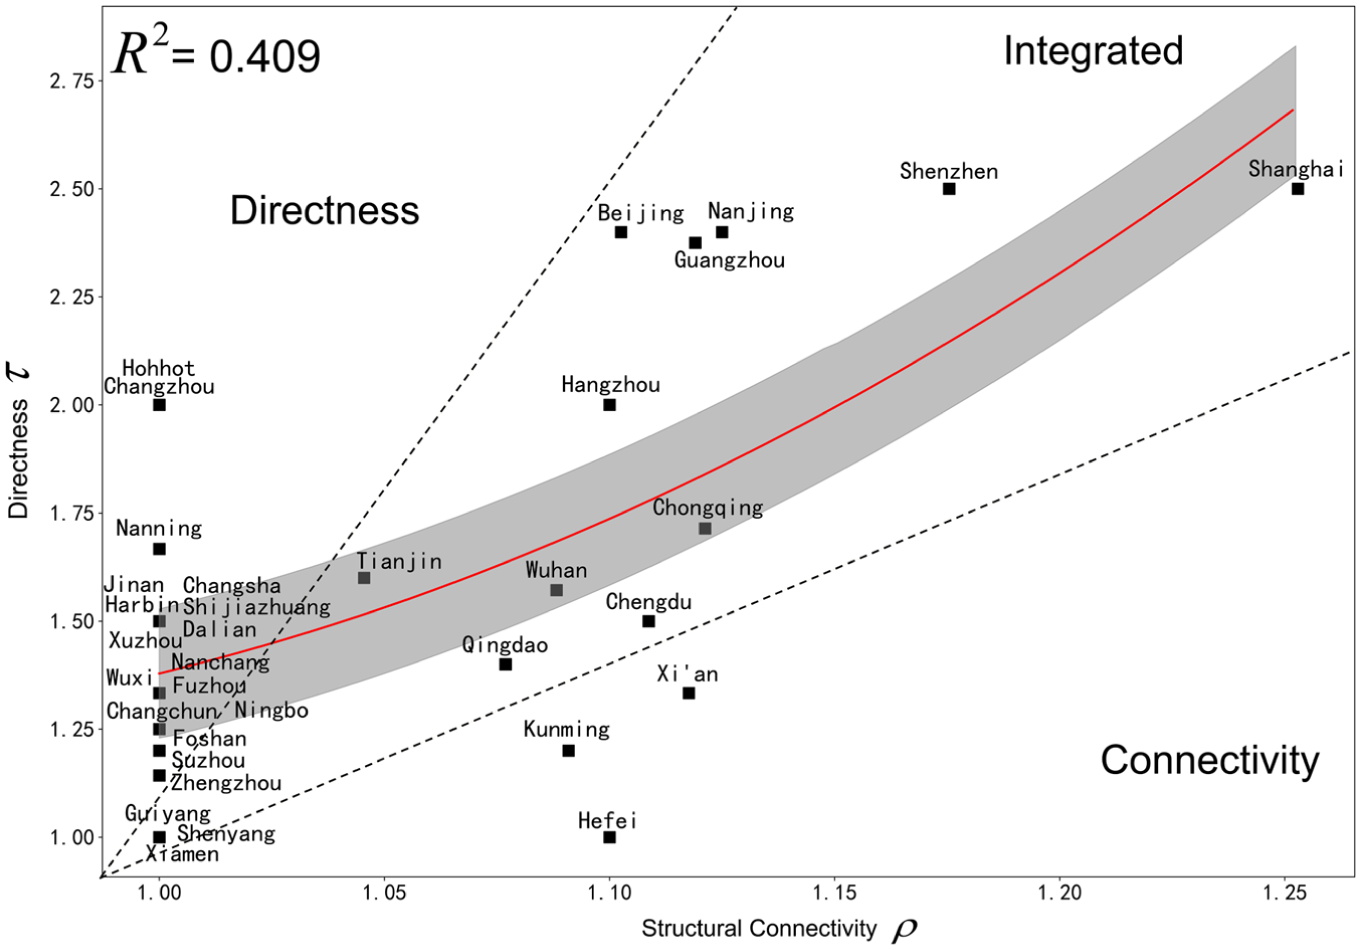
Structure of metro networks in Chinese cities.
State Characteristics
Figure 3 shows the complexity and degree of connectivity of the metro networks for each city in the sample. The fitting curve demonstrates a linear relationship between these two state metrics, indicating that as complexity increases, the degree of connectivity tends to rise. Chinese cities can be classified into three categories based on their varying levels of state, ranging from low to high: States 1, 2, and 3.
In general, metro networks in cities classified as State 1 have been under development for a relatively short duration, typically between 1 and 5 years. In contrast, metro networks in State 2 cities have usually been developed for 5–10 years, and those in State 3 cities have generally been developed for over 10 years. The level of metro investment is closely associated with a city’s economic capacity. Therefore, metro networks in larger cities with higher development levels tend to exhibit greater complexity and connectivity in their network topology.
However, certain cities deviate from the expected state of metro network topology relative to their development levels. For instance, Nanjing, the capital of the economically advanced province of Jiangsu in Eastern China, is a more economically developed city; however, its metro network is categorized as State 1. This anomaly arises from Nanjing’s distinct metro development strategy, which results in a relatively sparse metro network compared with other cities at a similar development level. Nanjing’s metro development prioritizes suburban expansion and guides urban development and land use by allocating valuable additional land indicators to areas along metro lines and around stations. Consequently, a significant portion of radial lines were constructed in Nanjing to enhance connectivity between core and suburban areas. However, the emphasis on constructing radial lines results in more stations with lower interconnection levels. Therefore, the topological properties of radial lines are trivial, and their complexity lies in their spatial structure ( 3 ).
Form Characteristics
The average line length and interstation spacing are complementary metrics in characterizing the form of metro networks. Figure 4 shows the form of metro networks in Chinese cities. The fitting curve delineates the overall trend, transitioning from low average line length and low interstation spacing to high average line length and high interstation spacing. This pattern suggests that metro networks typically originate in the city’s core area, characterized by a high density of stations, and subsequently expand outward as the city grows, resulting in increased average line length and interstation spacing. However, some cities may exhibit a relatively long average line length with low interstation spacing, or vice versa. Consequently, four form categories are identified: (1) local coverage (LC); (2) regional coverage (RC); (3) regional coverage with low interstation spacing (RCLS); and (4) local coverage with high interstation spacing (LCHS).
Cities classified under the LC category exhibit a typical primary form, where the metro network predominantly serves the densely populated core urban area. In contrast, metro networks in cities categorized as RC encompass the central urban area and address transportation demands in peripheral areas, such as suburban industrial parks, tourist resorts, airports, and satellite cities that have emerged because of urban expansion. Visually, this layout typically features a network radiating outward from a dense central hub. Metro networks in RC cities are generally at a stable and mature stage of development, catering to a significant portion of transportation needs within the city center and suburbs.
Cities classified as RCLS tend to cover a relatively large spatial scale, with the metro network extending to the radius of the central urban area. Therefore, the average line length is relatively long, but the interstation spacing is relatively small because most metro stations are designed to meet the needs of the central urban area, where multiple traffic attraction points and high demand for transportation services necessitate denser metro station placement to ensure adequate service coverage. Cities in the LCHS category often experience planning deficiencies. For instance, in Jinan, most metro stations are arranged in sparse scenic areas along the metro routes, resulting in large interstation spacing. However, the city has an elongated spatial layout, with metro lines extending more in the east–west direction but shorter in the north–south direction, leading to a relatively short average line length.
Structure Characteristics
The structural assessment of a metro network evaluates its transfer performance using two criteria: (1) directness; and (2) structural connectivity. Directness pertains to the ease of traveling from one station to another, and structural connectivity emphasizes the diversity of transfer options within the network. Figure 5 shows the structure of metro networks in Chinese cities, revealing a general trend where these networks tend to balance transfer diversity and convenience. However, many cities fall outside the established confidence interval, indicating varying preferences for transfer diversity and convenience. Therefore, metro networks are classified into three categories: (1) directness; (2) connectivity; and (3)integration.
Cities with higher development levels often feature integrated metro networks, such as those in Shanghai, Beijing, and Shenzhen. In contrast, cities with lower development levels adopt different strategies to balance transfer diversity and convenience. In cities with only two metro lines, the structural connectivity values are uniformly equal to one, indicating the absence of complex transfer stations. Therefore, the focus in these cities is on increasing the number of transfer stations rather than enhancing the transfer capacity of individual stations. For cities categorized under connectivity, their metro networks tend to perform better for transfer diversity, albeit potentially at the expense of transfer convenience for travelers. For instance, Kunming, a typical dual-center city, enhances the connection between its old and new districts via radial lines, while neglecting the transfer function between the lines. A fundamental network structure with optimal performance is believed to have a ring–radial configuration ( 3 ). Ring lines play a crucial role in strengthening the connection between independent lines and improving the transfer efficiency of the metro network. Passengers shuttle between city centers by taking radial lines, transferring via ring lines, and then taking another radial line to a specific region ( 22 ). Such challenges are also evident in cities such as Xi’an and Hefei, often because of the absence of ring lines in their metro systems ( 15 ).
Service Degree of Population and Metro Network Topology
To elucidate the interconnections among state, form, and structure, and to discern consistent patterns within metro networks, an indicator termed the service degree of population (SDP) was utilized to assess metro network performance ( 2 ). This indicator represents the level of service rendered by the metro network, derived from the city’s daily ridership and population data for 2022. The computation of the SDP is as follows:

where
Table 2 presents the SDP for each city, ordered from highest to lowest. The SDP ranking closely corresponds with the state levels, with cities in State 3 occupying the top positions, cities in State 2 predominantly in the middle, and cities in State 1 largely at the bottom. For form, cities at the top of the SDP ranking primarily exhibit RC, and those at the bottom predominantly display LC. Similarly, for structure, most cities at the top of the ranking are of the integrated type, and those at the bottom are mainly of the directness type. Consequently, the metro networks of different cities can be classified into three categories: (1) state 3-regional-integrated; (2) state 1-local-directness; and (3) others.
SDP and Metro Network Topology in Chinese Cities
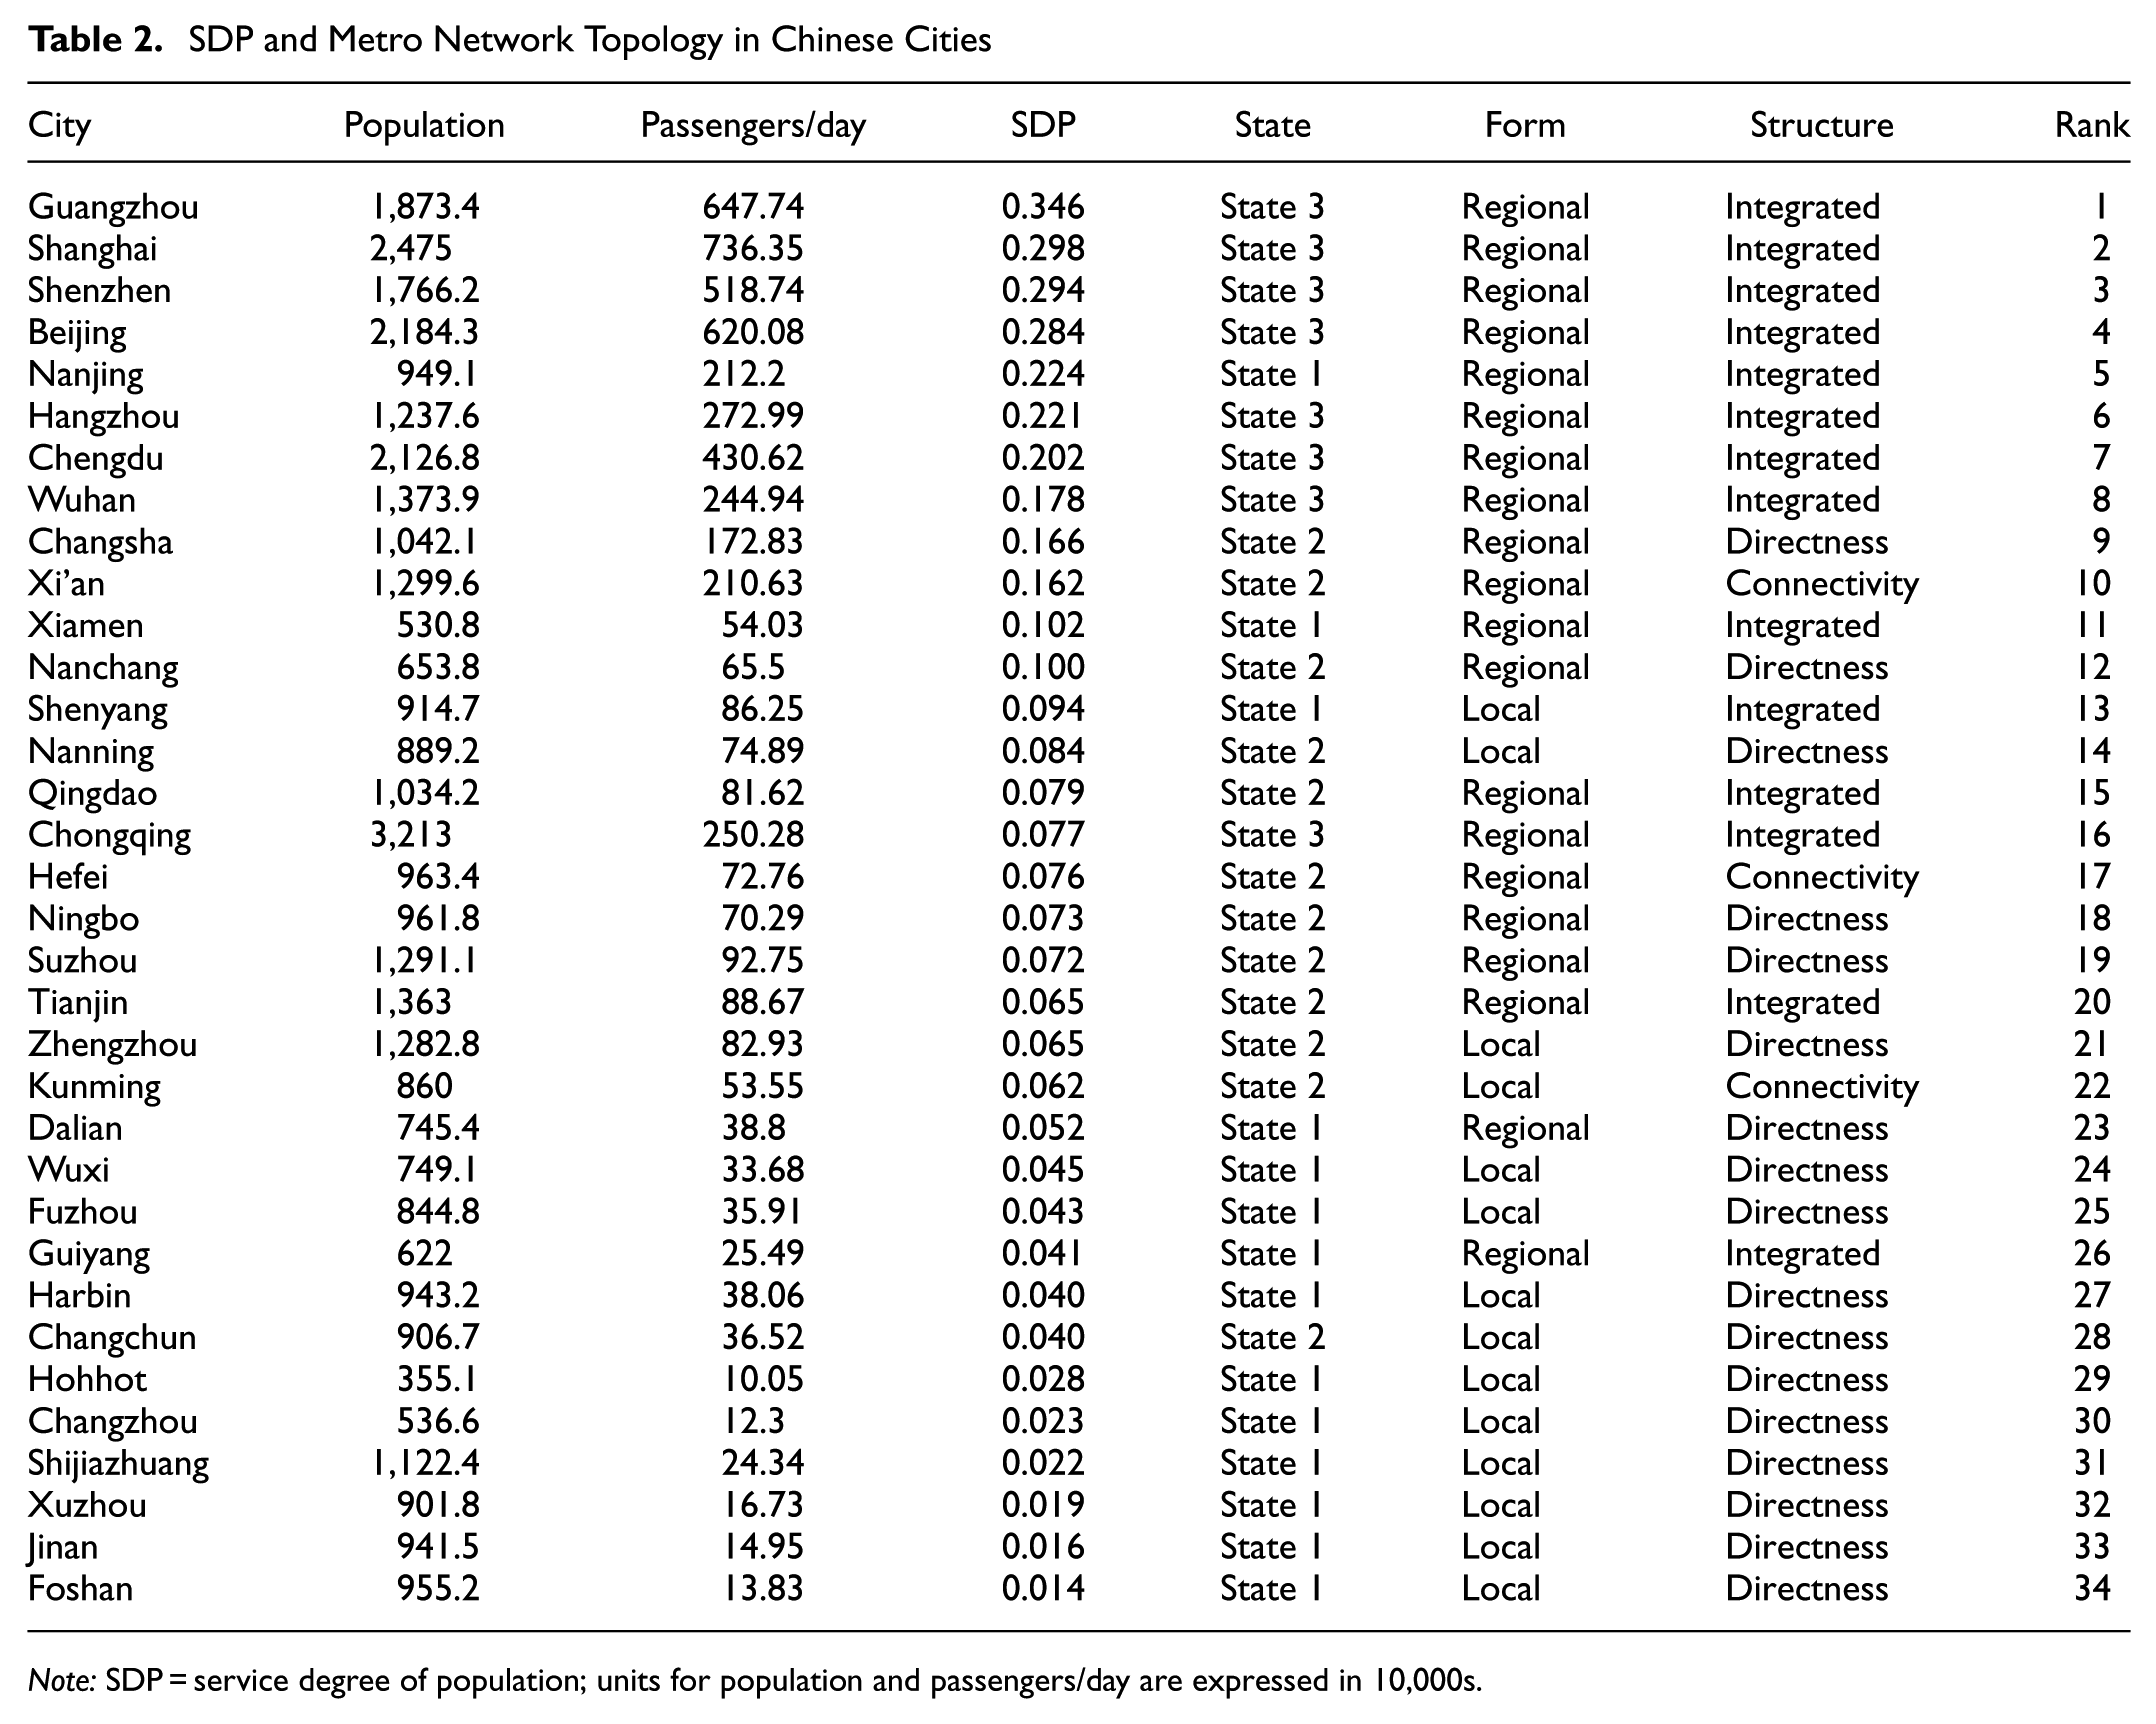
Note: SDP = service degree of population; units for population and passengers/day are expressed in 10,000s.
Figure 6 shows a comparative analysis of the performance of various metro network types for the SDP, illustrating the average rank value and the percentage distribution of cities within each network category. The data indicate that metro networks characterized by a state 3-regional-integrated topology achieve the lowest average rank value, demonstrating superior SDP performance, with approximately 23.5% of cities adopting this network topology. In contrast, metro networks with a state 1-local-directness topology exhibit the least favorable SDP performance, representing about 26.5% of the cities. In addition, metro networks classified as ‘others’ occupy a median rank value and constitute the largest proportion of cities, approximately 50%. However, this category encompasses a variety of mixed network topology patterns.
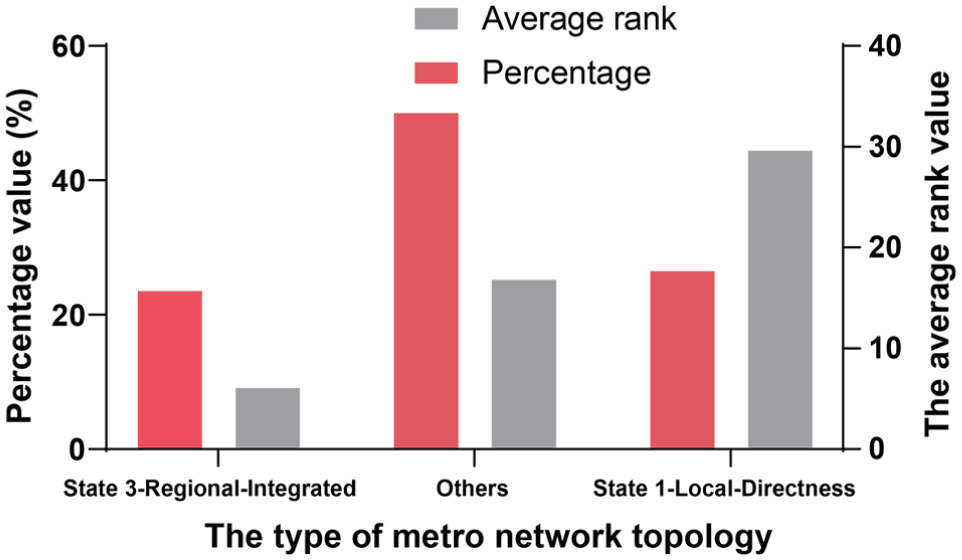
Average rank and proportion of cities with different types of metro networks.
To further explore the relationship between metro network topology and SDP performance, the SDP values associated with various metro network types were analyzed, considering their state, form, and structure as illustrated in Figure 7. The findings corroborate previous conclusions, indicating that metro networks with a state 3-regional-integrated topology demonstrate the highest SDP values. Intergroup comparisons reveal a significant difference in SDP between State 2 and State 3 groups, as well as between State 1 and State 3 groups, but not between State 1 and State 2 groups. For structure, only the integrated group exhibits significantly higher SDP values; however, the connectivity and directness groups do not show any significant performance advantage. In addition, a significant difference is observed between groups with RC and LC. These results suggest that the topology of metro systems is correlated with the SDP, leading to variations in metro network performance.
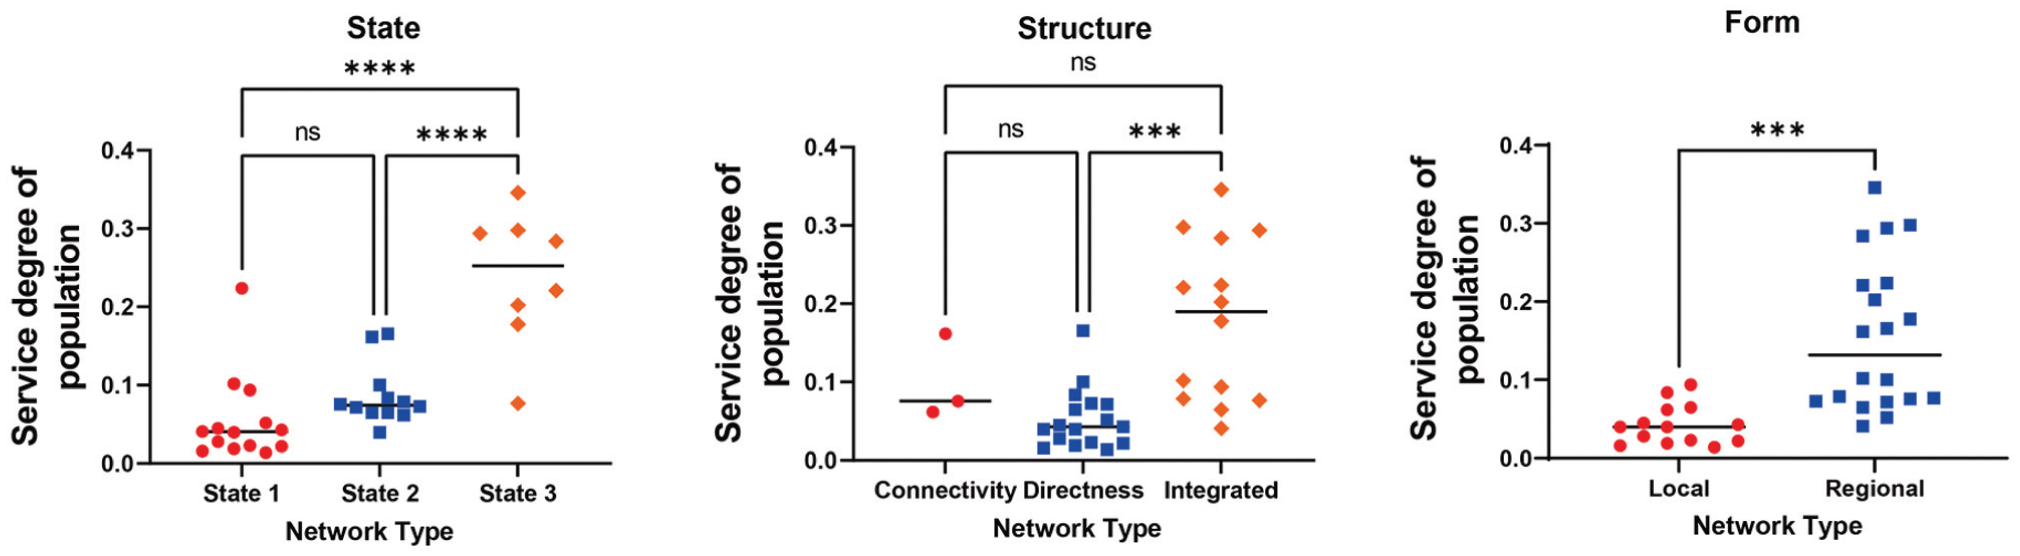
Comparative analysis of the service degree of population (SDP) across various network topologies.
Evolution of Network Topology with Metro Expansion
Examining the transformation of network topology as metro systems expand is of paramount importance. As the metro network grows, the number of metro lines increases, leading to the development of distinct network topologies across different cities ( 3 ), which in turn affects the performance of the SDP. This section provides a visual analysis of changes in various topological metrics as the number of metro lines increases, using fitted curves to depict the general patterns in this evolutionary process. To capture the nonlinear growth trajectories observed in the data, second-order polynomial and logarithmic regression were employed. The general form of the logarithmic function is expressed as,

where
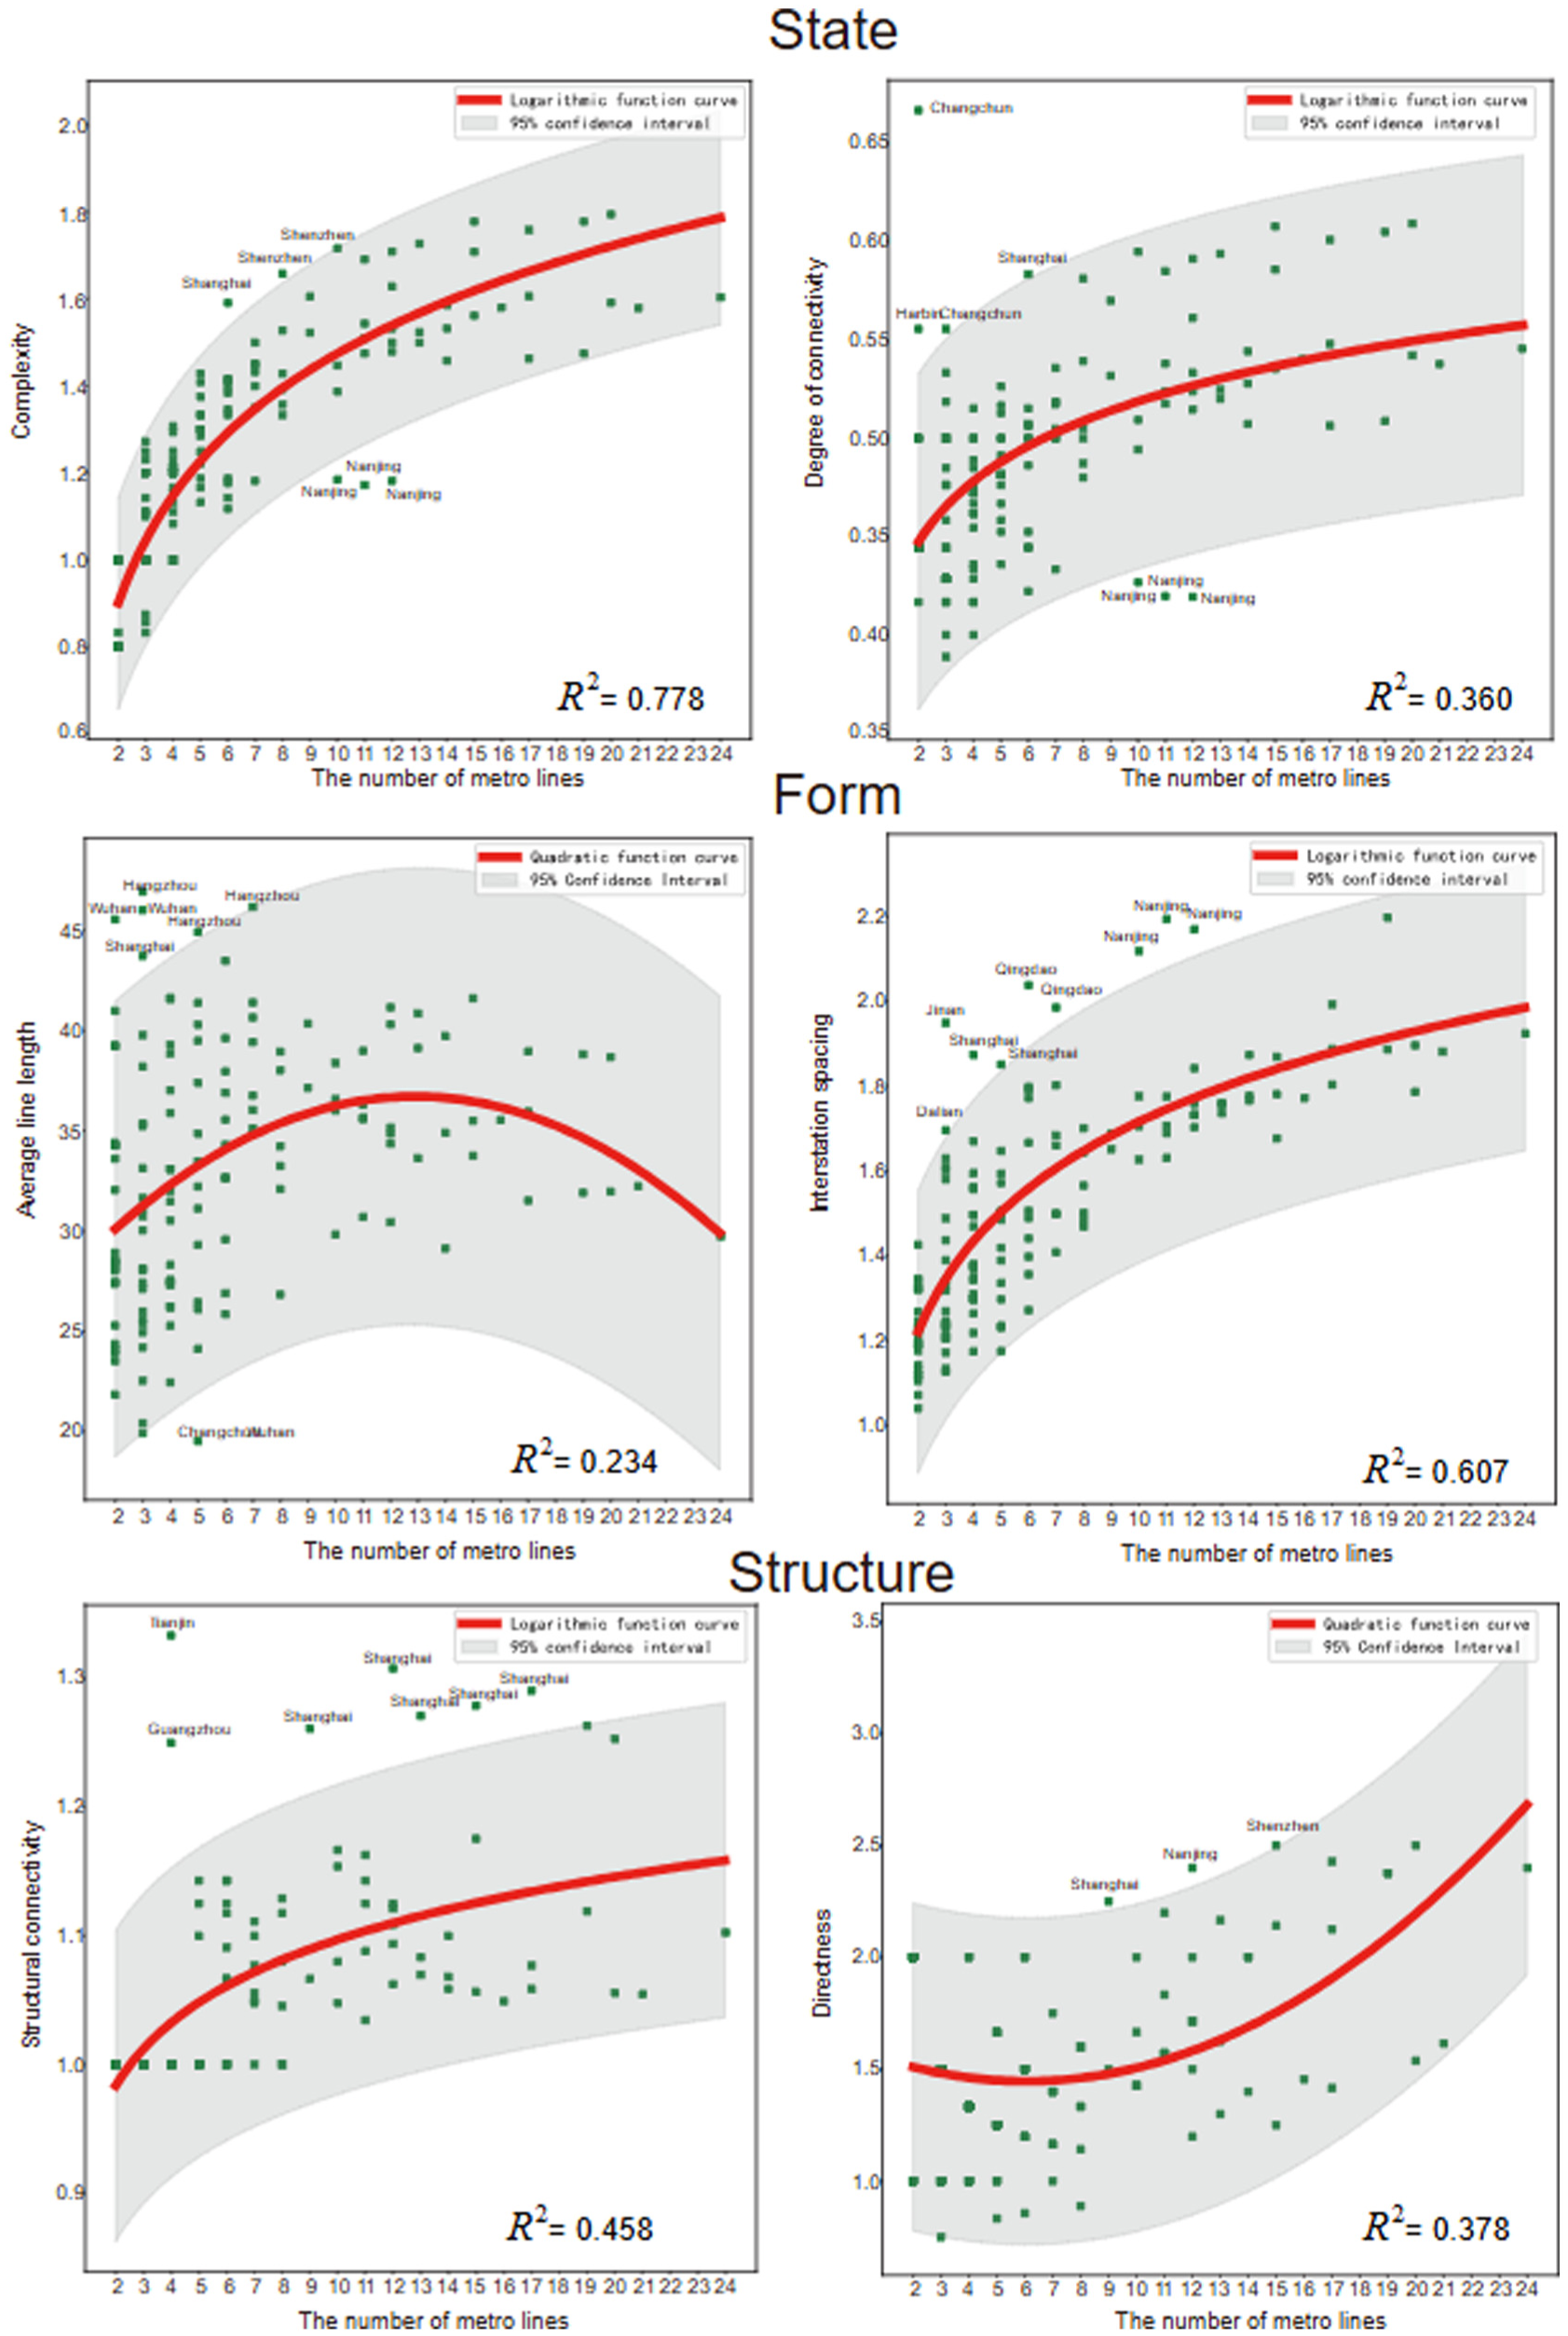
Evolution of network topology with metro expansion.
Figure 8 shows that each topological indicator follows a common evolutionary trajectory. With the addition of more metro lines, all topological indicators exhibit nonlinear growth, suggesting that metro network expansion may not occur at a uniform rate. Various factors, including investment policies, planning strategies, and socioeconomic characteristics, influence this evolutionary path.
For the state of the network, complexity and the degree of connectivity exhibit a logarithmic growth pattern as the number of metro lines increases. This indicates that in the later stages of metro network expansion, the ratio of edges to stations and the potential connections between stations tend to reach a saturation point. This observation aligns with the intuitive understanding that the most rapid growth occurs during the initial phase of network expansion. Of note, in a scenario with only one line and two vertices, the complexity value is 0.5. With three vertices and two connecting lines, the complexity increases to 0.67. As the number of vertices continues to grow, the complexity approaches one indefinitely. However, the findings reveal that the complexity value exceeds one when three metro lines are present, suggesting a circular structure within the metro network in most cities during the early stages of metro network development.
The development of the form of metro networks indicates that during the initial phase of expansion, the average line length and the spacing between stations exhibit a consistent pattern of increase. In contrast, in the subsequent phase, the average line length tends to decrease, and the interstation spacing follows a logarithmic growth pattern, eventually reaching saturation. This suggests a continuous decline in service density throughout the expansion of the metro network, regardless of changes in the network’s coverage. The coverage of the metro network continually adapts to shifts in urban development policies. The changing pattern in the average line length follows a three-stage progression, beginning with small-scale coverage in the early stage, expanding to larger-scale coverage later, and ultimately transitioning to subcenter coverage. This process can be attributed to the city’s expansion. Initially, the metro system primarily serves the city’s core areas, and the average line length remains relatively small during this phase. As the city continues to grow, so does the average line length. When the expansion reaches a certain threshold, local core areas emerge, prompting the densification of the metro network within the urban core. Therefore, the average line length tends to decrease once more. Similar to this study, Cats ( 7 ) observed that the Stockholm rail network underwent a two-stage evolution, shifting from peripheral attachment to preferential attachment, without an initial densification stage.
The evolution of metro network structure shows that structural connectivity and directness increase over time, albeit with different trends. Structural connectivity exhibits a logarithmic growth pattern, indicating that transfer diversity tends to saturate during the later stage of network expansion. In contrast, directness shows a continuously increasing growth pattern, implying that the design of metro lines aims to minimize passenger transfers through the transit network ( 16 ). For transfer diversity, the growth pattern indicates that the growth rate tends to slow down. Two reasons are: (1) stations with multiple transfer lines often have complex built environments, posing significant construction challenges, making it difficult to increase transfer lines; (2) over-enhancing transfer stations may reduce the resilience of the metro network ( 27 ). Studies on network resilience show that networks are robust to random declines in nodes and fragile to the targeted removal of the most well-connected nodes ( 28 ). Therefore, over-enhancing transfer stations will increase the fragility of the metro network.
Of note, the metro networks in certain cities deviate from typical growth patterns. Nanjing and Shanghai emerge as distinctive examples. Compared with other cities, Shanghai excels in all topological indicators during the expansion of its metro network. As shown in Figure 8, with an equivalent number of metro lines, Shanghai frequently exhibits superior performance in metro network topology. This observation underscores the notion that merely increasing the scale of a metro network does not inherently ensure optimal topological performance. A well-designed network topology necessitates comprehensive optimization of the interrelationships between lines and stations to enhance the desired functionalities. Expansion in scale may result in a disparity between the network’s performance and expectations. Furthermore, the development of infrastructure, such as metro systems in China, is directed by governmental authorities. This process requires coordinated efforts among administrative directives from various levels of government, discussions among local governing bodies, and a broader transformation in policy orientation, shifting from a competitive to a collaborative approach ( 29 ). Therefore, the government and relevant planning authorities should intervene during the metro network expansion process. Moreover, such an intervention is recommended to take place in the early stages of network expansion. The extensive subway networks under consideration gradually approach a long-term limit, where the addition of new stations over time constitutes an increasingly smaller percentage. Therefore, intervention during the later stages may not yield significant improvements in topology.
Effect of Ring Lines and Radial Lines on Metro Network Topology
Two fundamental structural components, the ring and radial lines, are essential building blocks for the development of extensive, comparable metro networks ( 11 ). These components have been demonstrated to significantly enhance network performance ( 14 , 22 ). Several cities have successfully integrated ring and radial lines into their metro network development strategies. In this section, the effects of ring and radial lines on the topological evolution of metro networks are examined, drawing insights from data collected in Beijing and Nanjing. The analysis aims to elucidate effective measures to promote metro network performance and achieve developmental objectives.
Effect of Ring Lines on Metro Network Topology
Ring lines play a pivotal role in establishing essential connections among subcenters, alleviating the burden on lines traversing the city center. Consequently, the absence of ring lines can markedly affect the topological performance of a metro network. The Beijing metro network, as shown in Figure 9, is composed of two ring lines (Lines 2 and 10). Line 2 was the second metro line constructed in Beijing, and Line 10 was the fifth. To evaluate the effect of ring lines on metro network topology, the growth patterns in state–form–structure indicators under three distinct scenarios were analyzed.
Actually observed metro network evolution (Scenario 1): This scenario considers the evolution of the metro network based on the actual configuration, encompassing all existing metro lines.
Hypothetical evolution without Line 2 (Scenario 2): In this scenario, an alternative evolution in which Line 2 was not constructed is explored.
Hypothetical evolution without Lines 2 and 10 (Scenario 3): This scenario envisions an evolution in which neither Line 2 nor Line 10 was constructed.
Figure 10 shows the growth patterns of six topological metrics for the Beijing metro network across three scenarios. Initially, the construction of ring lines enhances the network’s complexity and connectivity. As the number of ring lines increases, there is a corresponding improvement in the network’s topology, specifically for complexity and connectivity. However, the influence of ring lines diminishes as the number of metro lines increases, leading to reduced differences between the three scenarios. Therefore, the construction of ring lines is more advantageous for early-stage, small-scale networks and becomes less effective as the metro network expands into a larger-scale system. In addition, the presence of ring lines does not significantly affect the form of the metro network, whether for average line length or interstation spacing. Therefore, constructing ring lines effectively enhances the metro network’s state without altering its form. In addition, the construction of ring lines improves the structural connectivity of the metro network, strengthening its transfer diversity. This effect also gradually diminishes with the network’s expansion.
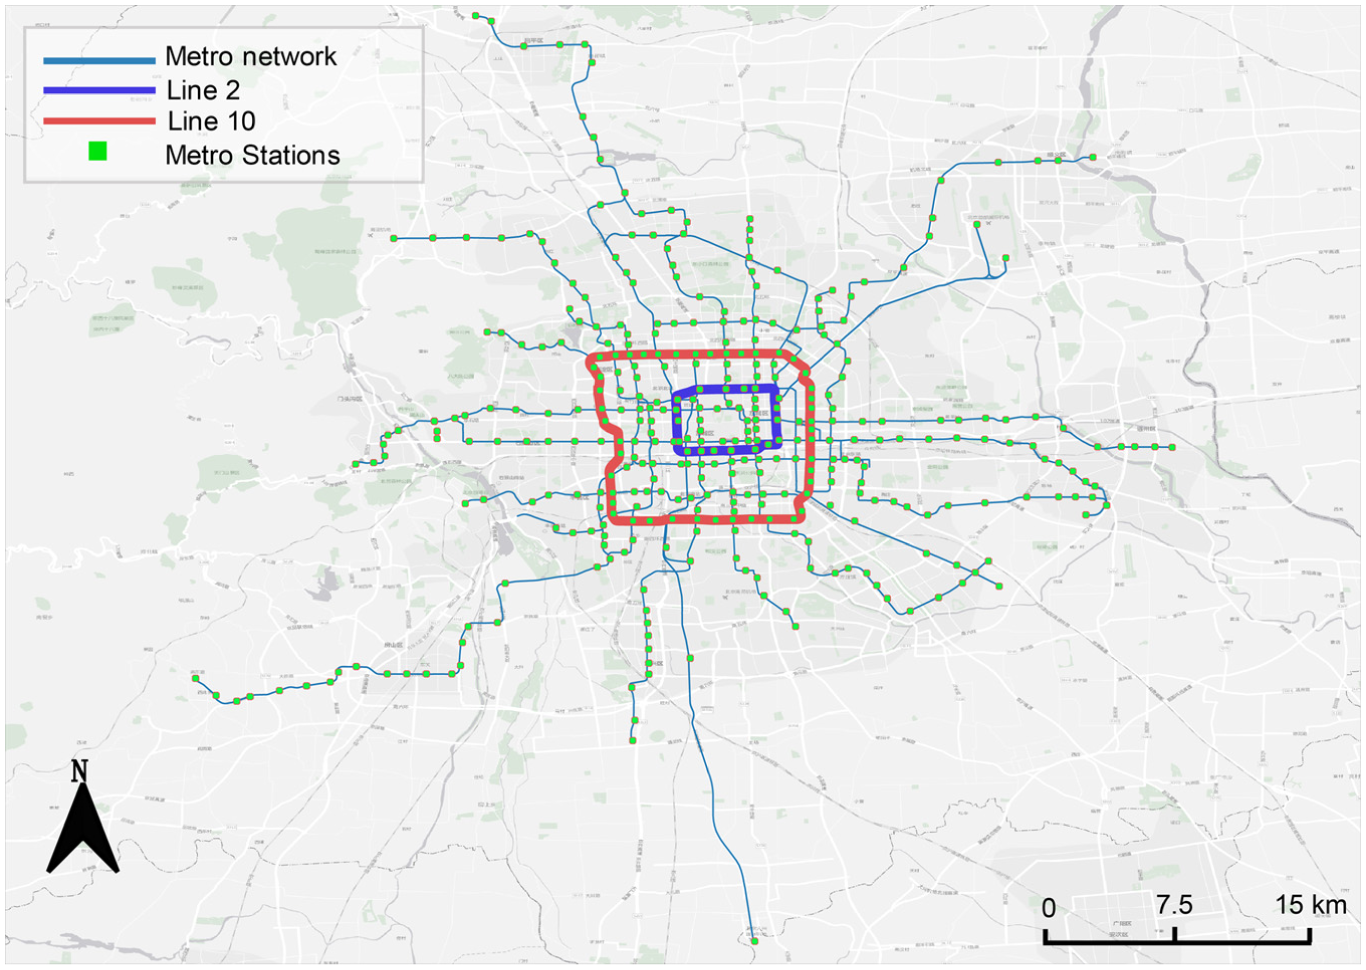
Beijing metro network.
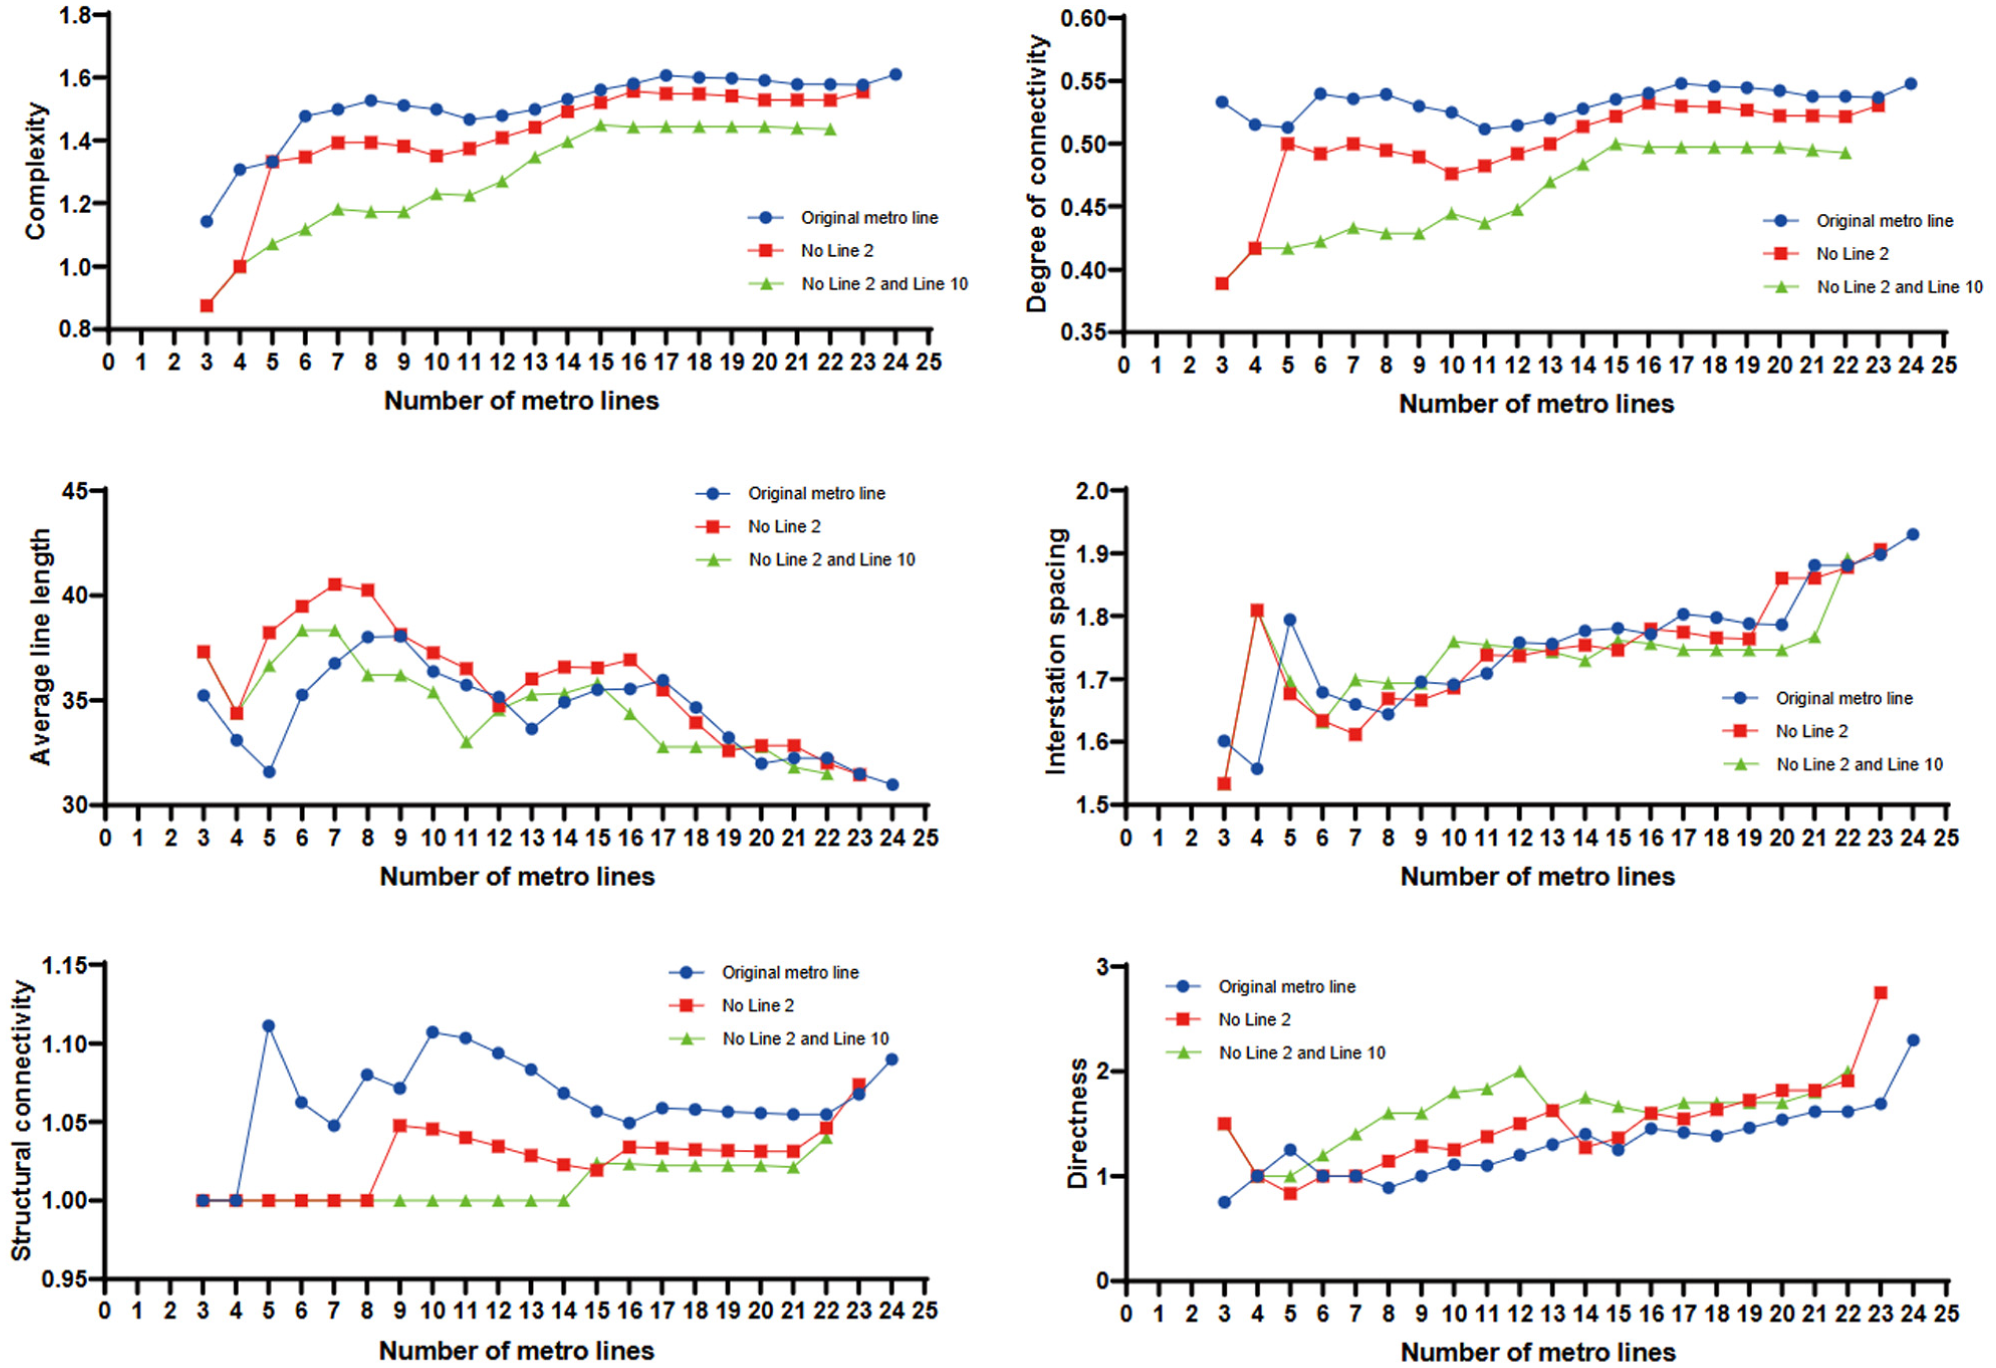
Topological evolution of the Beijing metro network under three scenarios.
Of interest, metro networks with fewer ring lines exhibit better directness. This finding is intuitive, suggesting that constructing ring lines increases the network’s complexity within a metro network of the same scale. This complexity manifests in providing more options for the shortest path when seeking the optimal route, as ring lines create additional transfer possibilities. However, the drawback is an increase in the number of transfers when selecting the shortest path. Although the path to a destination may become shorter, the number of transfers increases. This effect is slightly diminished with the expansion of the metro network.
Effect of Radial Lines on Metro Network Topology
Radial lines play a crucial role in the effective expansion of metro networks. Taking Nanjing as a case study, its inaugural metro line commenced operations in 2005. To date, 12 metro lines have been established (Figure 11). Compared with cities such as Chengdu and Chongqing, the growth of metro lines in Nanjing has been slower. Nevertheless, Nanjing’s socioeconomic development position ranks just below the first-tier cities, including Beijing, Shanghai, Guangzhou, and Shenzhen. Many cities have emulated the construction patterns of these first-tier cities by developing ring lines and extending the metro network outward from these rings. The construction of a ring line typically enhances the centralization of a city. However, because of Nanjing’s unique urban spatial structure and the barrier presented by the Yangtze River, creating a substantial central area and constructing a ring line is challenging. Therefore, Nanjing has pioneered a metro development strategy characterized by an interlocking and radiating network. This strategy aims to optimize network density and facilitate effective radial expansion while accommodating the city’s geographical and urban constraints.
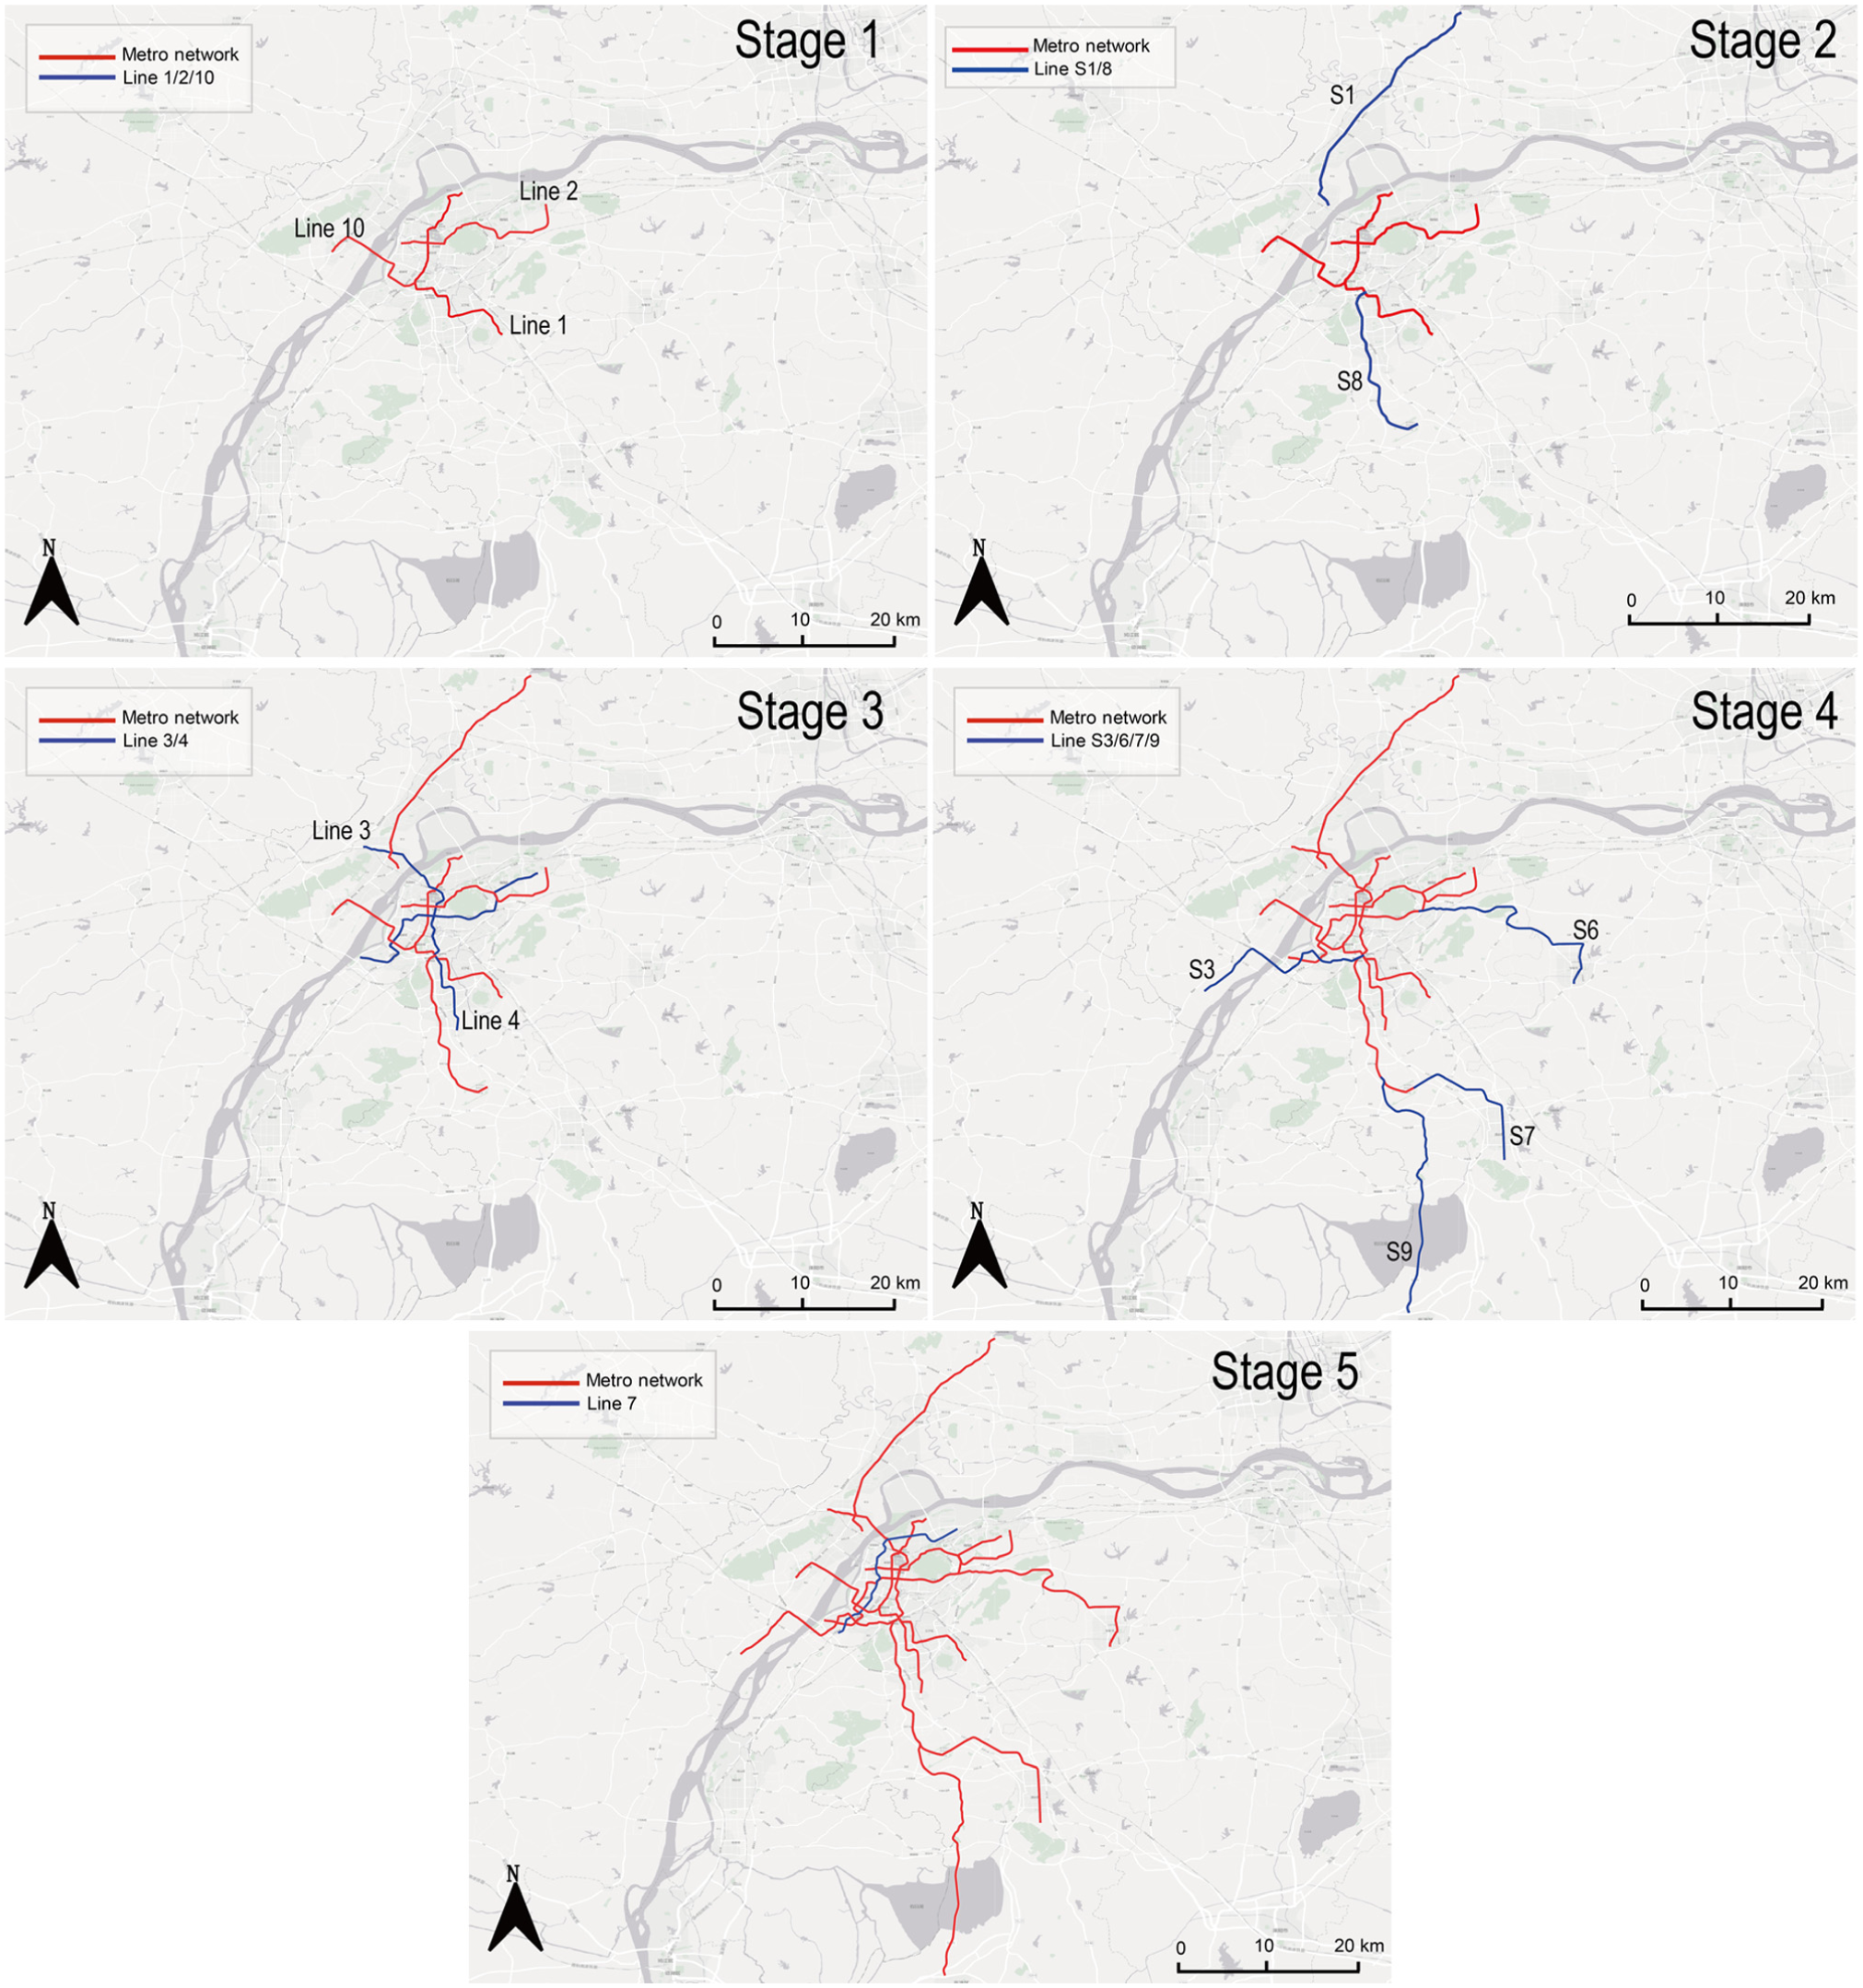
Evolution process of the Nanjing metro network.
It is important to note that the radial lines, designated as “S” within the Nanjing metro network, primarily connect the city center with suburban areas. The development of Nanjing’s metro system follows a discernible periodic pattern, with each phase marked by distinct development strategies and orientations, as shown in Figure 11. The initial stage involves the foundational construction of the urban center’s metro network. The second stage initiates a radial expansion based on this central network. In the third stage, a redensification process occurs around the central zone, followed by a fourth stage that witnesses another radial expansion based on the existing network. Finally, the fifth stage involves a subsequent phase of densification, characterized by interwoven evolution. Half of the metro lines in Nanjing are dedicated to densifying the city center’s network, and the other half of the radial lines serve to connect suburban areas. Therefore, Nanjing has been utilizing its metro network to reinforce suburban subcenters and enhance the development of suburban areas.
Figure 12 depicts the incremental growth of the metro network and the corresponding expansion strategies across various stages in Nanjing. Table 3 illustrates the evolution of six topological metrics of Nanjing’s metro network across five distinct stages. Initially, the data indicates that the construction of radial lines is an effective strategy for managing the metro network’s configuration, resulting in a straightforward network structure. Furthermore, although radial lines are employed to link the central urban area with suburban regions, the average line length does not exhibit a consistent increase. This is contingent on the city’s size and the spatial distribution of the connected areas. In addition, the implementation of radial lines enhances the network’s directness, improving transfer convenience by reducing the number of passenger transfers required during travel. This effect contrasts with that of ring lines, which increase transfers. Consequently, radial and ring lines can modify the metro network’s structure in divergent ways, either enhancing convenience or promoting diversity.
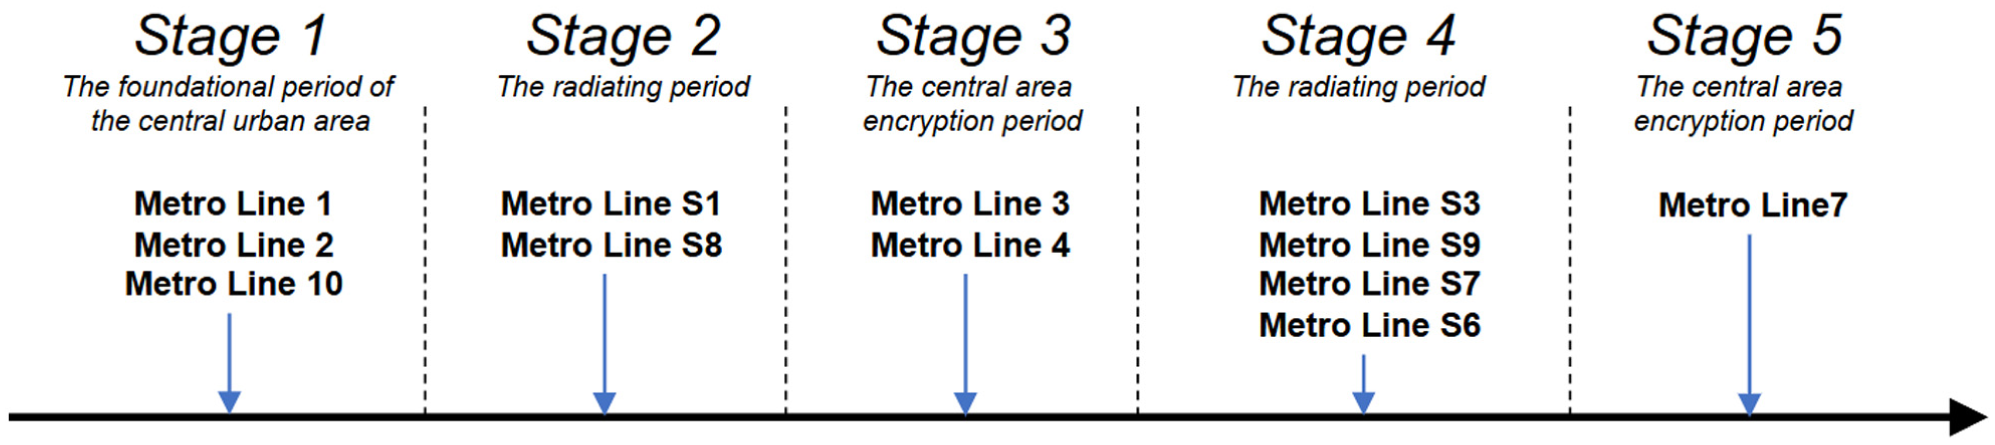
Development stages of the Nanjing metro network.
Topological Changes in the Nanjing Metro Network in Each Stage
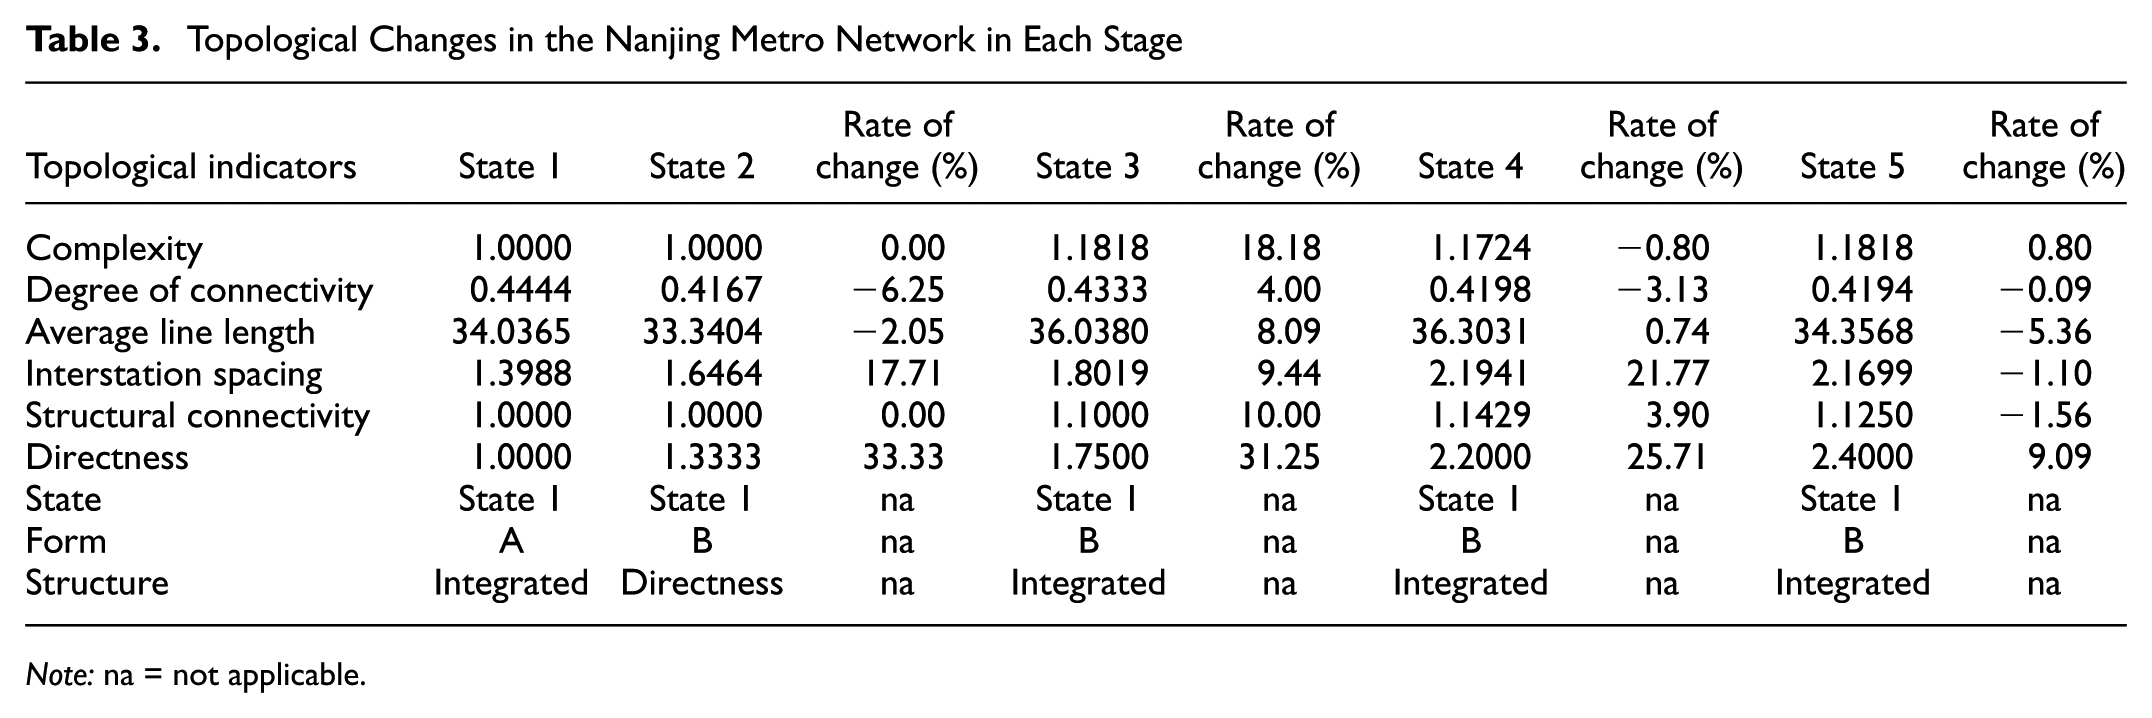
Note: na = not applicable.
Research-Informed Insights to Orient New Policy Directions
The comparative evidence across 34 cities suggests several ways in which network topology can orient policy thinking without prescribing specific projects. First, the strong alignment between higher SDP and a state 3–regional–integrated topology indicates that policy goals framed around expanding regional reach while sustaining transfer convenience may be more consequential than line-count targets alone. In practice, this reorients attention from “how many lines” to “what combinational topology of lines and transfer nodes” advances service performance, inviting objective setting for state–form–structure trajectories rather than scale per se.
Second, the observed saturation dynamics, logarithmic growth of complexity and structural connectivity as networks expand, imply diminishing marginal topological returns from late-stage additions of new transfer nodes. This points policy debates toward earlier windows of intervention, when small structural choices exert larger, path-dependent effects. In late stages, the emphasis can shift from adding transfer diversity toward safeguarding directness, reliability, and resilience within already-complex meshes (e.g., through operational design and targeted reinforcements) so that additional nodes do not inadvertently erode end-to-end trip simplicity.
Third, the differentiated roles of ring and radial elements offer a conceptual lever rather than a blueprint. In this study, ring lines are most informative as early-stage enhancers of state and transfer diversity, with effects that taper as networks mature. Radial lines, in contrast, are associated with gains in directness and with stitching core–periphery relations and subcenters into coherent travel corridors. Policy thinking can therefore be framed as balancing a portfolio of topology levers over time, recognizing that the same lever can pull the network toward different objectives (diversity versus directness) depending on maturity and spatial structure.
Fourth, the trade-off between transfer diversity and directness, evident in the structure plane, encourages an “if–then” diagnostic posture. If a city’s short-term objective is to reduce transfers on long, cross-city trips, then policies can prioritize configurations that lift directness without over-amplifying complex hubs. If the goal is to widen route choice and redistribute loads, then policies can evaluate designs that fortify transfer diversity, while explicitly tracking resilience implications of highly connected nodes. In both cases, the decision anchor is an indicator-guided trajectory rather than a fixed template.
Fifth, heterogeneity across cities (e.g., Shanghai’s consistently strong topological performance at comparable line counts and Nanjing’s interlocking radial strategy under geographic constraints) underscores that policy design benefits from city-specific constraint mapping before topology levers are pulled. The empirical patterns caution against copying iconic layouts and instead motivate ex ante appraisal using the state–form–structure dashboard. Where is the city on each axis today? Which axis is the binding constraint on SDP? Which lever shifts that axis with the fewest unintended consequences?
Finally, because the SDP is a population-normalized performance signal, it offers a practical monitoring spine for adaptive policy. Rather than promulgating one-off prescriptions, institutions can define locally relevant SDP targets, track how incremental topology changes move the system in the state–form–structure space, and iterate. This reframes metro development as a sequence of measurable moves on a known landscape, transparent to stakeholders, sensitive to context, and compatible with nonprescriptive governance.
Conclusions
Analyzing the evolutionary dynamics of urban metro network topology and developing a high-performance urban metro system present significant challenges. To address this issue, metro network data were collected from 34 Chinese cities, and the metro network topology across these cities was quantified using a 3D model that encompasses state, form, and structure. Using exploratory data analysis and case studies, the evolution of metro network topology with a relatively large sample of cities, yielding valuable insights, was investigated.
The findings demonstrate a significant correlation between the complexity and connectivity of metro networks, particularly in cities with higher levels of development. In addition, cities characterized by larger spatial scales and extended histories of metro development tend to favor an RC form, with a structural inclination toward an integrated type. Utilizing the SDP, a relationship was established between metro network performance and network topology, revealing that networks with a State 3, RC, and integrated topology exhibit superior performance. Intergroup comparisons indicate that the SDP of cities with a state 3-regional-integrated metro network is significantly higher than that of other types.
The objective was to elucidate the transformation process of network topology as metro networks expand. The complexity of metro network topology generally increases with the addition of metro lines, though this growth decelerates in later stages as further lines are added. The evolution of metro network topology follows a three-phased process, transitioning from local clustering to radiating, and subsequently reverting to local clustering. Structural evolution indicates an enhancement in transfer convenience relative to transfer diversity.
The role of ring and radial lines was examined as fundamental structural components of metro networks, using Beijing and Nanjing as case studies to illustrate their effect on the evolution of metro network topology. In scenarios where the objective is to maintain the existing metro system form, ring lines contribute by increasing the complexity and transfer diversity of the network, although this effect diminishes in the later stages. In contrast, in networks where radial lines constitute a significant proportion, as observed in Nanjing, radial lines effectively manage network complexity and substantially enhance transfer convenience.
In conclusion, this study has several limitations, which also suggest promising avenues for future research. First, the topology patterns of metro networks were categorized; the classification criteria employed were somewhat subjective; therefore, more rigorous and data-driven standards should be developed. Second, this study focused on the correlation between topological indicators and the SDP; however, the causal mechanisms underlying these relationships remain unexplored. Third, the data set was composed of 34 Chinese cities over 20 years, potentially limiting the generalizability of the findings. Future research should incorporate a broader range of cities from various countries and over extended time spans. In addition, because of data constraints, the metro networks analyzed in this study include only structural and length-related attributes, lacking capacity information, which may influence strategic interpretations of metro network development. Finally, substantial heterogeneity in geographical, social, and economic contexts across cities suggests the existence of differentiated topological development patterns, an aspect that was beyond the scope of this study and warrants further investigation.
Footnotes
Author Contributions
The authors confirm contribution to the paper as follows: study conception and design: Hao Chai, Tieshan Sun; data collection: Hao Chai, Yizeng Wang; analysis and interpretation of results: Hao Chai, Tieshan Sun, Yizeng Wang; draft manuscript preparation: Hao Chai, Tieshan Sun. All authors reviewed the results and approved the final version of the manuscript.
Declaration of Conflicting Interests
The authors declared no potential conflicts of interest with respect to the research, authorship, and/or publication of this article.
Funding
The authors disclosed receipt of the following financial support for the research, authorship, and/or publication of this article: This research was supported by the National Natural Science Foundation of China (Grant no. 42571204).
Data Accessibility Statement
The datasets generated during and/or analyzed during the current study are available from the corresponding author on request.