
Abstract
Commuters face their highest exposure to air pollution while traveling; however, behavioral responses to this risk remain poorly understood in urban transport research. This study investigates how air quality awareness, sociodemographic factors, and travel context influence mode choice. Household survey data were collected from 723 commuters in Kolkata, India, during winter, when ambient pollution levels are elevated. A latent class cluster analysis was conducted to uncover unobserved behavioral segments based on attitudes toward air quality information (AQI) and travel behavior. This yielded three distinct commuter profiles: (1) low awareness and passive (24%); (2) aware but inactive (57%); and (3) proactive AQI responders (19%). These segments were further characterized using sociodemographic and travel attributes to understand profile-specific tendencies. Then, a multinomial logit model was estimated to examine how latent class membership, along with factors such as income, trip purpose, distance, and reported health symptoms, influenced travel mode decisions. The results show that access to real time AQI information, particularly through mobile apps and public displays, was associated with reduced use of high-exposure modes, such as two-wheelers and auto-rickshaws. However, many commuters who reported health symptoms, such as eye irritation, continued using these modes, indicating limited flexibility or a lack of alternatives. The metro was preferred by lower-income individuals, while higher-income, AQI-aware commuters tended to choose private cars, probably viewing them as more protective. These findings highlight the need for integrated urban transport and environmental strategies that pair risk communication with equitable access to clean, safe, and protective travel options.
Keywords
Introduction
Air pollution, a pressing global challenge, poses serious risks to human health and the environment ( 1 ). Its escalation is largely driven by the rapid rise in motorization and industrialization, particularly in urban areas, where deteriorating air quality has been linked to adverse health outcomes ( 2 ), environmental degradation ( 3 ), climate change ( 4 ), and significant economic costs ( 5 ). The sources of urban air pollution are diverse, encompassing vehicular emissions, industrial activities, commercial operations, brick kilns, thermal power plants, resuspended road dust, and the open burning of municipal and agricultural waste ( 2 , 6 ). The World Health Organization reveals that air pollution levels surpass guideline limits in regions inhabited by 99% of the global population1, affecting vulnerable demographics such as students, pregnant women, the elderly, and infants more severely ( 7 , 8 ). Air pollution has been identified as the “largest single environmental health risk,” resulting in approximately 3.3 million premature deaths ( 9 , 10 ), with the majority concentrated in low- and middle-income countries ( 11 ). In 2019, India reportedly experienced 1.67 million deaths because of air pollution, accounting for 17.8% of total mortality and resulting in economic losses of USD 28.8 billion ( 12 , 13 ).
Given the alarming and persistent levels of air pollution in Indian cities, particularly in urban centers such as Delhi and Kolkata, daily travel has become a significant vector of pollutant exposure. Cities such as Delhi and Kolkata consistently report PM2.5 stands for Particulate Matter 2.5 micrometers (or less) in diameter concentrations that far exceed national and international safety thresholds, particularly during the winter months and peak commuting hours ( 1 , 4 , 6 , 8 ). This spatial and temporal variation in air pollution has important implications for urban mobility. As shown in Figure 1, PM2.5 levels tend to peak during morning and evening commuting hours, with weekday concentrations higher than weekends, suggesting a strong link between commuter activity and pollutant exposure.
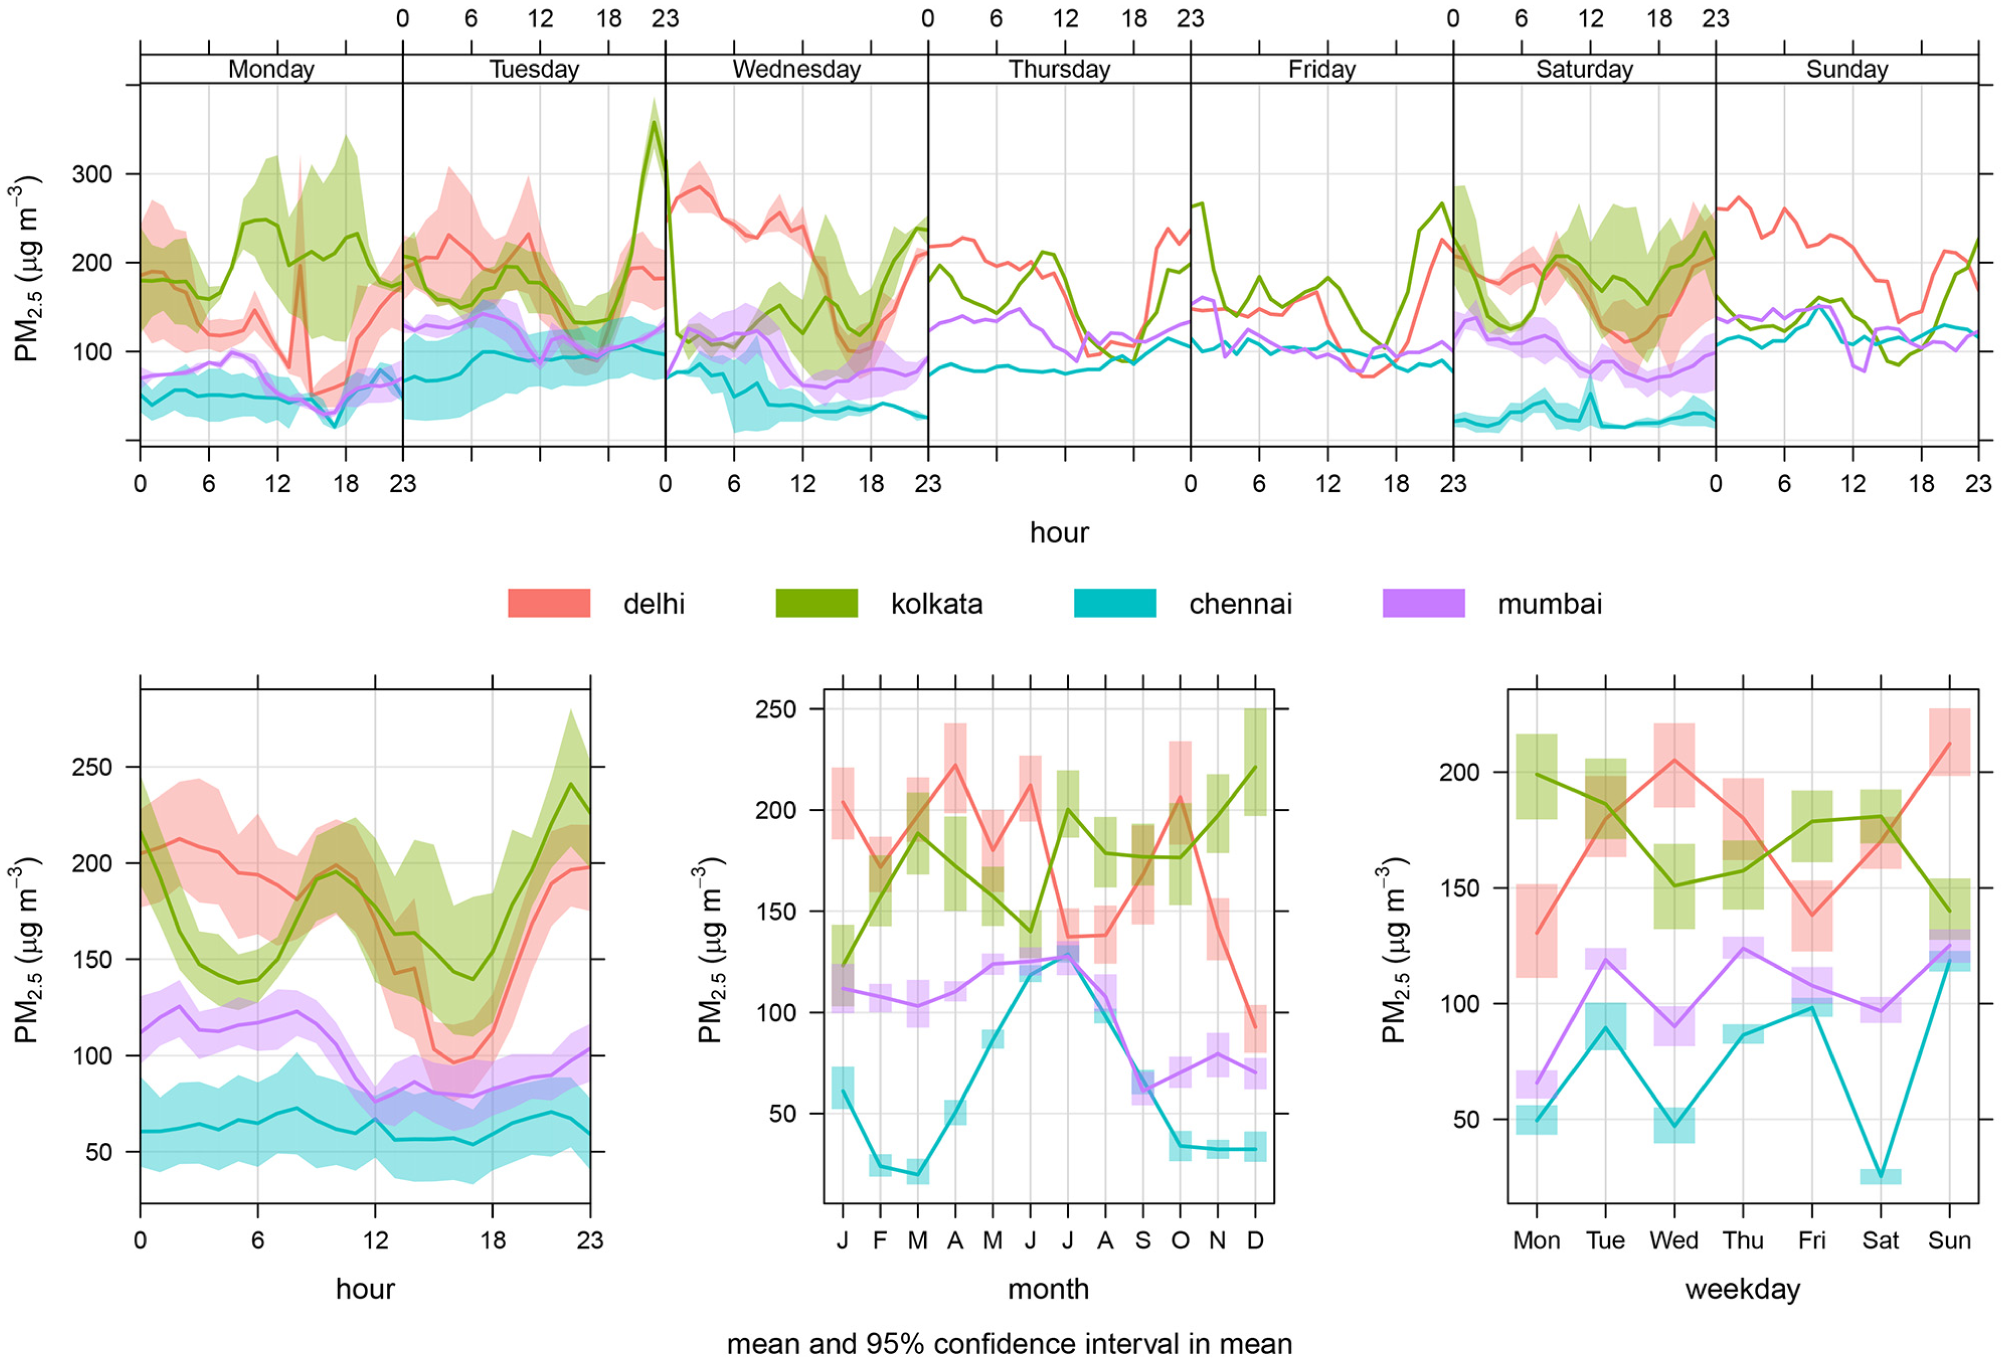
PM2.5 trends in four major cities in India (January 2024–December 2024).
Relevant Background
Commuting has emerged as a disproportionately high-exposure period for urban residents. Although it accounts for only 8% of a person’s daily time budget, it contributes nearly 33% of their total environmental exposure ( 14 , 15 ). Exposure levels are a function of pollution concentrations and are significantly influenced by travel mode, duration, time of day, breathing rate, and proximity to traffic sources ( 16 , 17 ). An activity-based perspective reveals that the highest exposure occurs during commuting, followed by time spent in workplaces and commercial spaces; however, exposure is lowest during indoor residential activities ( 18 ). These exposure dynamics are particularly concerning for users of nonmotorized and open modes of travel, such as walking, cycling, or two-wheelers, who face direct and prolonged contact with polluted environments during peak hours ( 19 ). Despite growing awareness of these risks, most travel behavior models continue to treat travelers as a homogeneous group, without accounting for individual differences in awareness, perception, and behavioral response to poor air quality ( 20 , 21 ). Recent studies suggest that when travelers are informed about real time pollution levels, they tend to adjust their mobility choices by reducing time spent outdoors ( 22 ), postponing departures ( 23 ), avoiding trips ( 24 ), or shifting from cycling to indoor activities ( 25 ). Some even switch to remote working or avoid offline shopping in response to high air quality information (AQI) alerts ( 26 , 27 ). These behavioral adaptations tend to be more immediate and responsive than long-term abatement strategies ( 28 ).
Furthermore, simulation-based studies demonstrate that when travelers internalize the negative externalities of transportation, such as congestion and emissions, into their utility functions, both individual and system-level welfare can improve ( 29 , 30 ). Because externalities such as congestion and air pollution are positively correlated, travelers often react jointly to both, based on their preferences and available information ( 31 ). However, a key barrier remains: the lack of accessible, actionable air quality exposure information to help individuals make informed decisions about their daily travel. As shown in the literature ( 32 ), when this information is presented in a user-friendly format, commuters are more likely to adapt their behavior, highlighting the need for personalized, exposure-aware travel planning tools ( 33 ).
Studies listed in Table 1 highlight that travelers adjust their behavior in several ways when air quality is poor. Earlier work notes declines in cycling after pollution alerts in Sydney (25), changes in subway use under varying pollution and weather conditions in Beijing ( 22 ), and travel choices shaped by comfort and safety in high-altitude cities such as Lhasa and Yushu ( 34 ). Exposure-based studies, including those from Belgium ( 15 ), describe inhaled dosage patterns but do not capture behavioral change. Research from Beijing and Taiyuan links pollution conditions with mode choice, showing shifts between active, public, and motorized options when air quality worsens ( 35 , 36 ). Hybrid choice studies from Iran and Thailand examine perceived risk and crisis situations ( 37 , 38 ). Other papers focus on environmental attitudes in Italy ( 39 ), weather-driven travel segments in North America ( 40 ), and environmental concern in the UK ( 41 ). In combination, these studies provide evidence on avoidance behavior, mode shifting, crisis responses, and attitude-driven choices. However, they do not capture pollution-related behavior as a multistage process or identify traveler groups based on air quality awareness, information checking, symptoms, or protective actions. None of the earlier works connect these behavioral dimensions with revealed mode choice in a high-pollution exposure setting. This study addresses this gap by combining latent class clustering with a mode choice model to explain how awareness, checking behavior, symptoms, and protective responses shape travel decisions in Kolkata, India.
Previous Literature on Air Pollution, Travel Behavior, and Mode Behavior
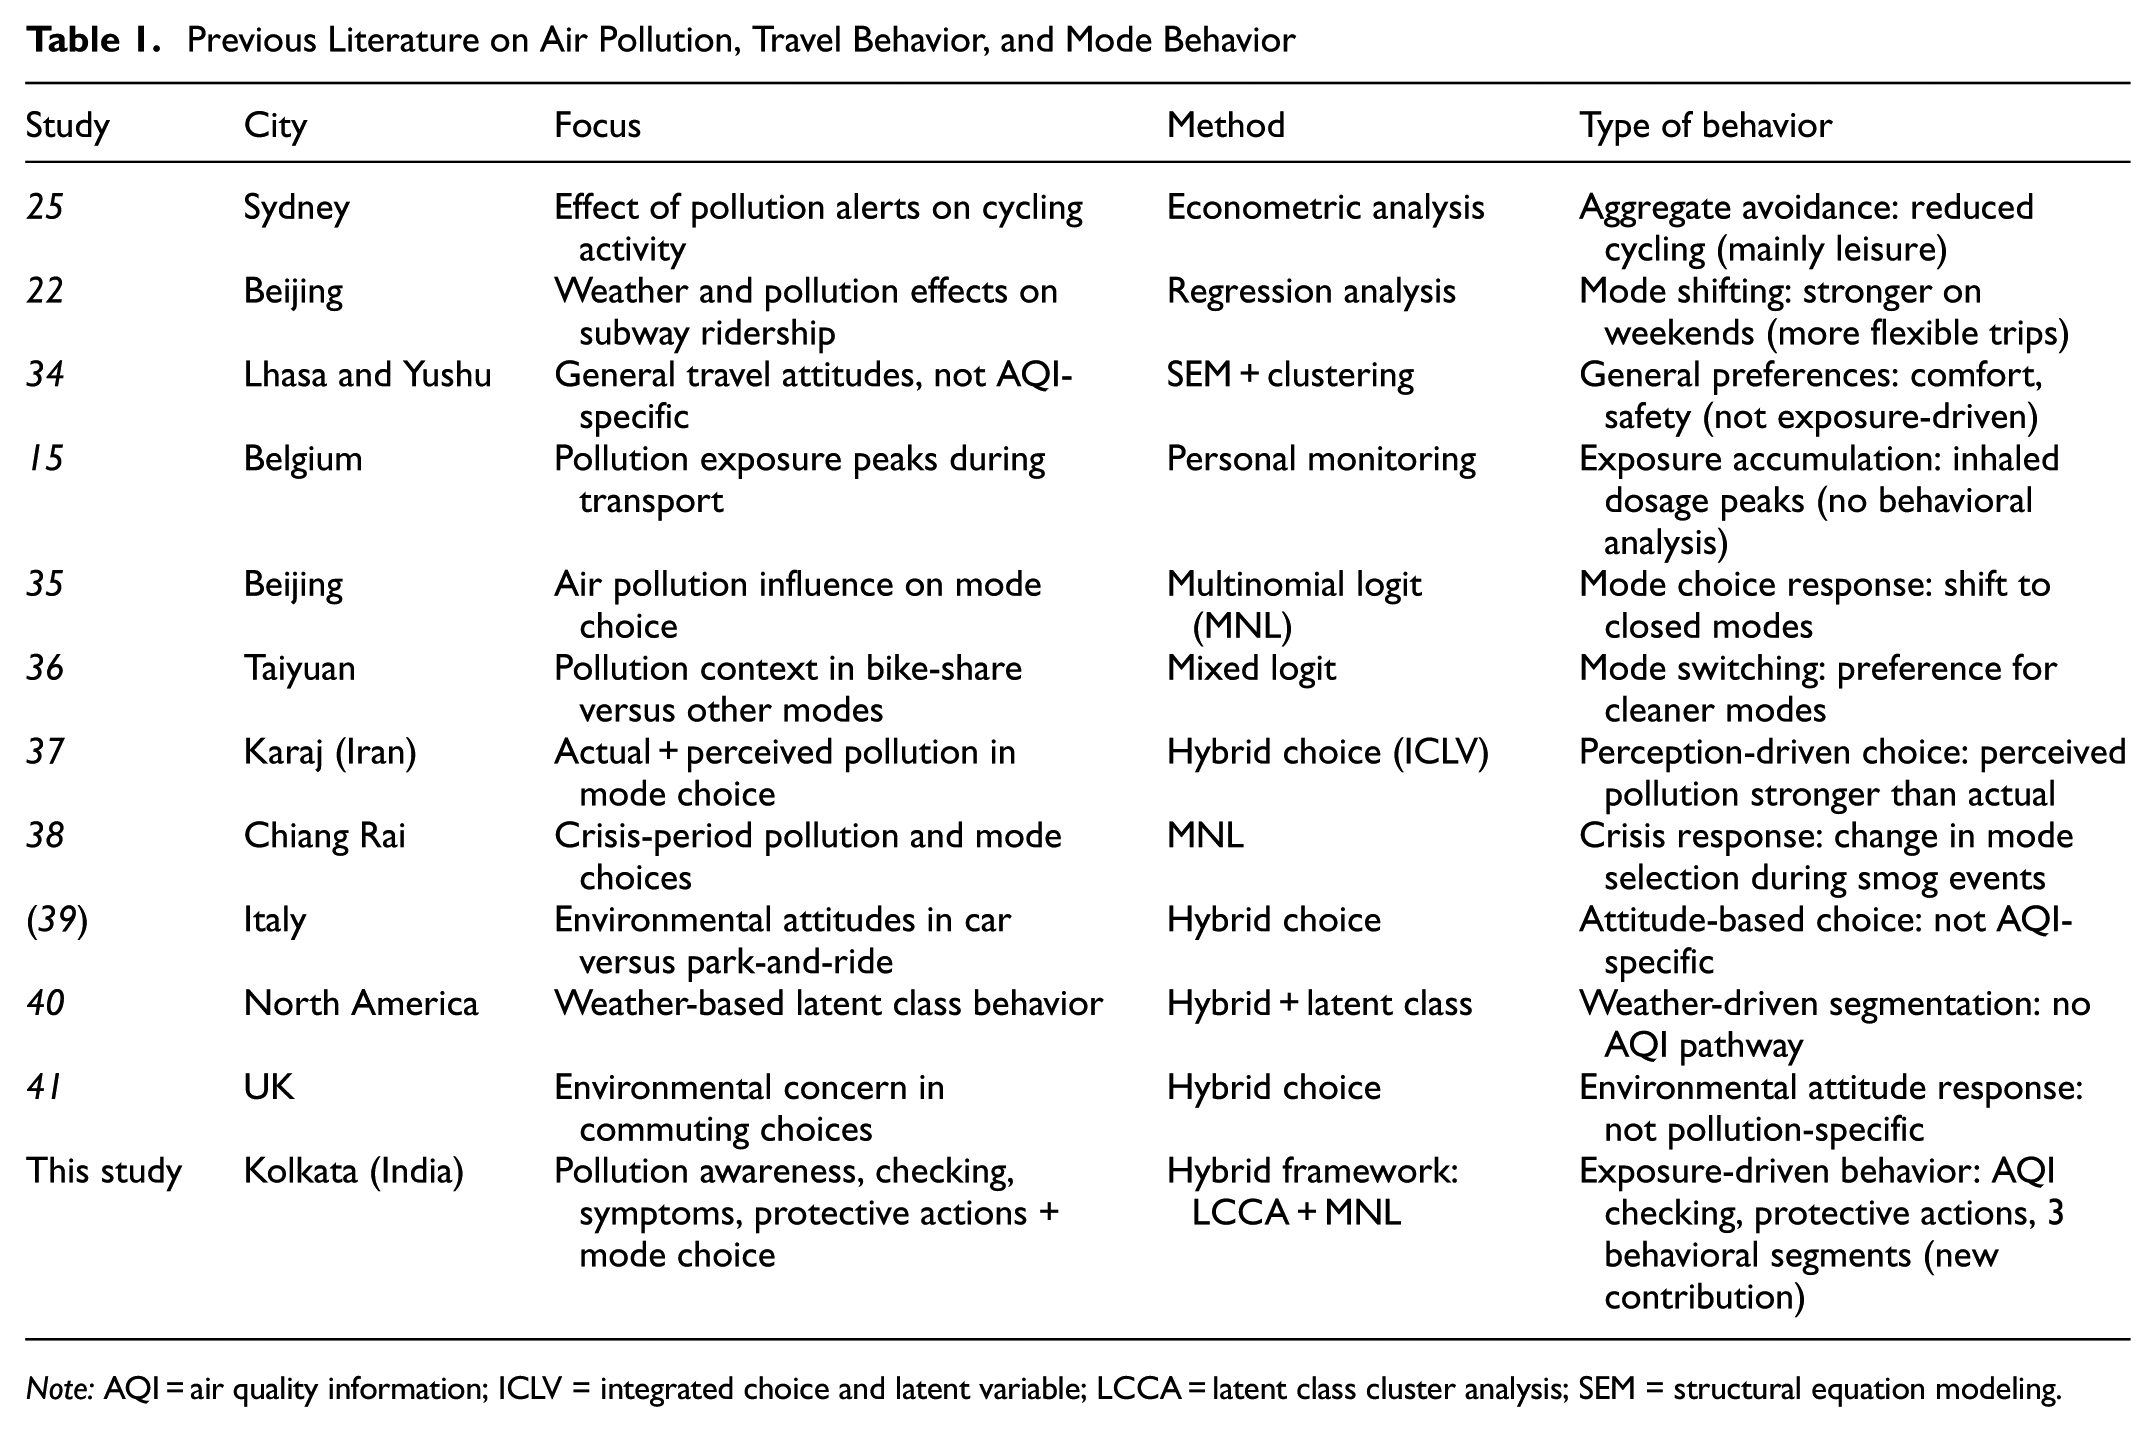
Note: AQI = air quality information; ICLV = integrated choice and latent variable; LCCA = latent class cluster analysis; SEM = structural equation modeling.
Research Gap
The literature on air pollution and travel behavior has expanded; however, several important dimensions remain insufficiently addressed. First, most studies treat travelers as a homogeneous group and do not capture differences in how individuals perceive and respond to AQI. This limits our understanding of protective actions, such as mode switching, route changes, rescheduling, and the use of real time information tools. Second, limited work segments travelers based on their environmental or pollution responsiveness and links these profiles to mode choice. Therefore, conventional travel demand models overlook behavioral heterogeneity that is important in polluted urban contexts. Third, although discrete choice models quantify sensitivity to travel attributes, they are not designed to capture unobserved attitudinal factors, such as AQI awareness, risk understanding, and technology use. Integrating these latent behavioral constructs remains a methodological gap. Finally, much of the empirical evidence comes from cities in the Global North. In the Global South, especially in Indian megacities where air quality frequently exceeds hazardous thresholds, there is a need for behaviorally rich models that reflect daily exposure conditions and traveler adaptation.
This study addresses these gaps by linking air pollution exposure and travel behavior using an integrated latent class cluster analysis (LCCA) and multinomial logit (MNL) model. By combining attitudinal segmentation with revealed mode choice, this study captures behavioral heterogeneity often overlooked in exposure studies and provides a more detailed view of how commuters internalize and act on AQI.
First, this study classifies urban travelers into latent segments based on their awareness of air quality and their protective responses. Second, it estimates how these segments differ in their mode choice decisions using a discrete choice framework. Third, it examines the sociodemographic and perceptual factors, such as age, occupation, travel distance, and sensitivity to pollution, that distinguish AQI-responsive travelers-from others (AQI-responsive refers to individuals who are aware of and understand air quality information). Finally, this study derives policy insights that inform targeted mobility interventions and exposure-aware routing strategies.
Therefore, this study contributes a hybrid modeling approach that links latent behavioral profiles, derived from Likert scale indicators of awareness and protective actions, to revealed mode choice. This connection between behavioral segmentation and actual travel decisions offers new empirical evidence on commuter responses to air quality in a highly polluted Indian city.
Methodology
Conceptual Model
The conceptual foundation of this study draws on established behavioral theories that explain how individuals respond to environmental risks and make travel-related decisions. Central to the framework is protection motivation theory (PMT) ( 42 ), which suggests that individuals appraise environmental threats, such as poor air quality, and adopt coping strategies to mitigate associated risks. In urban mobility, these coping responses may include altering travel mode, changing departure time, or modifying route choice. Complementing this, elements of the theory of planned behavior (TPB) ( 43 ) inform the attitudinal indicators used in latent class formation. Factors such as preferences for cleaner travel alternatives, openness to flexibility in trip planning, and the use of real time information systems reflect the psychological constructs of attitude, perceived behavioral control, and intention. These variables captured via Likert scale responses serve as key inputs for identifying behaviorally distinct traveler profiles. To model observed travel decisions, these behavioral constructs are embedded within a random utility theory framework ( 44 ). This allows for the class-specific estimation of mode choice behavior, linking unobserved psychological heterogeneity to revealed travel decisions under varying pollution conditions.
As shown in Figure 2, the framework consists of a two-part structure: (1) a structural model; and (2) a measurement model. The structural model identifies latent traveler profiles that influence utility in the mode choice model. Covariates are categorized as either active or inactive. Active covariates, such as sociodemographic characteristics, AQI perceptions, and health-related concerns, affect class membership probabilities. In contrast, inactive variables, including vehicle ownership, trip purpose, travel frequency, distance, and current mode, are not involved in class formation but are included in the utility specification for the discrete choice model. Although age, monthly income, education, trip distance, and trip frequency are ordered, they were entered into the models as sets of categorical dummy variables rather than as single ordinal scores. This avoids imposing a linear and monotone effect across unequally spaced bands and follows standard practice in discrete choice and latent class modeling when sociodemographic and trip attributes are defined in policy-relevant categories rather than on a continuous scale ( 45 , 46 ). The measurement model links observed attitudinal indicators to the latent profiles. These include awareness of air pollution, attitudes toward public and private transport, preference for route flexibility, and willingness to adopt technology-based travel information. These indicators are used in the LCCA to uncover unobserved segments of travelers with shared behavioral traits. The subsequent discrete choice model incorporates these latent profiles into the utility framework, enabling class-specific estimation of mode choice behavior. Together, this integrated approach captures perceptual diversity and behavioral variation in a coherent structure, offering a rigorous means to examine heterogeneity in AQI-responsive urban mobility patterns.
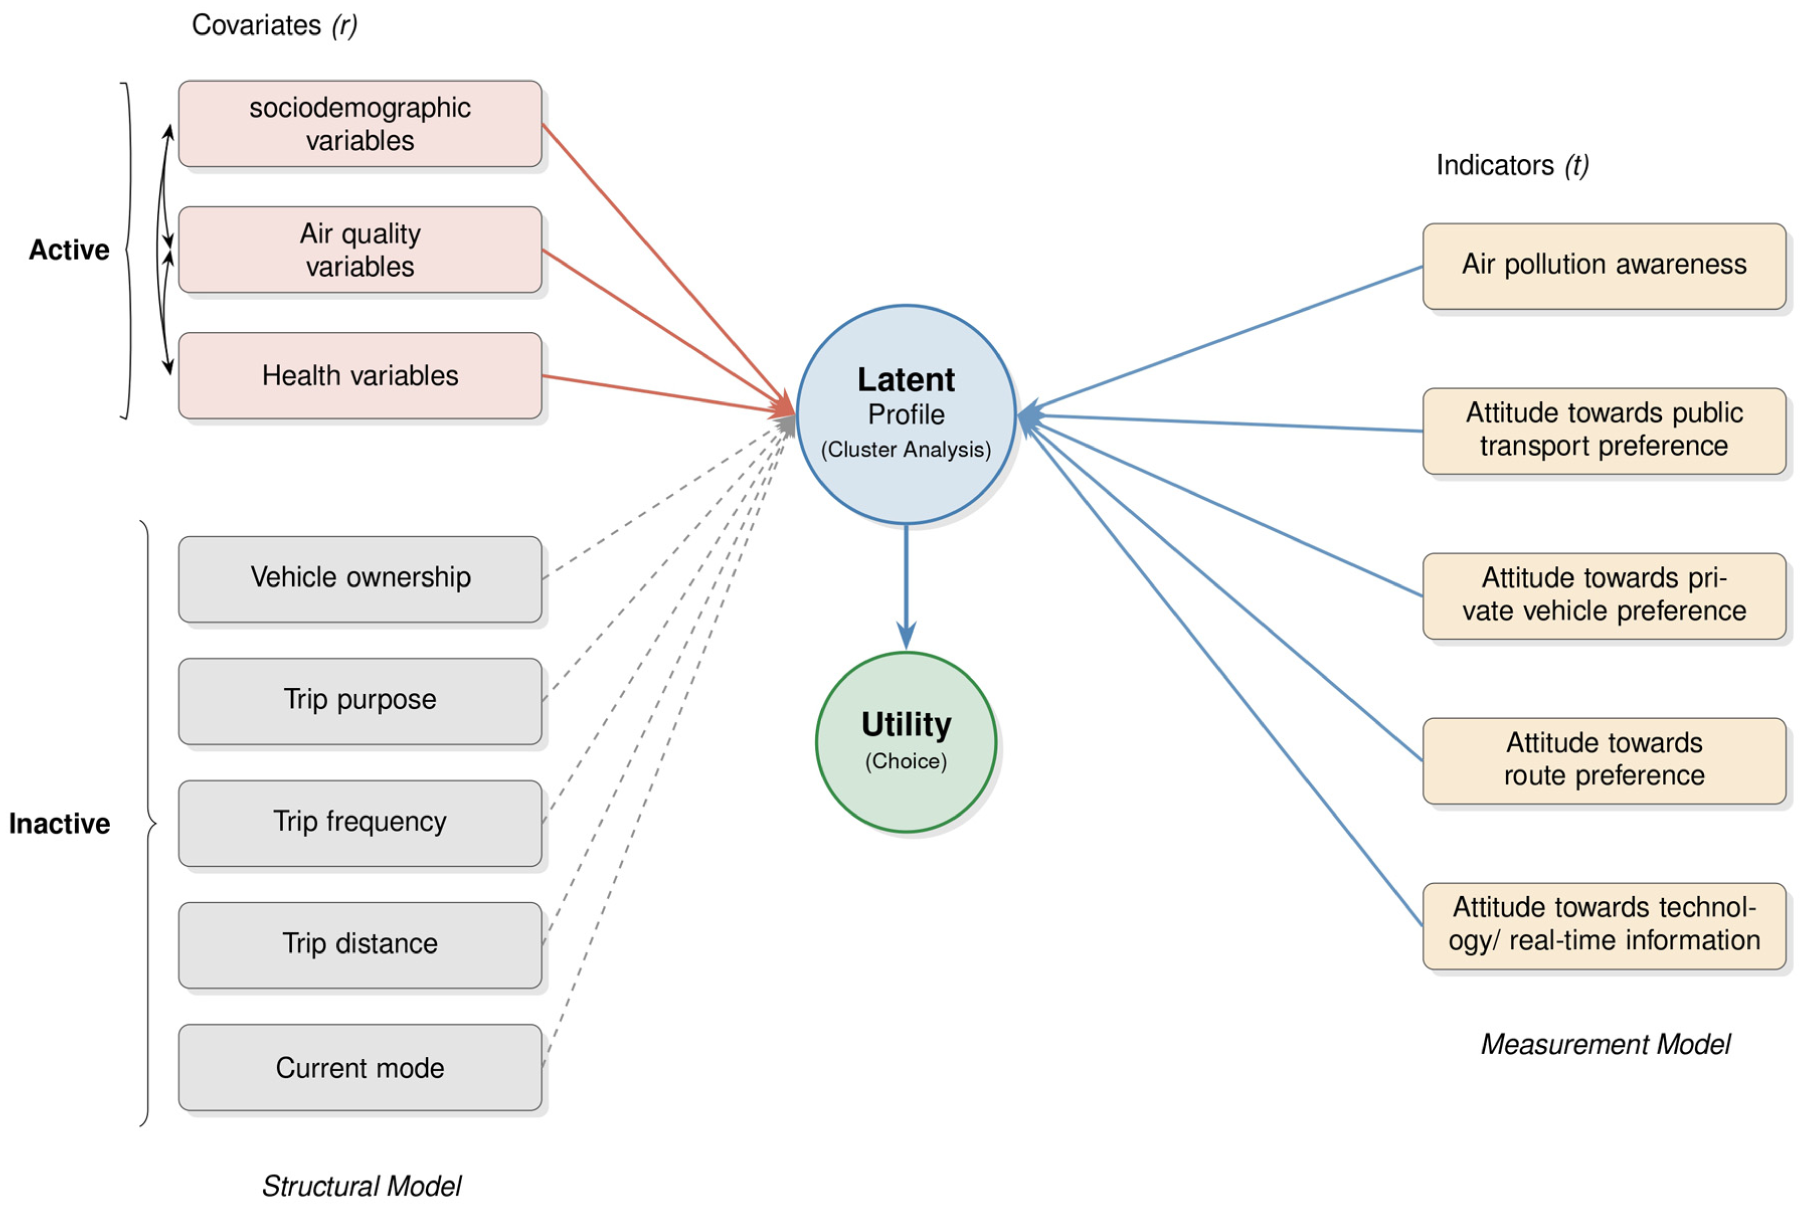
Conceptual framework integrating latent class cluster analysis (LCCA) with a discrete choice model.
Study Area and Data Collection
This study was conducted in Kolkata, India, in January 2025, a period characterized by elevated ambient air pollution. The winter was an ideal window to investigate travel behavior under high-exposure conditions ( 32 ). A cross-sectional, interviewer-administered household survey was used to collect data on individual travel choices, air quality awareness, perception and attitude toward air quality, travel behavior, and protective responses.
To enhance response efficiency and ensure data quality, a custom-built digital survey platform was developed and deployed for this study. The interface was designed as a single-page form to minimize respondent fatigue and streamline navigation. Survey responses were recorded in a structured .json format, enabling seamless integration with a real time D3.js-based dashboard for tracking descriptive statistics and maintaining sample balance throughout the data collection phase. A simple random household sampling approach was adopted to capture individual-level travel and air quality response behaviors. This strategy was chosen to enable seasonal comparisons across different exposure windows (e.g., winter and summer) in future data collection rounds. However, this study focuses on the winter 2025 data set. Therefore, this study is treated as a cross-sectional survey rather than a panel.
A total of 746 responses were collected. After excluding incomplete entries, inconsistent responses, and statistical outliers, 723 valid observations were retained for analysis, resulting in an effective response rate of 96.9%. To ensure the adequacy of the sample, the standard sample size estimation formula was employed ( 47 ), which is given in Equation 1.

where
Sample Characteristics and Descriptive Analysis
The final sample contained 723 respondents, with a near-equal gender split, with 49.1% identified as female and 50.9% as male. The majority of participants were aged between 20 and 29 years (48.8%), followed by those in the 30–44 age group (23.0%). Of note, over 70% of the sample fell within the productive working-age population, underscoring a cohort likely to engage in routine commuting and prolonged exposure to urban air pollution. The educational profile was skewed toward higher qualifications, 46.6% were graduates and 32.4% held postgraduate or professional degrees, as listed in Table 2. This relatively informed sample presents an opportunity to investigate how awareness translates into protective behavior in environmental risk. For income, while 25.4% reported no income (primarily students), a substantial segment belonged to middle-income groups (INR 25,000 – INR 75,000), with potential variation in mobility and access to technological tools.
Sociodemographic and Trip Profile Summary
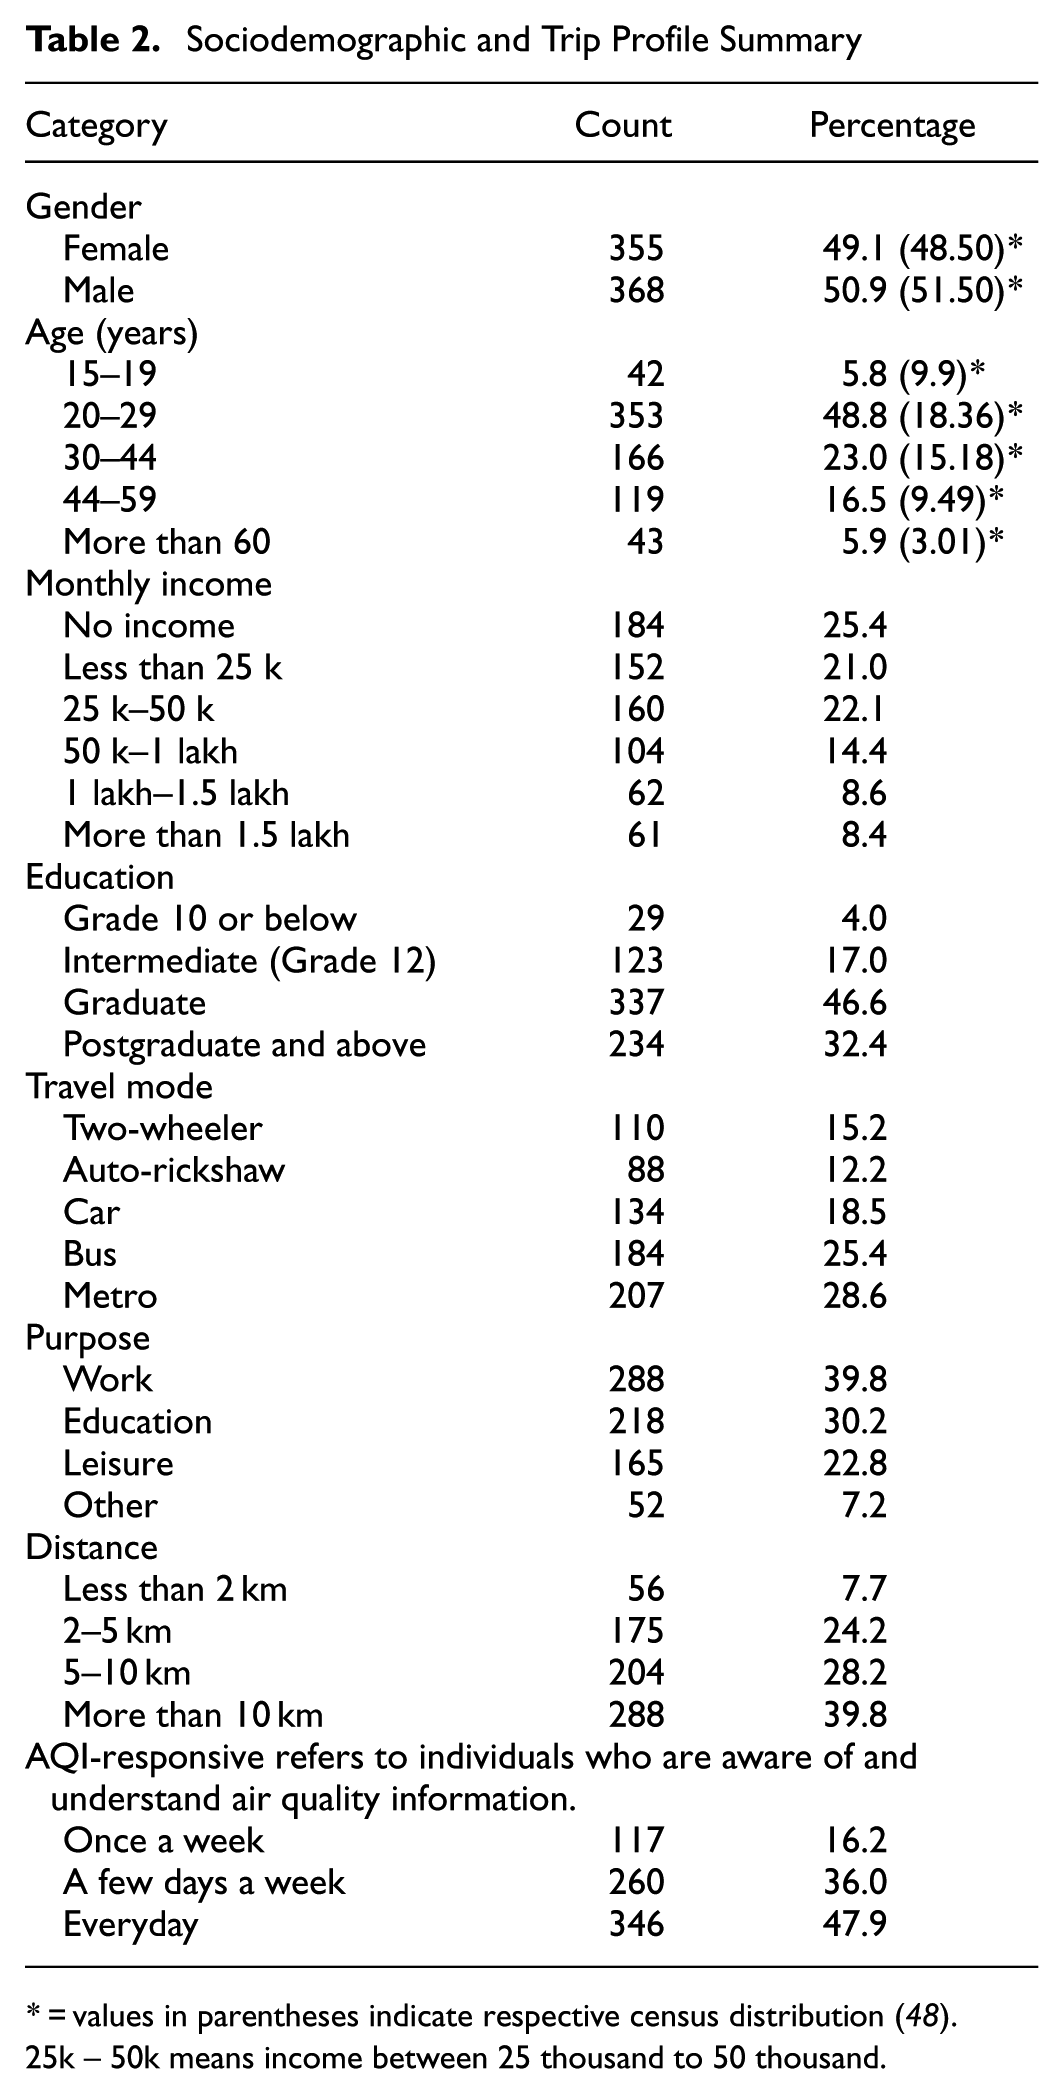
* = values in parentheses indicate respective census distribution ( 48 ).25k – 50k means income between 25 thousand to 50 thousand.
Travel mode choices reflected a rich mix of public and private mobility. Public transit was widely used, with 28.6% of respondents relying on the metro and 25.4% on buses. Among private modes, cars accounted for 18.5% and two-wheelers for 15.2%, offering contrasting exposure profiles in relation to route flexibility, ventilation, and time spent in congested corridors. The primary purpose of travel was work (39.8%), followed by education (30.2%) and leisure (22.8%), aligning with the urban rhythm of weekday and peak-hour mobility. Similarly, travel distances and frequency patterns further emphasized daily exposure potential, 39.8% reported trips exceeding 10 km, and nearly half (47.9%) commuted daily. Another 36.0% traveled several times a week, suggesting that a large portion of the sample experiences routine, repeated exposure to ambient air pollution, making their behavioral choices highly consequential from a public health and policy perspective.
AQI Awareness and Behavioral Variation
Figure 3 shows important insights into how individuals perceive and respond to air quality within daily travel. The majority of respondents (58%) reported being aware of AQI and understanding its meaning, while 29% had partial awareness without a clear understanding, and 13% remained entirely unaware. This variation in awareness directly influences how people interact with AQI in their day-to-day mobility choices. Despite growing visibility of AQI data, regular engagement remains limited. Only 14% of respondents reported checking AQI daily, while 28% did so weekly. Of note, 19% never checked the AQI. Among those who did, digital sources, such as mobile apps and websites, were dominant (43%), with limited reliance on newspapers, television, or public displays. This suggests that access to and trust in AQI information remains uneven across the commuting population. Behavioral responses to pollution were mixed. Some individuals adjusted their mode of transport (23%), route (19%), or timing (17%), and a significant proportion (28%) reported taking no action in response to poor AQI. These behavioral differences were reflected in perceived exposure levels: only 5% rated the air as “good,” whereas the majority experienced it as moderate to very poor. Health symptoms, such as sneezing (27%), eye irritation (17%), and skin problems (15%), were commonly reported, although a substantial share (32%) indicated no symptoms, suggesting differences in sensitivity or risk perception. These patterns reveal a broad spectrum of awareness, behavior, and health experience within the same environmental context. Some individuals are highly proactive, monitoring AQI and adjusting travel, while others remain passive despite similar exposure.
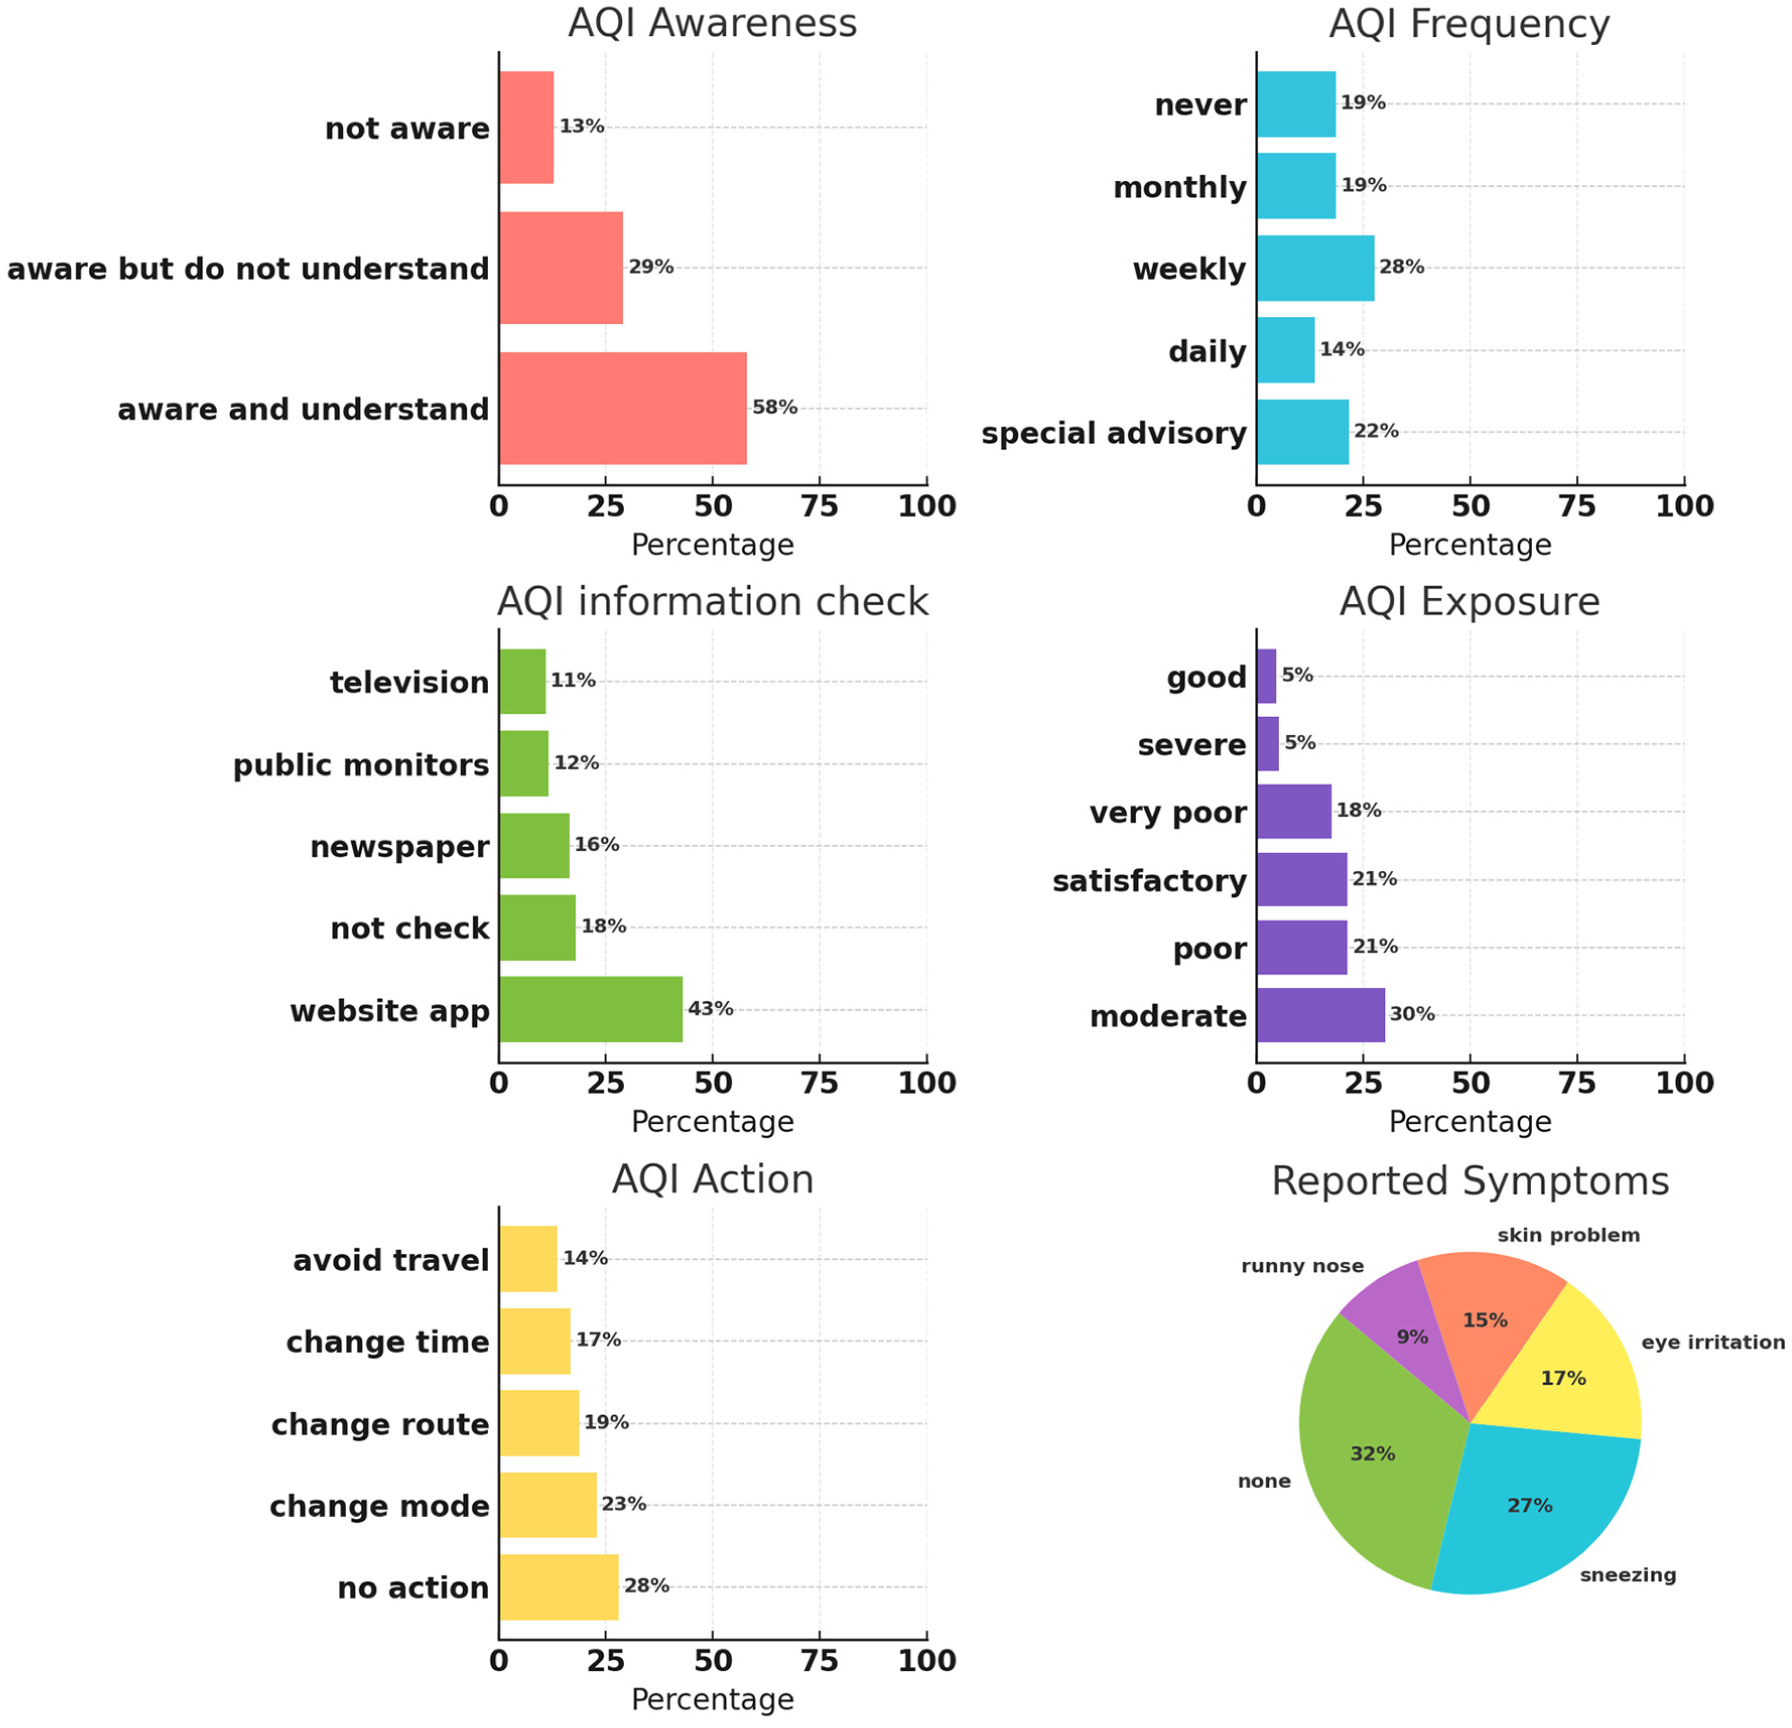
Distribution of responses to air quality information (AQI) awareness, health symptoms, and related travel behavior patterns.
To explore this complexity, this study applies the LCCA, which allows distinct behavioral segments to be identified based on patterns of AQI awareness, information use, and travel-related adaptations.
Measurement Instrument
The attitudinal section of the survey included 17 carefully designed statements, each evaluated on a five-point Likert scale ranging from one (strongly disagree) to five (strongly agree). These items were structured to capture respondents’ underlying perceptions, preferences, and behavioral inclinations across five thematic domains: (1) general AQI awareness; (2) public transport attitudes; (3) private vehicle attitudes; (4) route preferences; and (5) technology and real time tools. As shown in Figure 4, the response distribution provides a detailed view of the attitudinal tendencies across all 17 indicators. The responses revealed a population that is environmentally alert yet behaviorally constrained. A significant majority (64.2%) agreed or strongly agreed that “being exposed to air pollution can affect their health,” reflecting a strong cognitive association between environmental quality and personal wellbeing. A similarly high proportion (63.9%) endorsed the statement that “real-time AQI would influence their travel decisions,” pointing to a willingness to act on environmental cues when such information is accessible and timely.
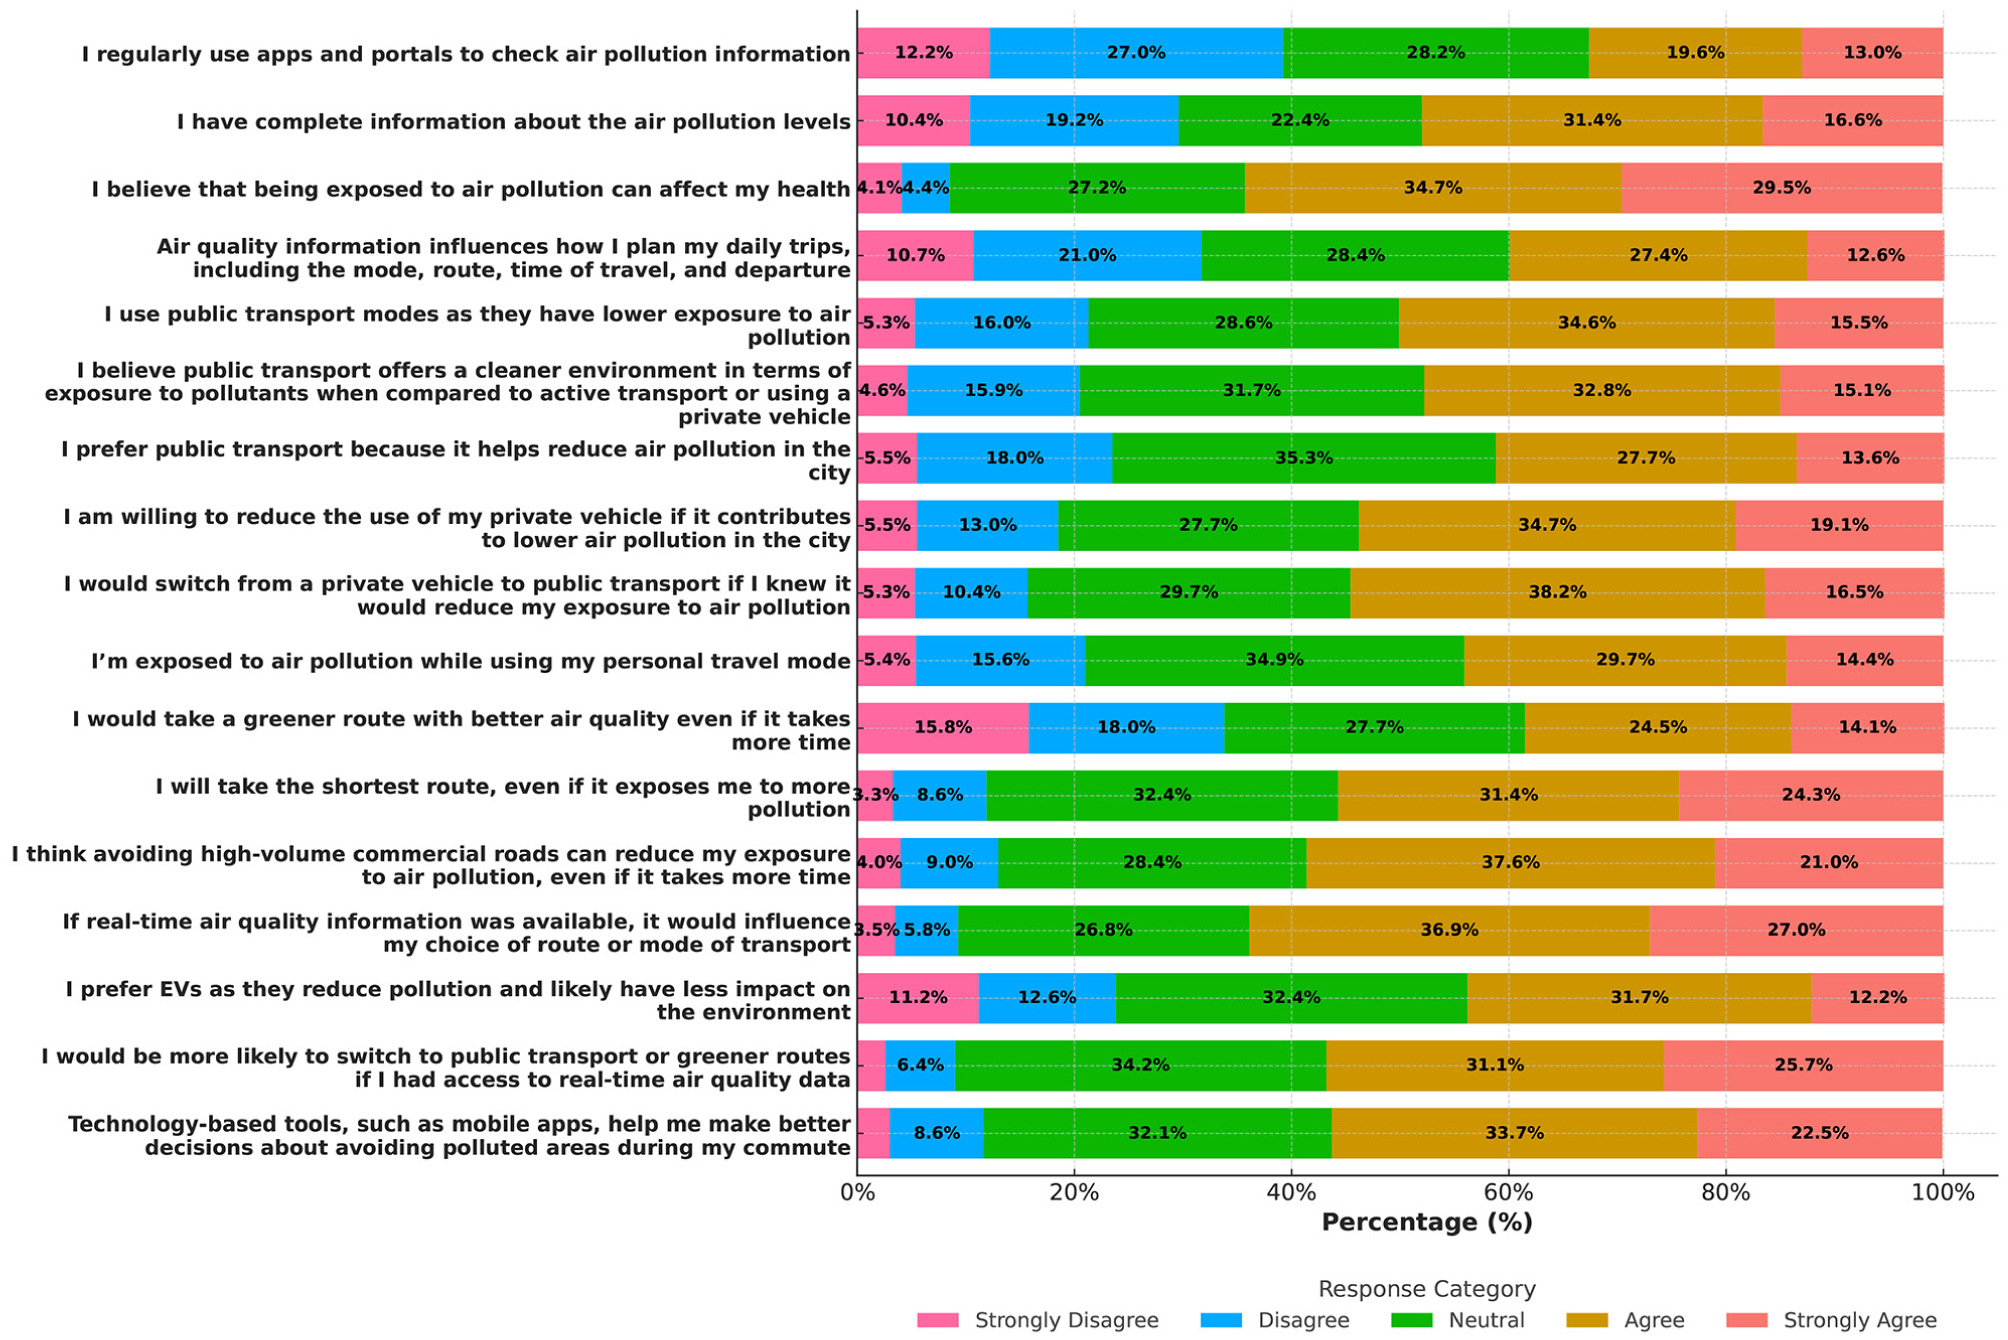
Distribution of responses to 17 Likert scale attitudinal indicators related to air quality, travel mode choice, and behavioral adaptability. Responses range from strongly disagree (one) to strongly agree (five).
However, this awareness did not always translate into behavioral confidence or readiness. While 56.8% of respondents indicated that they would “switch to public transport or greener routes if real-time AQI data were available,” and 58.6% expressed willingness to “avoid high-traffic polluted roads,” only 53.8% agreed they were willing to “reduce private vehicle usage to help reduce pollution.” This suggests that although attitudinal intent toward cleaner mobility exists, structural or lifestyle-related barriers may moderate actual behavioral execution.
Perceptions around the informational environment were also uneven. Only 48.0% of respondents felt they had “complete information about air pollution,” while nearly 30% disagreed, revealing a disconnect between environmental concern and informational access. Similarly, while mobile technology was generally well-regarded, 56.2% agreed that “tools such as apps helped them avoid polluted areas,” certain indicators involving behavioral trade-offs (e.g., willingness to take longer but cleaner routes) received mixed responses, suggesting friction between environmental idealism and everyday convenience. These attitudinal patterns, though insightful on their own, are likely manifestations of deeper latent dispositions that cut across thematic boundaries.
Results
Exploratory Factor Analysis
To understand how people think about air quality and how it influences their travel behavior, an exploratory factor analysis (EFA) was conducted on 17 attitudinal statements (see Figure 4). These statements captured a range of beliefs related to air pollution awareness, travel choices, and use of technology. Before running the analysis, the data suitability was confirmed. The Kaiser-Meyer-Olkin (KMO) statistic measures data suitability for factor analysis by assessing sampling adequacy and correlation strength between variables value was 0.87, and Bartlett’s test of sphericity was highly significant (chi-squared)
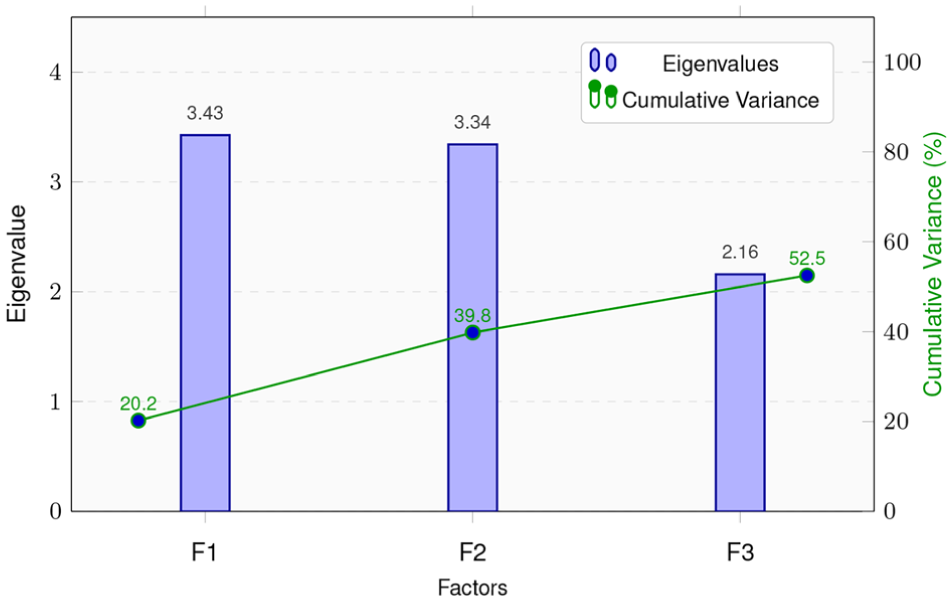
Scree plot showing eigenvalues and cumulative variance for the exploratory factor analysis (EFA).
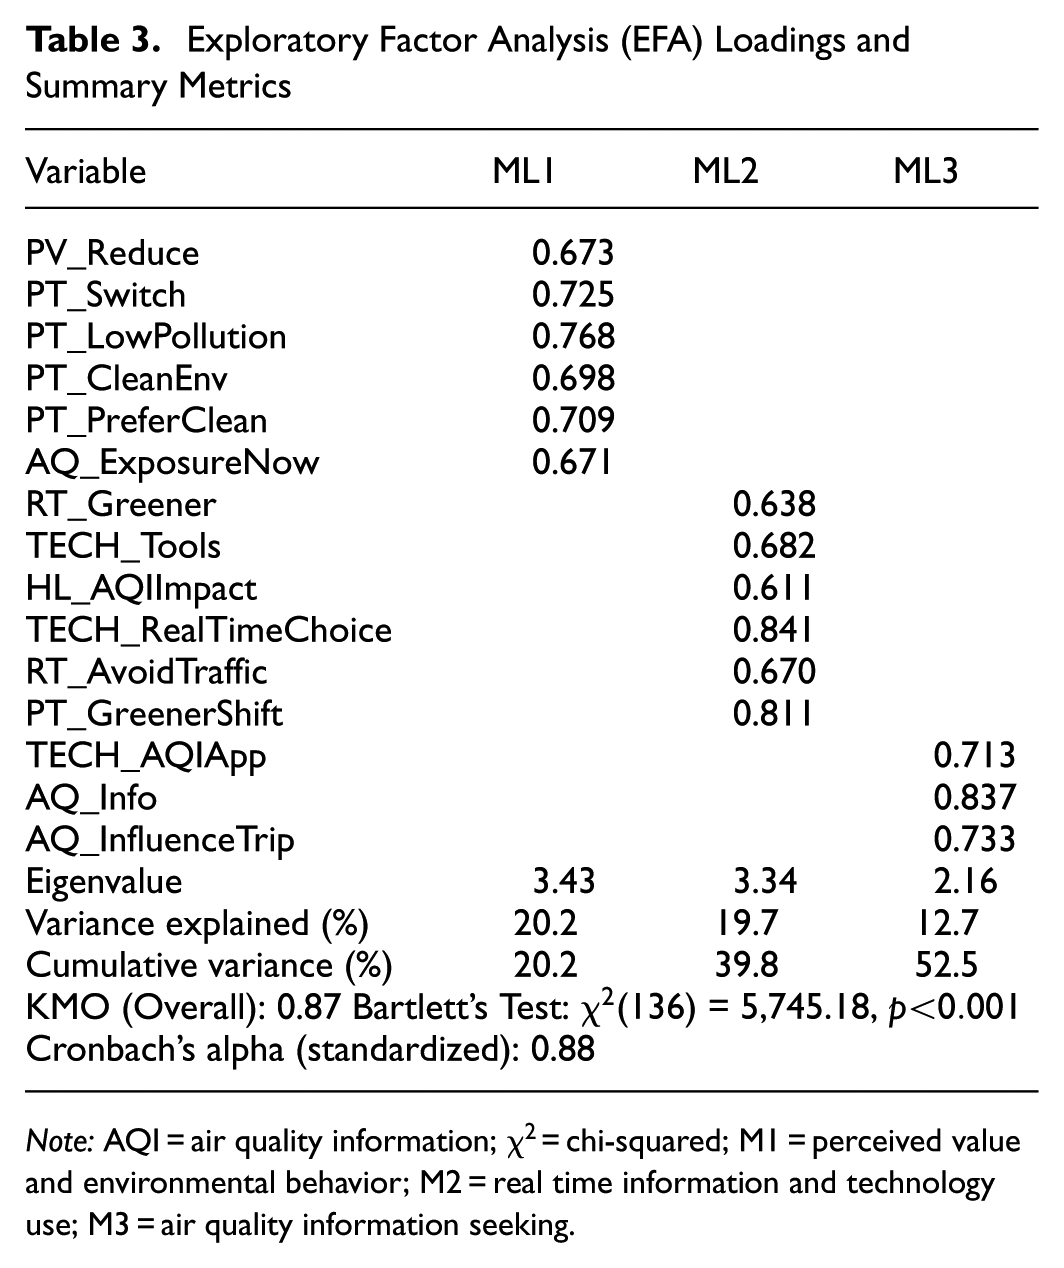
The final factor loadings are given in Table 3. Each item loaded onto one of the three factors, with minimal overlap, supporting the distinctiveness of each dimension. The first factor grouped items related to preferences for cleaner environments and to shifting toward less-polluting travel. The second captured awareness and use of real time digital tools and technology in responding to AQI. The third reflected information seeking behavior, how individuals actively try to understand AQI and use it in their trip decisions. All items had strong loadings (above 0.60), and the overall internal consistency was high, with a Cronbach’s alpha of 0.88. Based on these patterns, the factors were labeled as follows:
Factor 1: Perceived value and environmental behavior (ML1), covering pollution reduction goals and clean travel preferences.
Factor 2: Real time information and technology use (ML2), reflecting digital awareness and technology adoption.
Factor 3: Air quality information seeking (ML3), focused on actively checking and using AQI information while planning trips.
These three factors offer a meaningful summary of how AQI-related attitudes vary among individuals. The scores generated from them were used in later parts of this study, especially for segmenting different types of travelers and analyzing their behavior more closely.
Exploratory Factor Analysis (EFA) Loadings and Summary Metrics
Note: AQI = air quality information;
Confirmatory Factor Analysis
To test the validity of the factor structure identified through EFA, a confirmatory factor analysis (CFA) was conducted using maximum likelihood estimation. The model included three latent constructs: (1) perceived value and environmental behavior (ML1); (2) real time information and technology use (ML2); and (3) air quality information seeking (ML3). Each is represented by its respective observed indicators. The CFA model structure is shown in Figure 6.
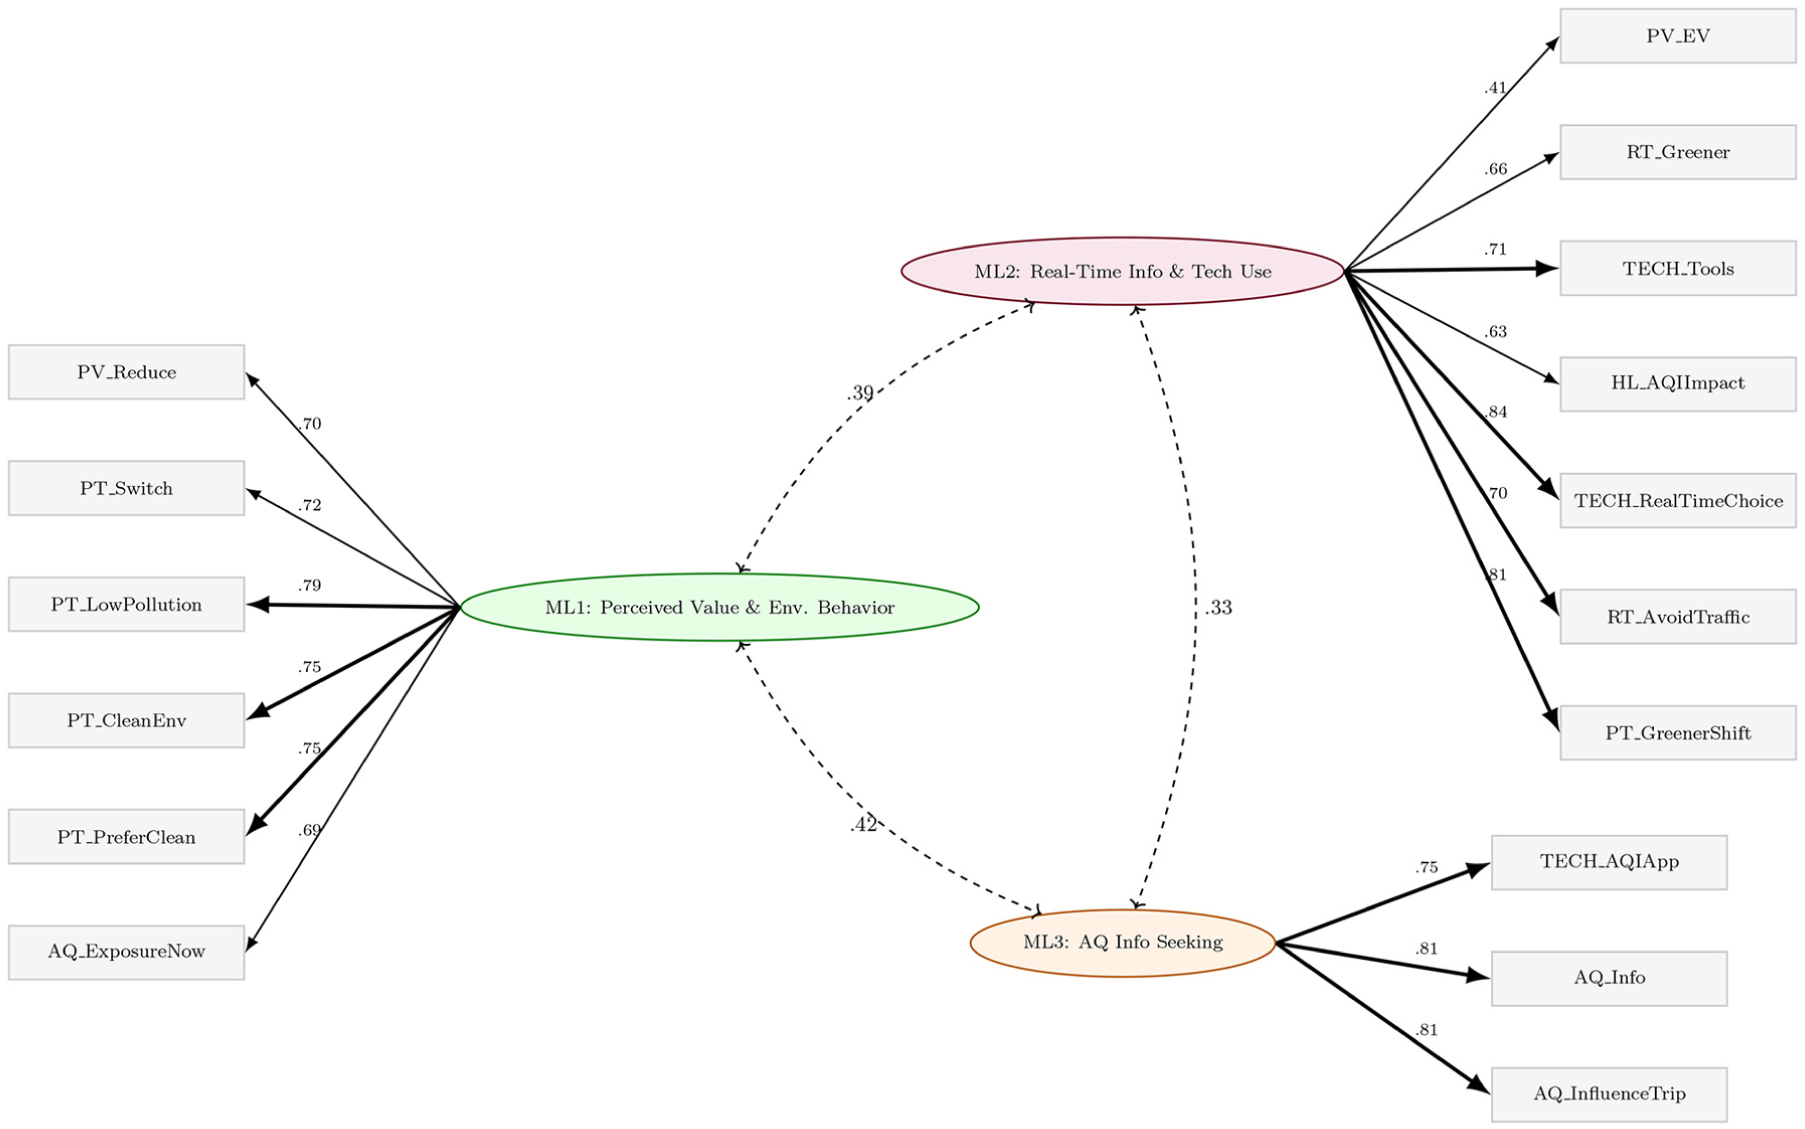
Confirmatory factor analysis (CFA) model structure showing latent constructs and observed indicators.
All standardized factor loadings were strong and statistically significant, from 0.69 to 0.84 across most items, indicating that the indicators reliably measured their respective latent constructs. Two items, PV_EV means here perception towards “I prefer EVs as they reduce pollution and likely have less impact on the environment”, and RT_Greener means perception towards “I would take a greener route with better air quality even if it takes more time” had relatively lower loadings (0.41 and 0.66, respectively), but were retained because of theoretical relevance and acceptable model fit. The CFA model demonstrated an acceptable fit based on multiple established indices. The Comparative Fit Index was 0.884 and the Tucker–Lewis Index was 0.862, both approaching the recommended threshold of 0.90. The root mean square error of approximation (RMSEA) was 0.094, with a 90% confidence interval from 0.088 to 0.100. While slightly above the ideal cutoff of 0.08, the RMSEA still falls within a tolerable range for behavioral models with complex structures. The standardized root mean square residual was 0.074, indicating a reasonably good approximation of the observed covariance structure. Model parsimony was supported by an Akaike Information Criterion (AIC) value of 29,855.89 and a Bayesian Information Criterion (BIC) of 30,016.31. Together, these fit statistics suggest that the specified measurement model adequately captured the underlying latent structure, supporting its use for subsequent structural modeling and behavioral analysis. The CFA provided strong support for the three-factor structure derived from the EFA. The latent constructs demonstrated conceptual clarity and empirical reliability, validating their use in further analysis, such as segmentation and structural modeling. Although CFA is often used to validate newly developed scales on a separate sample, that was not the objective in this study. The CFA was applied to confirm whether the three-factor structure identified using EFA was statistically adequate before using the factor scores in the latent class segmentation. This EFA–CFA sequence is common in travel behavior studies when attitudinal factors serve as intermediate inputs rather than as final psychometric scales ( 49 ). Methodological guidance also notes that using EFA and CFA on the same data set is acceptable when the aim is dimensionality reduction and structural verification, rather than scale validation ( 50 ). Similar approaches have been used in transport research where factor-analytic constructs are incorporated directly into discrete choice or hybrid modeling frameworks ( 34 ).
Latent Class Cluster Analysis
Given the wide variation in AQI awareness, behavioral response, and health perception, LCCA was applied to uncover distinct behavioral profiles among urban travelers. This method allowed unobserved subgroups to be identified based on observed travel behavior and attitudinal dimensions derived from the factor analysis.
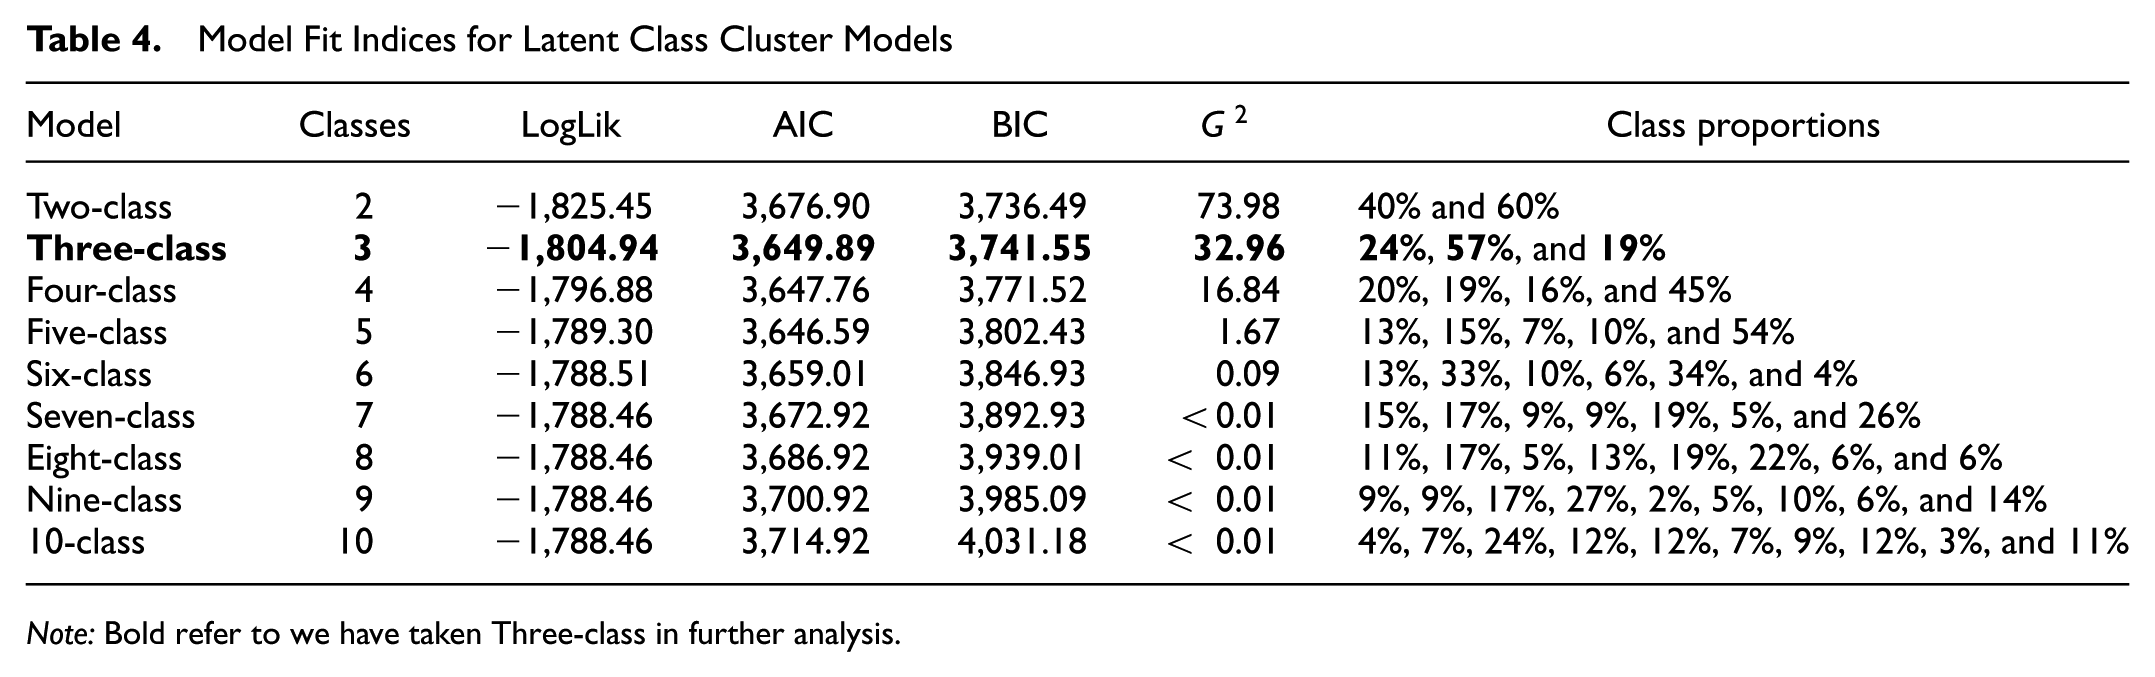
The LCCA was designed with a two-block framework, as shown in Figure 2: active covariates and inactive covariates, as illustrated in the model structure. Active inputs included sociodemographic variables, health status, and AQI awareness, factors expected to influence class membership. Inactive variables, such as trip frequency, mode, and distance, were used for class profiling but not in class assignment. The five attitudinal scores from the CFA, air pollution awareness, and attitudes toward public transport, pollution reduction, route shift, and technology, formed the core of the measurement model. To determine the optimal number of latent classes for segmenting individuals based on their air quality awareness and travel behavior, a series of latent class cluster models ranging from two to 10 classes was estimated, as given in Table 4. The three-class model was selected based on a combination of statistical fit and interpretability. It achieved a substantial improvement in log-likelihood (
Model Fit Indices for Latent Class Cluster Models
Note: Bold refer to we have taken Three-class in further analysis.
Given the balance between parsimony, statistical adequacy, and behavioral distinctiveness, the three-class model was deemed optimal for subsequent profiling and explanatory modeling.
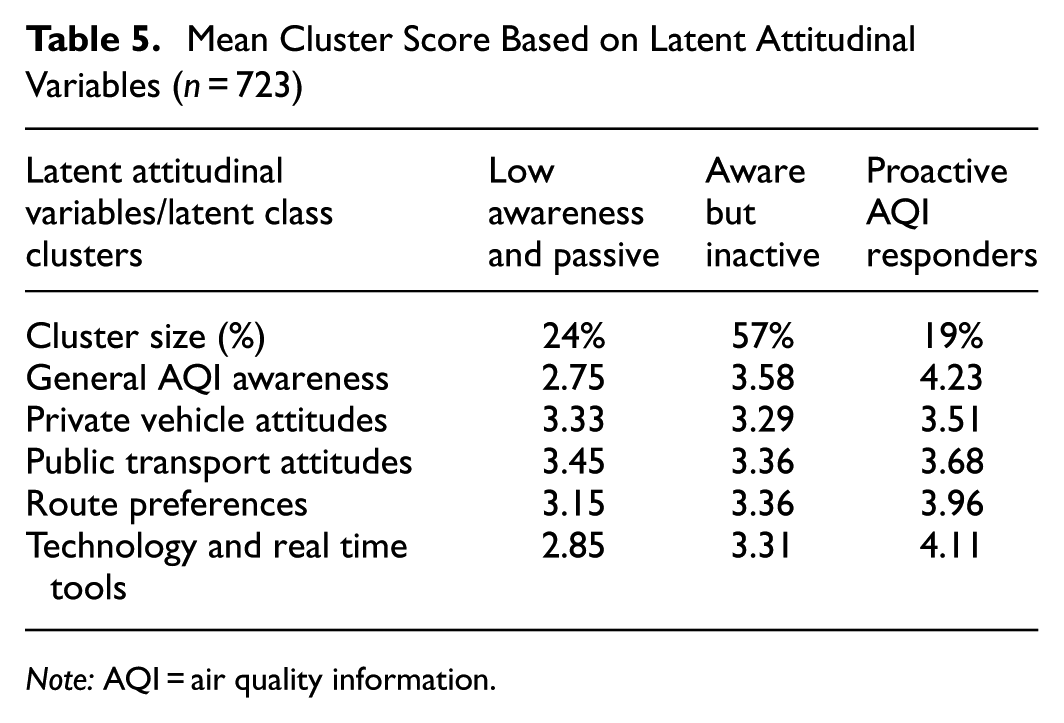
Table 5 presents the mean scores of these latent dimensions across the identified classes, offering a structured interpretation of underlying behavioral patterns. Class 1: low awareness and passive (24%) consists of individuals with minimal engagement across all attitudinal dimensions. This group reported the lowest scores in AQI awareness (2.75), technology adoption (2.85), and adaptive routing behavior (3.15), reflecting a passive response to air quality risks. Members of this segment are also more likely to be from lower educational and income backgrounds, suggesting structural and informational barriers to protective action. Their travel choices appear largely unaffected by environmental conditions, indicating both cognitive disengagement and limited behavioral agency. Class 2: Aware but inactive (57%) represents the largest share of the sample and exhibits moderate awareness and concern (AQI awareness = 3.58), yet low behavioral follow-through. This group shows slightly higher engagement with real time tools (3.31) and cleaner mobility preferences (3.36); these attitudes do not consistently translate into action. Factors such as behavioral inertia, lack of perceived control, or competing daily constraints may contribute to this disconnect. Despite recognizing the health implications of pollution, members of this class rarely altered their travel mode, timing, or route, underscoring a readiness-to-act gap that may be responsive to policy nudges or supportive infrastructure. Class 3: Proactive AQI responders (19%) display a high degree of environmental responsiveness. With the highest average scores across all latent dimensions, AQI awareness (4.23), real time tool use (4.11), and adaptive route preferences (3.96), this group demonstrates deliberate integration of environmental information into travel decisions. Demographically, they tend to be younger, digitally fluent, and better educated, enabling them to access and act on dynamic AQI data. Their behavioral profile reflects a proactive orientation toward risk avoidance and adaptive capacity in response to urban pollution exposure.
Mean Cluster Score Based on Latent Attitudinal Variables (n = 723)
Note: AQI = air quality information.
Class Profile of Active Variables
The latent class segmentation revealed three traveler profiles, each showing a different level of awareness, concern, and responsiveness to air quality. Class 1 (low awareness and passive) represents individuals largely disconnected from the discourse on air quality. As seen in Figure 9a, 45% of respondents reported no awareness of AQI, and an additional 33% had heard of AQI but did not understand its meaning. Together, this accounts for 78% of individuals in this class who lacked meaningful awareness, justifying the description “nearly 80%.” The majority never checked AQI levels (Figure 9c) or took any protective action, even when the air quality was visibly poor (see Figure 9, b and e ). Only a small proportion engaged with real time information sources, such as mobile apps or public display boards, as shown in Figure 9d. In addition, Figure 9a shows the class-conditional distribution of self-reported awareness of the term “AQI” and is intended to serve as a descriptive class profile rather than a defining criterion for class membership. The latent classes were identified using a probabilistic LCCA that accounts for the joint pattern of multiple attitudinal dimensions and AQI-related behavioral indicators, including information use and adaptive travel responses. Therefore, class membership is determined by the overall behavioral and attitudinal response pattern across all indicators, rather than by any single observed variable. Within this probabilistic framework, limited within-class heterogeneity on individual indicators is expected and reflects realistic variation in how awareness and behavioral responses to air pollution co-occur in the population. Of note, over 60% experienced health issues, as shown in Figure 8a; however, very few linked these to air pollution (Figure 8c), indicating a perceptual disconnect between personal health and environmental exposure. Sociodemographically, this group included a higher proportion of older adults (see Figure 7a), individuals with lower levels of education (see Figure 7c), and those in the lowest income category (see Figure 7e), as shown in Figure 7. Travel behavior was infrequent and mostly driven by necessity, often limited to short distances (Figure 10c). Even among those who perceived the air quality as poor or very poor, there was little change in when or how they traveled. This reflects limited access to digital or informational resources and a broader lack of perceived relevance of air quality to daily decision-making.
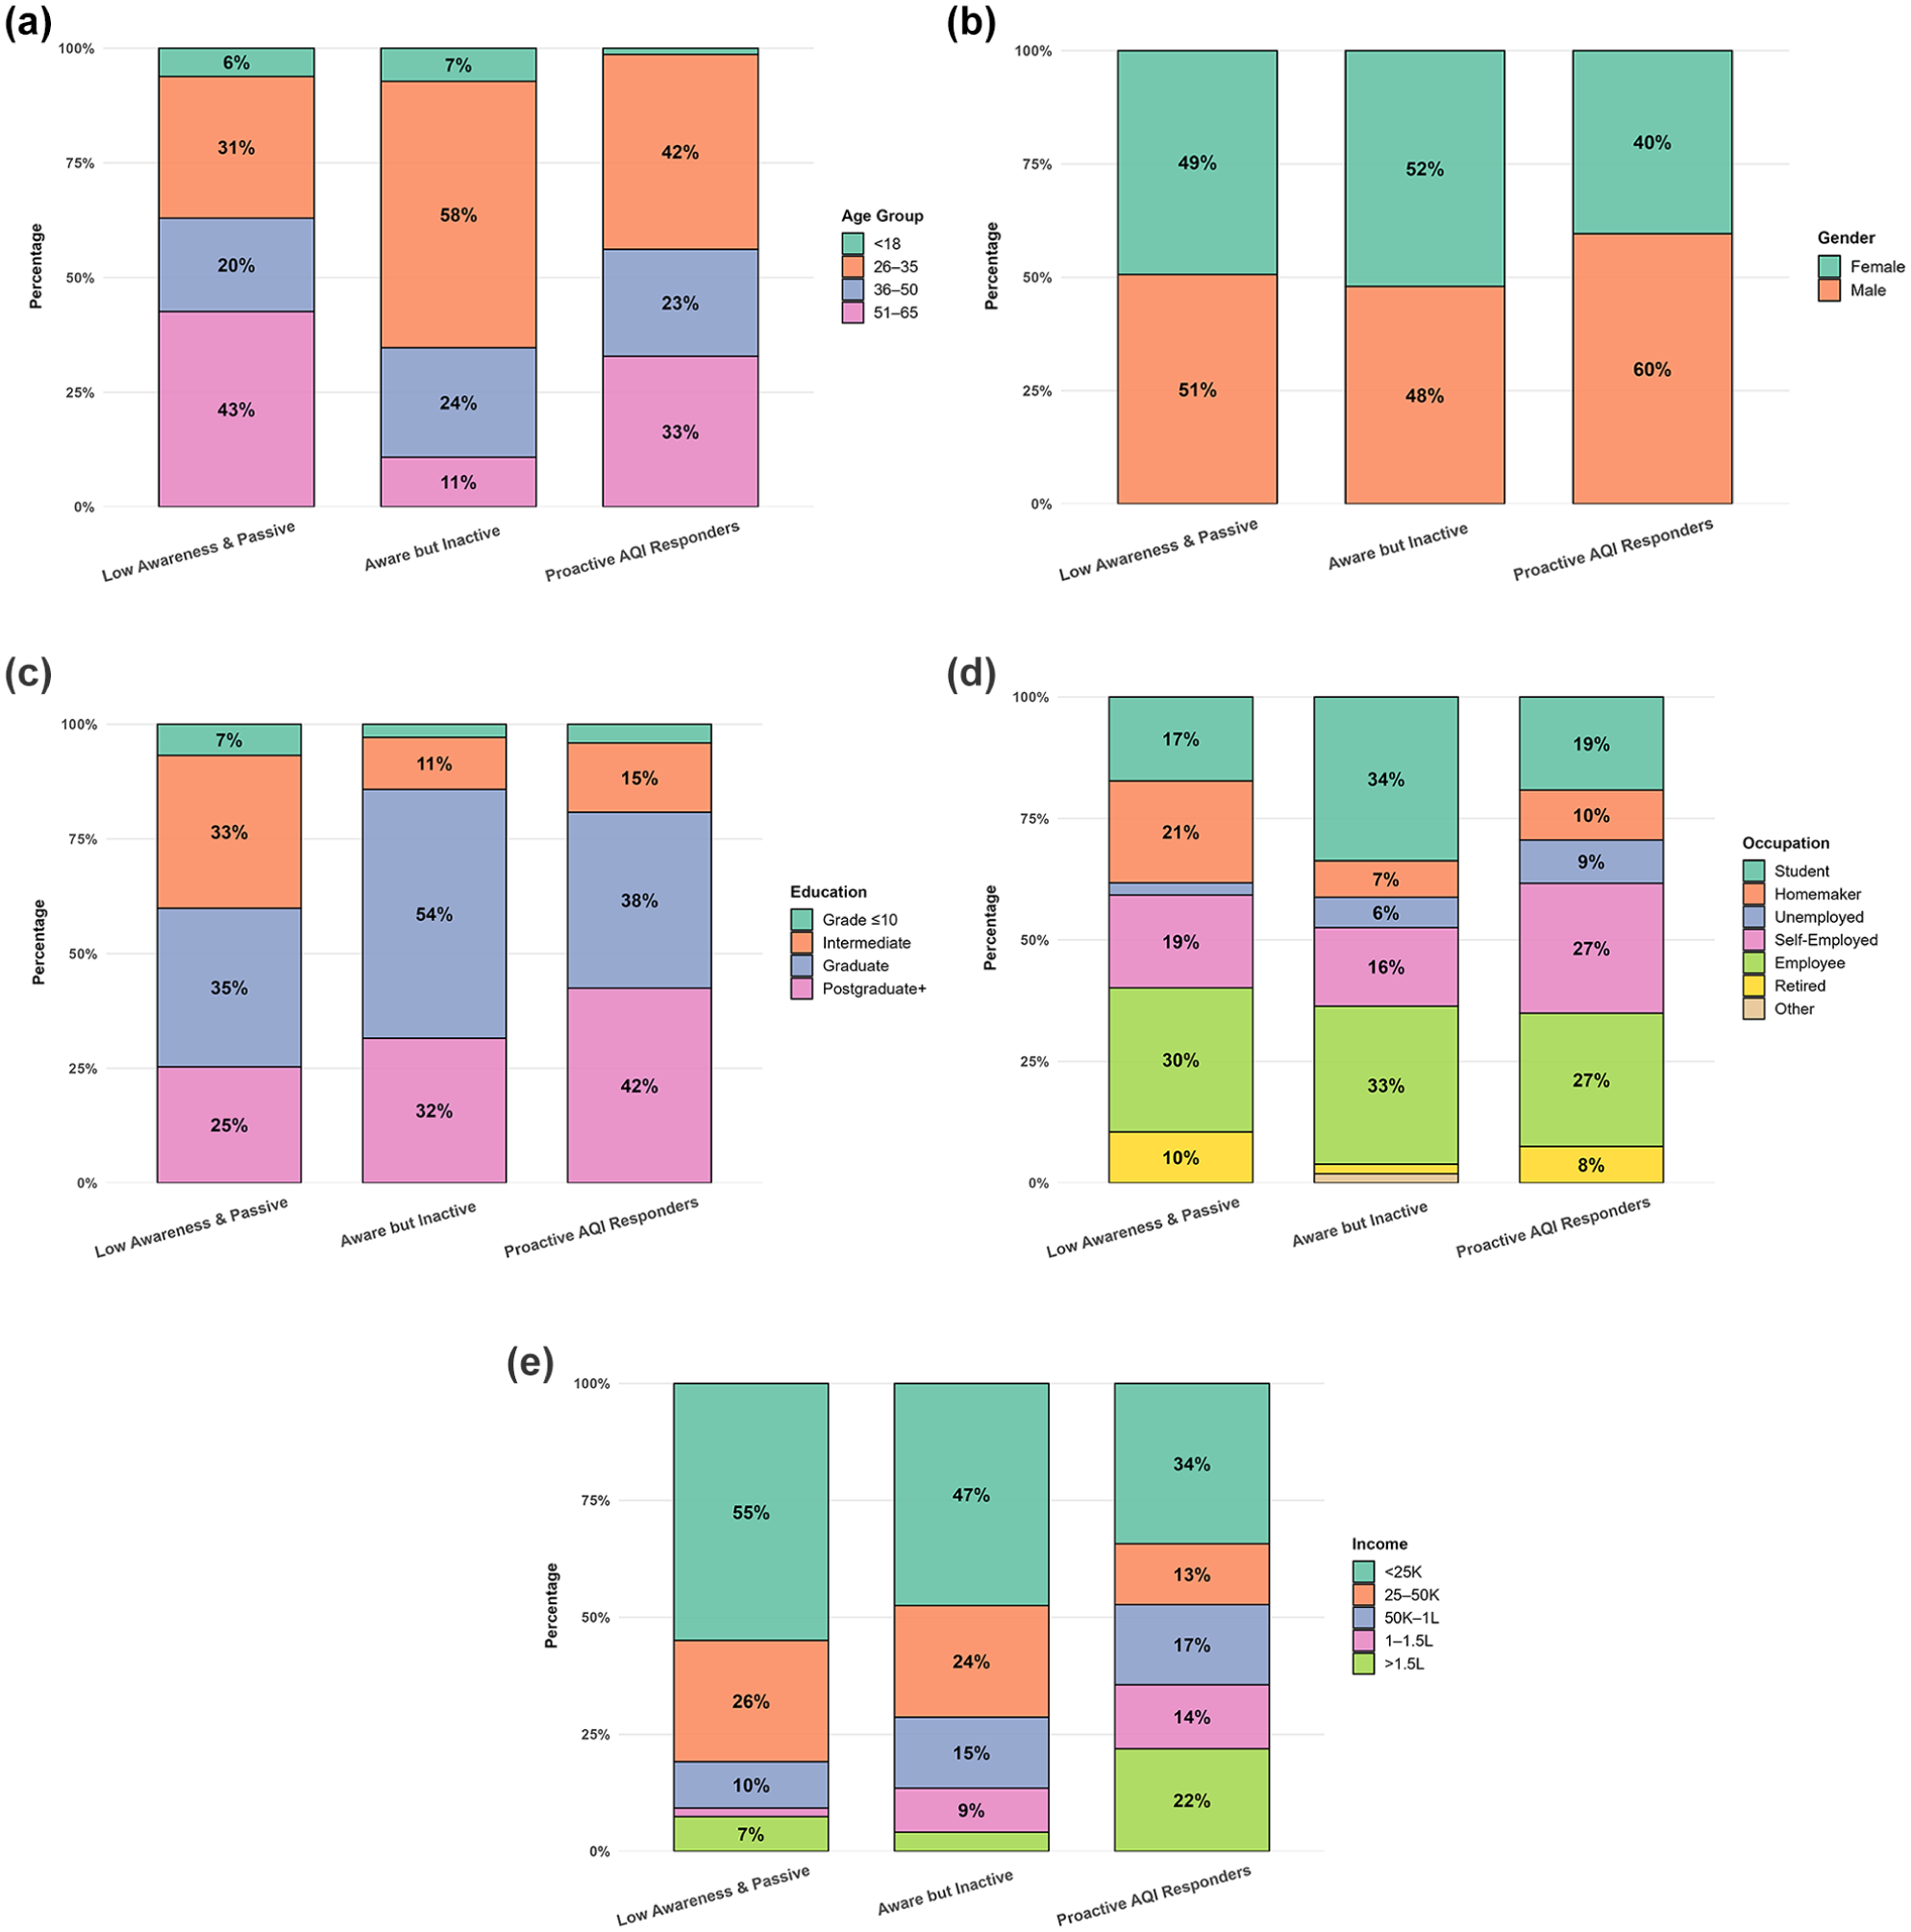
Sociodemographic characteristics across latent classes: (a) age; (b) gender; (c) education; (d) occupation; and (e) monthly income.
Class 2 (aware but inactive) was more informed than Class 1, but still hesitant to act. About two-thirds understood AQI, and over 90% were aware that it affects health; however, nearly one in five still reported no behavioral response (Figure 9). This group had a high burden of symptoms, especially sneezing and eye irritation, but many appeared to accept these conditions as routine or unavoidable. As shown in Figure 8, awareness existed, but urgency seemed lacking. The group was primarily middle-aged, better educated than Class 1, and included many salaried workers and homemakers (Figure 7). Their travel behavior was more regular, nearly half commuted daily, but showed limited signs of adjustment. Education and leisure-related trips dominated, and most relied on habitual modes. The mismatch between high awareness and low behavioral change in this group suggests that knowledge alone may not be enough. This could be because of a lack of access to cleaner alternatives or simply low perceived control over exposure. Despite having a better socioeconomic status than Class 1, their travel and health decisions remained unchanged, raising questions about what triggers real behavioral shifts among urban commuters. Class 3 (proactive AQI responders) stood apart; this group understood AQI and acted on it in consistent and meaningful ways. One-third of them checked AQI daily, and nearly half took some form of protective action, whether by changing their route, timing, or even avoiding travel when conditions worsened (Figure 9). What also stands out is the clarity with which this group perceived risk. As shown in Figure 8, they were more likely to report symptoms (Figure 8b) and actively linked them to air quality. Rather than dismissing health effects, they acknowledged them and adjusted accordingly. Their profile included more young adults, especially those aged 26–35 years, a higher share of female respondents (Figure 7b), and a higher share of postgraduate-educated respondents (Figure 7c). Most commuted daily, but unlike the other two groups, they preferred modes such as the metro and two-wheelers, indicating a combination of control and flexibility. Short-distance travel was common, and these respondents demonstrated an ability to translate real time awareness into tangible decisions. Overall, 21% rated their exposure as “severe,” which closely aligned with their self-reported symptoms and protective behaviors. This segment reflects what many interventions aim to cultivate: a traveler who is aware, affected, and empowered to respond.
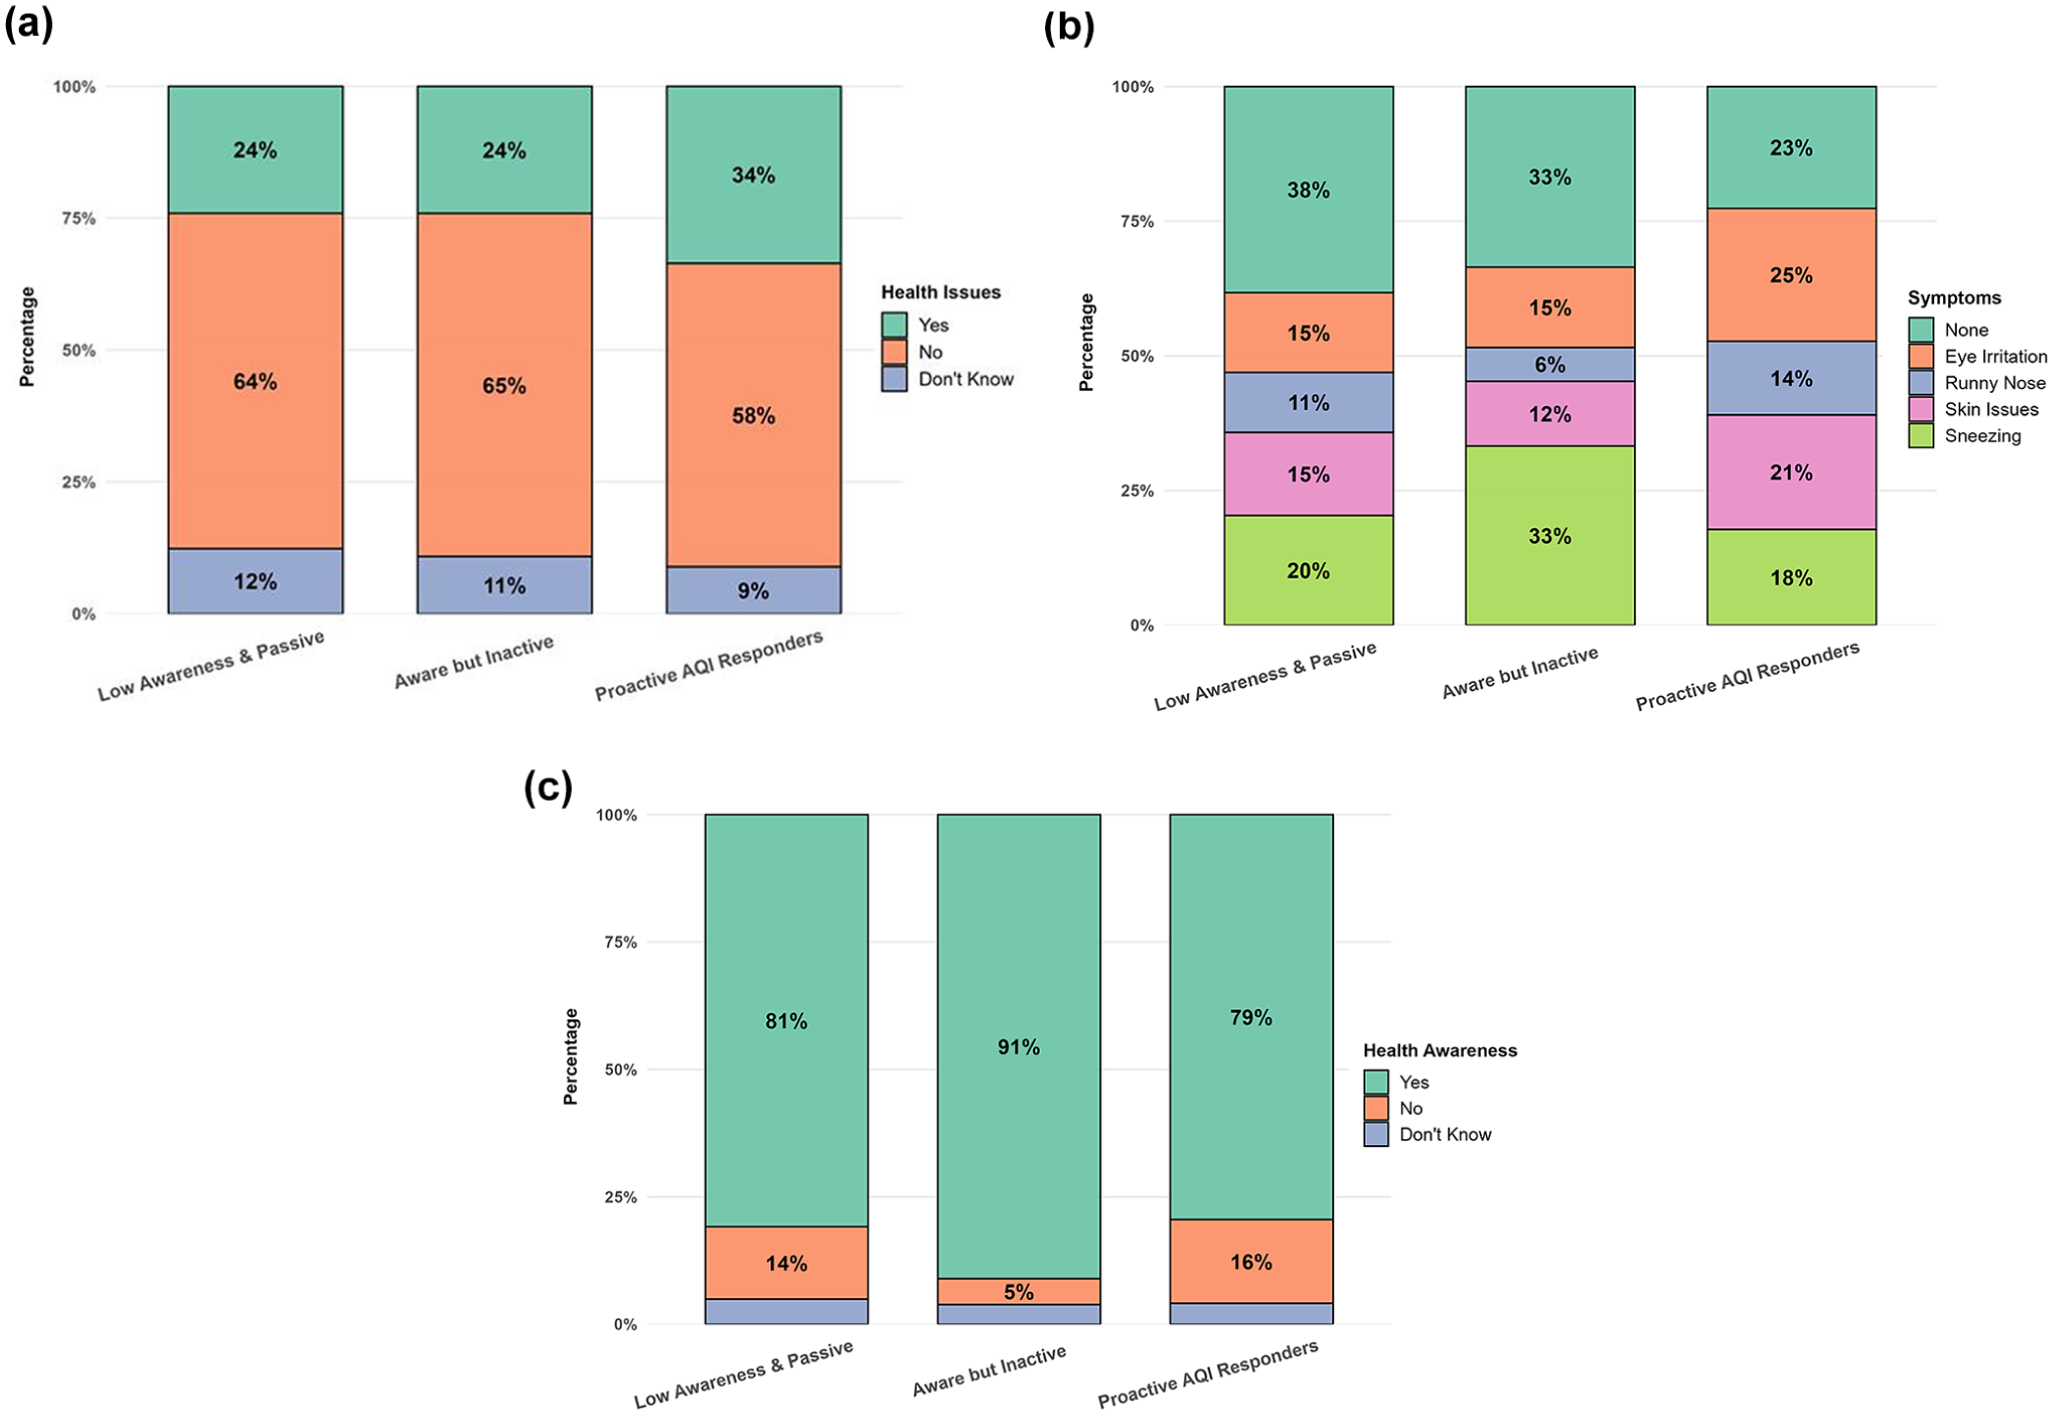
Health effects and AQI-related symptoms: (a) health issues; (b) symptoms; and (c) health effects awareness.
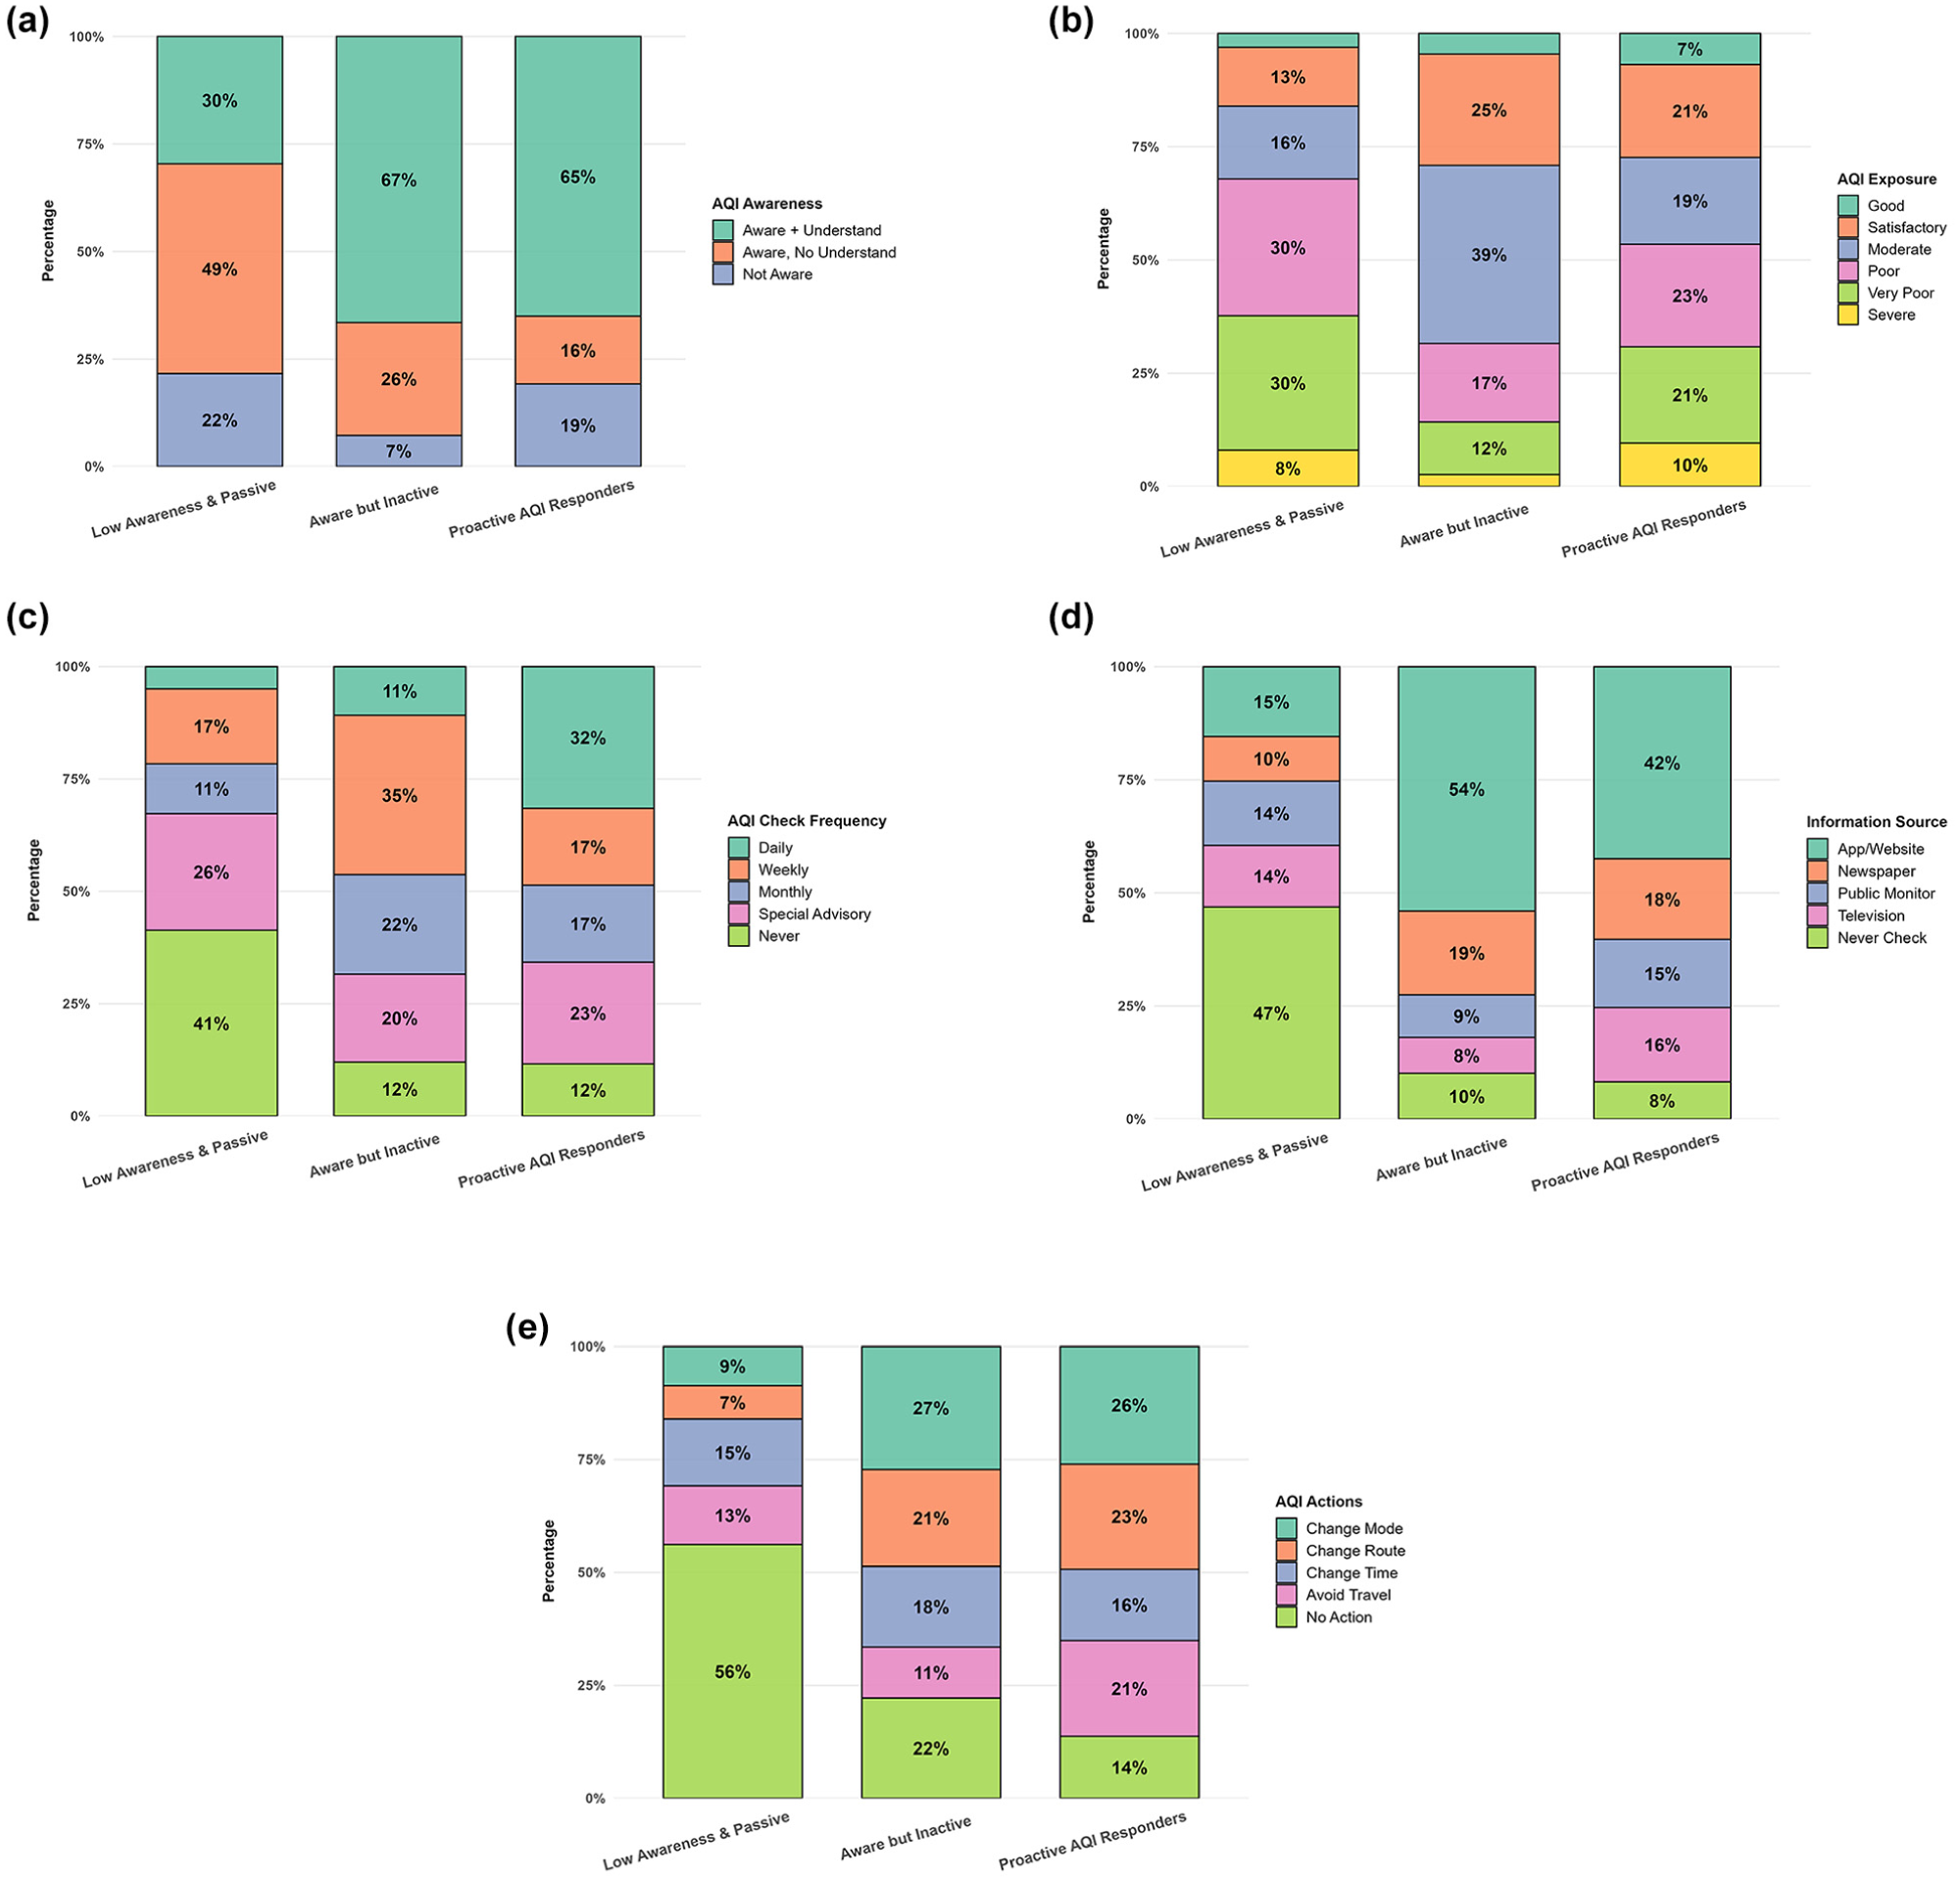
AQI awareness, exposure, and behavioral response across latent classes: (a) AQI awareness; (b) current exposure; (c) checking frequency; (d) information source; and (e) protective actions.
Taken together, the three profiles provide a layered picture of urban AQI response. Class 1 reveals the continued need for foundational awareness efforts among older and lower-income groups. Class 2 reminds us that awareness without action may not be enough, and that social or structural factors may suppress adaptive behavior. Class 3 offers a glimpse into what behavioral alignment looks like when information, concern, and capacity intersect. These insights are crucial for tailoring future interventions: whether through community outreach, digital tools, or policy nudges, the goal is to bring more travelers closer to the proactive profile.
Class Profile of Inactive Variables
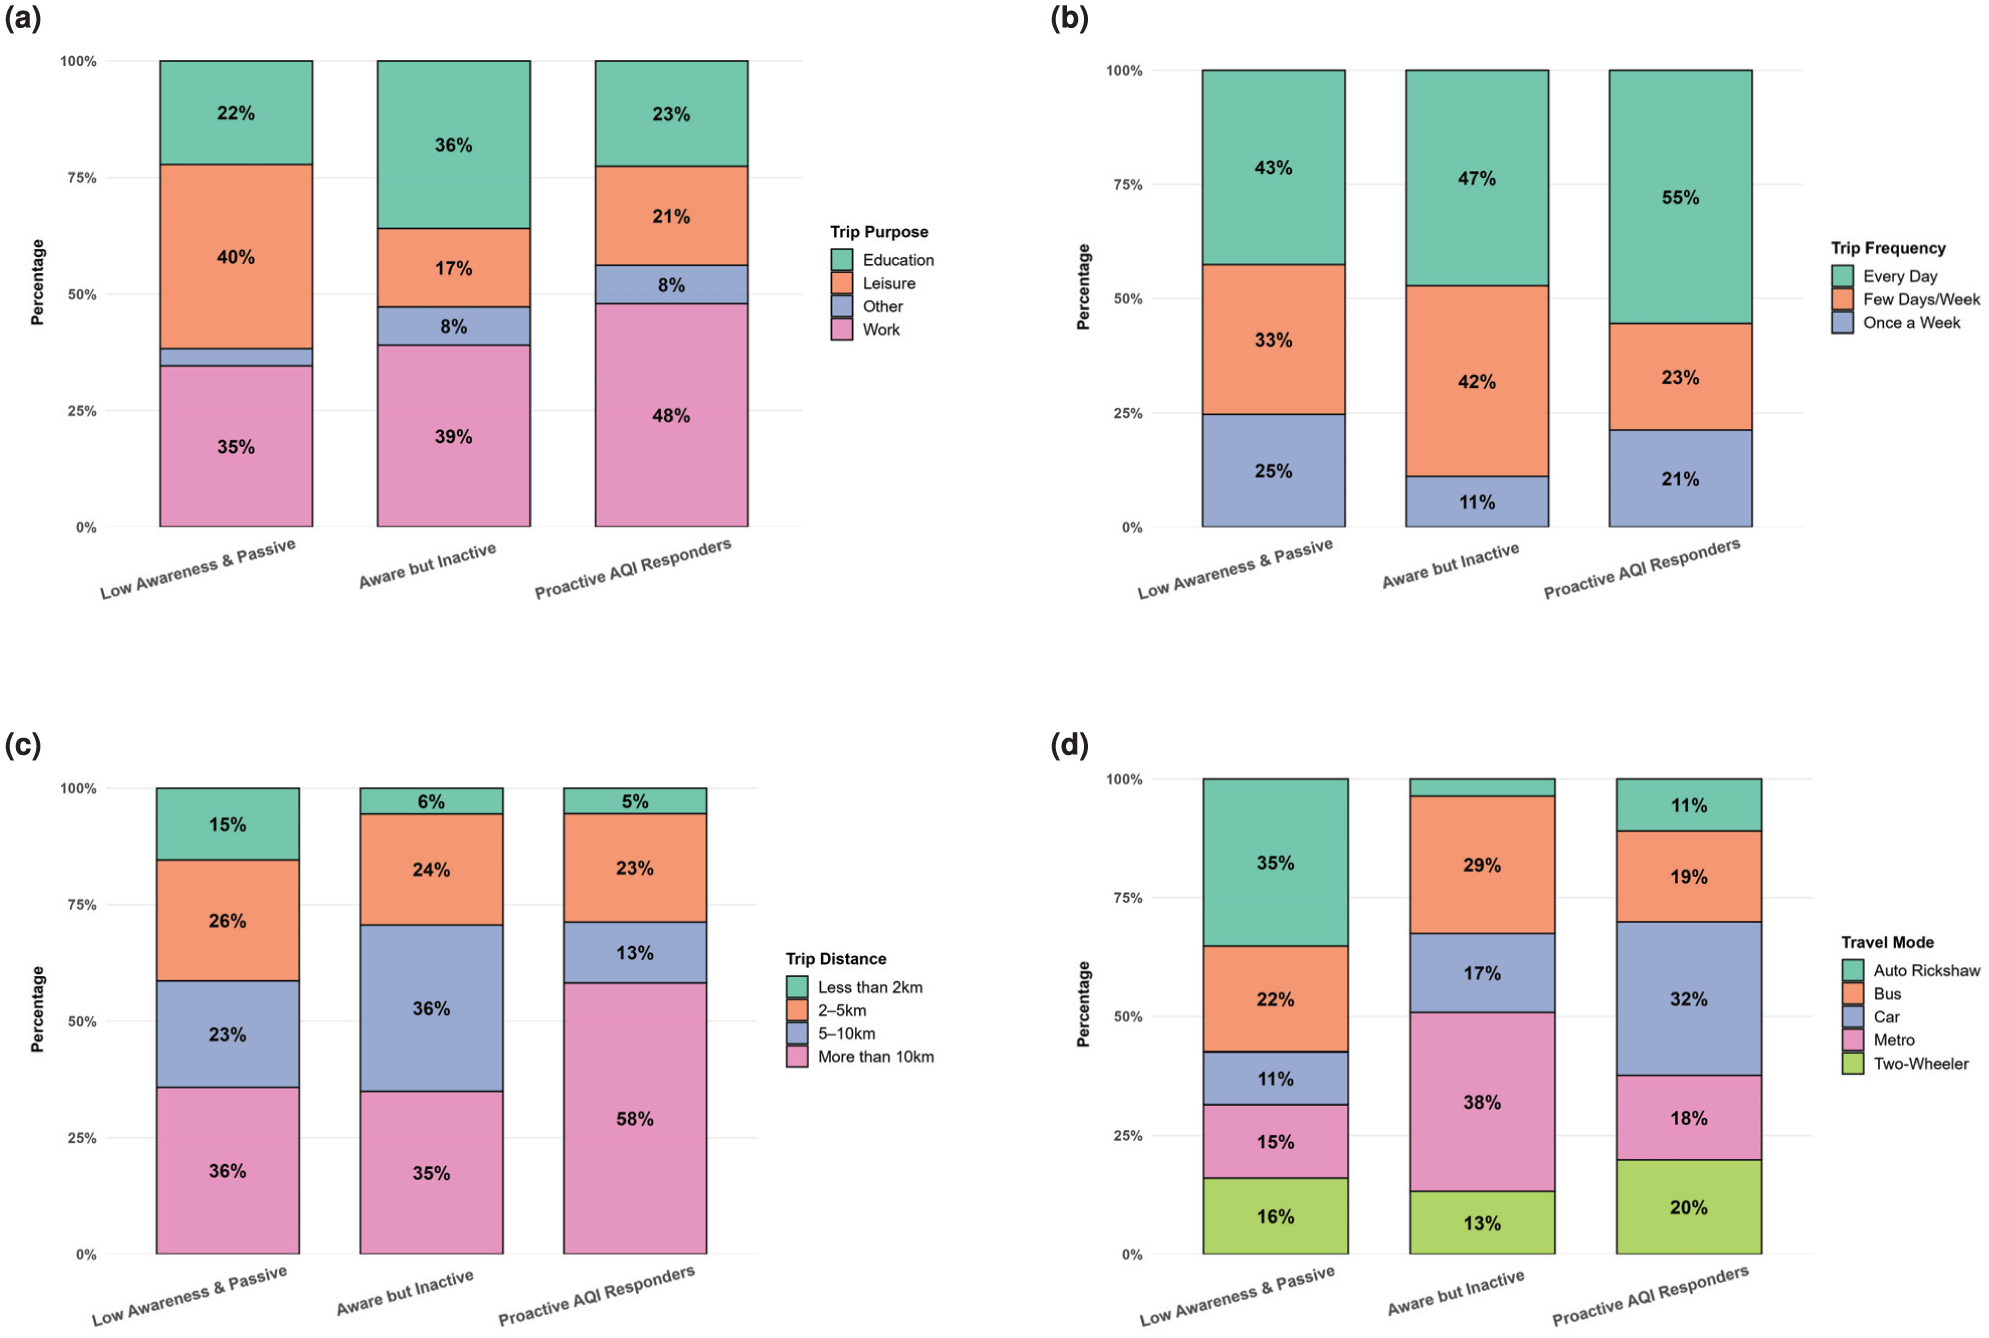
The latent class segmentation was based on attitudinal and behavioral indicators; several core travel variables also varied meaningfully across classes, offering additional context for interpreting exposure differences. As shown in the purpose of trips (Figure 10a), the frequency (Figure 10b), distance (Figure 10c), and mode (Figure 10d) differed in distribution and their potential to influence daily exposure.
Trip profile characteristics across latent classes: (a) trip purpose; (b) trip frequency; (c) trip distance; and (d) travel mode.
Proactive AQI responders traveled more frequently, with 55% commuting daily compared with 47% of the aware but inactive and only 43% of the low awareness and passive group. However, the majority of these daily trips occurred over shorter distances, 58% were under 2 km, indicating compact routines that may limit prolonged exposure (Figure 9b). This group also showed a greater tendency to use the metro (32%) and two-wheelers (20%), suggesting an adaptive response that balances speed, cost, and air quality considerations. In contrast, aware but inactive respondents, while similarly regular in travel, showed heavier reliance on bus (38%) and car (17%), modes that may be less flexible during high-pollution episodes. Low awareness and passive travelers relied more heavily on auto-rickshaws and cars, and had the highest share of long-distance trips (23% above 10 km), compounding exposure risks, especially when no protective actions are taken.
Trip purpose (see Figure 10a) also provides insight into why certain groups may or may not respond to AQI. The proactive group was more likely to travel for work (48%) and less likely to travel for education or leisure, possibly reflecting greater discretionary control over mode and timing. The aware but inactive segment had a relatively high share of education and leisure-related trips, which may be less adjustable and contribute to behavioral inertia. The passive group showed a more even spread across purposes; however, coupled with low travel frequency and limited AQI awareness, their exposure appeared more incidental than actively managed.
Taken together, these differences suggest that even in the absence of strong attitudinal influence, trip structure can shape how exposure is experienced or managed. Those traveling longer distances or using less flexible modes may face greater barriers to acting on AQI, and those with shorter, more frequent, or discretionary trips appear better positioned to respond. These patterns complement the attitudinal findings and highlight the value of integrating trip context into any future behavioral or policy intervention.
Mode Choice Segmentation Across Latent Classes
An MNL model is employed to examine how latent class membership and contextual factors influence individuals’ travel mode choices. The model estimates the probability of selecting one of four alternatives, auto-rickshaw, bus, car, or two-wheeler, using the metro as the reference category. Independent variables include sociodemographic characteristics, trip attributes, air quality awareness, health-related indicators, and latent class membership. The base category for the latent class variable is proactive AQI responders.
Let
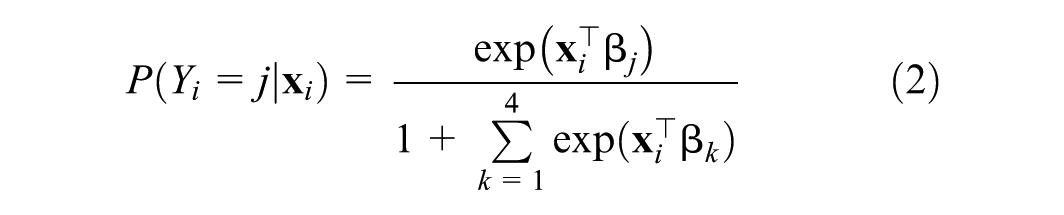
The probability of choosing the metro, the reference mode, is
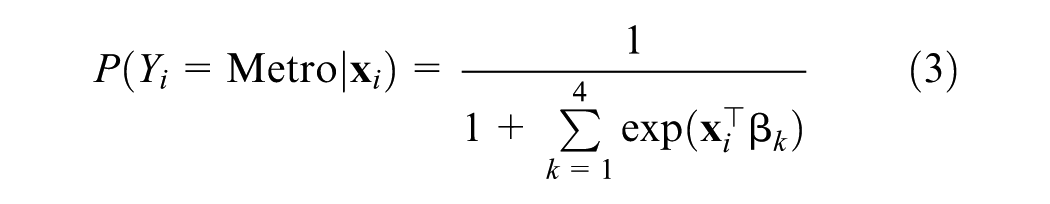
where

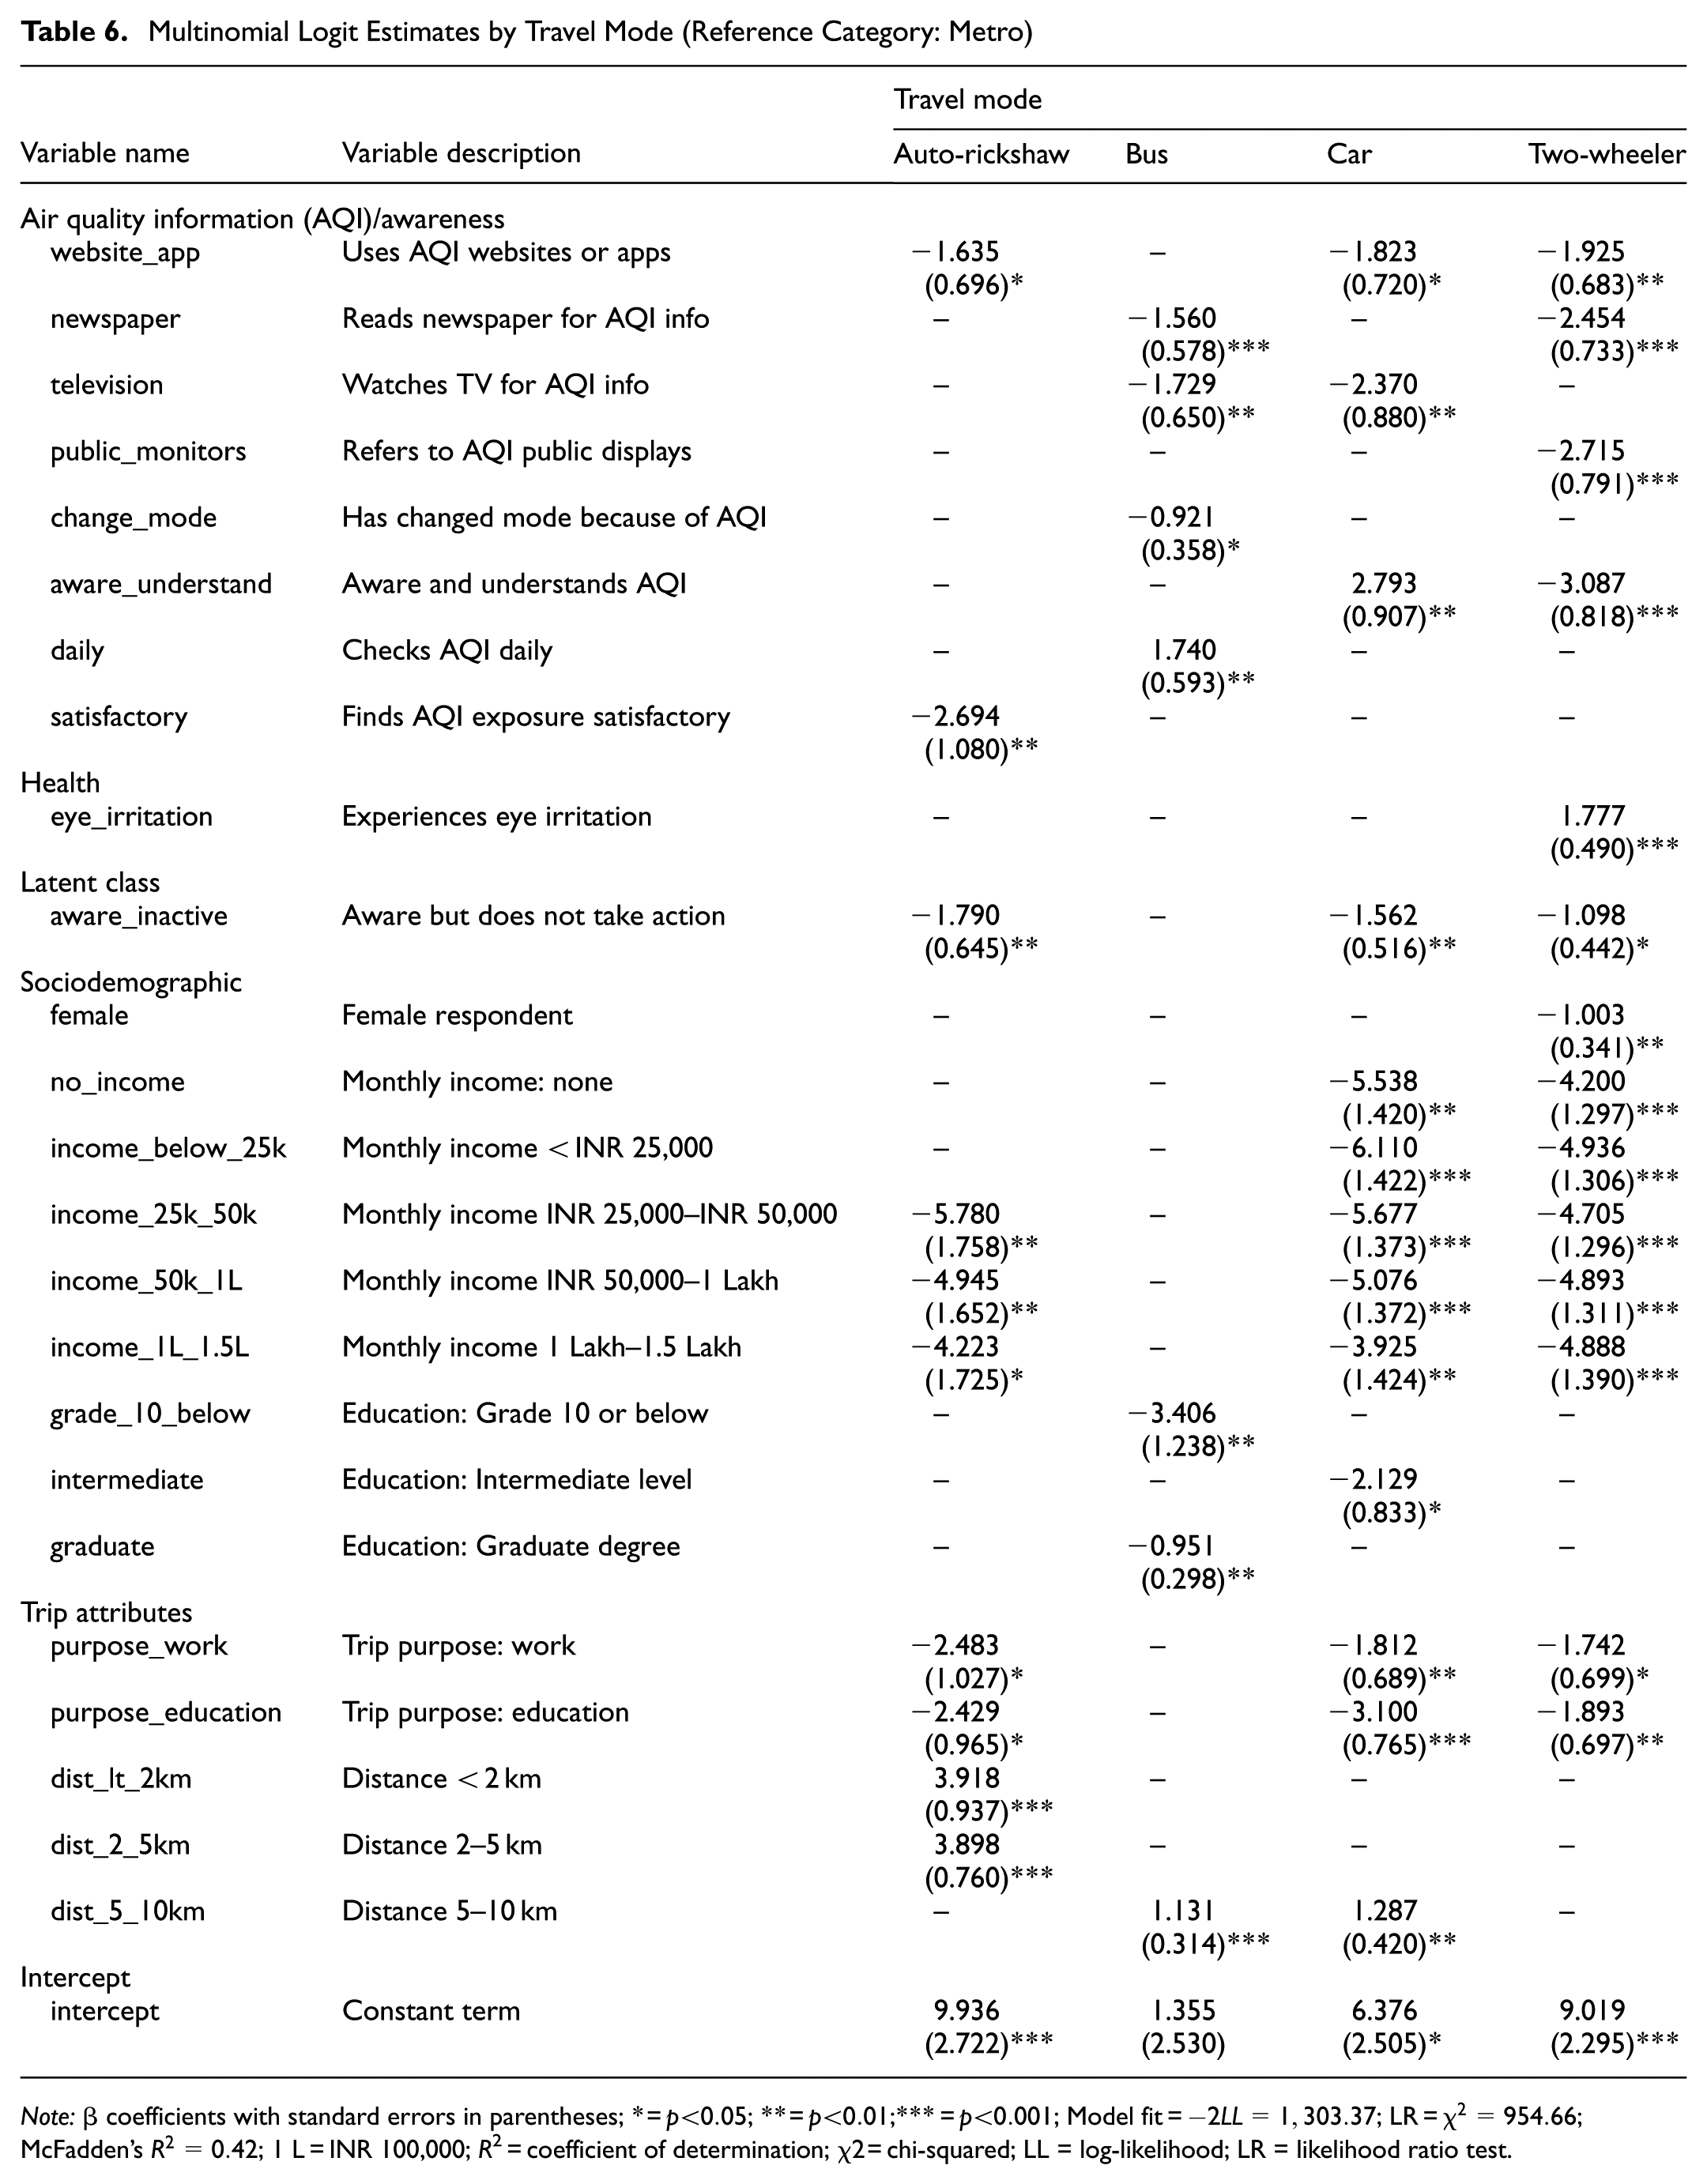
Table 6 presents the coefficient estimates for each alternative mode, capturing how various factors influence the likelihood of choosing an auto-rickshaw, bus, car, or two-wheeler over the metro. The results highlight that travel mode preferences are shaped by a combination of income level, air quality awareness, and health-related experiences. In particular, individuals’ responses to pollution, both in what they know and how they feel, play a significant role in determining whether they avoid or continue using more exposed modes such as car, auto-rickshaw, or two-wheeler.
Multinomial Logit Estimates by Travel Mode (Reference Category: Metro)
Note:
AQI emerged as a key factor influencing protective travel behavior. Individuals who checked AQI via websites or mobile applications were significantly less likely to use two-wheelers than those who used the metro. A similar effect was observed among those who relied on public display monitors for pollution updates. These results confirm that real time AQI information, especially using digital and visible sources, plays a critical role in discouraging the use of more exposed modes. The immediacy of information probably allows individuals to reassess their travel plans and shift to safer options. In contrast, information accessed through newspapers and television showed no significant association with two-wheeler use, possibly because such sources do not offer real time updates that influence immediate behavior. However, television exposure was associated with lower preference for cars, indicating that strong visual messaging may influence behavioral decisions for certain segments. Individuals who had a better understanding of AQI were more likely to use cars over the metro, possibly perceiving the enclosed environment of cars as a safer alternative despite their role in contributing to pollution. Health-related factors also shaped decisions under polluted conditions. Respondents who reported eye irritation were more likely to use two-wheelers. This indicates a vulnerable group that remains exposed to pollution even when experiencing direct physical symptoms, possibly because of a lack of accessible alternatives. These users may continue to rely on personal modes despite health discomfort, revealing the limits of individual choice in constrained urban settings. Latent class membership provided further insight into behavioral segmentation. Individuals classified as “Aware but inactive” were significantly less likely to use auto-rickshaws, cars, and two-wheelers compared with the metro. This group may not always take active protective steps; their general awareness is still associated with avoidance of more exposed modes. This shows that even moderate awareness levels can influence healthier travel decisions. Sociodemographic characteristics continue to influence mode preference. Respondents with no income were less likely to use two-wheelers or cars, and similarly strong negative associations were observed for all income brackets below INR 50,000. These findings indicate that the metro remains the most affordable and inclusive option, especially for lower-income groups navigating daily pollution. Work-related and education-related trips were also less associated with two-wheeler use, and education trips further reduced the likelihood of car use. This suggests that the metro is considered more suitable for regular and essential commutes. Auto-rickshaw use was primarily driven by short-distance travel. Individuals covering less than 2 km or between 2 and 5 km preferred autos over the metro, confirming their role in short-trip connectivity. However, satisfaction with air quality was negatively associated with auto- concerned about pollution.
Discussion
The results reveal that urban travelers do not form a single, homogeneous group in how they perceive air pollution or act on AQI. Instead, the three latent classes reflect distinct combinations of attitudes, socioeconomic conditions, trip structures and mode choices. This section discusses how these elements work together to shape responsiveness to AQI information and then outlines segment-specific policy directions.
Socioeconomic Mechanisms Underlying the Latent Classes
The three latent classes capture differences in awareness and differences in resources and constraints. As gender (Figure 7b), education (Figure 7c), occupation (Figure 7d), and income (Figure 7e) vary systematically across the classes, these patterns help to explain why they respond differently to poor air quality.
The low awareness and passive cohort is characterized by lower income, lower education, and a higher share of older individuals and respondents outside formal salaried employment. Their daily travel appears to be driven mainly by necessity and long-standing habits rather than active choice. Limited digital engagement and weaker understanding of AQI mean that they rarely seek out or use real time information. Even when they experience discomfort or health symptoms, they have few cues and few resources to connect those symptoms to air pollution or to change their behavior. Therefore, their passivity is rooted in informational disadvantage and resource constraints.
The aware but inactive cohort shows a different pattern. This segment contains many salaried workers and homemakers, generally in the middle-income range and with moderate to high education. Initially, combining these two socioeconomic groups may seem counterintuitive, because homemakers typically do not have a conventional office commute. However, in the Indian urban context, both groups often face similar structural conditions. Many salaried workers have fixed working hours and limited flexibility to change departure times or relocate closer to work. Homemakers may depend on household decisions about vehicle ownership and schedules, while also managing care work and school-related escort trips. In both cases, travel is embedded in dense household and work routines. These routines restrict their ability to change mode, route or timing, even though they are more aware of AQI and more likely to recognize health risks. Therefore, this class represents travelers who understand the problem but remain constrained in their ability to respond.
The proactive AQI responders differ markedly from the other two cohorts. They are typically younger, more highly educated, and more digitally engaged, with better access to higher-quality public transport and, in some cases, private vehicles. Their socioeconomic position gives them a broader set of options and more autonomy over when and how they travel. Therefore, they are more likely to monitor AQI, to link symptoms explicitly to air quality and to translate this information into concrete actions. Their behavior illustrates what happens when awareness, concern, and capability align. Taken together, the cohorts show that socioeconomic conditions shape who knows about air pollution and who can act on that knowledge. The same level of concern can lead to very different behaviors depending on income, education, occupational role, and household responsibilities.
Trip Characteristics and Structural Constraints
Trip characteristics provide a second layer of explanation. Figure 10 shows that the classes differ in trip purpose, frequency, distance and mode, and these patterns shape both exposure levels and the scope for adjustment. Travelers in the low awareness and passive cohort undertake a relatively high share of long-distance trips and often rely on exposed or semi-exposed modes, such as two-wheelers, auto-rickshaws, and cars. For these individuals, affordability, speed, and availability dominate their choices. When long distances combine with limited modal options, the opportunity to change routes or modes in response to AQI is very small, especially when real time information is seldom checked. Therefore, their exposure is high and largely unmanaged. In the aware but inactive cohort, trips are frequent and often linked to work, education, and household obligations. Distances are commonly medium to long, and buses and cars play a major role in their mobility. Daily schedules are tied to office hours, school timings, and domestic tasks, which reduces flexibility and restricts experimentation with cleaner routes or alternative modes. Although many in this group check AQI at least occasionally and report health symptoms, the financial and time costs of altering routines are perceived as high. Their behavior reflects structural rigidity rather than a lack of concern. The proactive AQI responders also include many regular and long-distance commuters; however, they combine this with greater use of the metro rail and a more deliberate mode choice. They are more likely to consult AQI before or during travel and to adjust their behavior when pollution levels are high. For example, they may choose metro rail instead of more exposed surface modes, modify departure times, or avoid particularly congested links. Even when distances are long, better access to reliable options gives them more control over exposure. These trip-level differences show that awareness alone cannot explain behavior. The structure of trips, time constraints, and the range of available modes interact with socioeconomic resources to determine what adjustments are feasible. A more thorough reading of the patterns also shows that inaction is not driven solely by informational or motivational gaps. Structural factors play a major role across the three classes. Limited availability of reliable public transport, long commuting distances, the dominance of exposed modes such as two-wheelers, and the layout of major corridors restrict the scope for cleaner or alternative routes. Affordability further constrains many travelers, particularly within the low awareness and passive class, where access to closed or higher-quality modes is limited by income and household resources. Gendered patterns also matter. Female travelers are less likely to use two-wheelers and often rely on shared or accompanied travel because of safety concerns, which narrows their modal flexibility. Similarly, homemakers and lower-income salaried workers carry household responsibilities that limit the freedom to shift departure times or take longer but cleaner routes. For these groups, behavior is shaped by structural and cultural constraints rather than a lack of awareness alone. These factors explain why segments with higher AQI recognition may still show limited behavioral adaptation despite understanding the risks. The class-specific patterns also align with key ideas in PMT and TPB. The PMT distinguishes between threat appraisal, which is how vulnerable individuals feel, and coping appraisal, which refers to their belief in the effectiveness of protective actions and their own ability to carry them out. The TPB emphasizes the role of behavioral intention and the importance of perceived control. Travelers in the low awareness and passive class show weak threat appraisal. Many do not fully understand AQI, do not link symptoms to pollution, and rarely check information or take protective action. These characteristics mirror low intention and limited perceived control in TPB. Even during poor air quality, low perceived vulnerability leads to minimal adaptation. The aware but inactive class shows a different mechanism. These travelers recognize the health risks and therefore score highly on threat appraisal, but their tight schedules and limited alternatives reduce their coping ability, which is central to PMT. Their restricted perceived behavioral control in TPB explains why awareness does not always lead to changes in mode or timing. The proactive AQI responders reflect the complete PMT sequence. They perceive greater vulnerability, believe in the value of protective actions, such as shifting modes or adjusting time, and feel capable of carrying them out because of better access to alternatives and higher digital engagement. Their approach also aligns with TPB because strong intention and high perceived control are visible in their behavior. The MNL findings support this pattern because frequent AQI checking, reported symptoms, and protective actions are associated with a preference for less exposed modes. Together, these theoretical links explain why the three classes differ in their responsiveness. The PMT and TPB suggest that risk perception alone does not lead to action. Behavioral change occurs when awareness, concern, capability, and access to options come together. The class structure and the mode choice results in this study illustrate how these mechanisms shape air quality-related travel behavior in Kolkata, India.
Behavioral and Policy Implications
Awareness, Capability, and the Gap Between Intention and Action
Across all three classes, the findings underline a persistent gap between knowing and doing. The proactive class illustrates the upper bound of what is possible when information, motivation, and alternatives come together: these travelers monitor the AQI, perceive risk, and adjust their travel. The aware but inactive class shows that even fairly high awareness does not guarantee change when structural and household constraints are tight. The low awareness and passive group sits at the other end of the spectrum, where air pollution is not yet perceived as a salient risk and exposure is treated as an unavoidable part of urban life. Recognizing where each class sits along this spectrum is critical for designing realistic interventions. Information campaigns on their own are unlikely to affect those who lack both awareness and options. In contrast, improvements in infrastructure or service quality may not reach their full potential if travelers do not receive or understand AQI information at the right time.
Segment-Specific Policy Directions
The latent classes point toward differentiated policy strategies rather than a single universal solution. For the low awareness and passive class, the very foundational aspect of risk communication is essential. Locally relevant AQI messages, delivered through community channels, public displays, and mass media, can help people connect pollution levels with symptoms and long-term health risks. These efforts should be accompanied by improvements in affordable, lower-exposure options, such as cleaner bus fleets and safer walking and cycling links, so that greater concern is matched by realistic alternatives. For the aware but inactive class, policy needs to focus on lowering structural barriers. Priorities include enhancing the reliability and comfort of public and shared modes, improving access to stations and stops, and reducing transfer penalties on key commuting corridors. Measures that expand schedule flexibility, such as staggered work hours, flexible work arrangements or better coordination of school and office timings, can increase the practical room for change among salaried workers and homemakers juggling multiple responsibilities. The proactive AQI responders are ready to make use of more advanced tools. For this group, integrating exposure metrics directly into journey-planning platforms and multimodal routing applications can support low-exposure route choice alongside time and cost. Targeted alerts during high-pollution episodes can encourage them to postpone nonessential trips, switch from more exposed modes to the metro or other closed modes, or choose cleaner corridors where possible. Although these tools initially benefit digitally connected users, they can serve as prototypes for broader exposure-aware mobility systems.
Overall, this study suggests that effective policies must combine better information, improved infrastructure and services, and explicit attention to the everyday constraints that different groups face. Only by addressing both awareness and capability can interventions reduce exposure in ways that are behaviorally realistic and socially equitable.
Conclusion
This study examined how urban travelers respond to air pollution by combining LCCA with MNL modeling. By jointly examining exposure-related awareness, attitudinal differences, and revealed travel choices, the analysis provides empirical evidence on how travelers adjust, or fail to adjust, their mobility decisions in polluted urban settings. Three distinct traveler groups emerged: (1) low awareness and passive; (2) aware but inactive; and (3) proactive AQI responders, each reflecting different levels of engagement, access to information, and behavioral capacity. The findings demonstrate that responses to air quality are neither uniform nor linear, underscoring the importance of segment-specific strategies when designing risk communication and exposure-mitigation measures in urban transport systems. The MNL results depict that air quality awareness, access to real time information, and protective actions significantly influence travel mode decisions. Travelers who regularly check AQI on websites or mobile apps were more likely to avoid exposed modes, such as two-wheelers, and shift to safer or more controlled environments. Those who reported changing their travel mode or time in response to pollution were also more likely to prefer options such as public transport or a car, indicating a direct behavioral response to perceived risk. In contrast, individuals who rely on static or delayed sources such as newspapers or television showed weaker associations with protective travel decisions, suggesting that real time accessibility plays a key role. Of interest, some variables exhibited opposing effects across modes, suggesting a nuanced trade-off among information access, convenience, and perceived exposure. Sociodemographic factors, such as income and education, were strongly associated with mode choice. Lower-income travelers were more likely to use highly exposed modes, particularly two-wheelers, and had a significantly lower likelihood of shifting away from these options. Education showed a similar pattern, with higher-qualified individuals displaying greater sensitivity to AQI-related variables. Gender differences also emerged, especially in the two-wheeler segment, where female travelers were less likely to use this mode, possibly because of safety or exposure concerns.
Together, these results reinforce that access to information alone does not guarantee behavioral change. Aware but inactive individuals often have the knowledge but may face structural or contextual barriers that limit their ability to act. This group, in particular, represents a critical target for policy intervention. To make these implications actionable, the results indicate how each latent traveler segment aligns with a different intervention pathway. For individuals with low AQI awareness, simple and highly visible communication formats, including app-based prompts, public display boards, and intuitive color-coded risk scales, are likely to be most effective ( 25 , 32 , 51 ). Travelers who understand AQI but seldom modify their trips require measures that lower behavioral frictions, such as improving the reliability and perceived safety of public and shared modes, reducing transfer penalties, and creating low-exposure walking or cycling corridors ( 20 , 52 ). For proactive users who already rely on real time information, integrating exposure metrics into multimodal routing platforms, travel advisories, and public transport information systems can reinforce protective choices ( 33 ). These differentiated strategies directly support the design of targeted information campaigns, real time AQI communication systems, and equity-oriented mobility policies that collectively reduce exposure risk and promote safer urban travel choices.
Rather than relying on one-size-fits-all strategies, the findings point to the need for targeted, behaviorally informed measures. Strengthening real time AQI dissemination, offering flexible travel options, and improving trust in public data can help close the gap between awareness and action. Income and gender-sensitive planning, including infrastructure improvements and low-cost alternatives, can support vulnerable groups who currently face the highest exposure. This study is based on cross-sectional Revealed Preference (RP) data, limiting insights into behavioral change. Future work should use panel data and real time exposure tracking to capture dynamic responses. Incorporating Stated Preference (SP) scenarios can also help estimate mode shifts under future improvement strategies. In conclusion, this study provides new evidence on how differences in awareness, demographics, and trip patterns shape travel behavior in polluted urban settings. These insights can inform more equitable and responsive interventions aimed at reducing exposure and promoting safer travel choices across all population segments.
Footnotes
Author Contributions
The authors confirm the following contributions to the paper: study conception and design: Kapil Kumar Meena, Arkopal Kishore Goswami; data collection: Kapil Kumar Meena; analysis and interpretation of results: Kapil Kumar Meena, Arkopal Kishore Goswami; draft manuscript preparation: Kapil Kumar Meena, Arkopal Kishore Goswami. All authors reviewed the results and approved the final version of the manuscript.
Declaration of Conflicting Interests
The authors declared no potential conflicts of interest with respect to the research, authorship, and/or publication of this article.
Funding
The authors received no financial support for the research, authorship, and/or publication of this article.