
Abstract
Ultra-high-performance concrete (UHPC) is increasingly used in modern infrastructure because of its outstanding strength and durability, but accurately measuring its tensile behavior remains a significant challenge. Direct-tension testing using AASHTO T 397, particularly with a 220 kip wedge grip machine, has been documented to yield success rates as low as 36%. This paper addresses direct-tension testing challenges by evaluating non-proprietary UHPC mixtures with steel fiber dosages from 0.0% to 2.0% and silica fume contents of 9%, 12%, and 15% of total binder content, all tested at 28 days. Through a two-phase experimental program, this study covers improvements to specimen preparation, machine alignment, and grip pressure. These refinements increased the test success rate to 75% with the same testing equipment. The results show that the amount of fiber is the primary factor influencing tensile strength and post-cracking performance of UHPC, while moderate changes in silica fume content have only a minor effect. This study provides a practical and repeatable test protocol for direct-tension evaluation and demonstrates that optimizing fiber dosage is essential to achieve the desirable tensile behavior of UHPC. The proposed approach enables confident material selection and promotes wider use of UHPC.
Keywords
Introduction
Concrete has historically served as a reliable material for civil infrastructure, meeting established structural and durability demands. However, changing infrastructure needs and increasingly severe environmental conditions have highlighted some limitations in conventional concrete, especially concerning its tensile strength and crack resistance capabilities. This has driven research toward developing advanced concrete materials capable of better performance under these demanding conditions. One prominent solution is ultra-high-performance concrete (UHPC), which is characterized by its significantly improved tensile strength and post-cracking behavior, compared with conventional concrete. Specifically, UHPC’s enhanced tensile strength and crack control capability significantly increases its durability, making it particularly effective in structures experiencing high tensile stresses and repeated load cycles.
The formulation of UHPC includes a carefully selected blend of cementitious materials, fine aggregates, water, chemical admixtures, and fibers. ASTM C1856 ( 1 ), classifies UHPC based on its exceptional compressive strength, exceeding 17,000 pounds per square inch (psi), and small aggregate size, typically less than 0.25 in. UHPC formulations combine optimized particle packing, self-consolidating properties, and fiber reinforcement to achieve exceptional strength and ductility ( 2 , 3 ).
Historically, proprietary UHPC formulations have predominantly been used in structural applications, such as bridge joint closures ( 4 ), overlays ( 5 ), and large-scale structures ( 6 ). However, non-proprietary UHPC mixtures have emerged as viable alternatives to proprietary UHPC formulations ( 7 – 9 ), owing to their potential for significant cost savings and customizable performance. Unlike proprietary formulations, non-proprietary mixtures offer greater flexibility in optimizing mechanical and durability characteristics tailored specifically to project requirements while ensuring economic feasibility. This adaptability promotes broader accessibility and encourages the widespread adoption of UHPC technology across diverse structural applications.
Within UHPC compositions, binder materials and their particle packing play a role in enhancing both mechanical and durability properties. Wille et al. ( 10 ) determined the ideal mixture to include cement of moderate fineness, silica fume (up to 25% of cement weight), and steel fibers as required by volume, and to have a low water-to-cement ratio (0.16–0.27). By optimizing particle packing and minimizing the void content through low water-to-cement ratios, UHPC can reach compressive strengths well above those of conventional concrete. The inclusion of supplementary cementing materials (SCMs), particularly silica fume, enhances the cementitious matrix by densifying the microstructure, reducing porosity, and improving overall strength and durability. Despite its high compressive strength, UHPC’s broader appeal in structural applications hinges on its increased tensile behavior, which depends heavily on fiber reinforcement and an optimally packed cementitious matrix ( 11 ).
Fiber reinforcement, particularly steel fibers, significantly contributes to UHPC’s superior tensile strength and post-cracking properties ( 12 ). Steel fibers enhance ductility and effectively bridge developing micro-cracks, delaying macro-crack propagation and enabling strain-hardening behavior ( 13 ). Common dosages of steel fibers for structures are at percentage volumes greater than 0% and less than 4% ( 14 – 16 ). Excessive fiber content can impair mixture workability, necessitating precise dosage control to maximize performance benefits without compromising practical constructability. Consequently, achieving the desired level of post-cracking behavior and strength in UHPC involves balancing the steel fiber type and amount with the demands of the intended application.
The introduction of fibers in UHPC opens new avenues for structural design, allowing for thinner, lighter structural elements with reduced reinforcement requirements ( 17 ). The fibers not only distribute stress across multiple micro-cracks but also enable autogenous healing of the cementitious matrix under favorable environmental conditions ( 18 ). This capability significantly extends service life and reduces maintenance demands, making UHPC especially valuable for critical infrastructure exposed to severe environmental conditions or substantial tensile loads.
Tension Testing Methods for UHPC
Despite UHPC’s advantages, accurately characterizing its tensile behavior remains challenging. Direct-tension testing provides the most reliable stress–strain measurements without complex back-calculations ( 19 ). However, practical difficulties with specimen geometry and gripping have historically yielded success rates as low as 36% ( 13 ). Consequently, alternative methods have been employed, despite their limitations in accurately capturing UHPC’s tensile behavior.
Each method exhibits distinct advantages and drawbacks, largely concerning data interpretation, complexity in execution, and relevance to real-world structural performance. Indirect-tension methods include the splitting tensile test ( 19 ), flexural test ( 20 ), double-punch test ( 21 ), and briquette mortar test ( 19 ).
Direct-tension testing is thus preferred theoretically, but specimen geometry and gripping present practical barriers. While dog-bone specimens have been explored ( 22 ), they cannot be extracted from field-cast members and introduce stress concentrations that can trigger premature failure, limiting their ability to accurately reflect fiber interaction and material tensile capacity ( 23 ).
Direct-Tension Test Method for UHPC: AASHTO T 397
To address these limitations, AASHTO introduced the AASHTO T 397 standard ( 24 ) to provide a consistent, direct method for assessing UHPC tensile properties. By testing prismatic specimens under uniaxial tension, this standardized procedure enables direct stress–strain measurements without complex analytical computations and clearly distinguishes elastic and post-cracking responses. The test directly identifies whether the material exhibits strain-hardening or strain-softening behavior and generates critical post-cracking metrics, including effective cracking stress (ft,cr), peak stress (ft,peak), localization stress (ft,loc), and localization strain (εt,loc). Figure 1 shows a typical UHPC stress–strain response, with these parameters labeled.
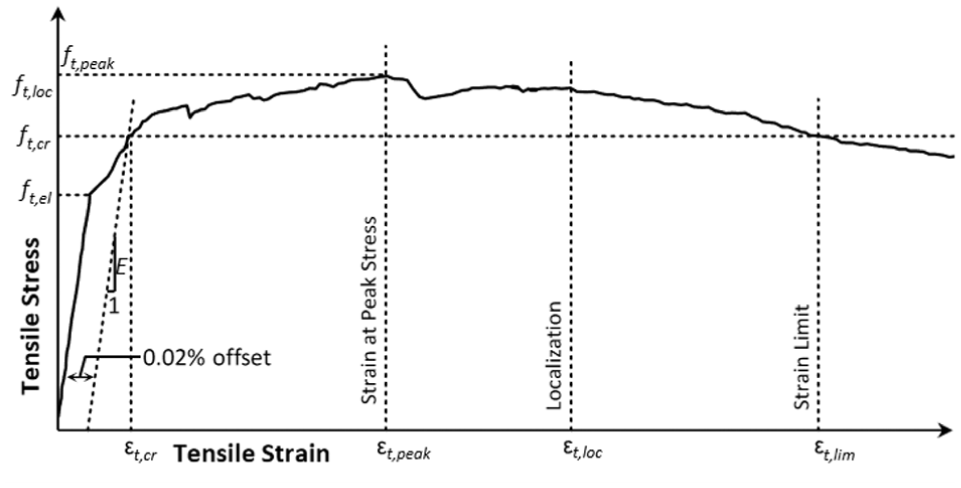
Typical stress–strain graph of ultra-high-performance concrete ( 24 ).
The effective cracking stress (ft,cr), also referred to as the post-cracking strength, is determined using a 0.02% strain offset method ( 25 ) and represents the tensile capacity immediately following initial matrix cracking. For UHPC qualification, the FHWA requires that this post-cracking strength (ft,cr) be at least 750 psi and the localization strain (εt,loc) be at least 0.0025 ( 25 ). AASHTO T 397 thus provides a consistent framework to optimize UHPC formulations and verify compliance with FHWA performance requirements for structural applications.
Practical Implementation of AASHTO T 397
The AASHTO T 397 standard provides a detailed procedure for evaluating the direct-tensile response of UHPC, covering specimen fabrication, transfer plate installation, and loading protocols. However, for the purpose of this study, the focus is placed on two key elements that directly affect test reliability: specimen preparation and test setup. Specimen preparation involves bonding aluminum or G-10 fiberglass transfer plates to the specimen ends using high-strength, high-modulus epoxy to ensure uniform stress transfer during gripping. Proper surface preparation and full epoxy curing are essential for adequate bond strength; typically three C-clamps are applied, at the top, middle, and tapered sections of the aluminum plates, respectively. Optimal epoxy curing schedules vary, depending on specimen curing protocols; for example, some researchers affixed transfer plates 10 days before testing ( 26 ), whereas others applied them closer to the test date ( 25 ).
Following proper curing, specimens are instrumented with extensometers mounted on parallel rings to accurately measure strain over the gauge length. Before testing, the alignment of the test machine must be verified to minimize eccentric loading effects that could compromise test validity. Specimens are seated with an initial compression loading, followed by controlled tensile loading at a prescribed displacement rate of 0.006 in./min ( 24 ). Successful test outcomes require localization of failure within the gauge length region. Despite following the procedures, practical challenges have been documented, and these will be discussed in the next section.
Direct-Tension Test Challenges Documented in the Literature
Some challenges have been documented in the literature published so far on this test method. One prevalent issue relates to aluminum plate delamination in the tapered section of the direct-tension specimen. Before the publication of AASHTO T 397, Riding et al. ( 27 ) identified delamination as a major issue, attributing it to local stress concentrations that caused the plates to detach under loading. Initial attempts to resolve this problem involved using C-clamps at the tapered section during testing ( 27 ). Subsequent literature after the release of AASHTO T 397 suggests that this issue has largely been addressed through enhanced cleaning, improved clamping procedures, and controlled gripping pressures.
Another challenge is the occurrence of specimen failure outside the intended gauge length. While material inconsistencies, such as fiber segregation, can contribute to premature failure, bending effects from eccentric loading remain the dominant cause of failure outside the gauge length. To mitigate this, Sritharan and Gali ( 28 ) recommended the use of C-clamps at the bottom ends of the tapered aluminum plates. However, even with this modification, success rates remained low, with Sritharan and Gali ( 28 ) reporting only a 50% likelihood of achieving valid failures within the gauge length. The significance of proper setup is further demonstrated by Gali and Sritharan ( 13 ), who observed a success rate of just 36.6% when employing a 220 kip wedge grip machine, in contrast with a substantially improved success rate of 73.3% when using a lower-capacity 110 kip machine.
Given these documented challenges, this research is a systematic investigation of non-proprietary UHPC formulations using a structured two-phase approach. The first phase involves evaluating various steel fiber dosages to identify the required content to meet the FHWA requirement and document specific testing challenges. In the second phase, identified improvements to the direct-tension test are implemented to validate their effectiveness by testing different silica fume contents at a fixed steel fiber dosage. Ultimately, the goal is to significantly enhance test reliability using the 220 kip wedge grip machine and facilitate accurate and reliable tensile characterization of UHPC. The aim is to deliver practical recommendations that testing laboratories, state agencies, and federal agencies can readily adopt to enhance the reliability of direct-tension testing of UHPC.
Experimental Work
General
The experimental program was developed to address the challenges identified with the AASHTO T 397 test and to propose effective solutions, while concurrently investigating the influence of various constituent materials on the tensile behavior of non-proprietary UHPC. Consequently, the study was structured in two distinct phases. Phase one was aimed at evaluating the influence of steel fiber dosage on the tensile performance of UHPC, identifying successes and challenges during testing. Insights gained from this initial phase informed phase two, which was dedicated to assessing the effects of additional constituent variations while integrating an improved testing framework to achieve higher test success rates.
Specifically, experimental trials covered seven steel fiber dosage levels (0%, 0.50%, 1.00%, 1.25%, 1.50%, 1.75%, and 2.00% of the total volume). From the fiber dosage results, an effective dosage of 1.5% was selected to prevent the post-cracking strength from dropping below the FHWA cutoff of 750 psi effective post-cracking strength. Subsequently, the silica fume content was varied at levels of 9%, 12%, and 15% of the total binder content to investigate its influence further. Silica fume content was selected as a variable because of its documented role in densifying the cementitious matrix ( 29 ). Each mixture was considered acceptable if it achieved a flow within the range of 7 to 11 in., using a method adopted from ( 1 ) and ( 30 ). From these batches, prismatic samples were tested in direct tension at 28 days. After initial evaluations, adjustments and equipment enhancements were implemented to significantly improve test success rates.
Materials and Sample Preparation
By definition, UHPC is not restricted to a single formulation but must meet specific performance criteria, as outlined by American Concrete Institute (ACI) Committee 239 ( 31 ) or the FHWA ( 6 ). Table 1 presents the mixture proportions employed in this study. The baseline mixture proportion was adapted from Abokifa and Moustafa ( 32 ), with modifications to silica fume content to evaluate its influence on tensile behavior. Mixtures designated P-1 represent phase one, where steel fiber content varied from 0% to 2.00%. The fine aggregate used in this study meets ASTM C33 ( 33 ), and was adjusted in relation to the changes in steel fiber content to yield the desired volume. Additional high-range water-reducer admixture (HRWRA) was added as necessary to maintain workability, while consistently preserving a water-to-binder ratio of 0.19. Mixtures labeled P-2 represent phase two, wherein the steel fiber dosage was held constant at 1.50%, and silica fume content was varied within the binder, and the slag cement was adjusted to maintain a constant paste volume at a water-to-binder ratio of 0.20.
The smooth straight steel fibers used had an aspect ratio of 65, a diameter of 0.2 mm, a length of 13 mm, and a tensile strength of 440 kips per square inch (ksi). A planetary high-shear mixer was employed for batching, using the following sequence.
Fine aggregate and silica fume were added and mixed for 5 min.
Cement and slag cement were added, with mixing continued for an additional 5 min.
Eighty percent of the total mixing water, combined with the hydration controlling admixture (HCA), was incorporated and mixed for 3 min.
The remaining 20% of the water, along with HRWRA, was added, and mixing proceeded for an additional 5 to 15 min until the desired fluidity was achieved.
Steel fibers, when applicable, were added and mixed for another 5 min to ensure uniform fiber dispersion.
Mixture Proportions Used in the Study
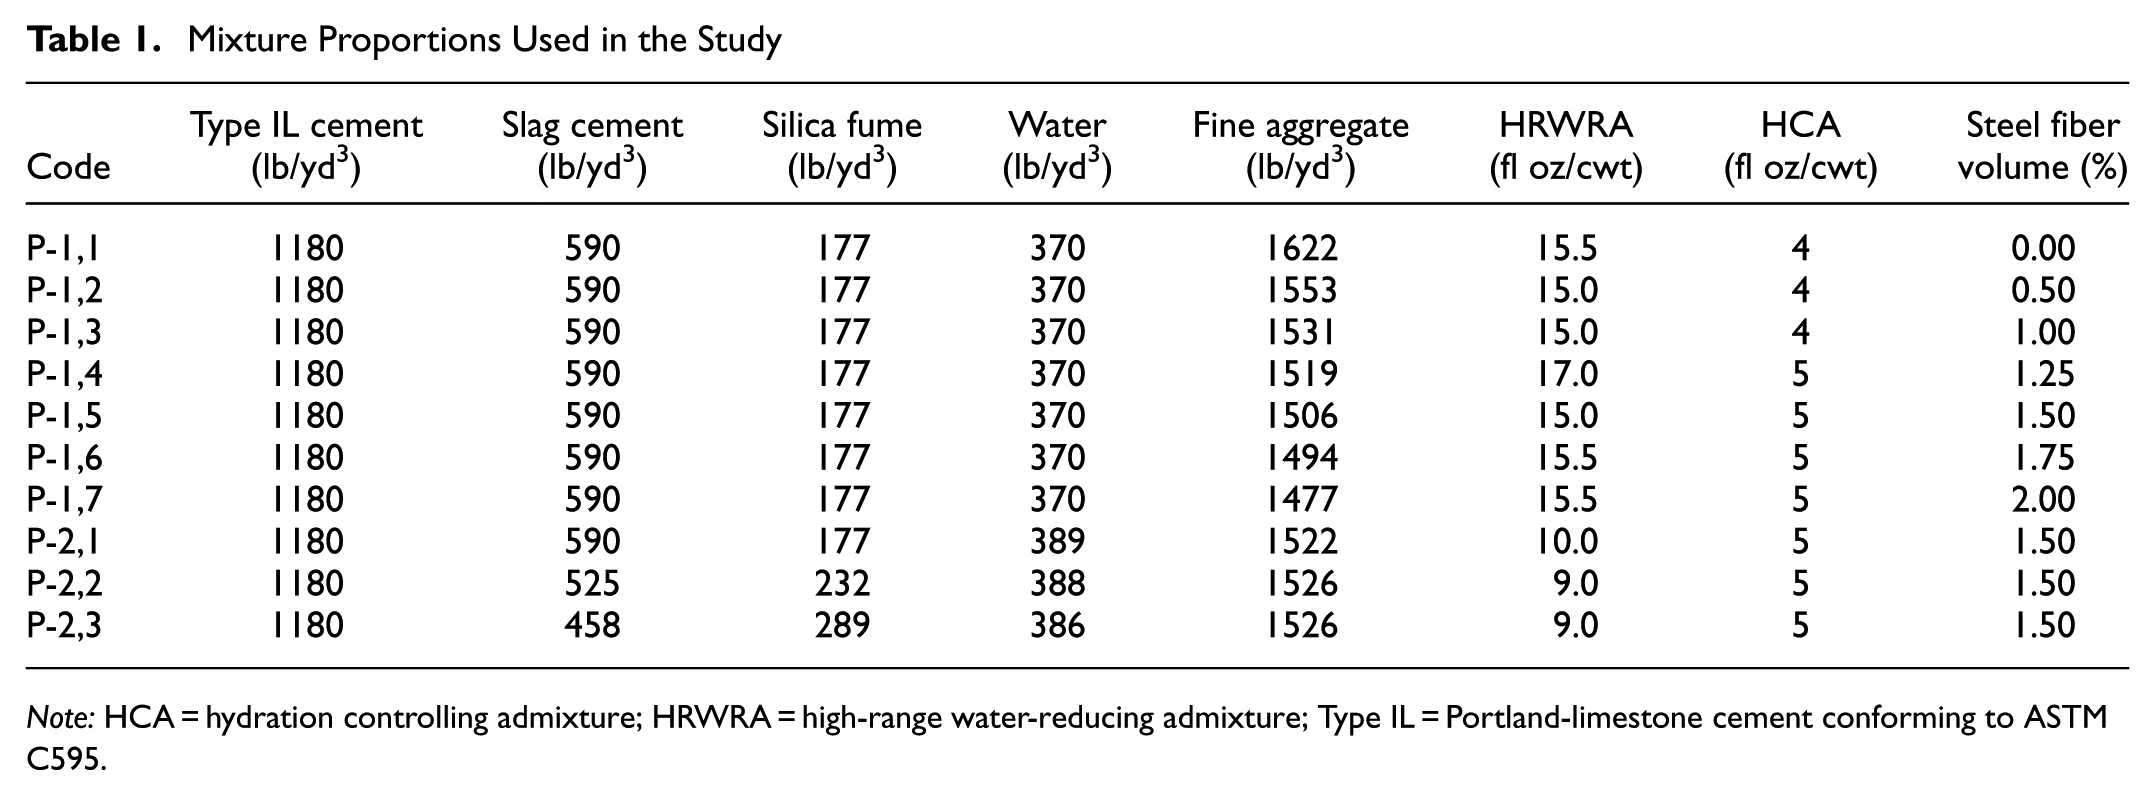
Note: HCA = hydration controlling admixture; HRWRA = high-range water-reducing admixture; Type IL = Portland-limestone cement conforming to ASTM C595.
After mixing, a flow test according to ASTM C1856 ( 1 ) was performed. Only batches meeting the specified flow criteria were deemed acceptable. The approved mixtures were cast in prismatic steel molds measuring 2 in. by 2 in. in cross-section and 17 in. in length. Without the HCA, the workability of the UHPC was not retained long enough to allow placement in all the molds. UHPC was introduced at one end of the mold and allowed to flow to the opposite end. A rubber mallet was then used to tap the mold sides (30 taps) to remove entrapped air.
After casting, specimens were cured in a moist-curing room at 73.5 ± 3.5°F for 24 h. Following demolding, the specimens continued curing in the moist-curing room until preparation started for testing at 28 days.
Test Setup and Procedure
Between 12 and 24 h before testing, specimens were removed from the curing room, and aluminum plates were bonded to both ends with a thin layer of epoxy. These plates facilitated stress transfer during tensile testing. The specimens then remained at laboratory temperature for the remainder of the 12–24 h period, allowing the epoxy to reach adequate strength before testing.
Testing was conducted using a servo-hydraulic universal testing machine with wedge grips capable of applying tensile loads up to 220 kips, as shown in Figure 2. Although lower-capacity flat grip machines have been recommended by researchers ( 20 , 30 ) to minimize eccentricity, an available 220 kip wedge grip machine was utilized in this study. The anticipated eccentricities and potential for lower success rates were accounted for by developing practical mitigation strategies.
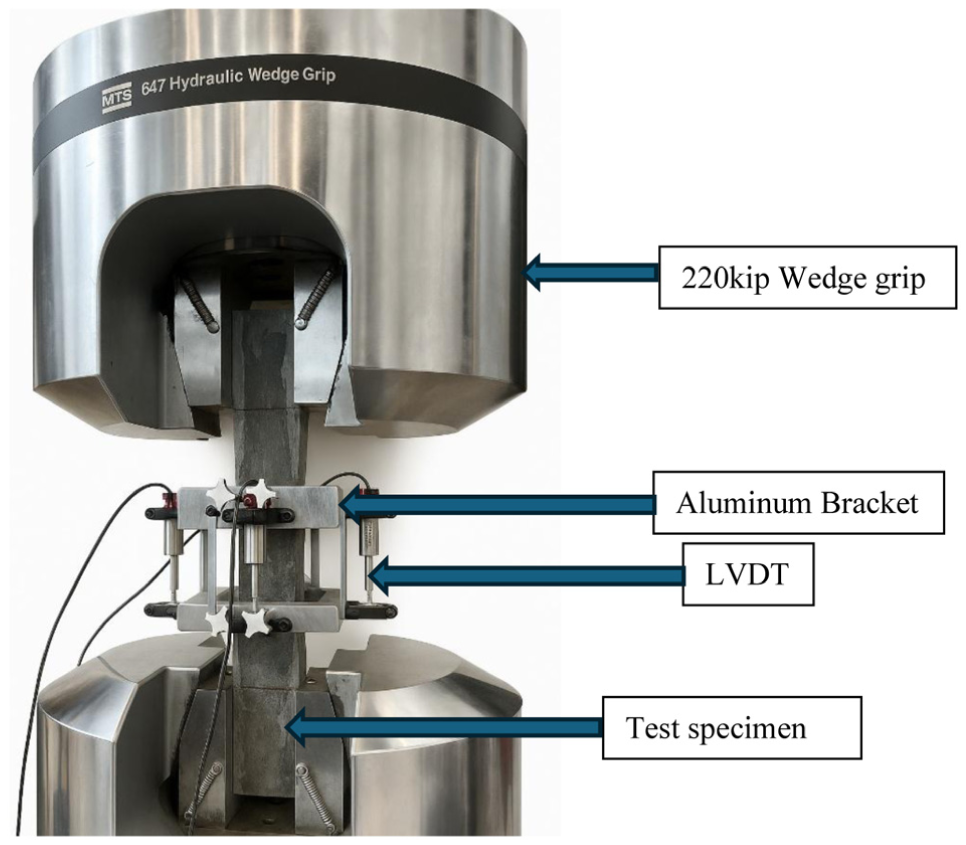
The tensile test setup used in this study.
For stress–strain measurements, linear variable displacement transducers (LVDTs) were mounted on aluminum brackets attached to each specimen face, ensuring a consistent gauge length of 4 in. The specimens were initially loaded in compression to 1 ksi to adequately seat the grips. Subsequently, a constant crosshead displacement rate of 0.006 in./min was applied to perform the tensile test until the specimen load dropped to 50% of the peak tensile load.
Data were collected at 10 Hz, capturing force and displacement readings from the LVDTs. The strain was calculated as the average displacement from the four LVDTs divided by the gauge length, and the stress was calculated by dividing the recorded load by the cross-sectional area of the specimen. From the resulting stress–strain plots, critical tensile parameters were determined in accordance with AASHTO T 397, including effective cracking stress, peak stress, localization stress, and localization strain. The localization strain (εt,loc) was determined according to AASHTO T 397 Section X5.2.11 by visual assessment of the stress–strain response, identifying the point at which stress began to decrease continuously without recovery. For several valid test specimens, mean values for these parameters were calculated.
Results and Discussion
The objectives of the direct-tension tests were twofold: firstly, to evaluate how varying constituents, specifically steel fiber and silica fume dosages, influenced the tensile response of UHPC and, secondly, to establish a reliable test sequence to significantly improve the success rate of using the 220 kip wedge grip machine. Throughout this work, a successful test is defined as one in which crack localization occurred within the gauge length region, in accordance with AASHTO T 397.
Phase One: Influence of Fiber Dosage on Tensile Response
Figure 3 shows the tensile stress–strain responses at steel fiber dosages from 0.50% to 2.00%. Each fiber dosage group included four to six specimens, with at least three successful tests targeted. For fiber dosages 1.00%, 1.25%, 1.50%, and 1.75%, three or more successful tests were achieved and the means plotted. However, for 0.50% and 2.00%, only two successful tests and one successful test were achieved, respectively.
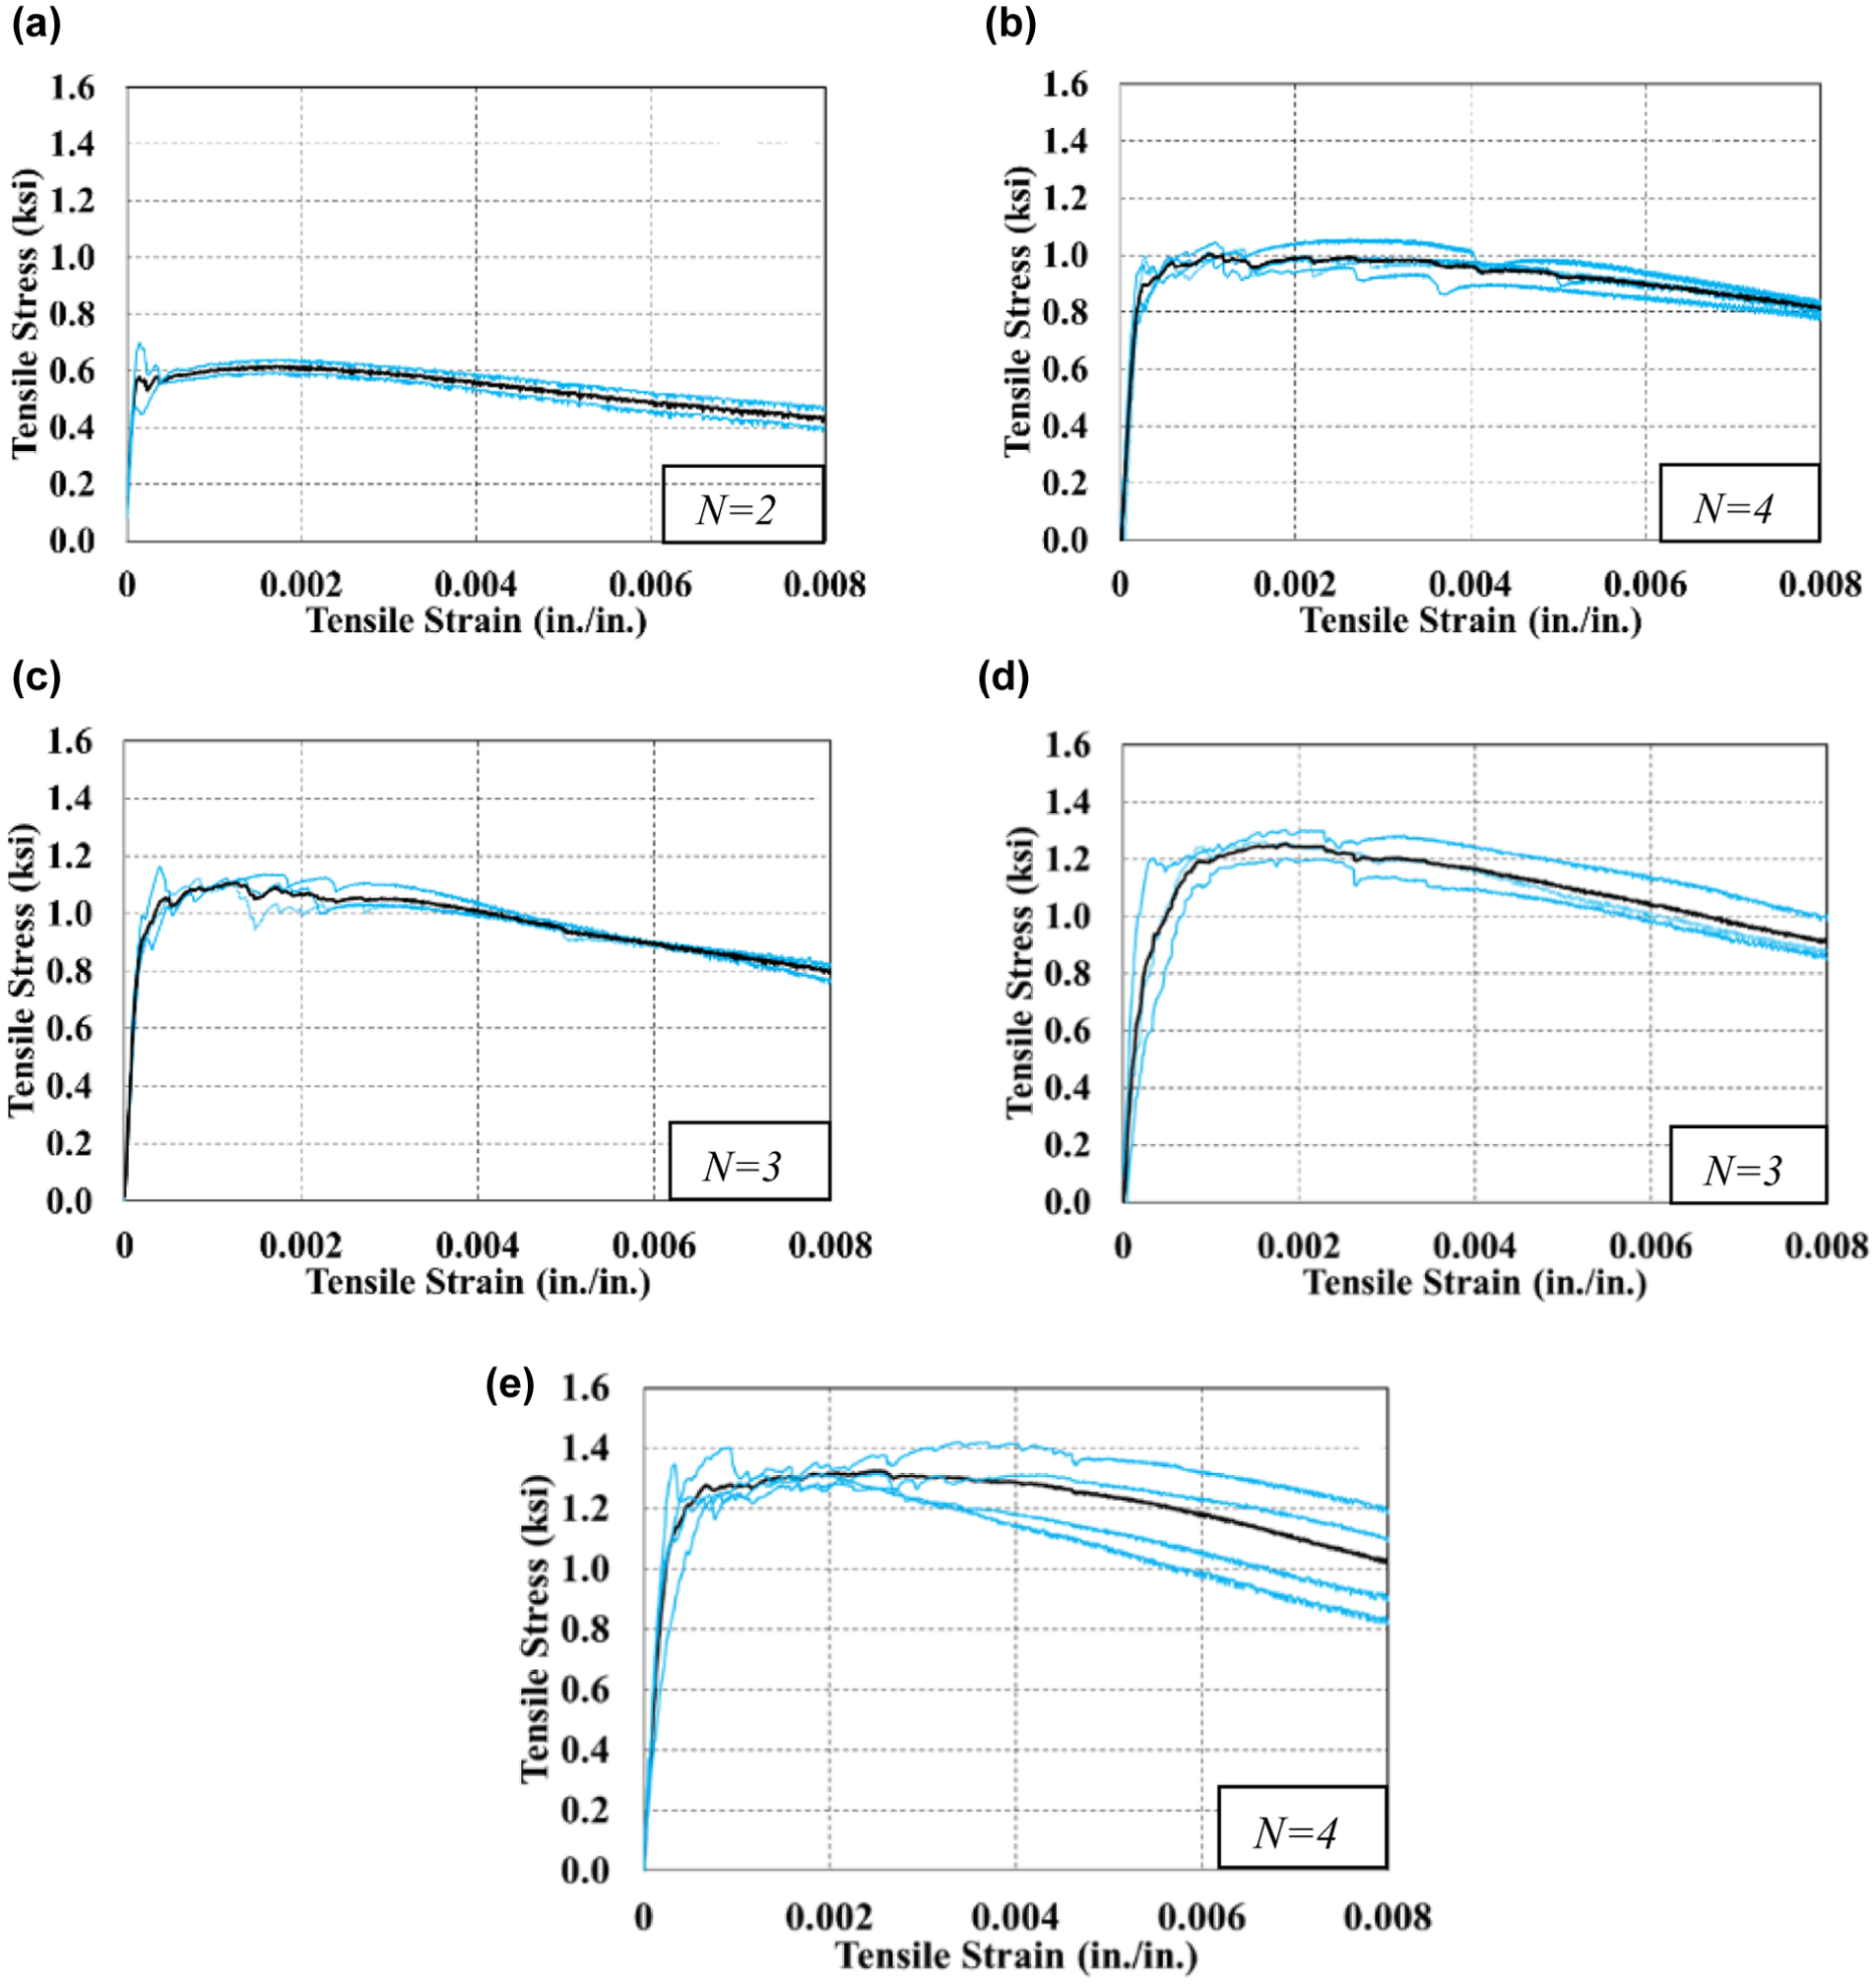
Tensile stress–strain response of ultra-high-performance concrete at various fiber dosages: (a) 0.50%; (b) 1.00%; (c) 1.25%; (d) 1.50%; (e) 1.75%. Blue lines represent individual specimens, and the mean is the black line.
Figure 4 summarizes the mean response across all steel fiber dosages. Results show a clear trend of increasing tensile performance with increasing fiber content. Notably, all dosages greater than or equal to 1.00% surpass the FHWA post-cracking strength threshold (750 psi), with associated localization strains above the 0.0025 FHWA minimum. This is consistent with results by others ( 26 ), which show that 1% straight steel fibers were adequate in meeting the minimum FHWA requirement for UHPC.
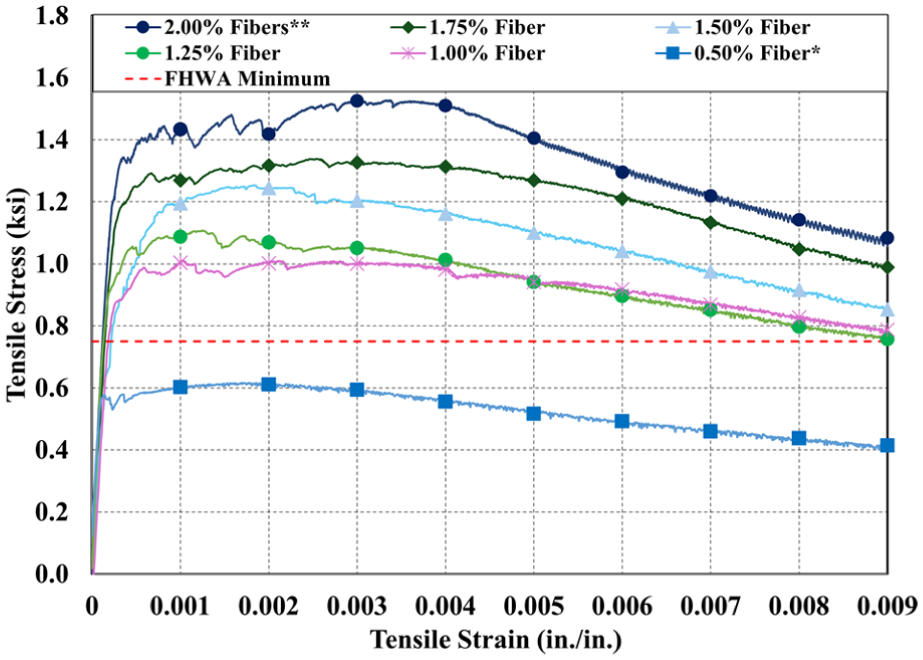
Average stress–strain response of ultra-high-performance concrete.
Challenges Encountered during Testing
Several practical issues emerged that substantially affected testing outcomes. Primarily, three key issues were identified.
Geometric tolerances of formed specimens. During specimen preparation, tapping the vertical sides of the steel molds with a mallet, though intended to eliminate entrapped air, introduced slight geometric deviations along the specimen sides. This defect (however little) caused misalignment of the grip during testing and resulted in crushing of the UHPC at the grip location. As a result, this localized crushing of the UHPC caused failure either within the transfer plate region or at the tip of the transfer plate.
Crosshead misalignment. Given the sensitivity of direct-tension tests to eccentric loading, slight crosshead displacement during grip tightening often induced bending stresses, precipitating failure outside the gauge length.
Excessive grip pressure. High grip pressures from the wedge grips often resulted in aluminum plate delamination, crack initiation within grips, or specimen failure outside the targeted gauge length region, thereby reducing the number of viable tests.
On finalizing the most ideal test sequence with the wedge grips and building on the data from phase one, the testing solutions covered in the next section were used.
Solution to Testing Challenges
Aluminum Plate Delamination
To address the issue of aluminum plate delamination, the following steps were taken.
The surfaces of the UHPC sample were smoothed using a steel file.
A damp paper towel was used to dust off and clean the formed surface of the UHPC sample.
An aluminum-safe degreaser was sprayed onto the aluminum plates and formed surfaces, and both plates and UHPC sample surfaces were subsequently cleaned using a dry paper towel.
A thin, uniform layer of epoxy was applied to the cleaned formed surfaces of the UHPC sample (see Figure A-1a in the supplemental material).
A similarly thin and even layer of epoxy was also applied to the aluminum plates.
Each aluminum plate was then carefully positioned and clamped at three locations to ensure uniform distribution of clamping pressure (see Figure A-1b in the supplemental material).
The epoxy was allowed to cure adequately for 12 to 24 h at laboratory temperatures, to ensure adequate bonding before testing.
Geometric Tolerances of Formed Specimens
The small size and geometry of the UHPC prisms made them susceptible to slight deviations during molding of the specimens. Even controlled tapping along the upper vertical sections of the mold caused minor deformations, often visible as non-perpendicular edges. This subtle defect introduced misalignment at the grips, leading to eccentric loading and failures within or near the transfer plate region. To minimize this, tapping was limited to the lower sections of the mold, where the geometry was more stable, and mold screws were further tightened. Although vibrating tables have been recommended by some researchers ( 30 , 34 ), these were avoided because of concerns about potential fiber settlement.
Eccentricity and Bending-Induced Loading Misalignment
Eccentricity and bending-induced loading, often leading to specimen failures outside the gauge length region, were significant issues identified during testing. This challenge was attributed primarily to the wedge grips and crosshead misalignment. Ideally, the grips should apply sufficient pressure with minimal or no axial load, as specified in AASHTO T 397 X3.1.5 ( 24 ). This specification recommends checking the alignment of the testing machine before installing the deformation measurement device and placing the specimen in the machine. However, misalignment was often observed after the bottom grip was tightened, followed by tightening the top grip. Each time the top grip was tightened, the top crosshead rotated slightly, often leading to failure outside the gauge length region or a type H-4 response, corresponding to bending-induced deformation.
Gripping Sequence to Minimize Eccentricity
To address this issue, a new systematic gripping sequence was developed, as follows.
Aligning the deformation measuring device. To achieve precise perpendicular alignment of the parallel ring extensometer to the specimen, custom-cut wooden platforms were utilized as supports during installation, as seen in Figure A-2 in the supplemental material.
Positioning the specimen in the testing machine. The specimen alignment within the bottom grip was facilitated by placing a wooden spacer block and metal disk beneath the specimen (see Figure A-3 in the supplemental material).
Aligning the top crosshead and confirming alignment. With the top grip lowered and the machine in force-control mode, careful alignment of the top and bottom crossheads was verified using a plumb line. Once aligned, the gauge length strap for the parallel ring extensometer was removed.
Initiating the gripping sequence. The gripping sequence comprised the following steps. a. The gripping speed controller was set to its slowest rate by fully rotating the knob clockwise; this reduces the speed (see Figure A-4 in the supplemental material). b. Subsequently, the gripping speed controller was turned 360° counterclockwise, establishing the final slow gripping speed. Note that this can be done at the start of the test, and altering is not required thereafter. c. The grip pressure knobs were also turned counterclockwise to their slowest rate, to reduce the grip tightening speed to its slowest setting. d. The top wedge grip was partially closed, allowing slight vertical adjustment of the specimen. (Note: once the grip valve has been tightened clockwise, because the grip pressure is reduced to a minimum, it takes a few seconds for the grips to close.) e. The bottom grip valve was then closed, pushing the specimen upward and aligning it vertically. The tightening speed control remained untouched. f. Before completely tightening the top grip, alignment of the crossheads was confirmed again, and the bottom grip was slightly released to prevent rotation of the top crosshead. This rotation was found to be a major cause of eccentric loads, which cause failure outside the gauge length. g. The top grip was then fully tightened. h. The metal disk between the bottom grip was removed, and the recording from the LVDT initiated (Note: a flat tool to push out the disk was found effective.) i. The bottom grip valve was then closed to complete the alignment sequence (see Figure A-4 in the supplemental material). j. With both grips firmly secured, the grip pressure was incrementally increased to between 500 and 800 psi, ensuring sufficient pressure without inducing unwanted bending stress or crushing of the specimen (see Figure A-5 in the supplemental material).
Testing.
After proper alignment and gripping, specimens were loaded to failure, as shown in Figure 5. With these changes, failures occurred much more frequently within the gauge length region.
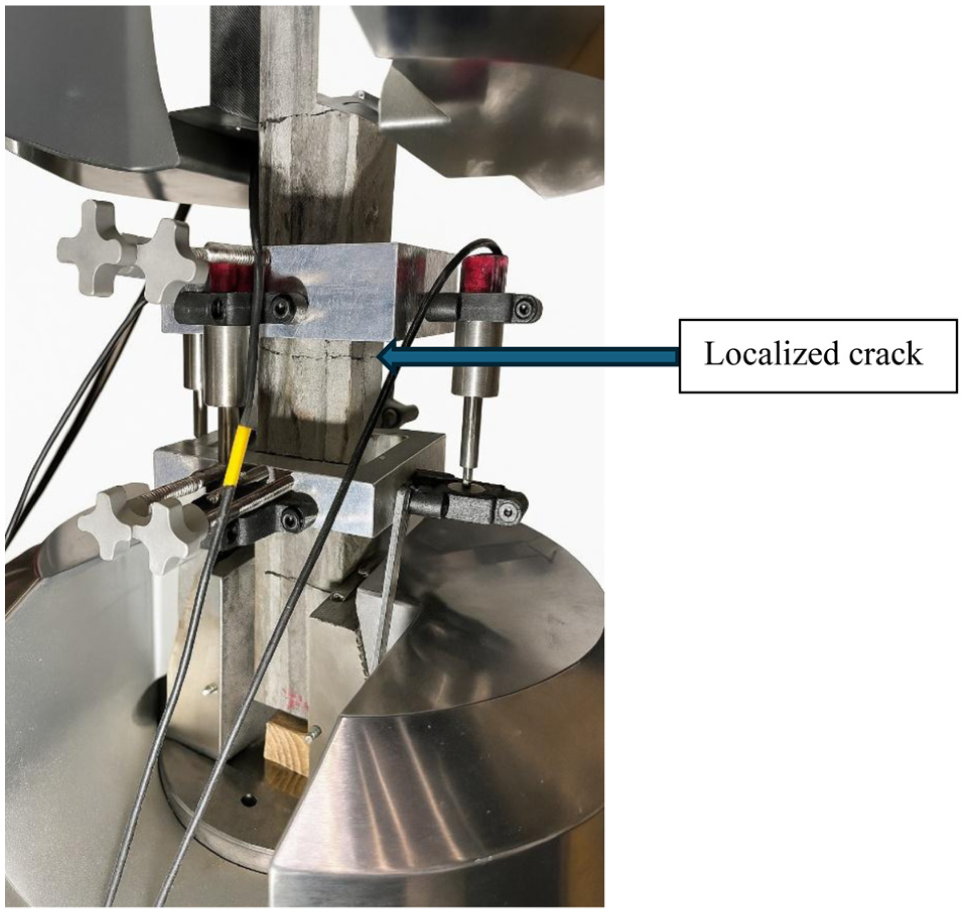
An acceptable failure within the gauge length region.
This systematic gripping and alignment procedure significantly improved test reliability and accuracy, ensuring consistent specimen failures within the designated gauge length region. A quantified improvement of the test is covered next.
Quantitative Improvement with Progressive Test Refinements
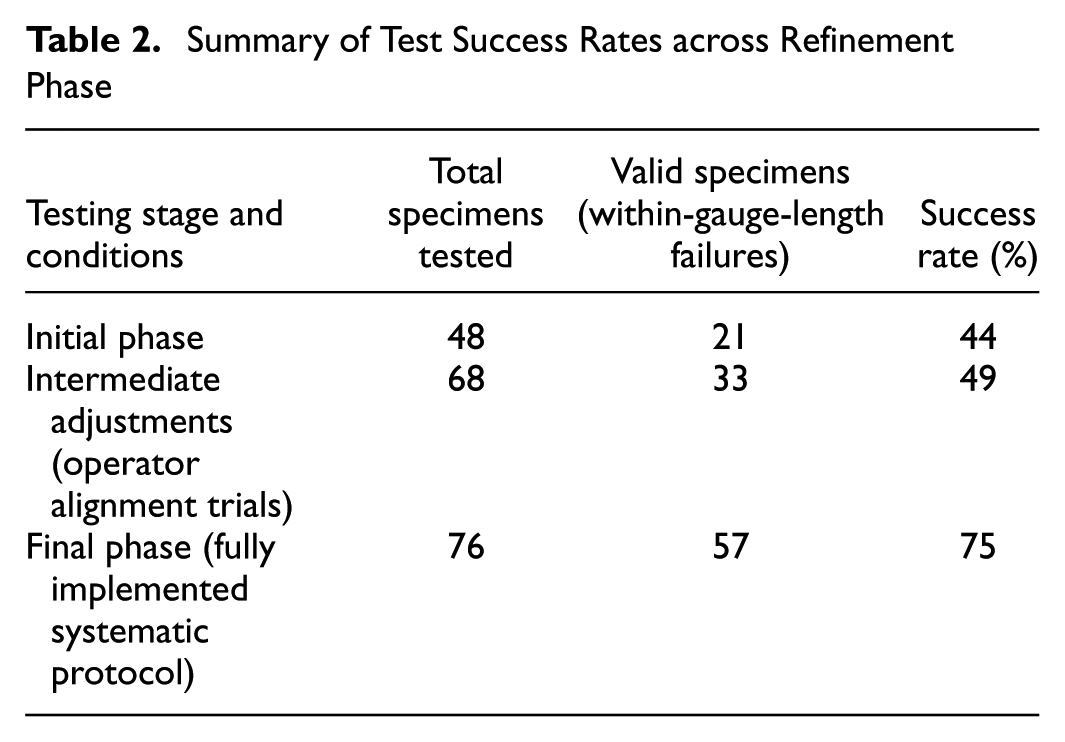
To quantify the effectiveness of the implemented testing refinements, success rates throughout the experimental program were recorded and analyzed. The progressive implementation of these improvements resulted in significant increases in test reliability, as shown in Figure 6 and summarized in Table 2.
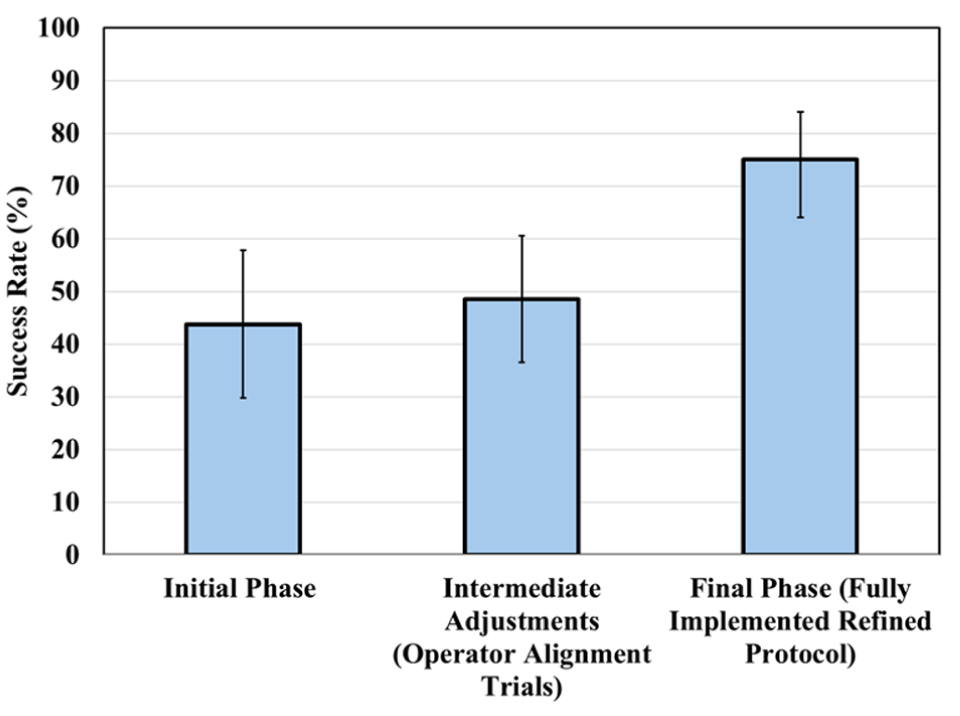
Incremental improvements in success rates across testing refinement phases. Error bars represent 95% confidence intervals ( 35 ).
Summary of Test Success Rates across Refinement Phase
Given the ordered nature of the testing phases (initial, intermediate, then final), a linear trend test for ordinal data was employed to assess systematic improvement across protocol refinements ( 36 ). Phase scores were assigned as 0, 1, and 2 for the initial, intermediate, and final phases, respectively, with outcomes coded as 0 (failure) or 1 (success). The test statistic M2 = (n − 1)r2, where n is the sample size and r is the correlation between phase scores and outcomes, measures the strength of the linear trend and follows a chi-squared distribution with df = 1 for large samples.
The linear trend analysis revealed a significant increasing trend in success rate across testing phases (M2 = 13.34, df = 1, p < 0.001). Success rates improved from 44% in the initial phase (21/48 specimens) to 49% in the intermediate phase (33/68 specimens), and to 75% in the final phase (57/76 specimens). The 95% confidence intervals were 30%–58%, 37%–61%, and 64%–84%, respectively ( 35 , 37 ). The effect size (Cramér’s V = 0.28) indicated moderate practical significance, and the non-overlapping confidence intervals between initial and final phases confirmed meaningful improvement.
Post-hoc pairwise comparisons ( 36 ) using chi-squared tests (X2) with Bonferroni correction ( 38 ) (adjusted α = 0.0167 for three pairwise comparisons) identified the source of improvement. The initial–final comparison showed highly significant improvement (χ2 = 12.31, df = 1, p < 0.001), as did the intermediate–final comparison (X2 = 10.73, df = 1, p = 0.001).
These results across 192 total specimens provide strong statistical evidence that the comprehensive refinements implemented in the final phase were responsible for the significant and practical improvement in test reliability.
Phase Two: Influence of Silica Fume Dosage on Tensile Response of UHPC
Building on the improvements from phase one, the silica fume content was varied while the paste volume was maintained. Figure 7 depicts the stress–strain responses for individual tests at each SCM level; the mean responses are shown in Figure 8 for comparison.
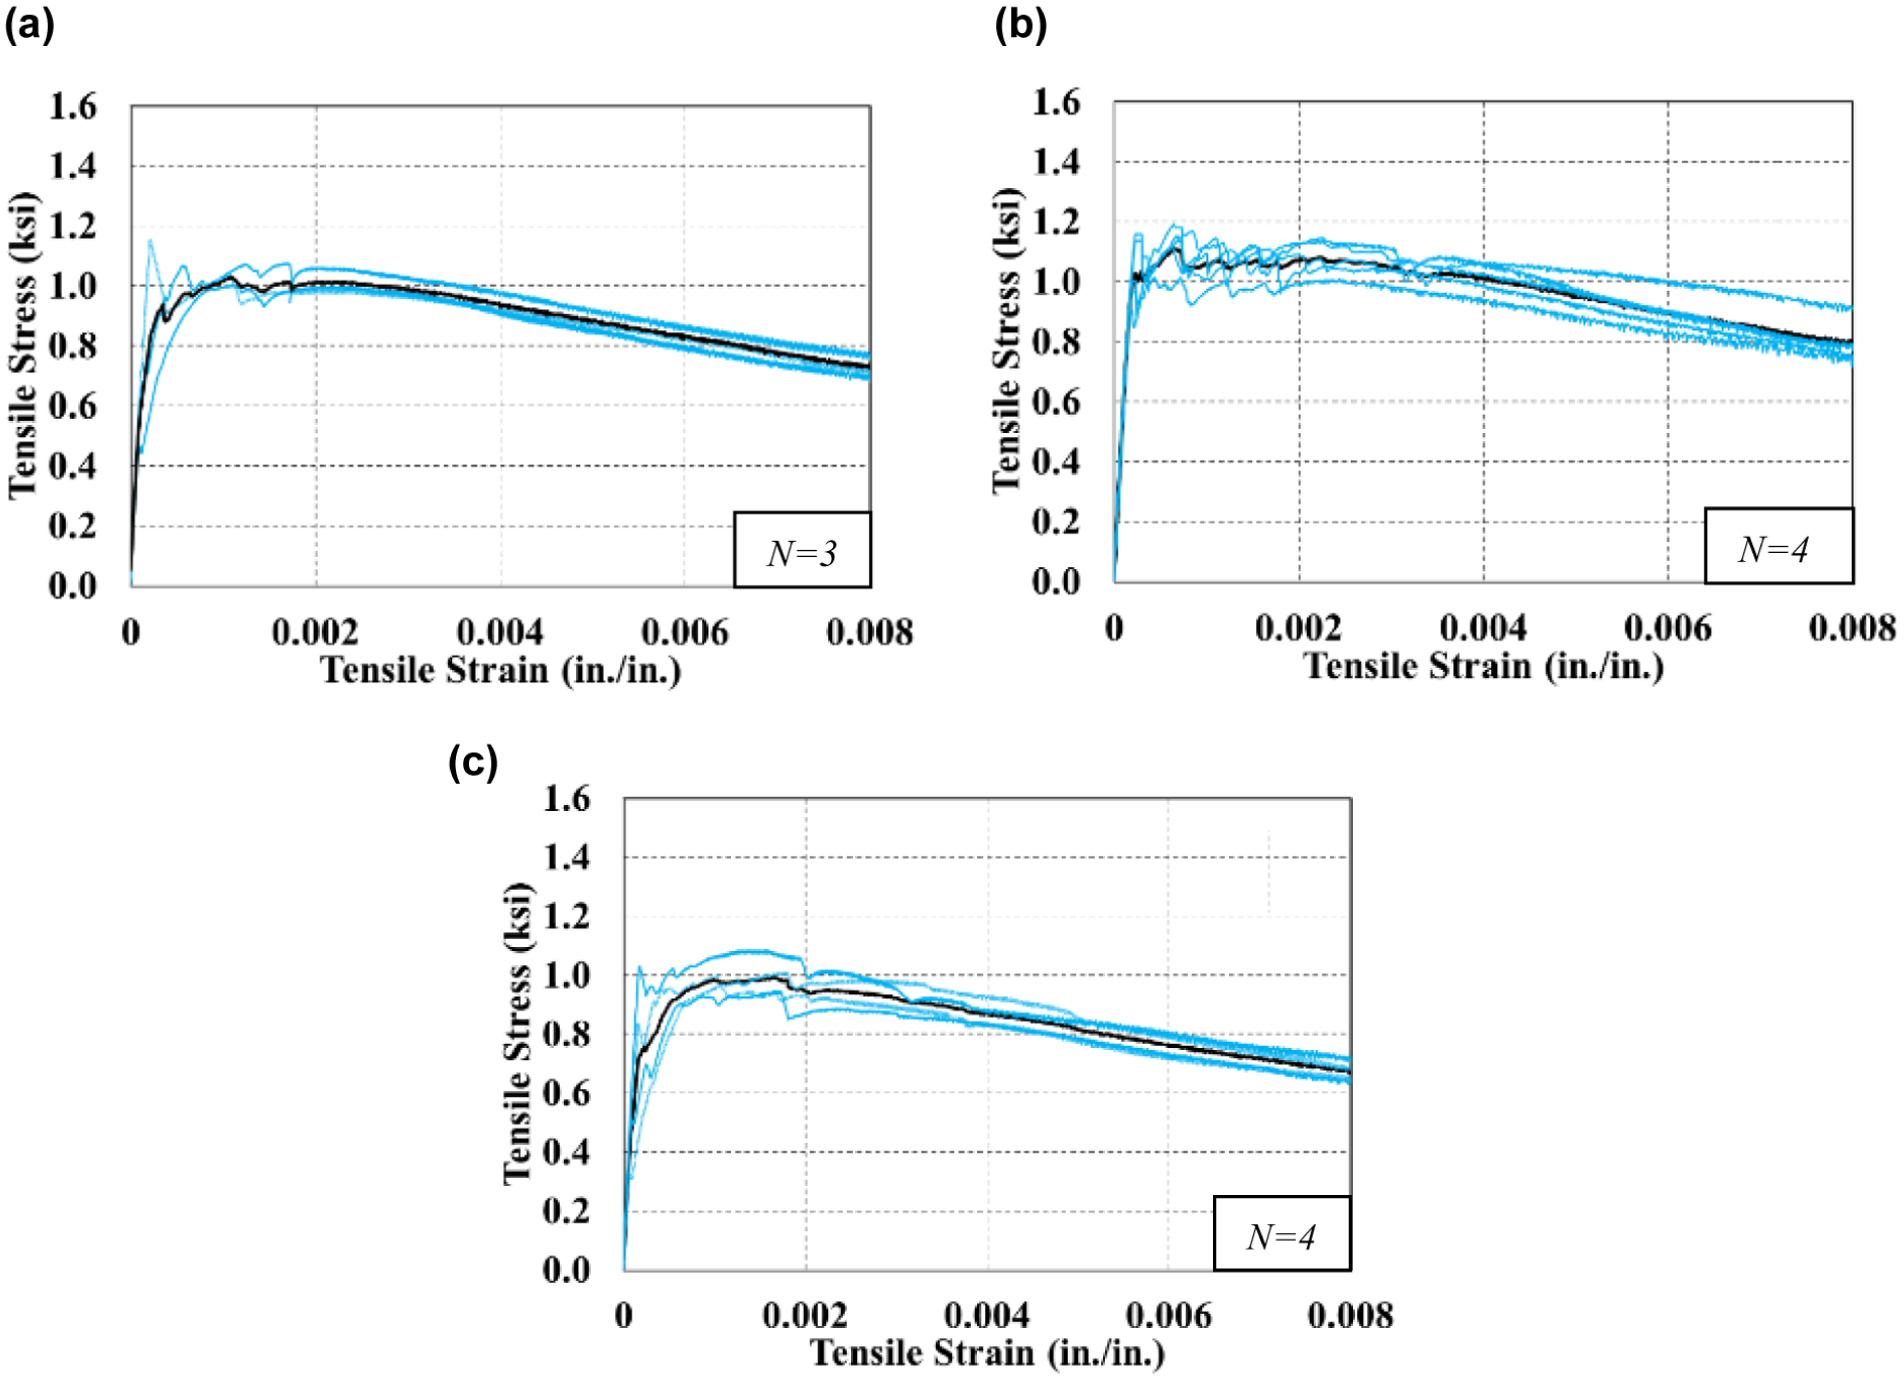
Tensile stress–strain response of ultra-high-performance concrete at various silica fume dosages: (a) 9%; (b) 12%; (c) 15%. Blue lines represent individual specimens, and the mean is the black line.
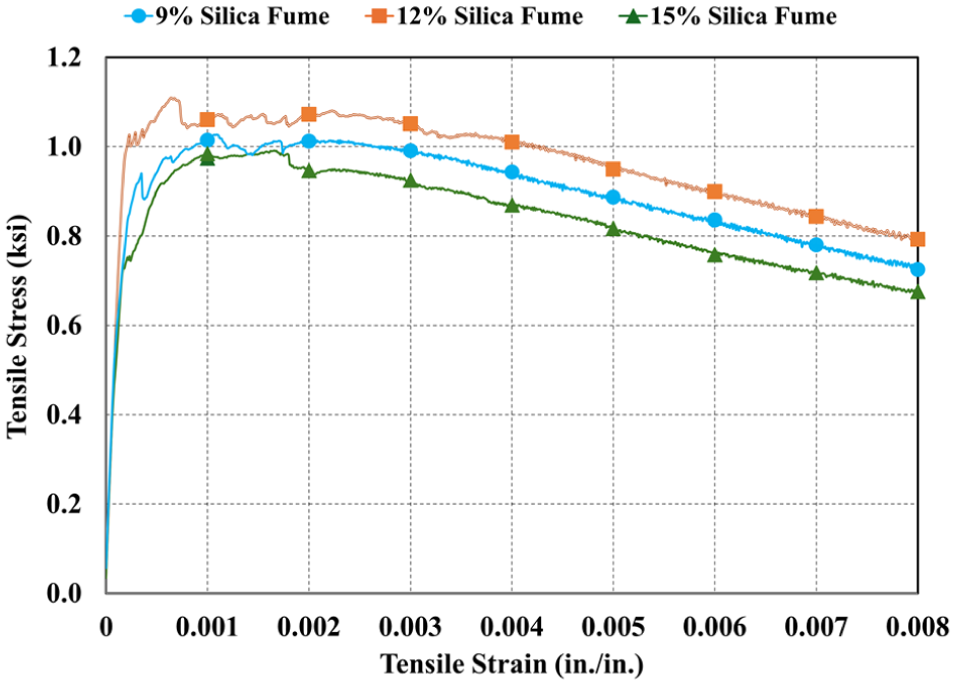
Mean stress–strain response of ultra-high-performance concrete for phase two.
As shown in Figures 7 and 8, the tensile responses indicate some subtle differences with varying silica fume content. The most notable performance was observed at 12% silica fume, which exhibited improved tensile strength and post-cracking response relative to 9% and 15%. However, the observed differences between the mixtures were modest and variations in tensile strength are not likely to be attributable solely to changes in matrix porosity resulting from silica fume content. These differences should be compared with the precision of the direct-tension test; however, this has not been established for AASHTO T 397. Moreover, the initial non-linearities and sharp fluctuations seen in individual specimen curves suggest that localized test artifacts, such as minor misalignment, eccentric loading, or geometric irregularities, are more plausible explanations for the observed variability than material composition alone. The limited effect of silica fume compared with fiber dosage (as observed in phase one) reflects their distinct contributions: steel fibers directly enhance tensile capacity through crack-bridging across the fractured matrix, whereas silica fume primarily densifies the matrix microstructure, providing minimal additional benefit to post-cracking behavior once cracks have formed. Taken together, these results indicate that marginal changes in silica fume content do not have a pronounced influence on the tensile performance of UHPC within the ranges evaluated.
Test Variability and Sensitivity of Strain Measurements
A recurring theme across both phases of the direct-tension testing program is the inherent variability and sensitivity associated with the test. This is particularly evident when examining the relationship between fiber dosage and key tensile response parameters.
Figure 9, a and b , shows the effect of fiber dosage on effective cracking stress and strain, respectively. As shown in Figure 9a, increasing fiber content consistently increases the effective cracking stress throughout the tested range up to 2.00% fiber dosage. This corresponds to the trend previously illustrated in Figure 4, where an increase in fiber dosage improves the tensile strength of UHPC. However, Figure 9b reveals that the corresponding effective cracking strain does not follow a comparably systematic trend. Instead, substantial scatter was observed, with peak values not corresponding to the optimum fiber range identified from the effective cracking stress response.
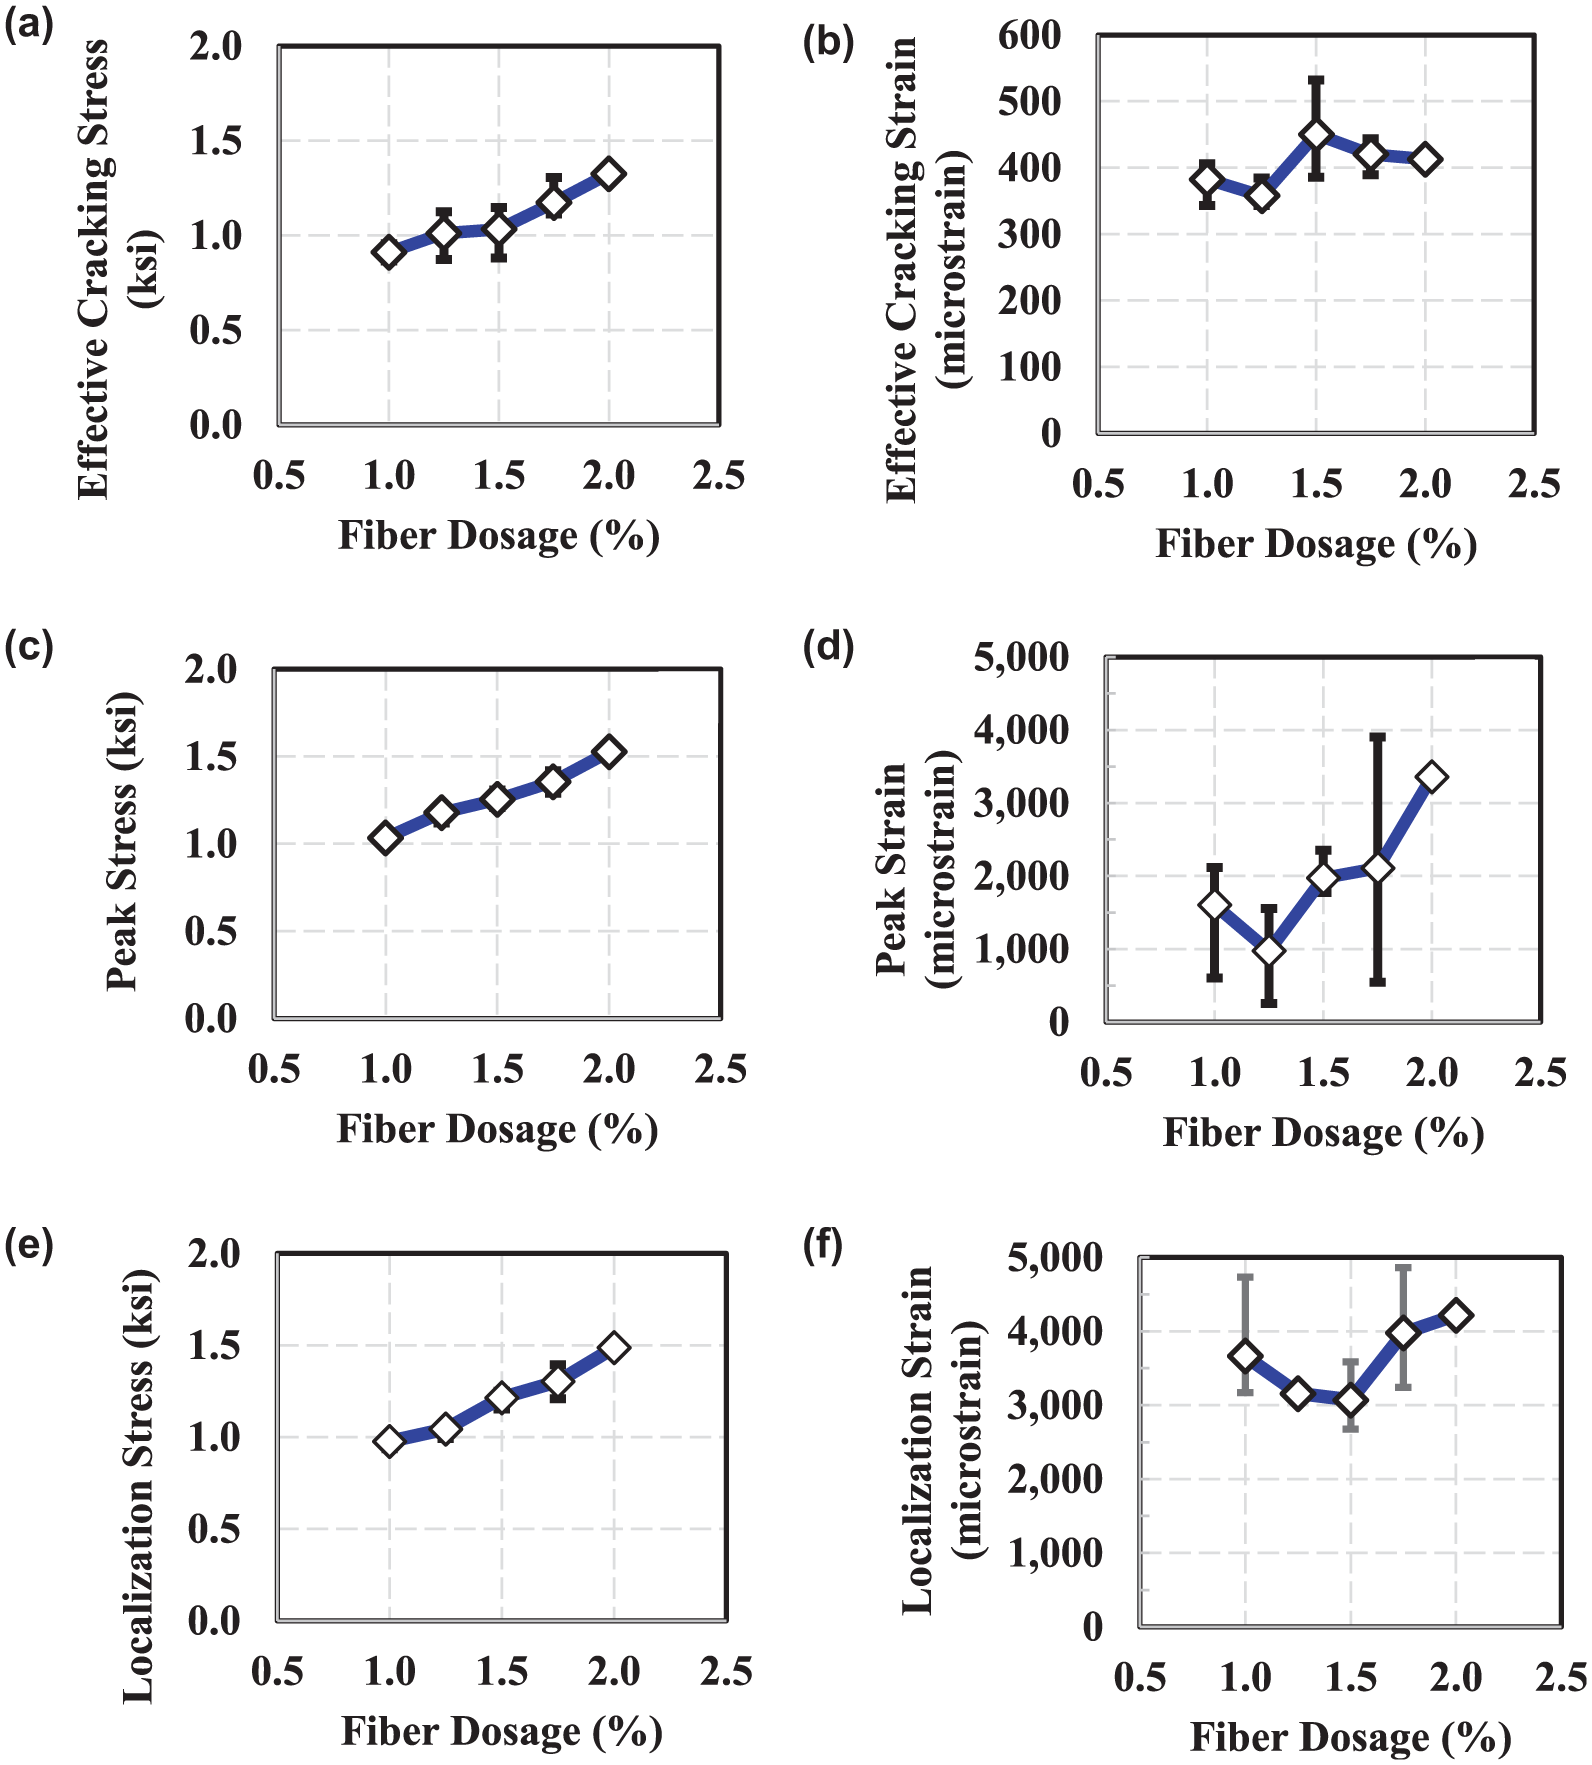
Effect of fiber dosage on tensile stress and strain parameters of ultra-high-performance concrete (UHPC): (a) effective cracking stress; (b) effective cracking strain; (c) peak stress; (d) peak strain; (e) localization stress; (f) localization strain.
Similar patterns are seen in Figure 9, c and d , which are plots of the peak stress and peak strain against fiber dosage. The peak stress (Figure 9c) rises consistently with fiber content throughout the tested range, indicating improved post-cracking load capacity with increasing fiber dosage. In contrast, the peak strains in Figure 9d have high variability, with no discernible dose–response relationship.
The same response can be seen in Figure 9, e and f , where localization stress increases with fiber dosage, again supporting the beneficial effects of fiber inclusion, while localization strain displays marked inconsistency and high variability, emphasizing the unreliable nature of the strain results collected in this study. It is worth noting that post-cracking response data for steel fiber dosages of 0.00% and 0.50% were not added here, as they did not meet the FHWA minimum requirement.
Implications of Observed Variability
The consistent stress response across fiber dosages provides strong evidence that UHPC’s mechanical enhancement via fiber addition is real and measurable and can also be reliably captured through direct-tension testing in accordance with AASHTO T 397. However, the lack of a corresponding trend in strain-based parameters indicates that strain-based results from the direct-tension test, as currently implemented, are highly variable and not suited for specification limits.
This interpretation is supported by both recent multi-laboratory studies and established testing precedents. Gali and Sritharan ( 13 ), reported standard deviations for strain parameters ranging from 23%–38% of mean values in their evaluation of AASHTO T 397. ASTM C1609 ( 39 ) documents that deflection at peak load in flexural testing of fiber-reinforced concrete may exhibit coefficients of variation above 100%, whereas the coefficient of variation of flexural stress is only 9.7%. The high variability indicates that, while stress values are relatively insensitive to small alignment issues or localized defects, strain measurements are significantly affected by out-of-plane alignment, slip, or even small imperfections at the gripping interface. Accordingly, for material optimization, specification, and quality control, stress-based performance metrics (effective cracking and localization stress) should be used, whereas strain-based criteria should not be used.
Practical Considerations for Protocol Implementation
The systematic gripping and alignment procedures developed in this study require additional operator attention, compared with what is covered in AASHTO T 397. The complete setup sequence, including crosshead alignment verification and controlled gripping, adds approximately 5–10 min per specimen. Table A-1 in the supplemental material provides an itemized summary of the protocol covered in this paper for quick reference.
The progression from 44% success rate in the initial phase to 75% success rate in the final phase demonstrates improved testing efficiency. In the initial phase, achieving three valid tests per mixture involved testing 6–8 specimens on average, whereas the final phase protocol achieved the same number of valid tests with approximately 4 or 5 specimens per mixture. For a typical material qualification program requiring valid tests across several mixture proportions, this represents a meaningful reduction in specimen fabrication, curing, and preparation costs.
Importantly, the protocol refinements do not require capital equipment investment. The improvements were achieved using the same 220 kip wedge grip machine throughout the study, demonstrating that this equipment can be used to achieve reliable direct-tension testing results.
Conclusions
The objectives of this study were to (1) evaluate how varying constituents, specifically steel fiber and silica fume dosages, influenced the tensile response of UHPC, and (2) establish a reliable test sequence to significantly improve the success rate of direct-tension testing for UHPC. In the final phase of this study, a 75% success rate was achieved using 220 kip machine wedge grips, resulting in accurate tensile characterization of UHPC. The following conclusions and recommendations are made.
Considering the test sequence, proper crosshead alignment and controlled gripping procedures are critical to ensuring that failure consistently occurs within the gauge length region. The existing specimen preparation protocol specified in AASHTO T 397 adequately prevents plate delamination, provided that surfaces (both UHPC and aluminum plates) are clean, a thin uniform epoxy layer is applied, sufficient clamping force is maintained, and specimens remain within permissible geometric tolerances. The following modifications are recommended for the direct-tension test. Crosshead alignment should always be verified after specimen positioning and before applying load. Gripping procedures must be carefully controlled to minimize induced bending or eccentric loading, with an optimal grip pressure of 500–800 psi.
Considering the variability of results from direct-tension testing, the stress response of UHPC can reliably be captured with direct-tension testing, whereas strain results are much more variable. Consequently, only stress-based and not strain-based metrics should be used for material optimization, specification, and quality control.
Considering testing the direct-tension behavior of non-proprietary UHPC, steel fiber dosages above 1.5% show acceptable strain hardening and, as such, can be used for non-proprietary UHPC made from the materials tested. The results show that the amount of fiber is the primary factor influencing tensile strength and post-cracking performance of UHPC, while moderate changes in silica fume content have only a minor effect.
Supplemental Material
sj-docx-1-trr-10.1177_03611981261430739 – Supplemental material for Improving Direct-Tension Testing Reliability and Material Characterization of Non-Proprietary Ultra-High-Performance Concrete
Supplemental material, sj-docx-1-trr-10.1177_03611981261430739 for Improving Direct-Tension Testing Reliability and Material Characterization of Non-Proprietary Ultra-High-Performance Concrete by Segun J. Osibodu, Daniel M. Coleman and Anton K. Schindler in Transportation Research Record
Supplemental Material
sj-pdf-2-trr-10.1177_03611981261430739 – Supplemental material for Improving Direct-Tension Testing Reliability and Material Characterization of Non-Proprietary Ultra-High-Performance Concrete
Supplemental material, sj-pdf-2-trr-10.1177_03611981261430739 for Improving Direct-Tension Testing Reliability and Material Characterization of Non-Proprietary Ultra-High-Performance Concrete by Segun J. Osibodu, Daniel M. Coleman and Anton K. Schindler in Transportation Research Record
Supplemental Material
sj-pdf-3-trr-10.1177_03611981261430739 – Supplemental material for Improving Direct-Tension Testing Reliability and Material Characterization of Non-Proprietary Ultra-High-Performance Concrete
Supplemental material, sj-pdf-3-trr-10.1177_03611981261430739 for Improving Direct-Tension Testing Reliability and Material Characterization of Non-Proprietary Ultra-High-Performance Concrete by Segun J. Osibodu, Daniel M. Coleman and Anton K. Schindler in Transportation Research Record
Supplemental Material
sj-pdf-4-trr-10.1177_03611981261430739 – Supplemental material for Improving Direct-Tension Testing Reliability and Material Characterization of Non-Proprietary Ultra-High-Performance Concrete
Supplemental material, sj-pdf-4-trr-10.1177_03611981261430739 for Improving Direct-Tension Testing Reliability and Material Characterization of Non-Proprietary Ultra-High-Performance Concrete by Segun J. Osibodu, Daniel M. Coleman and Anton K. Schindler in Transportation Research Record
Supplemental Material
sj-pdf-5-trr-10.1177_03611981261430739 – Supplemental material for Improving Direct-Tension Testing Reliability and Material Characterization of Non-Proprietary Ultra-High-Performance Concrete
Supplemental material, sj-pdf-5-trr-10.1177_03611981261430739 for Improving Direct-Tension Testing Reliability and Material Characterization of Non-Proprietary Ultra-High-Performance Concrete by Segun J. Osibodu, Daniel M. Coleman and Anton K. Schindler in Transportation Research Record
Supplemental Material
sj-png-6-trr-10.1177_03611981261430739 – Supplemental material for Improving Direct-Tension Testing Reliability and Material Characterization of Non-Proprietary Ultra-High-Performance Concrete
Supplemental material, sj-png-6-trr-10.1177_03611981261430739 for Improving Direct-Tension Testing Reliability and Material Characterization of Non-Proprietary Ultra-High-Performance Concrete by Segun J. Osibodu, Daniel M. Coleman and Anton K. Schindler in Transportation Research Record
Footnotes
Acknowledgements
The cooperation and assistance of ALDOT are greatly acknowledged. Additionally, the authors thank Dr. Ben Graybeal and Dr. Rafic El-Helou for their helpful discussions early in this study, particularly in identifying the role of bending-induced effects among the initial challenges encountered during testing.
Author Contributions
The authors confirm contribution to the paper as follows: study conception and design: Segun J. Osibodu, Daniel M. Coleman, and Anton K. Schindler; data collection: Segun J. Osibodu; analysis and interpretation of results: Segun J. Osibodu, Daniel M. Coleman, and Anton K. Schindler; draft manuscript preparation: Segun J. Osibodu and Anton K. Schindler. All authors reviewed the results and approved the final version of the manuscript.
Declaration of Conflicting Interests
The author declared no potential conflicts of interest with respect to the research, authorship, and/or publication of this article.
Funding
The author disclosed receipt of the following financial support for the research, authorship, and/or publication of this article: support from the Alabama Department of Transportation (Research Project No. 931-069).
AI Use Declaration
ChatGPT-4 was used solely for background shadow removal in selected figures to improve visual legibility. The authors take full responsibility for all content presented, including the processed figures.
Data Accessibility Statement
The data supporting the findings of this study are available from the corresponding author on reasonable request.
Supplemental Material
Supplemental material for this article is available online.
This paper reflects the views of the authors and does not necessarily reflect the official views of ALDOT.
References
Supplementary Material
Please find the following supplemental material available below.
For Open Access articles published under a Creative Commons License, all supplemental material carries the same license as the article it is associated with.
For non-Open Access articles published, all supplemental material carries a non-exclusive license, and permission requests for re-use of supplemental material or any part of supplemental material shall be sent directly to the copyright owner as specified in the copyright notice associated with the article.