
Abstract
This study examines older adults' motorized travel mode choices in the context of autonomous mobility, with particular attention to how technology acceptance and digital competencies shape preferences for private autonomous vehicles (PAVs) and shared autonomous vehicles (SAVs). A mixed-mode stated-preference survey was conducted in Wuhan, China, in May 2022. The final sample included 734 respondents aged 60 years and above, each completing three choice tasks, yielding 2,202 observations across four alternatives: PAV, SAV, metro, and bus. A random-parameter logit model was estimated to capture preference heterogeneity. The results show significant random taste heterogeneity in travel cost, in-vehicle time, and walking/waiting time, with part of this heterogeneity associated with socioeconomic characteristics such as age, income, car ownership, and driving license status. Among technology acceptance constructs, attitude was positively associated with both PAV and SAV choice, perceived usefulness was positively related to SAV choice, while perceived ease of use showed a negative association with autonomous vehicle alternatives. Digital competency indicators had differentiated effects, with social and financial internet use being particularly relevant to SAV choice. Elasticity analysis further indicates that time components, especially in-vehicle time, are key determinants of older adults' autonomous mode selection. These findings provide evidence for age-friendly autonomous mobility strategies emphasizing reliability, reduced travel-time burdens, and inclusive digital support.
Introduction
According to the National Bureau of Statistics of China (2024), by the end of 2023, China’s total population reached 1.40967 billion. The number of elderly individuals aged 60 and above was 296.97 million, accounting for 21.1% of the total population, whereas those aged 65 and above numbered 216.76 million, or 15.4%. The share of elderly people is projected to increase steadily, and by 2050, more than one-third of the population will be over 60 years old ( 1 ). There are significant differences between the elderly and younger populations in relation to travel frequency, modes of transportation, purposes of travel, and dependence on transportation means (2–4). Elderly individuals typically travel less frequently and prefer safer and more convenient modes of transportation, such as public transit or walking. Their travel purposes are often concentrated around daily life needs such as shopping, medical care, and participation in community activities. This trend is mainly the result of age-related declines in physical capabilities, including reduced vision, hearing, and mobility. Consequently, elderly individuals may have heightened safety needs and anxiety, and their limited financial resources may influence their choice of more cost-effective transportation options.
Studies have shown that older adults tend to make fewer trips per day and prefer nondriving modes such as walking, public transport, and paratransit services. These preferences are often shaped by physical and cognitive decline, lower income, and heightened safety concerns. For example, research in China, the Netherlands, and other aging societies has shown that elderly people often avoid peak-hour travel, prefer short-distance trips, and exhibit greater sensitivity to walking distance and waiting time compared with younger age groups (5–7). Additionally, older women and those with mobility limitations are especially reliant on accessible public transport infrastructure. Understanding these behavioral nuances is essential for designing inclusive and age-friendly transportation systems.
The Chinese government has implemented several policies to support the research, development, and testing of autonomous vehicles (AVs) (8–10). For instance, cities such as Beijing, Shanghai, and Shenzhen have authorized and encouraged road tests and commercial operation pilots of AVs. Numerous Chinese technology firms and automakers, including Baidu, Alibaba, Tencent, Geely, and BYD, are actively engaged in advancing autonomous driving technologies ( 11 , 12 ). Baidu’s Apollo platform, a leading autonomous driving technology platform, has conducted public road tests in multiple cities.
Autonomous driving technology has begun to see partial commercial applications in China, such as providing autonomous taxi services and logistics delivery within specific areas. Companies like Baidu and Pony.ai have already launched unmanned taxi services in several cities including Beijing and Guangzhou. AVs offer the potential for independent mobility to elderly individuals who can no longer drive owing to age-related factors; this could significantly reduce accidents caused by delayed reaction times and/or diminished sensory abilities of older drivers (13–15). Furthermore, the necessity of owing personal vehicles is reduced, saving costs associated with purchasing and maintaining cars ( 16 , 17 ). This could help elderly individuals more easily participate in various social activities, thus diminishing feelings of loneliness and isolation, better integrating them into society, and improving their quality of life ( 18 ).
The digital divide among the elderly, defined as the gap in using and understanding modern information and communication technologies compared with younger generations, significantly affects the acceptance of autonomous driving technology ( 19 , 20 ). Generally, the elderly are less familiar with modern technologies, particularly the latest information technologies and digital devices. The variation in digital capabilities among the elderly influences their acceptance and willingness to use AVs ( 21 ). Digital capabilities include the ability to use relevant devices and applications, and the capacity to understand and process digital information.
Considering the differences in travel mode choice preferences among the elderly, establishing a random-parameter logit (RPL) model to study the impact on their preferences for AV mobility could not only facilitate the social acceptance and applicability of autonomous driving technology but also promote technological equality, enhance public welfare, and increases the overall safety and efficiency of the transportation system. These research findings could enhance social participation and the independent living capabilities of the elderly, thereby improving their quality of life. Furthermore, they provide data support and insights for policy makers and technology developers, assisting them in better understanding the needs of the elderly population and in developing appropriate policies and technologies that meet these needs.
To address the above research gaps, this study is guided by the following research questions: (1) How do older adults in an urban Chinese context choose among different motorized travel modes, particularly private autonomous vehicles (PAVs) and shared autonomous vehicles (SAVs), relative to conventional public transport options? (2) How do key psychological factors derived from the technology acceptance model (TAM)—namely perceived usefulness (PU), perceived ease of use (PEU), attitude (ATT), and behavioral intention to use (BIU)—influence older adults’ preferences for AVs? (3) To what extent do multidimensional digital skills, reflecting the digital divide among older adults, shape their acceptance and choice of AV services? (4) Is there significant unobserved preference heterogeneity in older adults’ travel mode choices, and how can an RPL model better capture this heterogeneity compared with conventional discrete choice models? By explicitly addressing these questions, this study aims to provide a theoretically grounded and empirically robust understanding of elderly individuals’ AV adoption and travel mode choice behavior.
Literature Review
Impact of Autonomous Vehicles on Residents’ Travel Behavior
AVs profoundly affect residents’ travel behaviors, potentially altering their travel habits, mode selection, and frequency, as well as having broader effects on urban transportation systems and the environment. The deployment of AVs might encourage more individuals to choose AVs as their mode of transport, particularly those who are unable to drive because of technological or health constraints, such as the elderly and disabled ( 16 , 22 , 23 ). AVs, by reducing the fatigue and stress associated with driving, may encourage more frequent and particularly long-distance trips ( 24 ). As driving becomes more effortless, long-distance journeys or commutes might become more feasible and appealing. AVs are expected to enhance road utilization efficiency through precise control and improved responsiveness to road conditions (25–27). This technology could mitigate traffic congestion and accidents, especially those caused by human error ( 28 ). Furthermore, vehicle-to-vehicle communication can optimize traffic flow, minimize parking times, and reduce travel delays. AVs may have positive or negative environmental impacts. On the one hand, enhanced fuel efficiency and reduced congestion could lower per-vehicle carbon emissions ( 26 ). On the other hand, an increase in travel frequency might raise overall energy consumption and emissions ( 29 ).
Impact of AVs on Older Adults’ Travel Behavior
AVs have a significant impact on the mobility of the elderly, often manifesting as positive changes ( 15 ). AVs provide mobility opportunities for elderly individuals who cannot drive for age or health reasons. The widespread adoption of this technology could enhance their independence, allowing them to arrange their own travel to visit friends and family, medical facilities, shopping centers, and to participate in social activities without relying on family members or public transportation ( 30 ). Elderly drivers may face higher safety risks owing to factors such as slower reaction times and decreased vision and hearing. AVs improve their travel safety significantly by minimizing driving errors through advanced sensors and algorithms ( 31 ). Moreover, reducing traffic accidents would help lower the incidence of injuries among the elderly. AVs, by providing a reliable mode of transportation, could also help reduce social isolation among the elderly. These vehicles enable easier community engagement and participation in various social activities, which are crucial for maintaining mental health and social well-being ( 17 , 32 , 33 ). AVs facilitate older adults' access to daily activities such as shopping and medical appointments, thereby supporting independent living and social participation ( 18 , 34 ). This mode of independent travel keeps elderly individuals active and engaged, boosting their self-esteem and life satisfaction ( 18 ). Despite the numerous benefits, the elderly may face challenges in learning and adapting to new technology ( 35 ). Therefore, to ensure widespread acceptance of this technology, developers and service providers need to ensure that vehicle-user interfaces are simple and provide the necessary support and training.
Factors Influencing Older Adults’ Choice of AVs for Traveling
Socioeconomic attributes significantly influence the choice of AVs by the elderly, including factors such as gender, age, educational level, and household income (36–39). Travel characteristic variables reflect the travel needs and behavior patterns of the elderly, such as travel time and -costs ( 2 , 3 , 39 , 40 ). Additionally, psychological latent variables (e.g., PU, PEU, ATT, and BIU) related to the acceptance of AVs also affect their willingness to use this technology (41–44). The theoretical frameworks commonly used to study the acceptance of AVs by the elderly include the TAM ( 35 , 42 ), the theory of planned behavior ( 45 , 46 ), and the unified theory of acceptance and use of technology (47–49). For the elderly, a specific user group, there is likely to be a heightened focus on the intuitiveness and clear benefits of the technology, making TAM a more concise and intuitive framework for analyzing their attitudes.
The TAM, originally developed by Davis (1989), is a well-established theoretical framework used to explain user behavior related to information technology adoption ( 50 ). The model posits that two key beliefs—PU and PEU—predict an individual’s ATT toward using a technology, which subsequently influences their BIU and actual system use. Venkatesh and Davis later extended TAM to account for more complex user behaviors ( 51 ).
In the context of AVs, TAM has proven effective in capturing older adults’ acceptance behaviors. PU reflects the extent to which AVs enhance elderly mobility, independence, and travel safety. PEU captures elderly individuals’ perceptions of the effort required to operate AVs, which is particularly relevant given typical age-related declines in cognitive and motor abilities. ATT reflects the elderly’s overall favorable or unfavorable feelings toward AV use, and BIU represents their intention to adopt AVs in the future ( 52 , 53 ).
Based on this theoretical foundation, we propose the following hypotheses:
H1: Perceived ease of use positively influences the elderly’s attitudes toward using AVs.
H2: Perceived usefulness positively influences the elderly’s attitudes toward using AVs.
H3: Attitude positively influences behavioral intention to use AVs.
H4: Behavioral intention positively influences the choice of AVs.
These hypotheses are supported by empirical studies showing that PU and PEU are strong predictors of AV adoption among older adults ( 52 , 54 ). Additionally, integrating TAM with context-specific latent variables, such as digital skills and travel behaviors, enhances its explanatory power in modeling elderly preferences.
In addition to psychological and socioeconomic factors, other constructs such as trust, privacy concerns, travel habits, and personality traits have been increasingly recognized as influential in AV adoption, especially among older adults. Trust plays a pivotal role in AV acceptance, as older users often require a high degree of confidence in the system’s safety and reliability before adoption ( 54 ). Privacy concerns, particularly about data security and surveillance, can hinder willingness to use AVs if elderly users fear misuse of their personal information ( 55 ). Habitual behavior also influences transportation choices—users accustomed to conventional transport modes may resist adopting AVs owing to a lack of familiarity and comfort ( 56 ). Personality dimensions, such as openness to experience and risk tolerance, are also known to moderate AV adoption behavior ( 57 ).
The Impact of the Digital Divide on Older Adults’ Preferences for Selecting AVs
In an increasingly digitized world, the digital divide among different population groups, particularly the elderly, can significantly influence their interaction with and adoption of new technologies ( 20 ). This study focuses on four critical areas of digital literacy that are essential for the elderly to fully benefit from digital advancements. Physical digital skills: the ability to own and operate modern digital devices such as smartphones, tablets, and personal computers ( 58 ). Social digital skills: crucial for communicating, sharing information, and building social relationships using digital technologies, including social media and video calls ( 59 ). Entertainment digital skills: the capabilities to access entertainment through digital means, such as watching online videos and listening to digital music ( 60 ). Financial digital skills: enable the elderly to perform financial transactions and manage assets online through internet banking and electronic payments ( 61 , 62 ).
As stated earlier, the digital divide refers to the disparities in access, usage, and benefits from digital technologies among different groups ( 63 ). A lack of necessary digital skills may lead to reservations or resistance among the elderly toward technologies like AVs, primarily because of concerns over operational complexity and safety ( 64 ). Additionally, older adults with insufficient social digital skills may have less positive experiences when interacting with digital technologies and online platforms, which can reduce their trust in and willingness to adopt technologies such as AVs ( 65 ).
Discrete Choice Model for Studying Travel Mode Choice
There are three widely used discrete choice models—the multinomial logit (MNL) model, the latent class choice model (LCCM), and the RPL model, also known as mixed logit—to analyze the heterogeneity in older adults’ preferences for AV usage. Each model’s strengths and limitations have been evaluated to determine their appropriateness for various research contexts.
MNL: Celebrated for its computational efficiency and simplicity, the MNL model is suitable for basic discrete choice analysis (66–69). However, its assumption of independence from irrelevant alternatives (IIA) may not hold in scenarios in which alternatives are inherently correlated ( 70 ). In addition, its inability to capture random preference fluctuations makes it less accurate for scenarios with significant preference heterogeneity.
LCCM: Excels in identifying distinct latent classes of decision makers, each with similar preferences ( 71 ). This segmentation enables effective handling of preference heterogeneity ( 72 , 73 ). Nonetheless, the complexity in setting up and estimating parameters for LCCM, coupled with high data and methodological demands, introduces a degree of subjectivity influenced by model fit and interpretative needs ( 74 , 75 ).
RPL: Particularly suitable for contexts where older adults show varied digital skills and acceptance of new technologies, the RPL model allows for random variability in one or more parameters across the population ( 76 ). This flexibility helps relax the IIA assumption and more closely mirrors real decision-making environments ( 77 ). Although computationally demanding and data-intensive, the adaptability of the RPL model makes it an ideal choice for exploring the underlying motivations behind older adults’ acceptance of AV technology.
This study recommends use of the RPL model to gain in-depth insights into older adults’ acceptance of AVs and the motivations underlying their decision-making process. This model not only reveals the technology acceptance levels among older adults but also provides valuable implications for policy making and technological design. Unlike traditional applications of the TAM, this study incorporates digital skills not as a latent predictor within a structural equation model but as an observed covariate within the RPL model’s utility function. This approach allows for direct estimation of how specific digital competencies influence mode choice utilities among elderly individuals, which is particularly valuable when analyzing heterogeneous preferences across subpopulations.
Concerns and Risks Associated with AVs
Despite the numerous anticipated benefits, AVs also raise various concerns and risks that may hinder public acceptance, especially among elderly populations. Firstly, safety remains one of the most significant issues. Although AVs aim to reduce accidents caused by human errors, system malfunctions, sensor failures, and software bugs may still pose safety threats ( 78 , 79 ). Secondly, uncertainty about decision-making algorithms in critical situations leads to ethical debates, such as how AVs should behave during unavoidable collisions ( 80 , 81 ). Thirdly, AVs require the continuous collection of sensitive user data (e.g., location, behavioral patterns), raising concerns about privacy infringement and data misuse ( 82 , 83 ).
Furthermore, a lack of transparency in algorithmic decision making may reduce trust among users, particularly the elderly, who may already exhibit technology anxiety or cognitive overload when interacting with AV systems ( 35 , 54 ). Moreover, fear of job displacement in driving-related sectors and the high cost of adoption can lead to broader societal resistance ( 13 , 16 ). Understanding and addressing these issues are crucial for the sustainable development and deployment of AVs.
These concerns emphasize the importance of risk communication and transparent governance in AV deployment. Future designs should incorporate usercentric features and education strategies to alleviate fears, especially among vulnerable groups such as the elderly ( 84 ).
Methodology
Study Area and Survey Recruitment
Wuhan was selected as the study area given its prominent role in China’s AV deployment and testing ecosystem, which provides a policy-relevant and information-rich context for observing older adults’ perceptions and stated preferences (SPs) toward emerging autonomous mobility services. Since 2019, Wuhan has hosted the National Intelligent Connected Vehicle Testing Demonstration Zone, enabling large-scale road testing and pilot commercialization of AV services. By the end of 2023, the city had opened more than 3,378 km of testing roads across all 12 administrative districts and supported nearly 500 regularly operated AVs, including autonomous taxi and shuttle services ( 85 ). Such sustained and citywide AV operations have increased residents’ exposure to autonomous mobility concepts and services, thereby strengthening the empirical relevance of Wuhan as a case for examining older adults’ travel mode choices involving both PAVs and SAVs.
The survey was conducted in Wuhan in May 2022. Data were collected from 734 respondents aged 60 years and above using a mixed-mode (offline and online) survey approach. After data screening, 25 questionnaires were excluded because of incomplete responses, including missing items and unanswered SP tasks, which are common issues in surveys involving older populations. The resulting effective sample therefore consisted of 734 respondents, corresponding to a nonresponse rate of approximately 3.3%. Given the relatively low nonresponse rate and the absence of systematic patterns in missing data, the final sample was considered suitable for subsequent latent variable modeling and RPL estimation. To enhance sample representativeness, recruitment and quota monitoring were implemented with reference to the city-level distributions of age and gender, while ensuring adequate variability in socioeconomic characteristics for subsequent heterogeneity analysis. Each respondent completed three SP choice tasks, yielding 2,202 SP observations in total. Across all SP responses, 28.11% of choices were PAVs, 17.53% were SAVs, 26.61% were metro, and 27.75% were bus.
Respondents were recruited through a combined offline–online strategy to improve coverage of older adults with different digital access levels. Offline surveys were administered in community centers, senior activity hubs, and public spaces where older adults frequently gather. Trained research assistants provided standardized instructions and, when needed, assisted respondents in understanding the questionnaire and completing the SP tasks. For the online recruitment component, the questionnaire was distributed via the Wenjuanxing (i.e., Questionnaire Star) platform and disseminated through community WeChat groups and senior associations, targeting Wuhan residents aged 60+. Participation was voluntary, and informed consent was obtained before participation. To mitigate potential sampling bias associated with single-channel recruitment, age–gender quota checks were continuously monitored during data collection, which helped achieve a balanced sample with broad representation of the urban elderly population.
Survey Design and Content
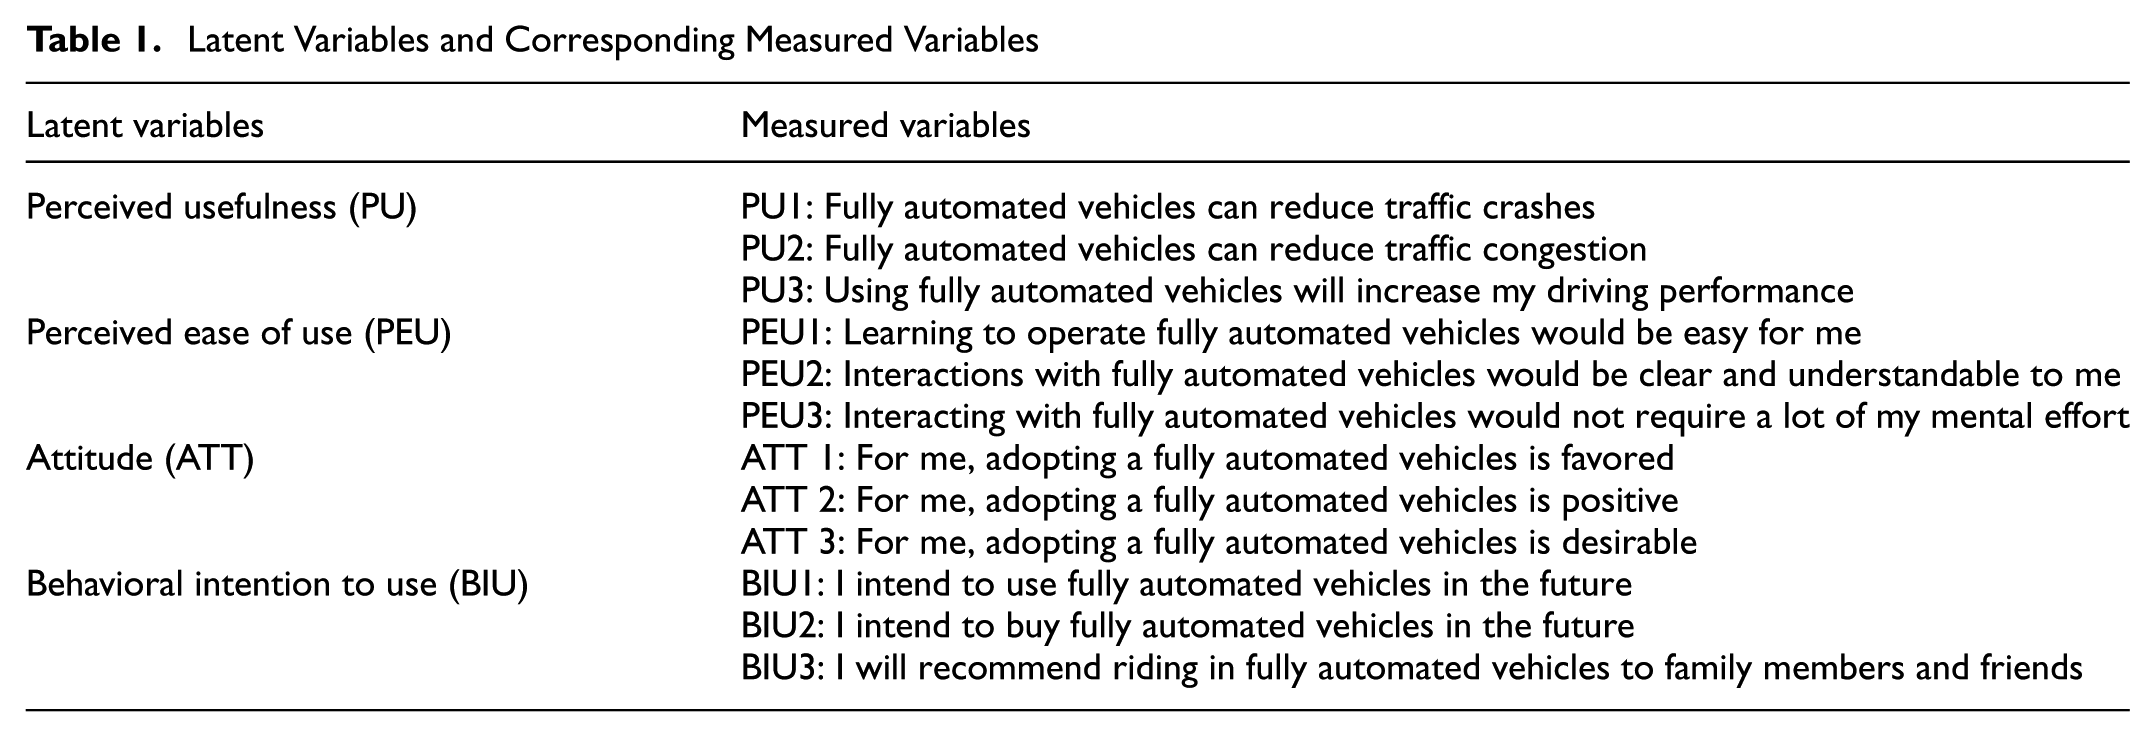
The survey encompassed four key areas: (1) socioeconomic characteristics of the respondents, such as gender, age, educational level, and household income; (2) psychological latent variables related to older adults’ acceptance of AVs based on the TAM, such as PU, PEU, ATT, and BIU ( 86 ). These latent variables and their corresponding measured variables are detailed in Table 1. A five-point Likert scale was used to measure these latent variables. (3) The digital competencies of older adults were subdivided according to their application scenarios and functional needs, encompassing physical, social, entertainment, and financial digital skills. This study employed these four types of digital competencies to quantify the digital divide among individuals and investigate their impact on older adults’ preferences for AV mobility. Following a parsimonious measurement strategy suitable for older respondents, digital competencies were operationalized as four domain-specific proxies (digit1 to digit4), each coded as a binary indicator (1 = yes, 0 = no). Specifically, physical digital skill was captured by smartphone ownership (digit1: 1 = owns a smartphone; 0 = otherwise). Social digital skill was measured by whether the respondent had used the internet in the past week for social activities (digit2: 1 = engaged in any of the following at least once in the past week: chatting/messaging, video calls, or photo sharing; 0 = none). Entertainment digital skill was measured by whether the respondent had used the internet in the past week for online entertainment (digit3: 1 = engaged in any of the following at least once in the past week: listening to music, watching videos, or gaming; 0 = none). Financial digital skill was measured by whether the respondent had used the internet in the past week for economic/transactional activities (digit4: 1 = engaged in any of the following at least once in the past week: online shopping, booking tickets, or other online financial activities; 0 = none).
Latent Variables and Corresponding Measured Variables
Before presenting the SP choice tasks, the questionnaire included a brief, standardized introduction to explain the concepts of AVs, PAVs, and SAVs. These explanations were designed using plain language and visual aids (illustrative diagrams) to ensure comprehension among elderly respondents. AVs were described as self-driving cars capable of navigating without human intervention; PAVs were defined as personally owned autonomous cars offering exclusive use; whereas SAVs were introduced as shared self-driving vehicles operating like ride-hailing or carpooling services. To assist participants with different levels of digital literacy and cognitive functioning, trained interviewers provided verbal clarifications and answered any questions during the face-to-face survey sessions. For online respondents, explanatory text and annotated graphics were embedded directly above the choice scenarios.
(4) The fourth area of the questionnaire encompassed the choice experiments. To ensure realism and analytical consistency, the SP scenarios were based on fixed trip lengths of 3, 5, and 7 km. These levels were chosen to represent short- to medium-distance urban trips typically undertaken by older adults. This approach follows precedents in elderly mode choice literature, in which discrete trip distances are employed to control contextual variation and improve model interpretability ( 2 , 87 , 88 ).
The transportation options under consideration (PAVs, SAVs, metro, and bus) were selected because they represent the dominant motorized travel options for short-distance urban trips among older adults in Chinese cities and allowed for consistent comparison in relation to travel time, walking and waiting time, and monetary cost. Nonmotorized modes such as walking and cycling were excluded, as they involve fundamentally different physical constraints and decision mechanisms, which are highly heterogeneous among older adults. Conventional taxis and app-based ride-hailing services were not included because their service characteristics and pricing structures are largely comparable to those of SAVs; including both would have increased the cognitive burden in the SP experiment without providing additional analytical value.
The experiment included four travel alternatives: PAVs, SAVs, metro, and bus. These modes were selected because they represent the primary motorized travel options available to older adults in Chinese cities and allow meaningful comparisons in travel time, access time, and monetary cost.
Nonmotorized modes such as walking and cycling were excluded because they involve substantially different physical effort requirements and decision mechanisms, which vary widely among elderly individuals and would have introduced additional heterogeneity unrelated to motorized travel preferences.
Conventional taxis and app-based ride-hailing services were also excluded from the SP experiment. This decision was motivated by their strong functional similarity to SAVs in relation to on-demand access, door-to-door service, and flexible routing. Including multiple, highly similar on-demand mobility options within the same choice set could have substantially increased the cognitive burden on respondents—particularly the most elderly participants—and have potentially reduced the reliability of SP responses. Therefore, the experimental design focused on comparing emerging autonomous mobility services with conventional public transport modes.
Nevertheless, conventional taxis and ride-hailing services may exhibit substitution relationships with SAVs. Explicitly including these alternatives in future SP experiments would allow researchers to more directly identify substitution effects among on-demand mobility services and better understand the competitive interactions between emerging automated services and existing ride-hailing platforms.
Each option was evaluated on three variables: in-vehicle travel time, walking and waiting time, and travel cost. Here, walking and waiting time is defined as having a combined out-of-vehicle time component, capturing access and egress burdens such as walking to pick-up/drop-off or boarding locations and, where applicable, waiting for vehicle or service arrival. For PAVs, waiting time is implicitly zero, therefore this variable primarily reflects access-related walking time, ensuring consistent attribute definitions across all alternatives. Additionally, SAV use included discounts for shared services at three distinct levels. The options for the choice experiment, along with the corresponding variables and their levels, are detailed in Table 2. Utilizing a full factorial experimental design yielded 4,782,969 possible choice sets. In this study, the SP survey questionnaire was developed using a D-efficient experimental design method to enhance the statistical validity of the estimated parameters by maximizing t-ratios and minimizing sample size while ensuring statistically significant t-ratios ( 89 , 90 ). The software package JMP13 was utilized to implement these designs, producing four distinct questionnaires, each containing three scenarios. An example of an SP profile is illustrated in Table 3.
Attributes and Attributes Levels for Travel Modes
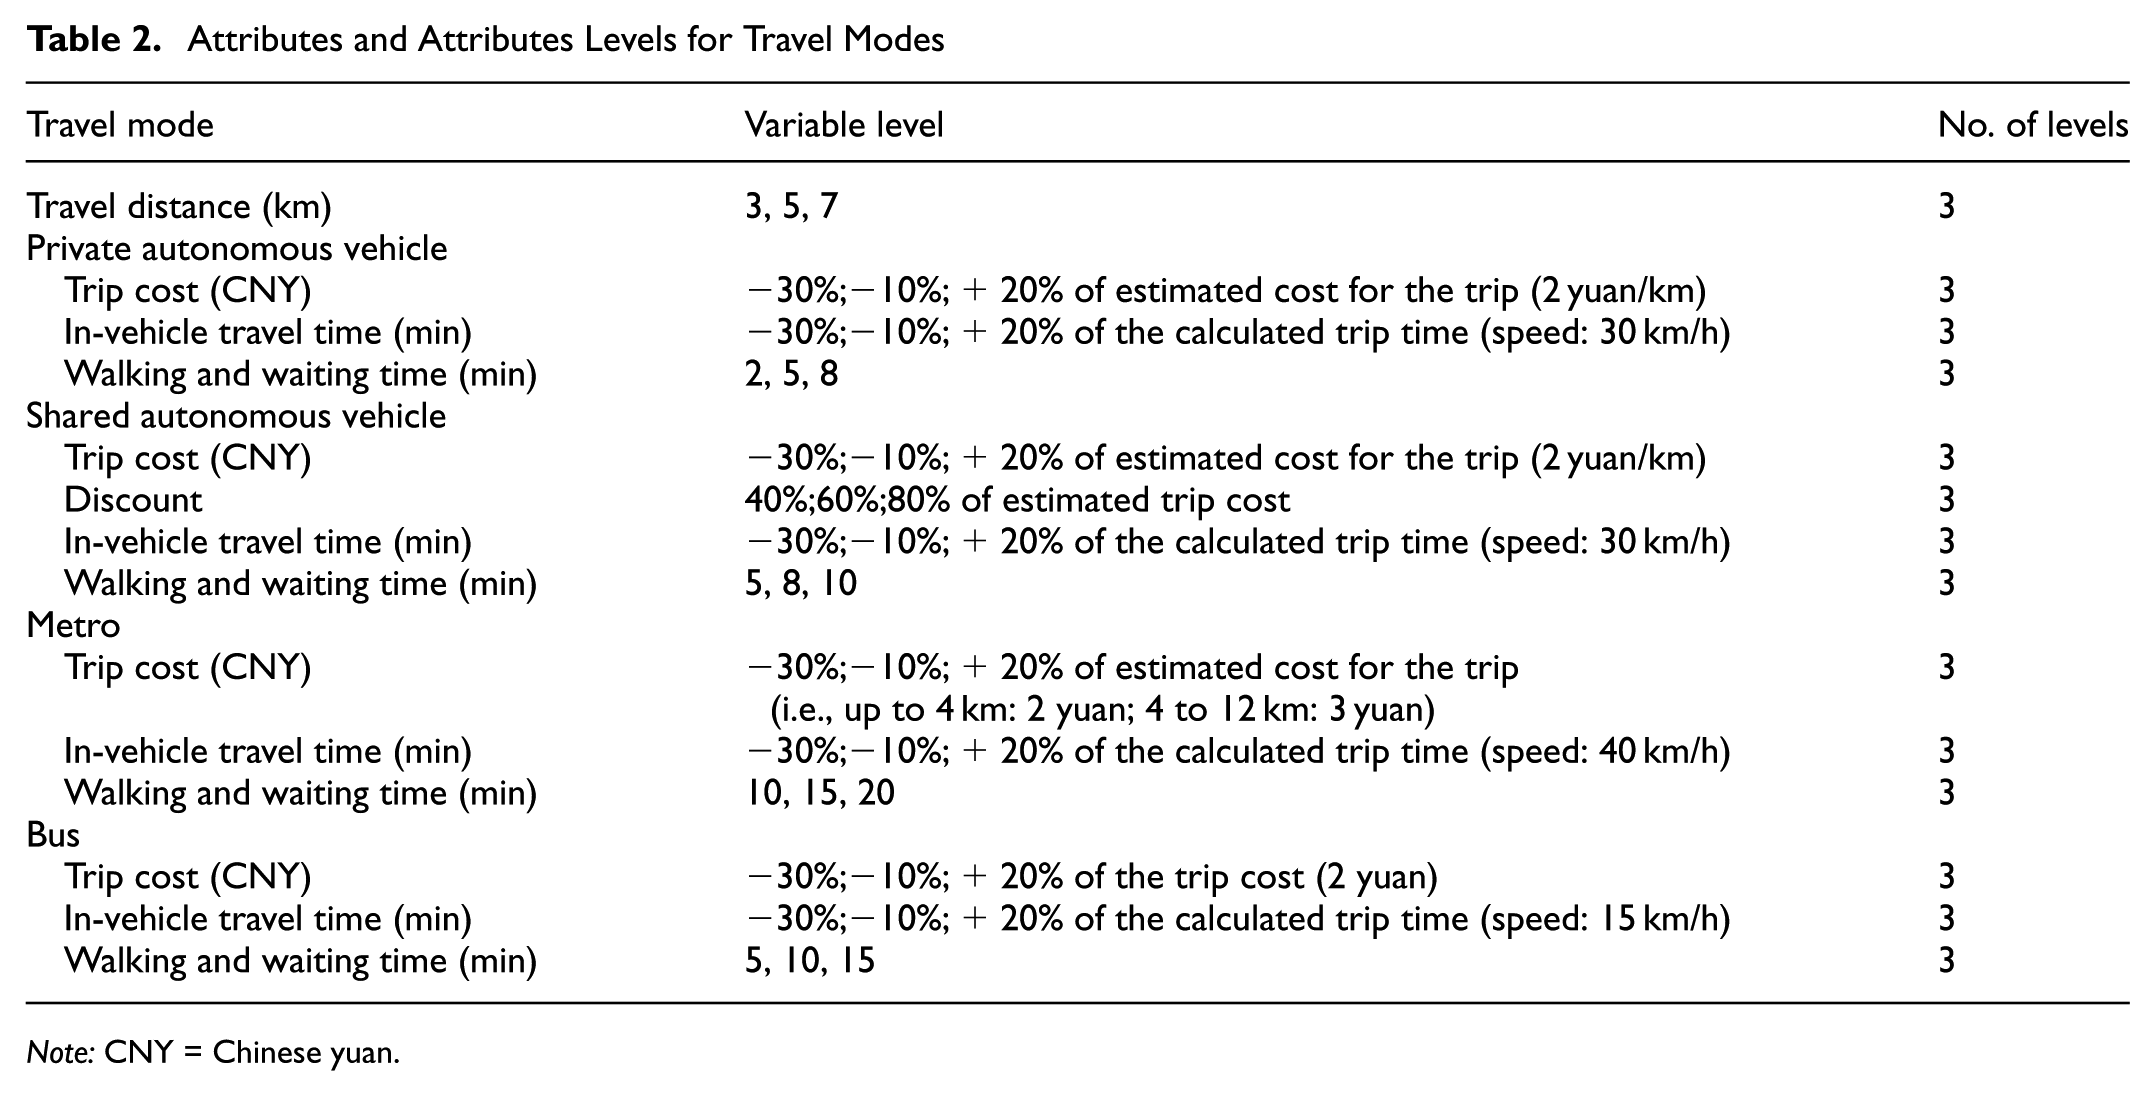
Note: CNY = Chinese yuan.
An Example of a Stated-Preference Profile
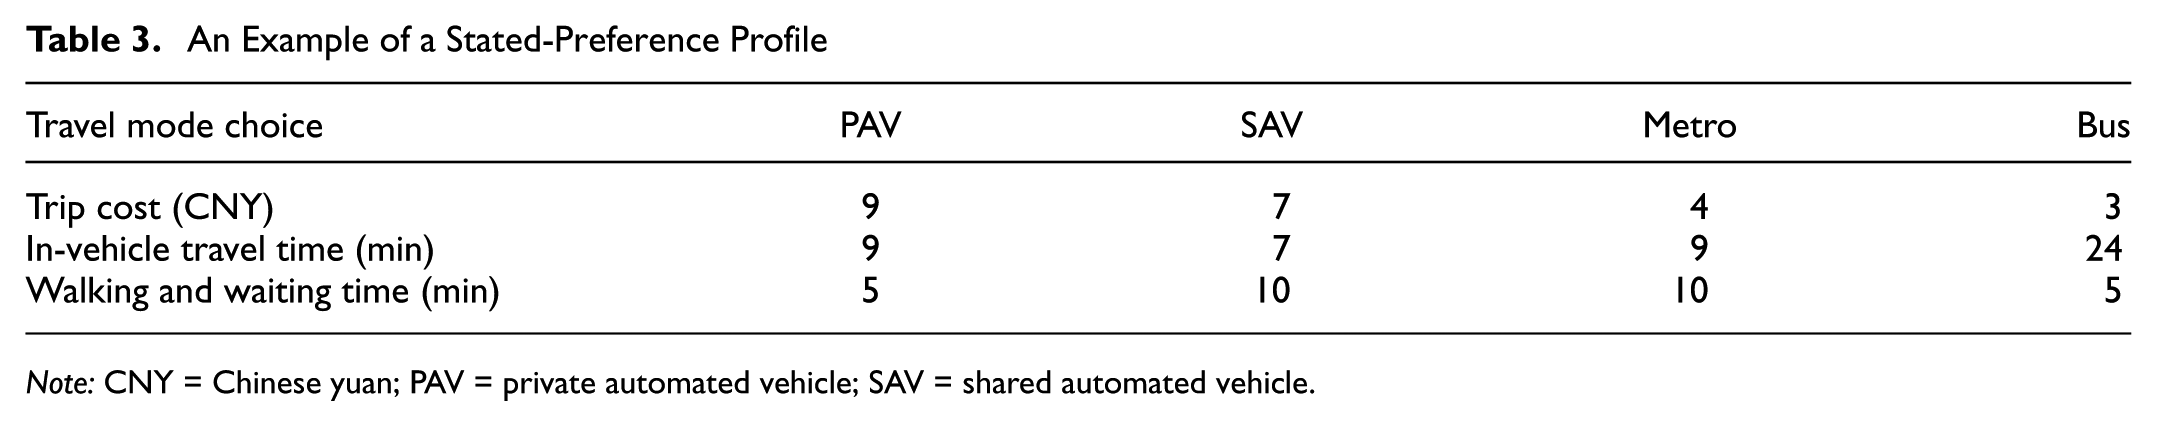
Note: CNY = Chinese yuan; PAV = private automated vehicle; SAV = shared automated vehicle.
Choice Model
Latent Variable Modeling
Latent variable models typically comprise two principal components: the structural model and the measurement model ( 91 ). The structural model delineates the causal relationships among latent variables. Assuming the presence of latent variables η and ξ, their relationship is expressed as

where
The measurement model delineates how latent variables are estimated using observable variables. For each latent variable, a set of observable variables (or indicators) linearly relates to the latent variable as follows:


where
Random Parameter Logit Model
The RPL model provides a method of addressing heterogeneity in preferences among individuals within choice models ( 92 ). This model captures variations in consumer preferences across various choice attributes by incorporating random parameters.

where
In this study, the parameters associated with key travel attributes, including travel cost, in-vehicle travel time, and walking and waiting time, were specified as random parameters to capture heterogeneity in elderly travelers’ sensitivities to these attributes. This specification is consistent with the mixed logit literature, which emphasizes that random coefficients can flexibly represent unobserved taste heterogeneity and relax the restrictive IIA assumption imposed by the conventional MNL model (93–95). In transportation research, allowing time- and cost-related coefficients to vary randomly has become a standard approach for identifying behavioral differences across travelers with distinct sociodemographic backgrounds, mobility capabilities, and technology perceptions ( 96 ).
A normal distribution was assumed for these random parameters. Although negative log-normal distributions are frequently adopted in travel behavior studies to constrain travel time and cost parameters to be strictly negative, normal distribution was used in this study because it provides greater flexibility in capturing heterogeneous preferences across individuals and avoids overly restrictive sign assumptions when the behavioral context is evolving ( 94 , 95 ). This consideration is particularly relevant in the context of emerging mobility services such as AVs. Compared with conventional driving conditions, automated mobility may alter travelers’ perceptions of travel time because the physical and cognitive burden of driving can be reduced and passengers can engage in other activities during the trip. Consequently, the perceived disutility of travel time may vary across individuals, especially among older adults whose functional status, travel needs, and openness to automation may differ substantially ( 97 ).
Importantly, although normal distribution allows both positive and negative deviations at the individual level, the estimated mean coefficients for travel cost, in-vehicle travel time, and walking and waiting time remained negative and statistically significant in the model results. These findings are consistent with conventional travel behavior theory, which suggests that travelers generally prefer lower travel costs and shorter travel times ( 94 ). Therefore, the use of normal distribution allowed the model to capture potential preference heterogeneity without imposing restrictive sign constraints that could bias parameter estimates or obscure meaningful behavioral variation across elderly travelers.
Model Parameter Estimation
Parameter estimation for the RPL model typically relies on simulated maximum likelihood estimation because the choice probabilities involve integrals over the distribution of random coefficients that are generally intractable analytically. In practice, simulation-based methods using low-discrepancy sequences, such as Halton or Sobol draws, are widely adopted to improve numerical efficiency and estimation stability relative to purely random simulation ( 98 , 99 ).
Currently, two broad approaches exist for estimating discrete choice models with latent variables: simultaneous estimation and sequential estimation. Simultaneous estimation, often discussed in the integrated choice and latent variable framework, is theoretically attractive because it jointly estimates the latent variable measurement model and the choice model within a unified likelihood function ( 100 , 101 ). However, when random parameters, repeated choices, and multiple latent constructs are introduced simultaneously, the model becomes substantially more demanding in relation to identification, convergence, and computational burden ( 102 , 103 ).
Therefore, this study adopted a sequential estimation strategy. First, latent psychological constructs were estimated using confirmatory factor analysis (CFA), following established psychometric practice for deriving reliable factor scores from multiple observed indicators ( 104 ). The resulting factor scores were then incorporated as explanatory variables in the RPL model. This approach allowed the model to capture both psychological influences and preference heterogeneity in elderly travelers’ motorized travel choices while maintaining computational tractability. Although sequential estimation does not fully propagate the measurement uncertainty of latent variables into the choice model, it remains a well-established and defensible strategy in applied transportation research, particularly when the objective is to integrate attitudinal constructs into a flexible mixed logit framework in an empirically feasible manner ( 101 , 103 , 105 ).
Results
Descriptive Statistics
The descriptive statistics of the survey respondents are summarized in Table 4. The final sample consisted of 734 older adults, with a slightly higher proportion of females (55.86%) than males (44.14%), which is broadly consistent with the gender composition of the elderly population in urban China. In relation to age distribution, respondents aged 60 to 65 constituted the largest group (46.32%), followed by those aged 66 to 70 (31.47%). Older age groups were also represented, with 16.35% aged 71 to 75 and 5.86% aged 76 and above, ensuring coverage across different stages of later life.
Socioeconomic Characteristics of Survey Respondents (N = 734)
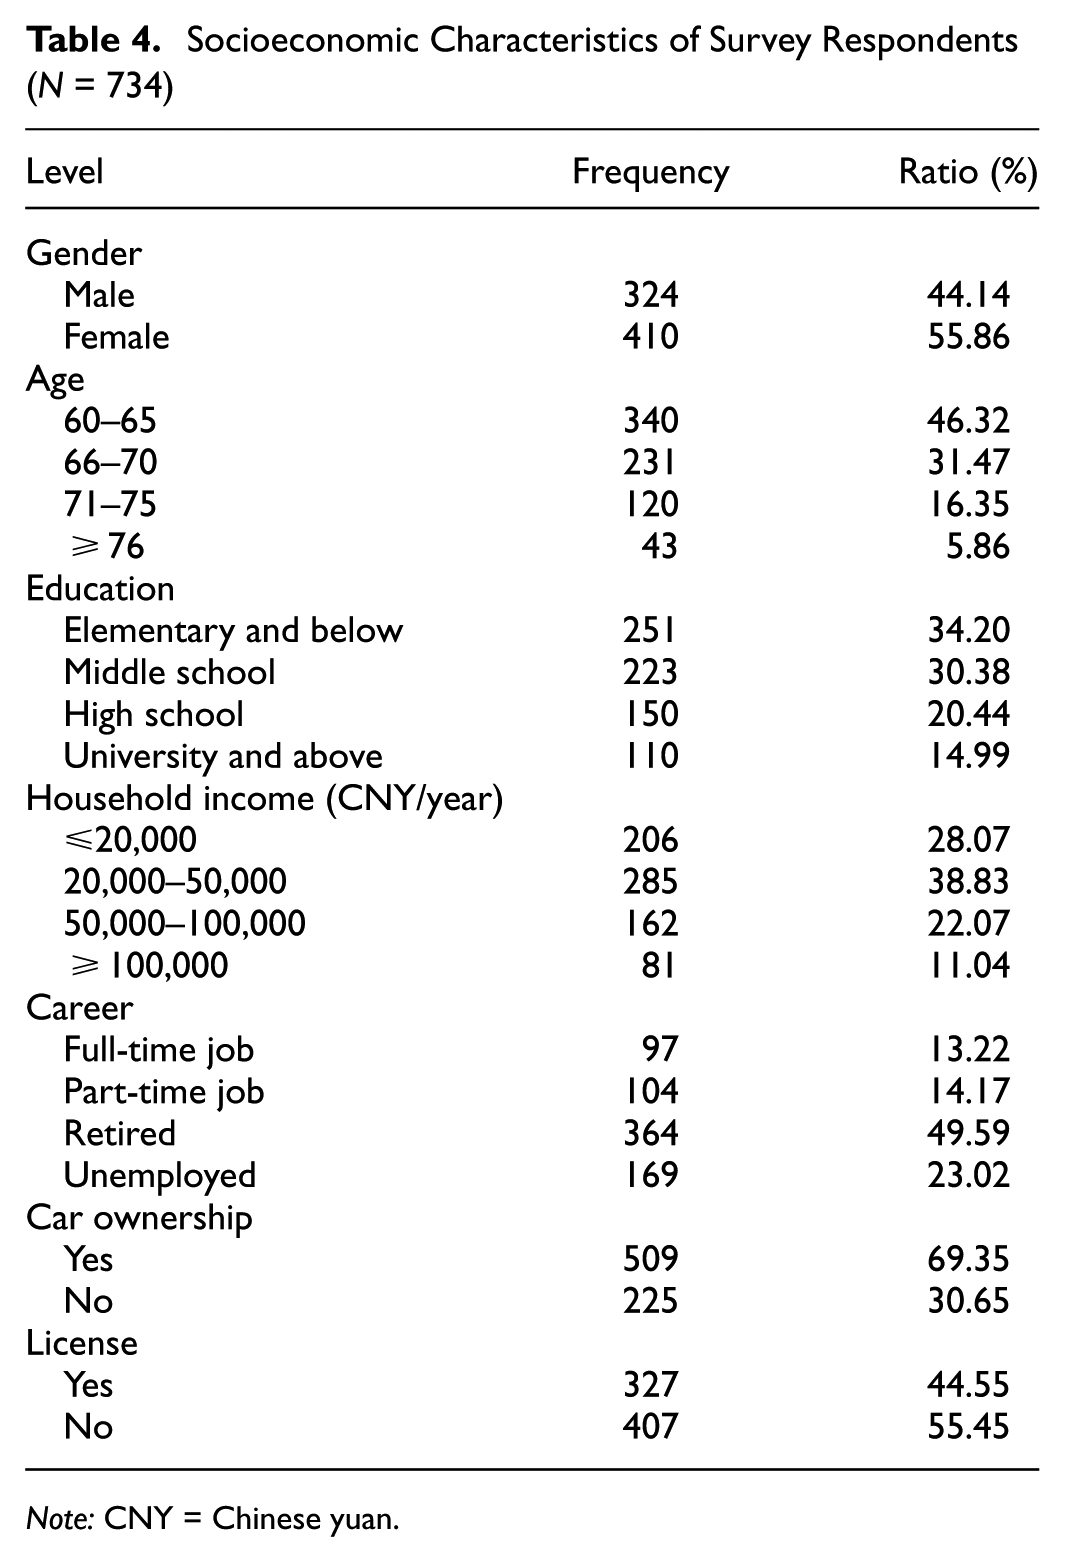
Note: CNY = Chinese yuan.
More than one-third of respondents had an education level of elementary school or below (34.20%), whereas 30.38% had completed middle school and 20.44% had completed high school. A smaller but nonnegligible share (14.99%) had attained university-level education or above, indicating substantial variation in human capital and cognitive resources within the sample. Household income levels also displayed notable heterogeneity: 28.07% of respondents reported an annual household income of CNY 20,000 or below, 38.83% fell within the CNY 20,000 to 50,000 range, 22.07% reported incomes between CNY 50,000 and 100,000, and 11.04% had incomes of CNY 100,000 or higher.
For employment status, nearly half of the respondents reported having retired (49.59%), whereas the remaining participants included those engaged in full-time work (13.22%), part-time work (14.17%), or currently unemployed (23.02%). With respect to mobility-related attributes, a majority of respondents reported owning a car (69.35%), whereas 30.65% did not. However, only 44.55% of the sample held a valid driving license, suggesting that car availability does not necessarily translate into driving capability among older adults.
Overall, the sample exhibited substantial socioeconomic and mobility-related heterogeneity, which provides a solid empirical basis for examining preference variation in motorized travel mode choice and for estimating RPL models that account for unobserved heterogeneity among older individuals.
Survey Results
StataMP17 was employed to test the latent variable model in this study. CFA was conducted to evaluate the impact of various factors on the adoption of AVs. Before conducting CFA, evaluating the reliability and validity of the data was imperative. Table 5 details the reliability and convergent validity of the constructs. Standardized factor loadings, which measure the strength of the relationship between observed and latent variables, ranged from 0.824 to 0.924, exceeding the standard threshold of 0.5 ( 106 ). Cronbach’s alpha, a measure of scale reliability, indicated that all values for the four latent variables exceeded the acceptable threshold of 0.70 ( 107 ). Composite reliability, assessing the consistency among a latent variable’s observed variables, registered a minimum value of 0.877, well above the threshold of 0.7 ( 108 ). The average variance extracted (AVE), reflecting the proportion of variance attributable to the latent variable rather than measurement error, ranged from 0.700 to 0.842, demonstrating good structural reliability and convergent validity ( 109 ). Table 6 presents the results of the discriminant validity test, where all squared AVE values exceeded the interconstruct correlations, confirming acceptable discriminant validity. This validated measurement model has been utilized in structural model analysis.
Reliability and Convergent Validity of Constructs
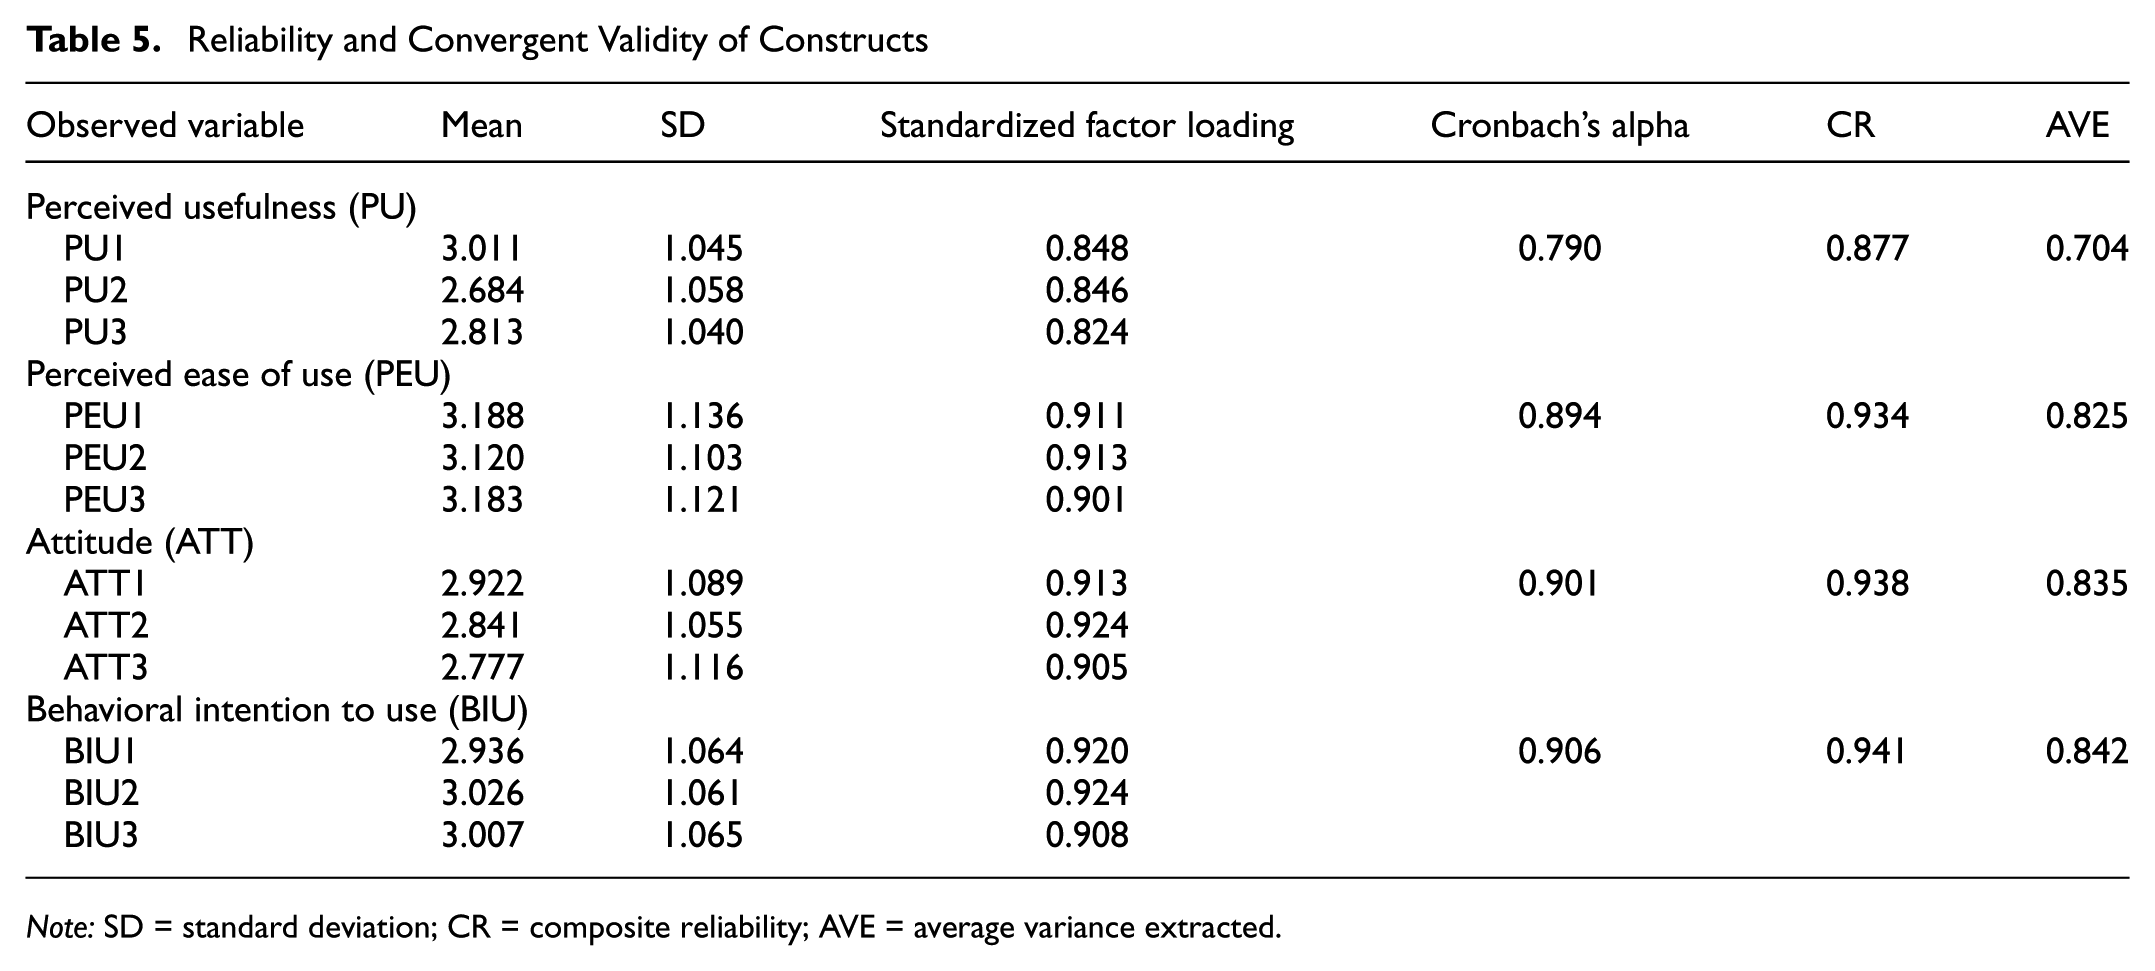
Note: SD = standard deviation; CR = composite reliability; AVE = average variance extracted.
Results of Discriminant Validity Test
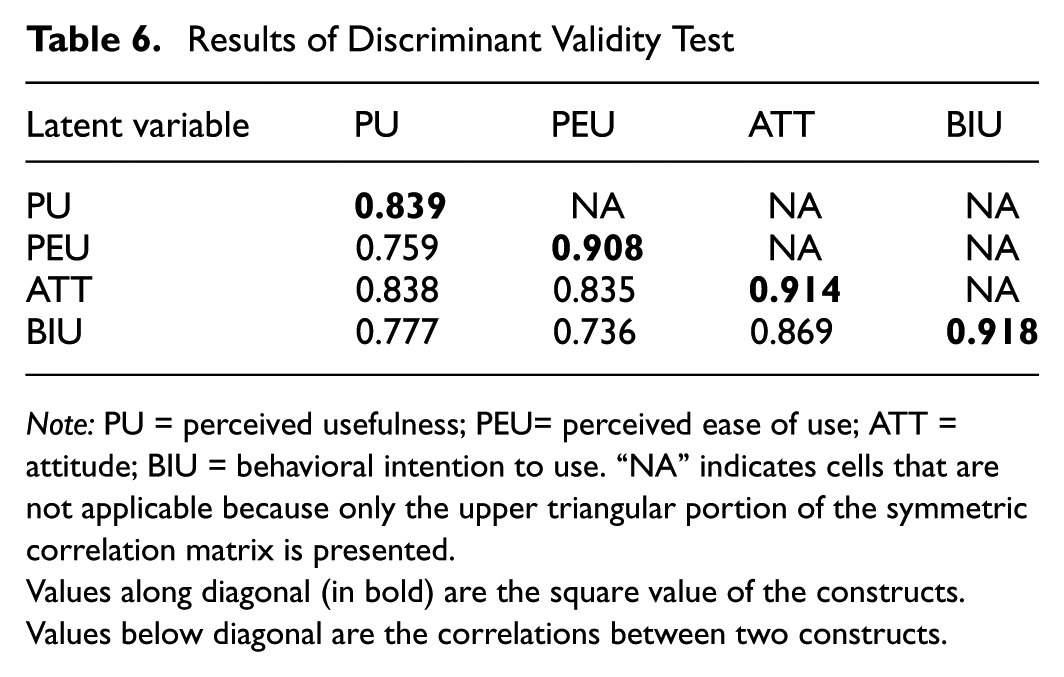
Note: PU = perceived usefulness; PEU= perceived ease of use; ATT = attitude; BIU = behavioral intention to use. “NA” indicates cells that are not applicable because only the upper triangular portion of the symmetric correlation matrix is presented.
Values along diagonal (in bold) are the square value of the constructs. Values below diagonal are the correlations between two constructs.
Based on the reliability and validity test results, the survey data were confirmed suitable for latent variable modeling analysis, with model fit indices detailed in Table 7. The chi-square to degrees of freedom ratio is typically used only as a reference. The root mean square error of approximation (RMSEA) is an absolute fit index comparing the hypothesized model to a perfect model ( 110 ). The comparative fit index (CFI) and the Tucker–Lewis index (TLI) primarily assess the degree of improvement of the final model relative to a baseline model ( 111 , 112 ). The standardized root mean square residual (SRMR) is primarily used to evaluate the mean standardized residuals between the fitted and observed covariance matrices ( 110 ). The results demonstrate that the model fit is satisfactory, with all indices satisfying the reference criteria.
Fitness Statistics of the Confirmatory Factor Analysis
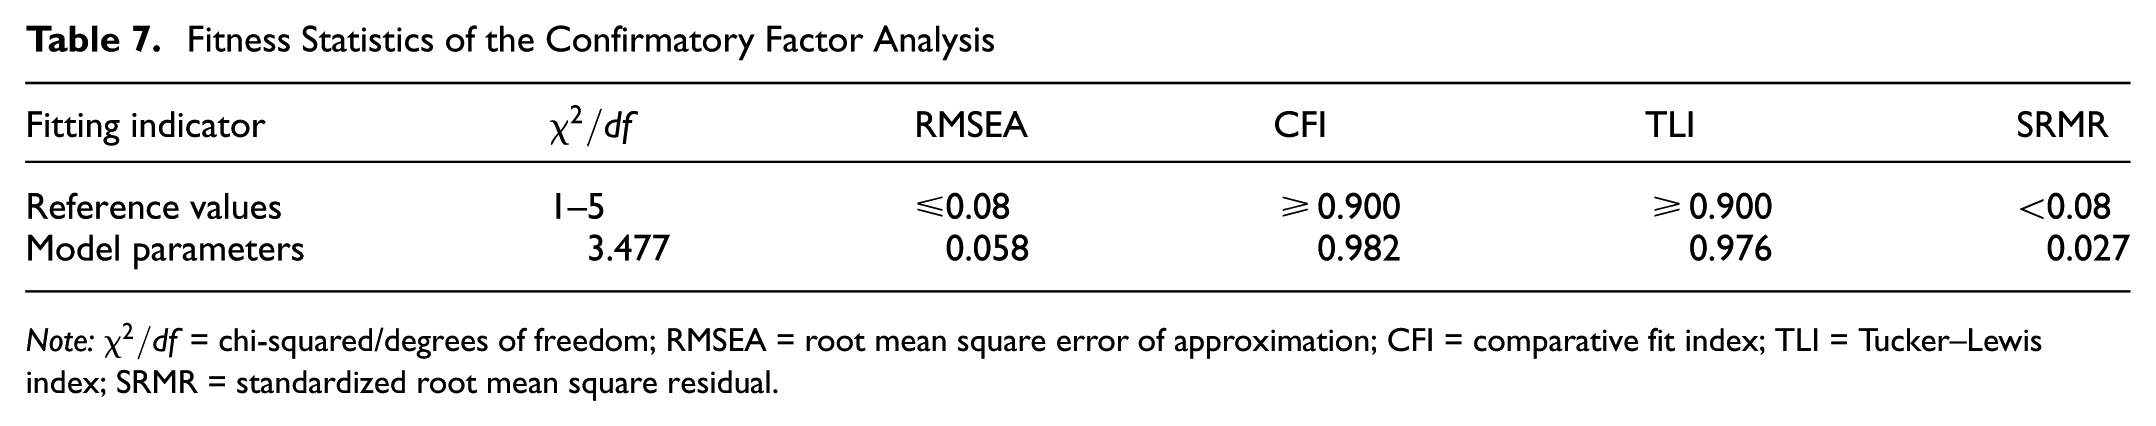
Note:
Model Results
The survey data were utilized to estimate MNL and RPL discrete choice models, with the final specifications presented in Table 8. The MNL model evaluated the effects of key variables involved in selecting among PAVs, SAVs, metro, and bus. The RPL model additionally assessed heterogeneity in taste parameters, as well as correlations among responses from the same individuals and between the random errors of the alternatives. All reported test statistics for the RPL model were based on robust (sandwich) standard errors clustered at the individual level, to account for repeated observations per respondent and potential heteroskedasticity in SP data. This information enables more effective consideration of diversity in user preferences and identification of more complex substitution patterns than those identified by the MNL model. The RPL model was estimated via simulated maximum likelihood employing a Halton sequence of 2,500 draws. The model demonstrated robust goodness of fit to the data, with an adjusted ρ2 of 0.227, significantly surpassing that of the MNL, thereby establishing the RPL model as the preferred choice. The RPL model additionally captured unobserved preference heterogeneity and correlation in utility components across alternatives and repeated choices. Although explicit error correlation parameters between alternatives were not separately estimated, the combination of random coefficients and the panel-data structure allowed the model to account for correlation in unobserved utilities across alternatives and within individuals. In this study, correlation in unobserved utility components was addressed through the random-parameter specification rather than through an explicit nested or error-component structure. Allowing key coefficients (trip cost, in-vehicle travel time, and walking and waiting time) to vary randomly across individuals introduced shared stochastic components in the utilities, which relaxed the IIA assumption and induced correlation across alternatives.
Estimation Results of the Multinomial Logit and Random-Parameter Logit Models for Older Adults’ Motorized Travel Mode Choice
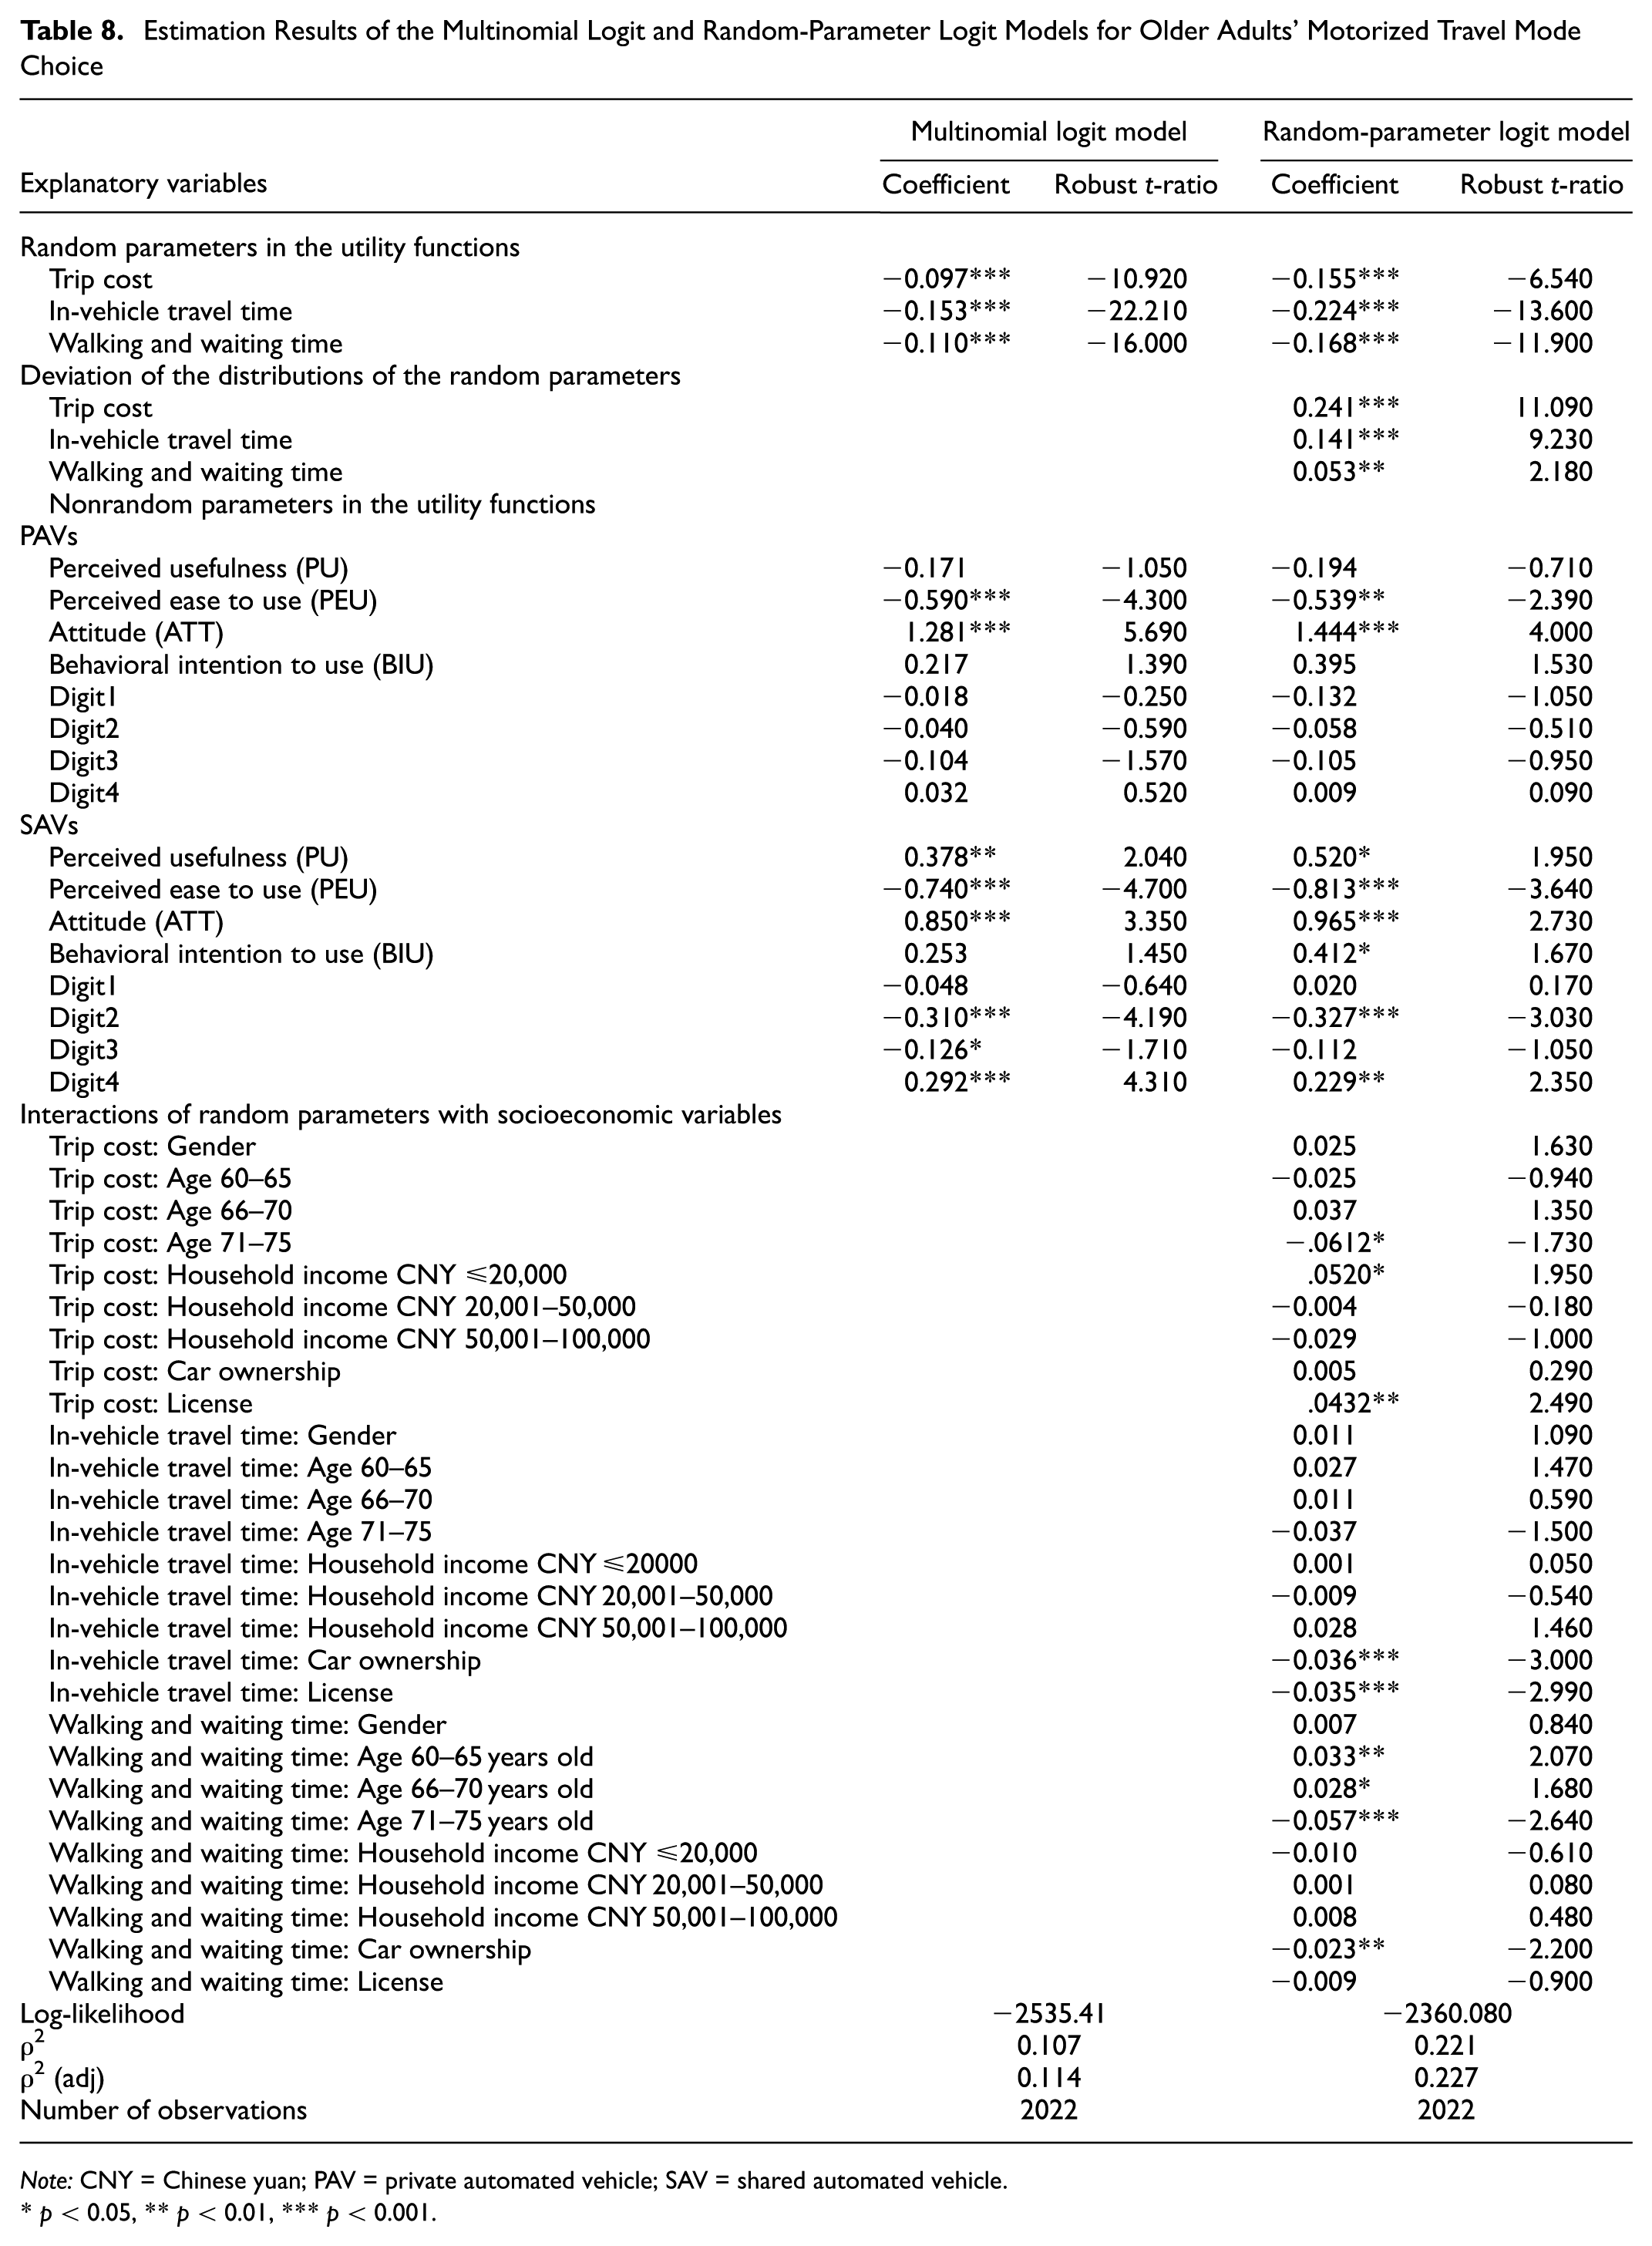
Note: CNY = Chinese yuan; PAV = private automated vehicle; SAV = shared automated vehicle.*p < 0.05, **p < 0.01, ***p < 0.001.
Low-discrepancy sequences such as Halton are commonly used in mixed logit estimation because they provide faster convergence and lower simulation variance than pseudo-random Monte Carlo draws for a given number of replications. Alternative simulation methods, including pseudo-random draws and Sobol sequences, were considered in preliminary robustness checks and yielded substantively similar results in coefficient signs, magnitudes, and statistical significance. Given the comparable outcomes and the superior computational efficiency of Halton sequences, the final model specification relied on Halton draws, consistent with established practice in the discrete choice literature.
The statistical significance discussed below was evaluated based on robust t-ratios, ensuring conservative and reliable inferences for both random parameters and their interactions with socioeconomic characteristics. The perceptions of elderly individuals with regard to the usability and utility of AVs, alongside their ATTs and BIUs, significantly influenced their choice between SAVs and PAVs. Moreover, the digital competence of elderly individuals affected their choice of AVs. Based on these findings, a random coefficients model was developed to eliminate socioeconomic attributes that exerted a nonsignificant effect on the random variables. As indicated in Table 8, within the RPL model, the overall means for trip cost, in-vehicle travel time, and walking and waiting time were negative, which is consistent with previous studies ( 113 , 114 ). Furthermore, the substantial standard deviations of these variables suggested that the coefficients for trip cost, in-vehicle travel time, and walking and waiting time were indeed random variables.
Consistent with previous studies, the variable ATT had a significant positive influence on the choice of PAVs and SAVs ( 37 , 115 ). However, contrary to previous findings, PEU had a significant negative impact on the selection of PAVs and SAVs ( 37 , 115 , 116 ). This was attributed to the relative novelty of AV technology, which may lead older adults to worry about its safety and ease of use, resulting in a lack of confidence and consequently negative perceptions. Older adults who perceive AVs as offering a more convenient and safer driving experience may exhibit positive ATTs, considering PAVs a worthwhile choice. PU exerted a significant positive effect on the selection of SAVs, which is consistent with previous studies ( 115 ), though its impact on the selection of PAVs was nonsignificant. For SAVs, PU included cost efficiency, the reduction of private vehicle ownership, and the alleviation of traffic congestion. The shared model enhanced its economic benefits by providing on-demand services and reducing vehicle idle time and maintenance costs, thereby significantly attracting users. In contrast, the PU of PAVs may have been constrained by high purchase and maintenance costs and the restrictive nature of personal usage scenarios, rendering them less appealing than shared models.
Physical digital skills and recreational digital skills did not significantly affect the choice of PAVs or SAVs. Social digital skills had a significant negative effect on the choice of SAVs, whereas financial digital skills had a significant positive effect. Elderly individuals with high social digital skills may be more aware of the privacy risks associated with sharing personal information on digital platforms. The requirement to share personal travel and location data when using SAVs may cause discomfort among these users. Users with financial digital skills are likely to be better equipped to recognize and calculate the cost-effectiveness of using SAVs, such as saving on maintenance and parking fees of private vehicles. This allows for reallocating funds from the purchase and upkeep of private vehicles to potentially more profitable investments.
Table 8 also presents the interactions of random parameters with socioeconomic variables. For the trip cost coefficient, significant heterogeneity was associated with being aged 71 to 75, having a household income of CNY ≤20,000, and holding a driving license. For the in-vehicle travel time coefficient, significant heterogeneity was associated with car ownership and driving license status. For the walking and waiting time coefficient, significant heterogeneity was associated with age groups 60 to 65, 66 to 70, and 71 to 75 years, as well as car ownership. Other socioeconomic interaction terms were not statistically significant.
Elasticities and Simulations
The estimated RPL model was employed to calculate the elasticities of various attributes, as detailed in Table 9. Elasticity analysis was divided into direct- and cross-elasticities. Direct elasticity measures the change in the probability of choosing an option when a specific attribute of that option changes. The absolute values of direct elasticity for trip cost were all less than 1, indicating that a 1% increase in the travel costs of the four modes of transport resulted in less than a 1% decrease in the probability of their selection. The absolute values of direct elasticity for in-vehicle travel time for PAVs, SAVs, and buses were all greater than 1, suggesting that a 1% increase in in-vehicle travel time led to a decline in selection probability of more than 1% among the elderly. For walking and waiting time, the absolute values of direct elasticity for PAVs and SAVs were less than 1, whereas those for metro and bus were greater than 1. PAVs and SAVs, offering point-to-point services, typically reduce walking and waiting time for users. Moreover, these modes of transport provide more personal space and comfort. Even with increased walking and waiting time, this comfort and convenience may still make these services attractive to users, thus demonstrating lower elasticity. In contrast, public transport such as the metro and bus involves more walking and waiting time. The use of public transport is often constrained by fixed routes and schedules, leading users to opt for faster or more direct modes of transport when walking and waiting time increase. Consequently, users of metro and bus are more sensitive to walking and waiting time.
Direct and Cross Point Elasticities for the Random-Parameter Logit Model
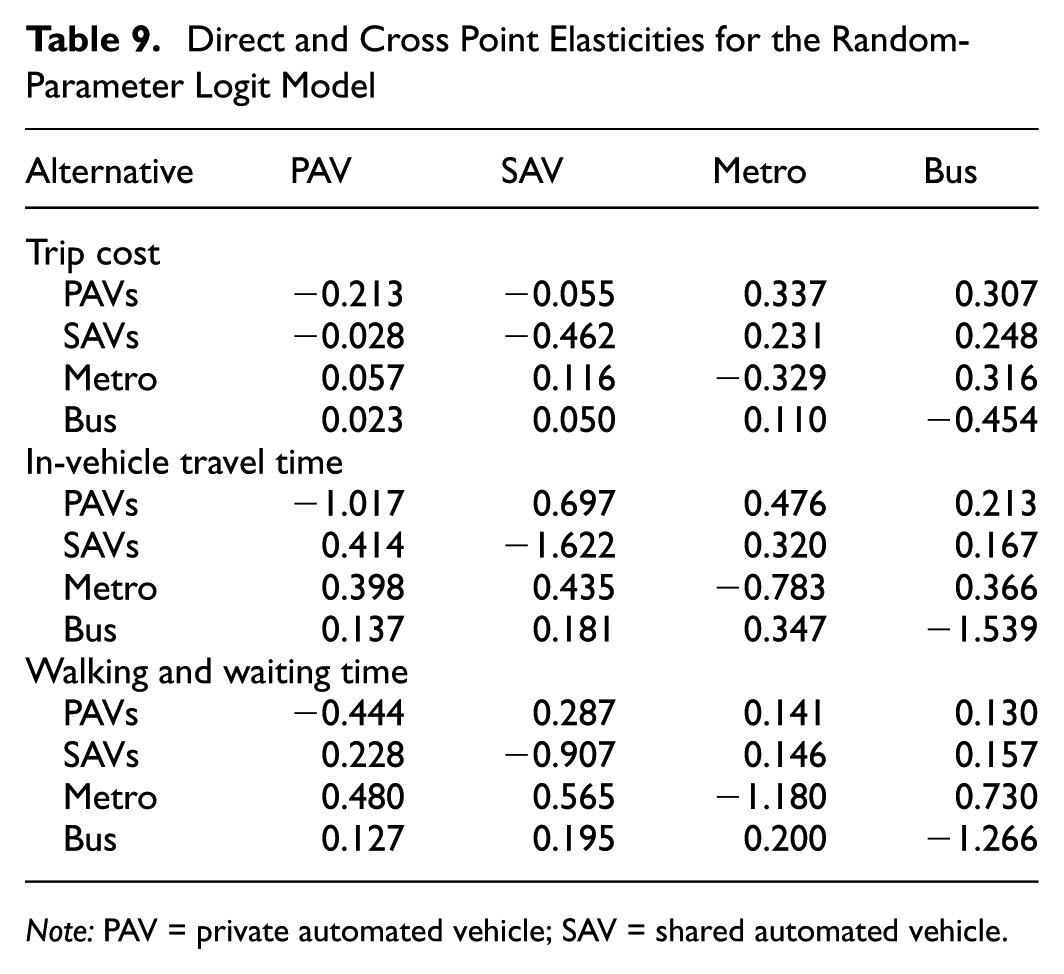
Note: PAV = private automated vehicle; SAV = shared automated vehicle.
Cross-elasticity measures the impact on the selection probabilities of other options when a specific attribute of one option changes. When metro’s walking and waiting time increased by 1%, the largest cross-elasticities were observed for PAVs and bus, with their selection probabilities increasing by 0.480 and 0.730 percentage points, respectively. The metro is typically regarded as a fast and efficient mode of transportation, especially in densely populated and highly congested urban environments. An increase in walking and waiting time may reduce the overall travel time advantage of the metro, thereby diminishing its attractiveness. PAVs offer greater comfort and convenience, whereas buses may present a more economical option, making both PAVs and buses attractive alternatives. When the in-vehicle travel time of PAVs increased by 1%, the highest cross-elasticities were with SAVs and metro, leading to increases in their selection probabilities of 0.697 and 0.476 percentage points, respectively. Elderly individuals often value the efficient use of time spent in vehicle. An increase in PAVs’ travel time directly raised the time cost of travel, potentially leading time-sensitive elderly individuals to opt for faster transportation modes. SAVs provide conveniences similar to PAVs but typically operate at lower costs and may have optimized routes and scheduling efficiency in high-demand areas. The metro system offers a predictable mode of transportation owing to its limited susceptibility to traffic conditions and fixed schedules. As PAV travel time increases, the metro may become a more appealing option given its relatively faster fixed routes.
Discussion and Conclusions
Summary of Results
This study, based on the TAM, employed an RPL model to explore how PU, PEU, ATTs, BIUs, and the digital skills of the elderly (physical, social, recreational, and financial), as well as travel costs, in-vehicle time, and walking and waiting time, influenced their choice of AVs for mobility. Data were collected both online and offline via the Wenjuanxing platform, with Wuhan city, Hubei Province, serving as a case study. The findings revealed significant heterogeneity in the mobility preferences of older adults. The study indicated that coefficients for travel costs, in-vehicle time, and walking and waiting time were random variables associated with individuals’ socioeconomic attributes. For example, the coefficient for trip cost was significantly influenced by age (71 to 75 years), household income (CNY ≤20,000), and license status. Smartphone ownership did not exhibit a statistically significant association with the choice of PAVs or SAVs once functional digital skill variables were included. This suggests that mere access to a smartphone is insufficient to influence AV preferences; instead, it is the ability to use digital services for social interaction and financial transactions that plays a more substantive role.
With regard to psychological latent variables, PEU showed a statistically significant negative association with choosing both PAVs and SAVs in our SP setting. This incongruous effect should be interpreted cautiously: a plausible interpretation is that respondents who reported higher “ease-of-use” expectations may also hold higher operational-safety expectations and thus be more sensitive to the uncertainty surrounding an emerging technology—this could translate into a lower stated propensity to choose AV alternatives. ATTs were positively and significantly associated with choosing both PAVs and SAVs, consistent with prior acceptance research, indicating that more favorable overall evaluations of AV travel are linked to greater choice propensity for autonomous options. PU was significantly positive for SAVs, whereas its effect for PAVs was not statistically different from zero. This asymmetry is consistent with a distinction between the “service” logic of SAVs and the “ownership” logic of PAVs: for SAVs, perceived benefits can be translated more directly into pay-per-use outcomes such as the reduced out-of-pocket burden per trip, avoided parking and ownership responsibilities, and flexible on-demand access. For PAVs, the perceived net usefulness of private ownership may be partially offset by anticipated fixed burdens and uncertainties (e.g., purchase and maintenance responsibilities, parking/insurance, and uncertainty about near-term usability for older users) that are not fully represented by marginal trip attributes.
Digital competence exhibited heterogeneous associations with SAV choice, with social digital skills being negatively related and financial digital skills being positively related, suggesting that different digital skill domains may shape older adults’ evaluations of shared autonomous services through distinct channels (e.g., information privacy sensitivity versus perceived economic benefits). Implications for interface design and user support are discussed in the section covering implications.
The elasticity analysis results showed that the absolute values of direct elasticity for in-vehicle travel time for both PAVs and SAVs exceeded 1, indicating that travel time was a critical determinant of older adults’ AV choices. From a policy standpoint, this finding underscores the importance of integrating AV services into urban traffic management systems, prioritizing dedicated lanes, signal coordination, and demand-responsive scheduling to minimize travel time uncertainty for elderly users. The relatively low cross-elasticity between SAVs and metro suggested weak substitutability between these two modes for older adults. Unlike metro services, which rely on fixed routes and stations and impose higher access and egress burdens, SAVs offer door-to-door, on-demand mobility that reduces walking, waiting, and transfer requirements. For elderly travelers with heightened sensitivity to physical effort and access convenience, these structural differences limit the extent to which metro attribute changes translate into SAV substitution. Moreover, metro is often perceived as a distinct, infrastructure-based mode suited for routine or longer-distance trips, whereas SAVs are evaluated as flexible service alternatives, further dampening cross-elastic responses.
Taken together, these findings directly address the research gaps identified in earlier sections. First, by integrating TAM constructs and domain-specific digital competencies into an RPL framework, this study moved beyond descriptive acceptance analyses and has provided behavioral evidence on how psychological and digital factors translate into actual mode choice. Second, the random parameter specification allowed us to disentangle unobserved taste heterogeneity from the heterogeneity systematically associated with socioeconomic characteristics, which has been insufficiently examined in prior studies focusing on older adults’ AV adoption. Third, by explicitly distinguishing between PAV and SAV alternatives within the same choice experiment, this study has clarified how older adults evaluate “ownership-based” versus “service-based” autonomous mobility options, thereby filling a gap in the comparative understanding of autonomous travel modes for aging populations.
Contributions and Comparison to Literature
This study advances the scholarly understanding of AV adoption among older adults by integrating psychological constructs from the TAM, multidimensional digital competencies, and travel behavior variables into an RPL framework. This methodological integration addresses several critical limitations in existing literature and offers novel insights into how aging populations engage with emerging mobility technologies.
First, while the TAM has been widely used to examine AV adoption ( 51 , 117 ), most applications focus on attitudinal or intention-based models using structural equation modeling ( 57 , 118 ). Few studies incorporate TAM variables directly into discrete choice modeling frameworks that predict actual behavior under constrained scenarios. By embedding latent psychological variables—PU, PEU, ATT, and BIU—into an RPL model, this study bridges the gap between intention and choice, aligning with recent calls for behaviorally grounded extensions of TAM in transportation research ( 119 , 120 ).
Second, this research is among the first to operationalize the digital divide using functional digital competencies across four dimensions—physical, social, entertainment, and financial—and to estimate their direct impact on mode choice utility functions. Unlike prior studies that treat digital access as a background variable or latent construct ( 121 , 122 ), our model treats digital skills as observable covariates, enabling nuanced inferences about which domains of digital literacy (e.g., financial versus social) facilitate or hinder AV adoption among older adults.
Third, the use of an RPL model provides a flexible and powerful alternative to conventional MNL model or LCCM. The RPL model accommodates preference heterogeneity and accounts for repeated choice observations, thus offering more realistic behavioral predictions ( 123 , 124 ). Compared with the LCCM, which requires subjective class selection and rigid segmentation, the RPL model enables continuous variation in preferences, especially valuable in heterogeneous populations like the elderly ( 125 , 126 ).
Fourth, this study offers a comparative analysis of PAVs versus SAVs within the same choice experiment, which has rarely been examined in aging contexts. Whereas existing works often evaluate either SAVs or PAVs in isolation ( 119 , 127 ), we explicitly distinguish between “ownership-based” and “service-based” AVs, revealing that PU significantly influenced SAV choice but not PAVs, suggesting differentiated value perceptions based on cost structure and usage flexibility. This contributes to a more granular understanding of how older adults evaluate the trade-offs inherent in different AV configurations.
Finally, the study provides policy-relevant findings. Elasticity analysis showed that in-vehicle travel time significantly affected AV adoption among older adults, suggesting that SAV deployment strategies should prioritize service reliability and reduce time burdens. The counterintuitive negative association between PEU and AV choice highlighted the complexity of trust and risk perception in aging populations, consistent with recent research emphasizing the role of trust, uncertainty, and technology anxiety in AV acceptance ( 128 , 129 ).
Policy Implications
The policy relevance of this study lies not in generic support for autonomous mobility, but in clarifying which design levers matter for older adults, through which mechanisms, and for which AV service types.
First, the strong and heterogeneous sensitivity to in-vehicle travel time and walking and waiting time, as revealed by the random-parameter specification, indicated that time-related burdens remain the dominant constraint on older adults’ autonomous mode choice. Policies that prioritize operational reliability—such as dedicated pick-up/drop-off zones, smoother access design, and demand-responsive dispatching—are likely to yield larger behavioral impacts than uniform fare reductions alone, especially for SAV services.
Second, the asymmetric role of PU between SAVs and PAVs suggests that older adults evaluate “service-based” and “ownership-based” autonomous mobility through fundamentally different value logics. For SAVs, PU translated directly into perceived economic and functional gains (e.g., avoided ownership costs and flexible access), whereas for PAVs these benefits were offset by anticipated fixed burdens and uncertainty. Policy pilots and communication strategies should therefore emphasize usage-based value propositions for SAVs rather than framing autonomous mobility primarily as a private ownership upgrade.
Third, the differentiated effects of digital competencies highlighted that digital inclusion is not a uniform barrier. Financial digital skills facilitate SAV adoption, whereas higher social digital skills were associated with lower SAV preference, plausibly reflecting heightened privacy and data-sharing sensitivities. This finding implies that trust-building regulation—such as transparent data governance, simplified consent mechanisms, and elderly-oriented privacy communication—may be as important as improving digital access itself.
Finally, the negative association between PEU and AV choice underscored that ease-of-use perceptions among older adults may be intertwined with heightened safety expectations and uncertainty toward emerging technologies. Rather than assuming that simplified interfaces alone will guarantee acceptance, policy makers and operators should prioritize gradual exposure, experiential learning, and reassurance-oriented design (broader recommendations are discussed in the section on implications).
Limitations and Further Work
This study advances the understanding of elderly individuals’ travel mode choices and preferences for AVs by integrating psychological constructs and digital competencies within a discrete choice modeling framework. Nonetheless, several limitations should be acknowledged, offering meaningful directions for future research.
The sample employed in this study was limited to older adults residing in specific urban areas of China, potentially restricting the external validity of the findings. Cultural, geographic, and socioeconomic heterogeneity may lead to different behavioral responses. Future studies should broaden the sampling frame to include rural residents and conduct cross-regional or international comparisons to uncover the influence of contextual and cultural variations on AV adoption.
Although this study accounted for key psychological and digital capability factors, it did not include other potentially influential variables. Notably, aspects such as physical health condition, prior driving experience, and firsthand exposure to AVs could significantly shape technology acceptance among older adults. Incorporating such variables in future research could refine model precision and enhance interpretive power.
This research does not distinguish between different levels of vehicle automation (e.g., Level 2 semi-autonomous versus Level 5 fully autonomous systems). These distinctions may evoke varying psychological responses—such as perceived risk, trust, and control—which are especially critical for elderly users with cognitive or sensory decline. Future work should assess how degrees of automation affect BIU and PU.
In addition to the constructs already included, several psychosocial factors—such as trust in AV technology and privacy concerns related to data collection—were not explicitly incorporated into the empirical model. Previous research has shown that these factors can play an important role in shaping public acceptance of emerging mobility technologies ( 130 , 131 ). In particular, trust has repeatedly been identified as a central antecedent of users’ willingness to adopt automated driving systems, whereas concerns about data security, surveillance, and informational privacy may also affect acceptance of connected and autonomous mobility services ( 132 , 133 ). In the present study, these variables were not included primarily because of the design constraints of the SP experiment. To ensure that the survey remained manageable for respondents—particularly older participants—the number of attributes included in the experimental design had to be carefully limited to reduce cognitive burden and improve response reliability. Therefore, the study prioritized key travel attributes and psychological constructs that directly influence travel choice behavior. Future research could extend the current framework by explicitly incorporating trust- and privacy-related perceptions to further explore their influence on elderly travelers’ adoption of autonomous mobility services, especially given prior evidence that technology acceptance may vary across age groups and levels of familiarity with automation ( 134 , 135 ).
Although the RPL framework implicitly captures correlation in unobserved utilities through random coefficients and the panel structure, this study did not explicitly estimate alternative-specific error correlations (e.g., via nested logit or error-component models). Future research could extend the current framework by comparing alternative correlation structures to further disentangle substitution patterns among PAVs, SAVs, and public transport modes.
Footnotes
Author Contributions
The authors confirm contribution to the paper as follows: study conception and design: Z. Liu, L. Yang, J. Liu; data collection: Z. Liu, L. Yang, J. Liu; analysis and interpretation of results: Z. Liu, L. Yang, J. Liu; draft manuscript preparation: Z. Liu, L. Yang, J. Liu. All authors reviewed the results and approved the final version of the manuscript.
Declaration of Conflicting Interests
The authors declared no potential conflicts of interest with respect to the research, authorship, and/or publication of this article.
Funding
The authors disclosed receipt of the following financial support for the research, authorship, and/or publication of this article: This work was supported by the Wuhan Pilot construction of a strong Transportation Country Science and Technology Joint Research Projects (Grant no. 2024-2-1).
Informed Consent Statement
Informed consent was obtained from all subjects involved in the study.
Data Accessibility Statement
The data presented in this study are available on request from the corresponding author. The data are not publicly available owing to privacy.