
Abstract
Speed safety cameras (SSCs) are a recognized countermeasure for targeting speeding-related crashes, injuries, and fatalities. SSCs have been introduced in various cities and are steadily expanding in use both in the U.S. and internationally. The extensive literature review of domestic and international documents and research papers reveals that the U.S. has been comparatively slow to adopt SSCs, with some other countries implementing these systems more extensively and earlier. Many local agencies are eager to learn SSC best practices and implementation lessons within the U.S. context. In this research, key issues related to SSC implementation are explored through semi-structured interviews with the agencies possessing extensive SSC-related experience in the U.S. The interviews were highly valuable in understanding differences across agencies and provided a greater depth of information than that found through publicly available websites and reports. Interview results indicate that these agencies are addressing similar issues with regard to equity, fines, evaluation, and technological advancements. However, the approach to these issues and the strategies employed to tackle them vary widely in scope, administration, and requirements. This research summarizes best SSC practices in the U.S. and finds that U.S. cities are innovating in the realm of new approaches to enhance traffic law compliance, performance measures, targeting dangerous drivers, providing open data, and integrating equity criteria and considerations into their programs.
Keywords
Introduction
The NHTSA reports that speeding-related fatalities increased by 17% between 2019 and 2020, with an estimated 310,000 people injured in speeding-related crashes on American roadways in 2020 ( 1 ). Speed is a crucial factor in both the probability of a crash occurring and crash severity. Higher speeds reduce the ability of a driver to stop in time; decrease the ability of a driver to maneuver out of a dangerous situation; and make it difficult to negotiate curves.
Fundamentally, injury in crashes occurs when the forces generated exceed the body’s injury tolerance. Because crash forces are directly related to kinetic energy, calculated as ½(mass × velocity2), even small increases in speed lead to disproportionately large increases in crash energy and thus injury risk. Nilsson’s “Power Model” captures this relationship, showing that for each 1% increase in speed there is a corresponding 4% increase in fatalities ( 2 ). More recent studies have verified these results, though they have re-parameterized the model based on factors such as roadway classification and initial speed ( 3 – 5 ).
Speed safety cameras (SSCs) are a nationally recognized countermeasure for reducing speeding-related crashes. They use technology—typically cameras—to identify and penalize drivers who exceed speed limits, without requiring direct police intervention. The NHTSA lists automated enforcement as a speed management countermeasure in its 2020 Highway Safety Countermeasure Guide for State Highway Safety Offices ( 6 ). The FHWA also lists speed cameras as part of its Proven Safety Countermeasures ( 7 ). Therefore, SSCs are a valuable tool to help reduce speeding and thus reduce crashes for all users. It is worth noting that SSCs are also commonly referred to as automated speed enforcement (ASE), automated traffic enforcement (ATE), photo radar, traffic safety cameras, or speed cameras. In this paper, we will use the acronym SSC to highlight the direct link between this technology and its role in improving safety outcomes. Note that the term “automated traffic enforcement” is broader as it encompasses automated enforcement beyond speed, such as red light and bus lane enforcement.
Several academic studies have investigated the effects of both mobile and fixed SSCs on safety outcomes, including speeds and crashes. These studies cover a wide range of contexts both in the U.S. and abroad, including studies on urban and rural communities. Studies looking at speeds show a decrease in average speeds of around 10% ( 8 – 12 ) and a decrease in 85th percentile speeds between 1 and 7 mph ( 11 , 13 – 23 ) with the use of SSCs. Studies looking at fatal and/or serious injury crashes found reductions between 13% and 51% ( 8 , 9 , 20 , 24 – 36 ), while studies looking at all injury crashes found reductions most commonly between 16% and 27% ( 8 , 13 , 19 , 24 , 30 , 35 , 37 – 42 ).
SSCs have been introduced in various cities and are steadily expanding in use both in the U.S.), as well as abroad in Europe, South America, and Asia. However, the U.S. has been comparatively slow to adopt SSCs, with some other countries implementing these systems more extensively and earlier. As shown by recent data from the Insurance Institute for Highway Safety, 278 cities in the U.S. have implemented speed cameras ( 43 ). When compared with the total number of cities in the U.S.—approximately 19,500 incorporated places ( 44 ) —this accounts for only about 1.4% of cities nationwide. Further, SSC programs vary widely in scope, administration, organization, and requirements between states and cities in the U.S. As SSCs become more widespread, it is important to understand the efficacy, equity, and best practices associated with SSC programs. This research is a first step to identify the key jurisdictions within the U.S. that employ SSCs, and lessons learned and outcomes. In this paper, we identify key issues related to SSCs based on a national review; describe the interview process for five leading agencies in the U.S. pioneering the implementation of SSCs; and discuss the results and findings from these interviews.
SSCs in the U.S
As shown in Table 1, there are 21 states that permit SSCs by state law; 8 states that specifically prohibit SSCs by law; and 15 states that have no legislation related to SSCs. Four states have pilot programs, two states have feasibility studies or task forces, and one state has no legislation but allows city ordinances. While some states permit SSCs statewide for general purposes, many others either specify jurisdictions that can employ SSCs or designate a specific application of SSCs, such as work zones or school zones. It is common to focus SSCs on more vulnerable users or areas with a high number of crashes to garner more public support.
SSCs in the U.S. (as of 2024)
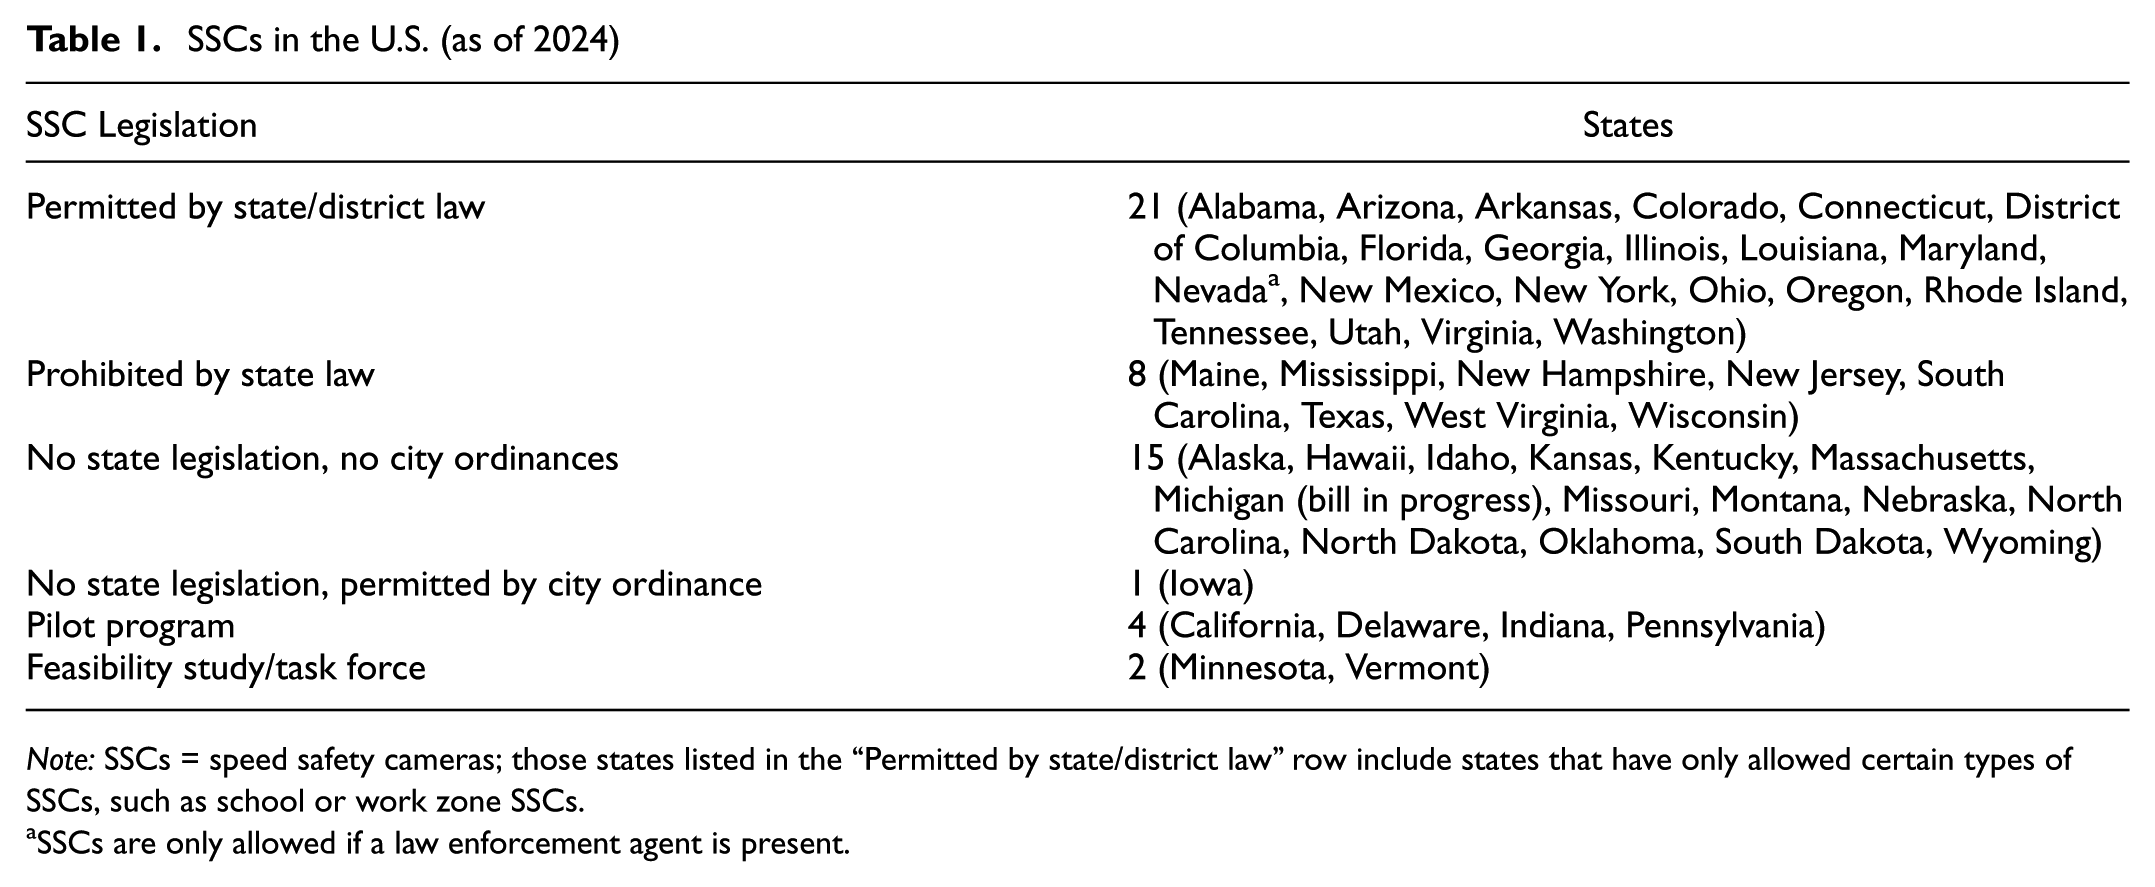
Note: SSCs = speed safety cameras; those states listed in the “Permitted by state/district law” row include states that have only allowed certain types of SSCs, such as school or work zone SSCs.
SSCs are only allowed if a law enforcement agent is present.
Key issues identified in a review of SSC programs in the U.S. include the following.
SSCs Outside the U.S
The research team reviewed SSC programs abroad to identify key components of programs around the world. The review was focused primarily on Europe and Australia, where information on SSC programs is more readily available. Many SSC programs outside the U.S. have been in place for decades and are often more developed and widespread than those in the U.S. As shown by a 2023 inventory, there are at least 15 countries in Europe that employ SSCs ( 45 ). These programs are highly centralized and automated, leading to a complete system with minimum overhead on issuing citations. In some cases, there is a specific department tasked with implementing SSCs, with minimal to no police involvement. For example, France’s SSC program is run by the Direction Contrôle Automatisé (DCA, or Automated Speed Enforcement Department) ( 46 ), while the national South Korean SSC program is fully operated by the Korean National Police Agency ( 47 ).
In addition, countries such as France implement a more network-wide approach instead of a city-by-city approach, to cover a wide range of areas and routes. This creates the idea of an omnipresent enforcement system for drivers ( 46 ). Both France and New South Wales, Australia, have specific and general deterrence, where the aim is to change behavior to discourage speeding behavior in all roads and specific locations ( 46 , 48 ). This concept is related to the use of both covert and overt enforcement. Covert, hidden enforcement is effective at changing driver behavior to slow down in general, while overt, visible enforcement helps control speeds in specific, marked locations.
A global literature review of SSC safety impacts shows that most empirical findings originate from Europe, Canada, and the U.S., with only one or two studies from South America and Asia. Notably, most papers with results from outside the U.S. are at least 10 years old, with more recent studies tending to focus on programs in the U.S. This highlights a gap in the literature on safety impacts of SSC programs in diverse contexts and presents an opportunity for further research on crash and speed outcomes from around the world and especially in the U.S. The literature review—focused on speed and/or crash outcomes only—is summarized in Table 2.
Speed and Crash Literature Review
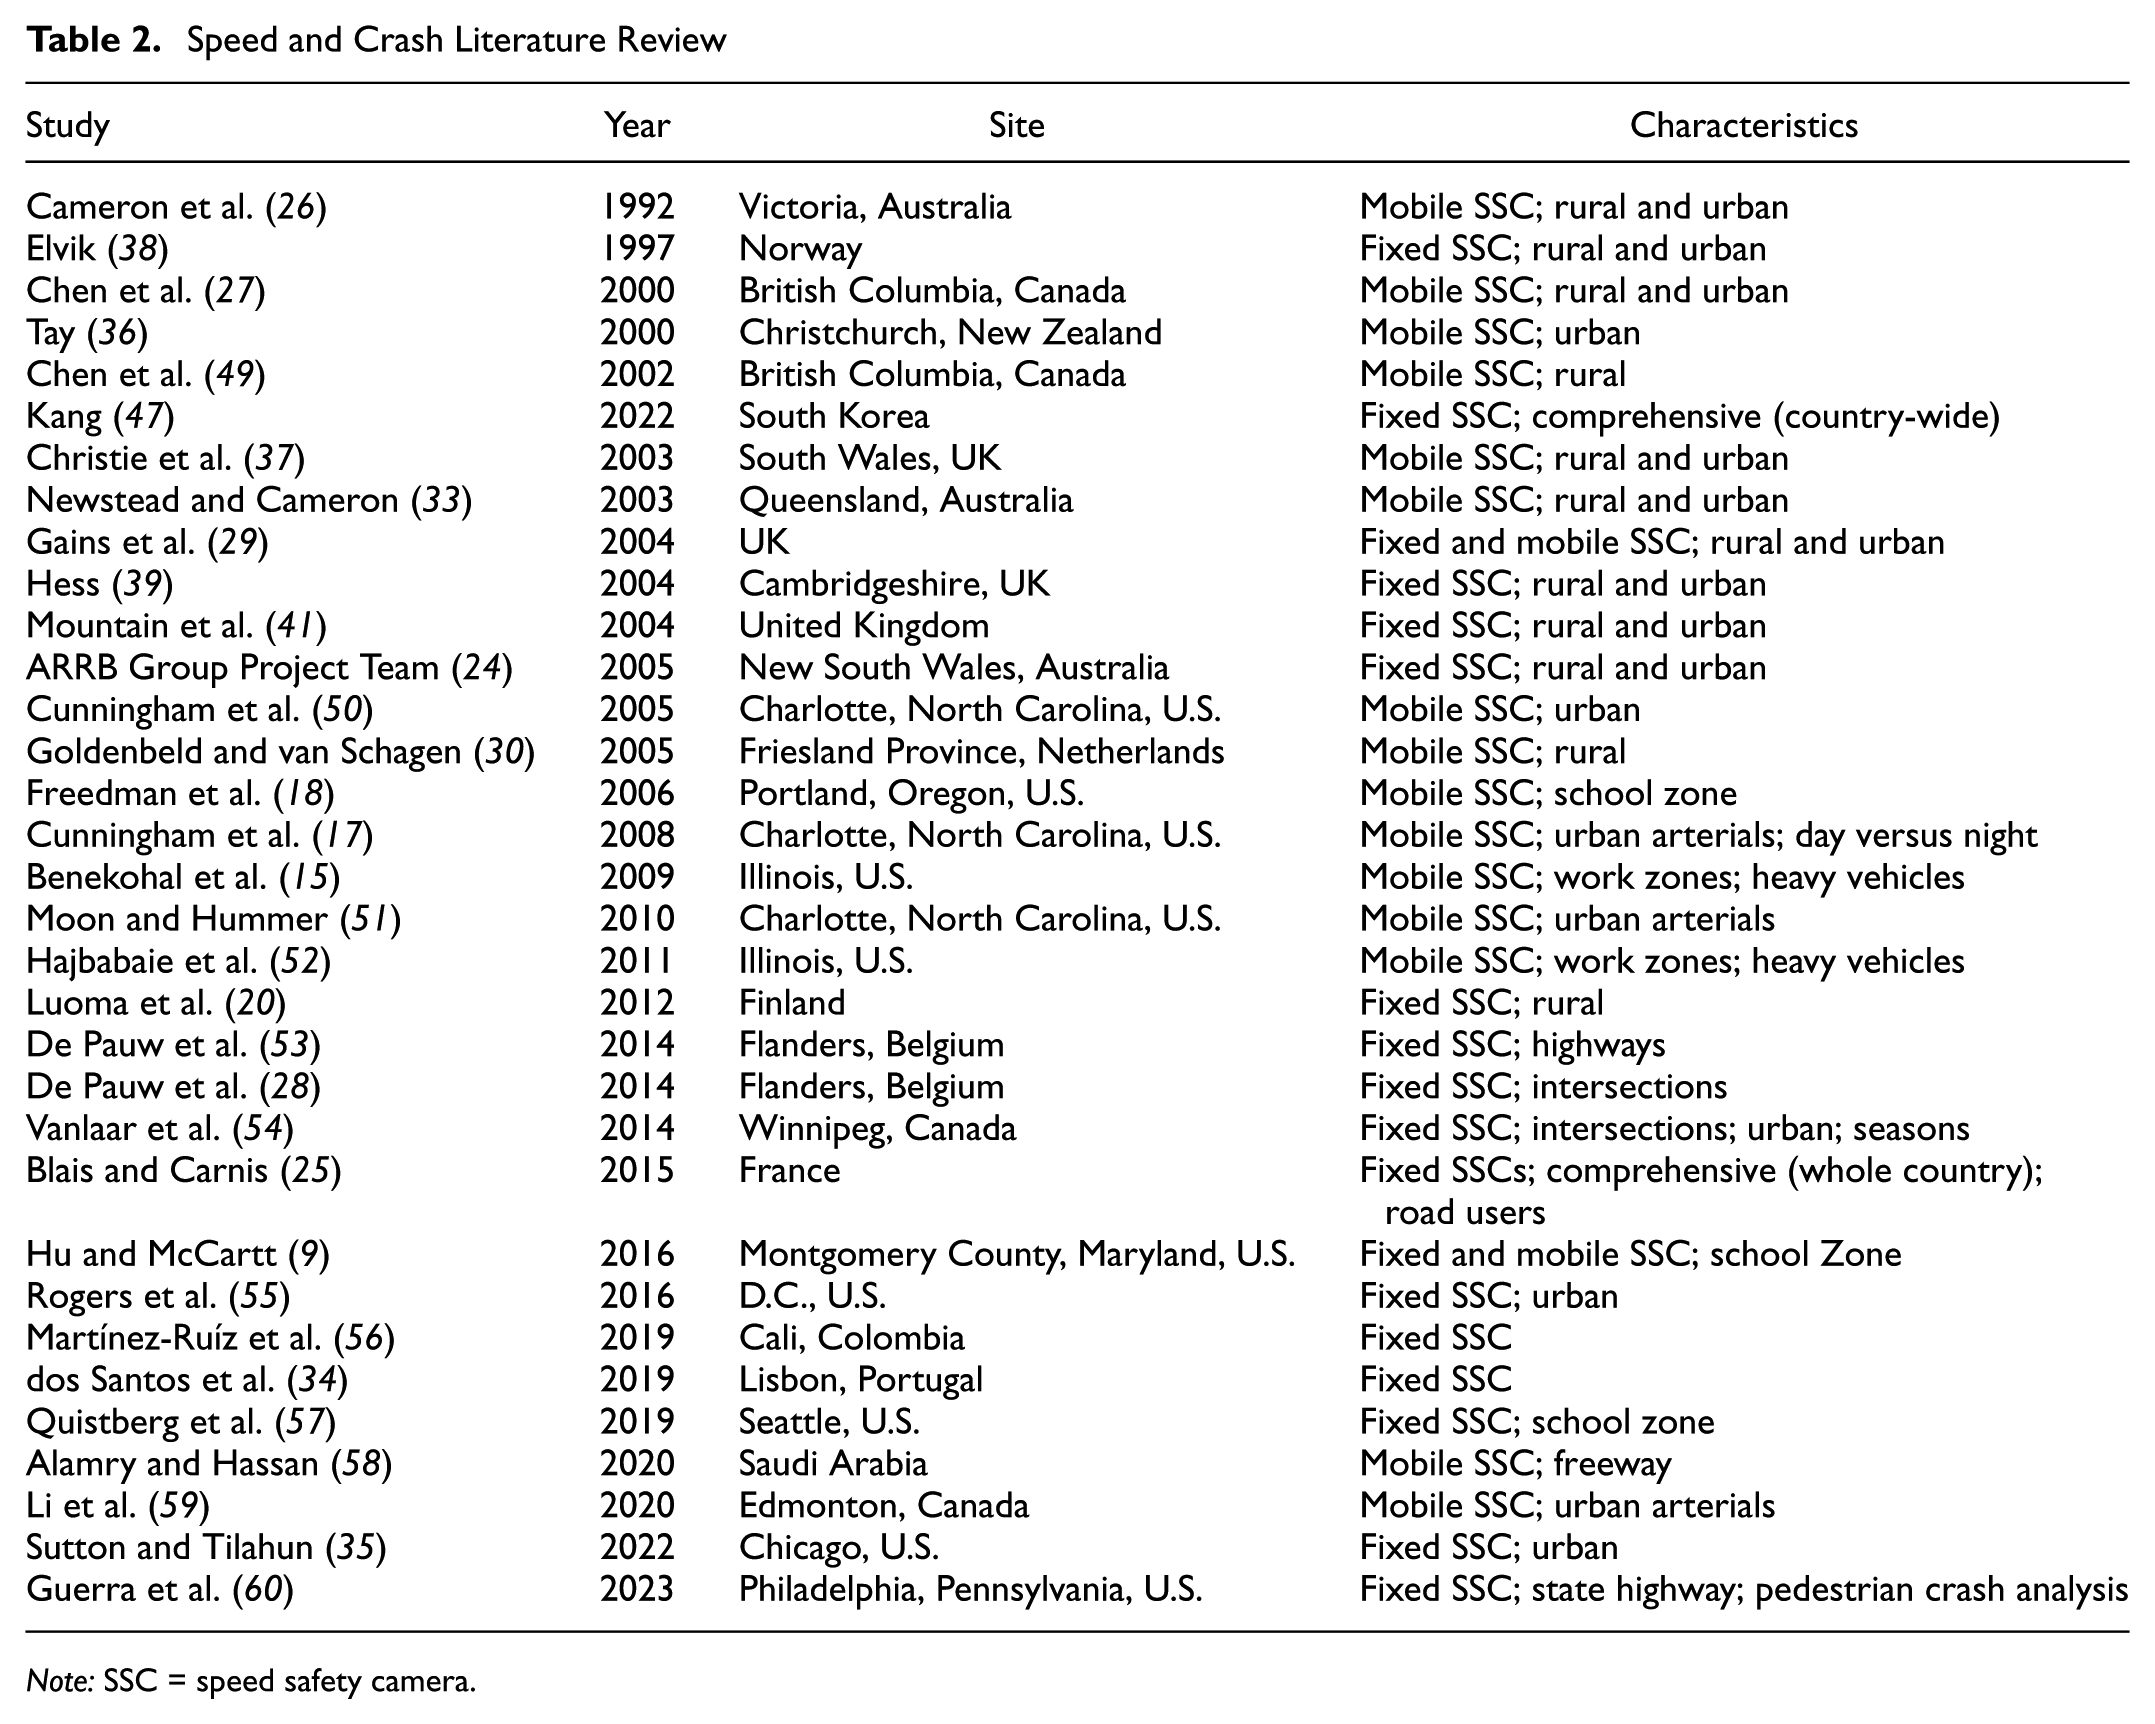
Note: SSC = speed safety camera.
Results from nearly all studies, regardless of geography or context, show improvements in speed and crash outcomes, reinforcing the strong safety benefits of SSCs. However, while the core objective of reducing traffic-related injuries and fatalities is shared across jurisdictions, program structures vary considerably. Political, legal, and cultural factors shape how SSCs are implemented, administered, and supported by the public, leading to a diverse set of program structures. This paper seeks to examine these broader realities in depth, illustrating the different ways SSC programs can be structured while still achieving the overarching goals of improved road safety.
Interview Design
To elaborate on the key issues identified in the national and international review of SSC programs, semi-structured interviews were conducted with city and state agencies running major SSC programs in the U.S.
Interview Design Literature
The research team used a semi-structured interview design. This type of interview is focused on a more conversational and open-ended approach—while questions are designed in advance, the interview itself should be open to changes according to the direction of the conversation. According to Bearman ( 61 ), a semi-structured interview has three basic components: (a) articulating questions around a core event with open-ended questions; (b) a three-part structure with an introduction, exploration of core phenomenon, and final recommendations; and (c) refining the interview through practice and a pilot group.
The project team included these recommendations in the survey design by grouping questions into: introduction or background questions, which were more fact-based; followed by specific “groups” focusing on different areas of SSCs; and finally an open-ended, final reflection question. In addition, a pilot interview was first performed with the Portland Bureau of Transportation.
Another key reference with regard to semi-structured interviews supported these suggestions, but also emphasized asking “what if” questions, probing on interesting topics, and focusing on learning about attitudes and beliefs ( 62 ). The research team employed these findings by focusing on different topics for each agency as more information emerged on each agency. The team also aimed to understand the success of certain SSC program elements, expansion plans, and the desires of agencies’ staff for changes to their programs.
Interview Process
Candidate jurisdictions were selected from a literature review conducted in an earlier stage of this research project. In this literature review, nine case studies were developed based on available online data. Of these case studies, two were not chosen for further study because the programs were heavily work zone based, and one was not interviewed because their program has not begun yet. Finally, while multiple attempts were made to contact another, no contact was established.
In total, five agencies were interviewed: Portland, Oregon; New York City, New York; Philadelphia, Pennsylvania; Seattle, Washington; and the District of Columbia (D.C.). The first interview was conducted on February 12, 2024 (Portland), and the last interview was conducted on June 14, 2024 (D.C.). The interview included about 18 questions in 6 categories: Background; SSC Program elements; Public acceptance; Data and evaluation; Equity and law enforcement; and Open and final questions. The number of questions and categories was limited by the interview duration, when requesting interviews, we indicated that the duration of the interview would not exceed 1 h.
The “Background” category was motivated by the need to confirm basic statistics and facts about the current agency SSC program. The second category, “SSC Program elements,” was included to understand the operational, logistical, and financial framework of the program, including future growth and enforcement compliance mechanisms. This information helps agencies define necessary legal requirements, understand best practices for site selection and revenue allocation, and establish reliable, effective operational plans. The third category, “Public acceptance,” was included because public acceptance is a key issue for successful deployment. It is useful to learn proven communication methods and address common public concerns (like the perception of SSC as a “cash-grab” or visual disturbances from camera flashes) to help increase credibility, legitimacy, and support for SSC programs. The fourth category, “Data and evaluation,” was included to understand how agencies ensure system effectiveness, operational reliability, and transparency, especially concerning performance measurement and data collection. Learning about evaluation plans and vendor management practices allows new SSC programs to plan robust monitoring and evaluation from the start, ensuring accountability and improving public trust by showing data-driven results. The fifth category, “Equity and law enforcement,” was included to investigate how agencies mitigate potential disproportionate impacts on specific communities, thus ensuring equitable deployment, and to clarify the specific role of law enforcement in the automated system. This information enables non-implementing jurisdictions to design their programs to intentionally avoid exacerbating existing social disparities through graduated fine structures (e.g., implementing reduced or income-based fines) and avoid excessive clustering of SSC locations. A focus on fairness increases the long-term acceptance of the SSC program. Finally, the sixth category, “Open and final questions,” is included to collect overarching insights, lessons learned, and reflective commentary that may not fit neatly into the structured categories or that may arise during the interview. This final category provides agencies with peer-based, practical insights with regard to challenges and opportunities for successful planning and implementation of SSC programs.
These 6 categories and 18 questions formed a base structure to the interview, but with the flexible nature of the interview process, the focus of each interview depended on the specific agency. The questions were the same for all the agencies, but in some cases one or two questions were quickly answered because they confirmed what the researchers had already learned from agencies’ websites or uploaded documentation about their SSC program, and the interviewees did not provide additional details. Detailed notes were taken and documented for each interview.
Before each interview, a case study of each jurisdiction was built to understand publicly available information. The interviews helped to clarify, confirm, and expand on information available online, as well as to discuss bigger picture issues and lessons learned by each agency. All interviews were conducted virtually and were limited to 45 min.
The following sections describe selected key insights from the interviews. Though a wide range of information was collected in the interviews, this paper focuses on unique practices and innovations within the SSC programs. The sections are ordered chronologically by interview date. Note that information that is not explicitly referenced was obtained from the interviews.
Portland, Oregon
An interview with the Portland Bureau of Transportation (PBOT) was conducted on February 12, 2024, and included representatives from PBOT’s Safety Section and Vision Zero Program. PBOT oversees the selection of camera locations, installation, maintenance, and communication with the vendor. The Portland Police Bureau (PPB) is charged with having a police officer review the photographic evidence and sign off on each citation.
Portland’s SSC program began in 2016 and currently has 14 fixed speed cameras on 7 corridors and 18 intersection safety cameras. An additional 6 fixed SSCs are under design or construction. While previously fixed SSCs were only allowed in Portland on “urban high crash corridors,” in 2024, HB4109 ( 63 ) was passed, allowing any city to operate fixed SSCs on any roadway (except for interstates). Nevertheless, the SSC program is still mainly focused on urban arterials near downtown and is slowly expanding outwards.
Traffic Diversion Class
An SSC citation is the same as a police-issued speeding citation, with fines ranging from $170 to $440 ( 64 ). PBOT and PPB offer a traffic safety class option in lieu of fine payment to those who have not received a red light running or speeding violation in the last 3 years and have not previously attended the photo enforcement traffic safety class. The per person class registration fee varies depending on the type of moving violation but is typically less than the presumptive fine ( 64 ).
Public Acceptance
When fixed speed cameras were first installed, PBOT conducted outreach to notify and inform community members. Materials used include postcards in English and 10 other languages, a Frequently Asked Questions info sheet, and a map of city-wide safety projects scheduled for construction. In addition to mailing out the postcard, PBOT staff talked to businesses in vicinity of the cameras in advance of activation and the initial 30-day warning period. PBOT also provided information for local neighborhood associations, town hall meetings, newsletters, community events, online news, press releases, and social media. When a new location is being installed, PBOT sends a direct mailer to nearby addresses ( 64 ).
PBOT has identified several key issues related to public acceptance. Despite numerous information campaigns and communication channels, individuals often do not pay attention to outreach efforts until they are personally affected, that is, receiving a citation. It can also be difficult to communicate the program to non-English speakers; these communities are now the target of focus groups. Further, nearby residents of cameras have expressed concern with visual disturbances from the camera flashes at night. Finally, there is a concern that with the passage of HB4109 allowing speed cameras on any roadway, there may be an erosion of public confidence and an increase in the view of speed cameras as “cash grabs.”
Equity
Portland considers equity throughout the SSC program process. In its selection criteria, PBOT looks not only at speed and crash data, but also the geographical distribution of devices to avoid clustering in one community. Geographical analyses are conducted using zip code-level data, allowing PBOT to ensure that residents of areas with SSCs are not getting disproportionately ticketed, while still prioritizing corridors with demonstrated safety needs. PBOT has found that 80% of drivers getting a citation from a camera are from zip codes not adjacent to the camera, indicating that the cameras affect people passing through a corridor more than they do people living near the corridor.
As well as location equity, PBOT has explored financial equity considerations. Currently, SSC fines are mandated to match those of regular police-issued speeding tickets; however, PBOT has expressed interest in a graduated fine structure that would scale penalties according to ability to pay. To reduce burdens on low-income drivers, PBOT already offers a traffic diversion class as an alternative to paying a fine for first-time offenders and is considering expanding the program to offer free or reduced-fee classes for individuals receiving public assistance.
PBOT staff noted that the most difficult challenge is balancing equity with safety. PBOT does not want to withhold safety resources from communities—including many historically marginalized neighborhoods—while also being mindful of the disproportionate financial impact of fines and fees on these communities.
Vendor
PBOT has maintained the same vendor between 2016 and 2025, although the camera operation has been sold or outsourced a couple of times during that tenure and a new vendor started providing SSC services in the second half of 2025. PBOT paid the previous vendor a fixed fee, plus a variable fee based on fine and class fees ( 64 ).
In theory, data collection from the vendor should be easy—the vendor has a backend system where PBOT should be able to pull citation, speed, and zip code data. Nonetheless, because of vendor reporting issues, PBOT had been collecting its own speed data under the previous vendor. Vendor relations had been one of the biggest challenges for PBOT.
Ticket Issuance
While a citation is generally issued to the registered owner of a vehicle, a high-resolution image of the driver of the violating vehicle is captured for each violation. This image is reviewed to (a) evaluate gender match, clarity of plate, glare on windshield, car obstruction, vehicle match failure or obstruction of either vehicle or driver and (b) resolve disputes of innocence by the registered owner of the vehicle ( 65 ).
New York City
An interview with a representative from the New York City Department of Transportation (NYCDOT) was conducted on April 30, 2024. NYCDOT has been running a school zone SSC program since 2013, and as of 2024 has 2,200 SSCs in 750 school zones operating 24 h a day, 7 days a week ( 66 ).
Fines and Revenues
Fines are $50 for each SSC violation, with no escalation of fines for repeat offenders. This is far less than the cost of a summons issued by a police officer for speeding in a school speed zone, which could range on the first offense from $90 to $600, depending on the motorist’s speed and prior record. Fines are given to the registered owner of the vehicle; there are no point deduction on drivers’ licenses nor consequences for vehicle insurance ( 66 ).
All revenues go to the New York City general fund. As NYCDOT does not directly benefit from the revenue, there is no incentive to increase revenues. NYCDOT believes it is important to decouple the safety purpose of SSCs and the revenue benefits and has no specific program benefiting from the SSC program profits.
Covert Enforcement
NYCDOT’s SSC program is “covert,” meaning that the locations of the cameras are not published, although limited signage is placed to warn drivers of the program: per state law, the city must install speed limit signs preceding the cameras with a “photo enforced” plaque. This helps lower speeds throughout all school zones and corridors surrounding the school zones, as drivers may not know where cameras are located.
Additional Enforcement
NYCDOT previously ran a dangerous vehicle abatement program, where registered owners of vehicles that received 15 or more speed camera violations or 5 or more red light camera violations within a 12-month period were required to take a safe driving class or risk their vehicles being impounded by the New York City Sheriff ( 66 ). Nevertheless, this program was discontinued because of its high cost, as well as difficulties enforcing it—as violations are issued to a vehicle rather than a driver, it can be difficult to track down the owner of the vehicle if a license plate changes or the vehicle is sold.
NYCDOT has been considering other programs to target dangerous vehicles and drivers, though no legislation has been passed with regard to new programs. One idea is to suspend vehicle registration for vehicles with more than a certain number of violations, helping prevent future dangerous driving. In addition, New York state Senator Andrew Gounardes proposed a bill (not passed) to require vehicles to install intelligent speed assist if they have acquired a certain number of violations ( 67 ). The NYCDOT fleet already has these installed on their vehicles. NYCDOT also supports implementing an escalating fine regime to address the subpopulation of speeding drivers, but such changes would need to be legislatively approved.
Public Acceptance
NYCDOT ran an extensive public outreach campaign when cameras were first installed, as well as when cameras switched to 24/7 operations. However, NYCDOT is not required to give notice to community boards about new speed cameras, and they are also not required to publicize locations of cameras. Therefore, the public outreach program is focused on generally informing the public of the program, as well as communicating the safety benefits of SSCs. NYCDOT works closely with legislators and elected officials on changes and extensions to the program, who in turn represent their constituents.
Equity
As fines are assessed on vehicles, there are no points on a driver’s license or negative impact to insurance, lessening the burden on lower-income individuals. Cameras are widely dispersed, and NYCDOT looks at high-minority and low-income areas to make sure they are not unfairly burdened. One specific metric used is the correlation between neighborhood income or neighborhood percentage of non-White population and the number of speed camera violations issued per lane mile. Nonetheless, the overall focus of the program is to reduce speeds and crashes. New York City has a separate program to invest in infrastructure and safety programs in historically underinvested communities
Further, NYCDOT analyzed zip code data to determine where violators reside. An analysis of all speed camera violations issued in October 2021 found that 41% of violations were issued to a vehicle with a registered address located outside New York City. Two-thirds of all violations were issued to a vehicle with an address located more than 3 mi away from the camera, far from the surrounding neighborhood. This shows that, overwhelmingly, it is not local residents who are receiving violations, but local vulnerable road users are receiving benefits ( 66 ).
Philadelphia, Pennsylvania
An interview was conducted with representatives from the Philadelphia Parking Authority (PPA) and City of Philadelphia Office of Transportation, Infrastructure, and Sustainability on May 30, 2024. Philadelphia launched a pilot SSC program on one state route (Roosevelt Boulevard) in June 2020 as part of its Vision Zero program. Currently, Roosevelt Boulevard includes a total of 40 cameras at 10 locations (as Roosevelt Boulevard is 6 lanes per direction, each camera monitors 3 lanes at a time) ( 68 ).
With the success of the Roosevelt Boulevard pilot, the City of Philadelphia is expanding the program to other corridors with high levels of speed-related crashes. HB1284 was signed into law in December 2023, reauthorizing the SSC pilot to be permanent on the Roosevelt Boulevard and permitting expansion of the program to 5 additional corridors. The law also authorized a 5-year pilot program for SSCs in up to 5 designated school zones ( 69 ).
Organization
The program involves several agencies and stakeholders, including the Pennsylvania Department of Transportation (PennDOT), the City of Philadelphia, the PPA, and several private vendors for the camera equipment, violation processing, and debt collection. Of note is that Pennsylvania defines a system administrator, who is tasked with coordinating the process, managing personnel, producing an annual report, managing the vendor, and determining the locations of SSC devices. The PPA was named as system administrator in the state law ( 68 ).
This system includes a three-fold “check” system on citations—the vendor provides the initial violations; the PPA confirms the citations; and the City of Philadelphia Police Department reviews and verifies the violations.
Selection Criteria
The five new corridors of the SSC program were selected through a standardized corridor scoring methodology. Per state law, potential corridors for expansion are state or local routes within the borders of Philadelphia. To be selected for the program, for each potential corridor, the City of Philadelphia must conduct an analysis of speed and speeding-related crashes involving vehicles and pedestrians; deliver an engineering and traffic investigation on the posted speed limit; provide an opportunity for public comments; and pass a local ordinance authorizing expansion to the select corridor ( 69 ).
Specifically, the City of Philadelphia developed a scoring system that considered crash history. Among the highest rated corridors, the Delaware Valley Regional Planning Commission’s (DVRPC) Indicators of Potential Disadvantage (IPD) tool and Replica data were used to understand how different populations are affected by the crash trends and would be affected by SSCs. To generate a score for a corridor, the City of Philadelphia looked at the last 5 years of crashes on state and local routes within the city limits. A corridor received 5 points for each crash resulting in a fatal or serious injury, 3 points for each crash where speed was a contributing factor, and 1 point for each crash involving a pedestrian ( 69 ).
Among the five corridors with the highest scores, the project team then worked to understand who lives near the route, as well as those who travel along the route, to help better understand who would benefit from reductions in crashes and who would be affected by SSC violations. DVRPC’s IPD tool was used to understand the sociodemographic distribution of people who live along the route, incorporating race, ethnicity income, age, gender, disability, foreign-born, and limited English proficiency in the analysis. Replica data was used to understand whether drivers are using the corridors for shorter local trips versus longer commuter trips ( 69 ).
Fines and Revenues
The violation fine structure is based on a sliding scale, dependent on the margin of speed registered in excess of the posted speed limit: vehicles traveling 11 to 19 mph over the posted speed limit are fined $100; vehicles traveling 20 to 29 mph are fined $125; and vehicles traveling 30 mph or greater are fined $150 ( 68 ).
Fine revenue is deposited into the state’s Transportation Enhancement Grants Program, which provides funding to projects focusing on improving safety and mobility, such as traffic signal improvements, bicycle and pedestrian improvements, and roadway safety improvements. While the grants are competitive, priority is given to jurisdictions that have operational SSC systems ( 68 ). In public outreach, the PPA communicates that the goal is not to collect revenue, and that the agency does not directly benefit from fine revenues.
Vendor
The SSC program currently uses a vendor that provides the citations and data on speeds. The PPA meets with the vendor every 2 weeks to exchange data, and maintains tight oversight, including an additional two layers of citation verification.
Per state law, the compensation paid to the vendor of the SSC system may not be based on the number of traffic citations issued or a portion or percentage of the fine generated by the citations. The compensation paid to the vendor of the equipment can only be based on the value of the equipment and the services provided or rendered.
Equity
For Roosevelt Boulevard, the PPA evaluated the proportion of violators originating from Pennsylvania as compared with other states (based on license plate data). The analysis revealed that approximately 13% of violators have out-of-state license plates, while 40% of violators have license plates registered outside of Philadelphia. This indicates that the majority of tickets are issued to individuals living outside Philadelphia, and thus SSCs are providing a benefit to residents of the city and of neighborhoods close to camera locations.
For the five future expansion corridors, the City of Philadelphia analyzed demographic data to understand how speed-related crashes affect marginalized populations and to identify who would benefit from expansion of SSCs on the top scoring corridors. The project team also worked to examine specific populations that are most at risk from the impacts of speeding and severe crashes in Philadelphia. When looking at race and ethnicity, traffic deaths occur more among Black and Hispanic Philadelphians compared with their share of the city’s population. Moreover, fatal or serious injury crashes are 30% more likely to occur in areas of the city where most residents are people of color compared with areas where most residents are White. A person’s age also affects if they will be involved in a severe injury crash, with older and younger populations more at-risk for severe injuries ( 69 ).
Another demographic that the project team looked at was zero-car households. Zero-car refers to households that lack access to a vehicle and these households are more likely to walk, bike, or take transit. Zero-car households are also more likely to be non-White as well as low-income. The project team found that 63% of the proposed SSC corridors pass through areas where more than 30% of the population live in zero-car households ( 69 ).
Seattle, Washington
An interview with a representative from the City of Seattle SSC program was conducted on June 11, 2024. The City of Seattle currently operates a school zone SSC program and includes 19 schools with 35 speed cameras ( 70 ).
Legislation
While speed cameras were largely limited to speed zones in previous legislation ( 71 ), a new bill effective from June 2024 repealed this legislation and allowed traffic cameras to be used on portions of state routes in city limits that are classified as city streets, and in work zones on city and county roads, including those that are state highways. It also permits use of traffic cameras to cite vehicles that fail to stop at crosswalks, or travel in lanes reserved for buses and other forms of public transportation.
The Seattle Department of Transportation (SDOT) is now exploring an expansion of the program beyond school zones. The Seattle City Council adopted a Statement of Legislative Intent ( 72 ) in the 2023 budget process, directing SDOT to report on a plan to double the number of school safety enforcement cameras and further develop an evaluation for the implementation of speed cameras in other areas.
Organization
The Seattle Police Department manages the vendor contract and the violation process, while SDOT works on the location selection of all automated enforcement programs, as well as integrating data into the decision-making process and selecting other traffic calming measures.
Fines
The maximum penalty amount for violations captured by a traffic camera cannot exceed $145 per incident, adjusted for inflation every 5 years. This maximum penalty amount can be doubled for a traffic camera-enforced school zone speed infraction ( 73 ).
The new legislation includes a provision in which the penalty will be cut in half for registered owners of vehicles who are recipients of state public assistance, other than Medicaid, if they request such a reduction. This is applicable to the first violation only ( 73 ).
Public Acceptance
All SSC locations are published on SDOT’s website. When cameras are placed in a school zone, SDOT mails information about SSCs to neighborhoods around the school zone. There is also a 30-day warning period for each new camera.
As the program has been in place for over a decade, it is fairly ingrained in the community. The program manager publicizes their contact information so anyone who has questions can easily get in contact and provide feedback.
Data and Evaluation
In Washington, any jurisdiction implementing SSCs must first conduct an analysis of the proposed locations for these systems. This analysis is required before passing an ordinance to permit initial SSC deployment, as well as before adding new cameras or relocating existing ones. In addition, jurisdictions using SSCs must publish an annual report of the number of traffic crashes that occurred at each location where a camera is located, and the number of notices of infraction issued for each camera and any other relevant information ( 71 ).
District of Columbia
An interview with a representative from the ATE program for the District Department of Transportation (DDOT) was conducted on June 14, 2024. In D.C., speed cameras have been implemented since 2012 ( 74 ). As of 2024, the program has 500 cameras in total, with 213 of those being speed cameras. The program also includes 140 bus lane cameras, 55 red light cameras, 32 stop sign cameras, 50 school bus arm cameras, and 10 truck restriction cameras ( 75 ).
Organization
Initially, the program was run by the Metropolitan Police Department (MPD). During the COVID-19 pandemic, the program was financially supported by MPD but managed by DDOT. There was a strong desire from the mayor’s office to move the whole program to DDOT, which was completed in 2021. Now, DDOT administers the program fully. This change was considered a success because the MPD did not have the technical resources for camera location selection and lacked the ability to implement other traffic calming measures.
Selection Criteria
DDOT uses both proactive and reactive sources to determine locations for new or relocated ATE cameras ( 75 ). ATE includes SSCs, red light, bus lane, and other enforcement cameras.
Proactively, DDOT examines D.C.-wide data by screening the roadway network to determine where cameras can be most effective, using factors such as: school zones along high-volume roadways; the Vision Zero High Injury Network; and signalized and stop sign-controlled intersections with a high rate of injury crashes ( 75 ). Reactive sources include reviewing 311 requests for a Traffic Safety Input, post-fatal crash reviews, routine engineering studies and site reviews, as well as inputs from D.C. Council, Advisory Neighborhood Commissions, and the MPD. Figure 1 presents diagrams of the selection methodologies ( 75 ).
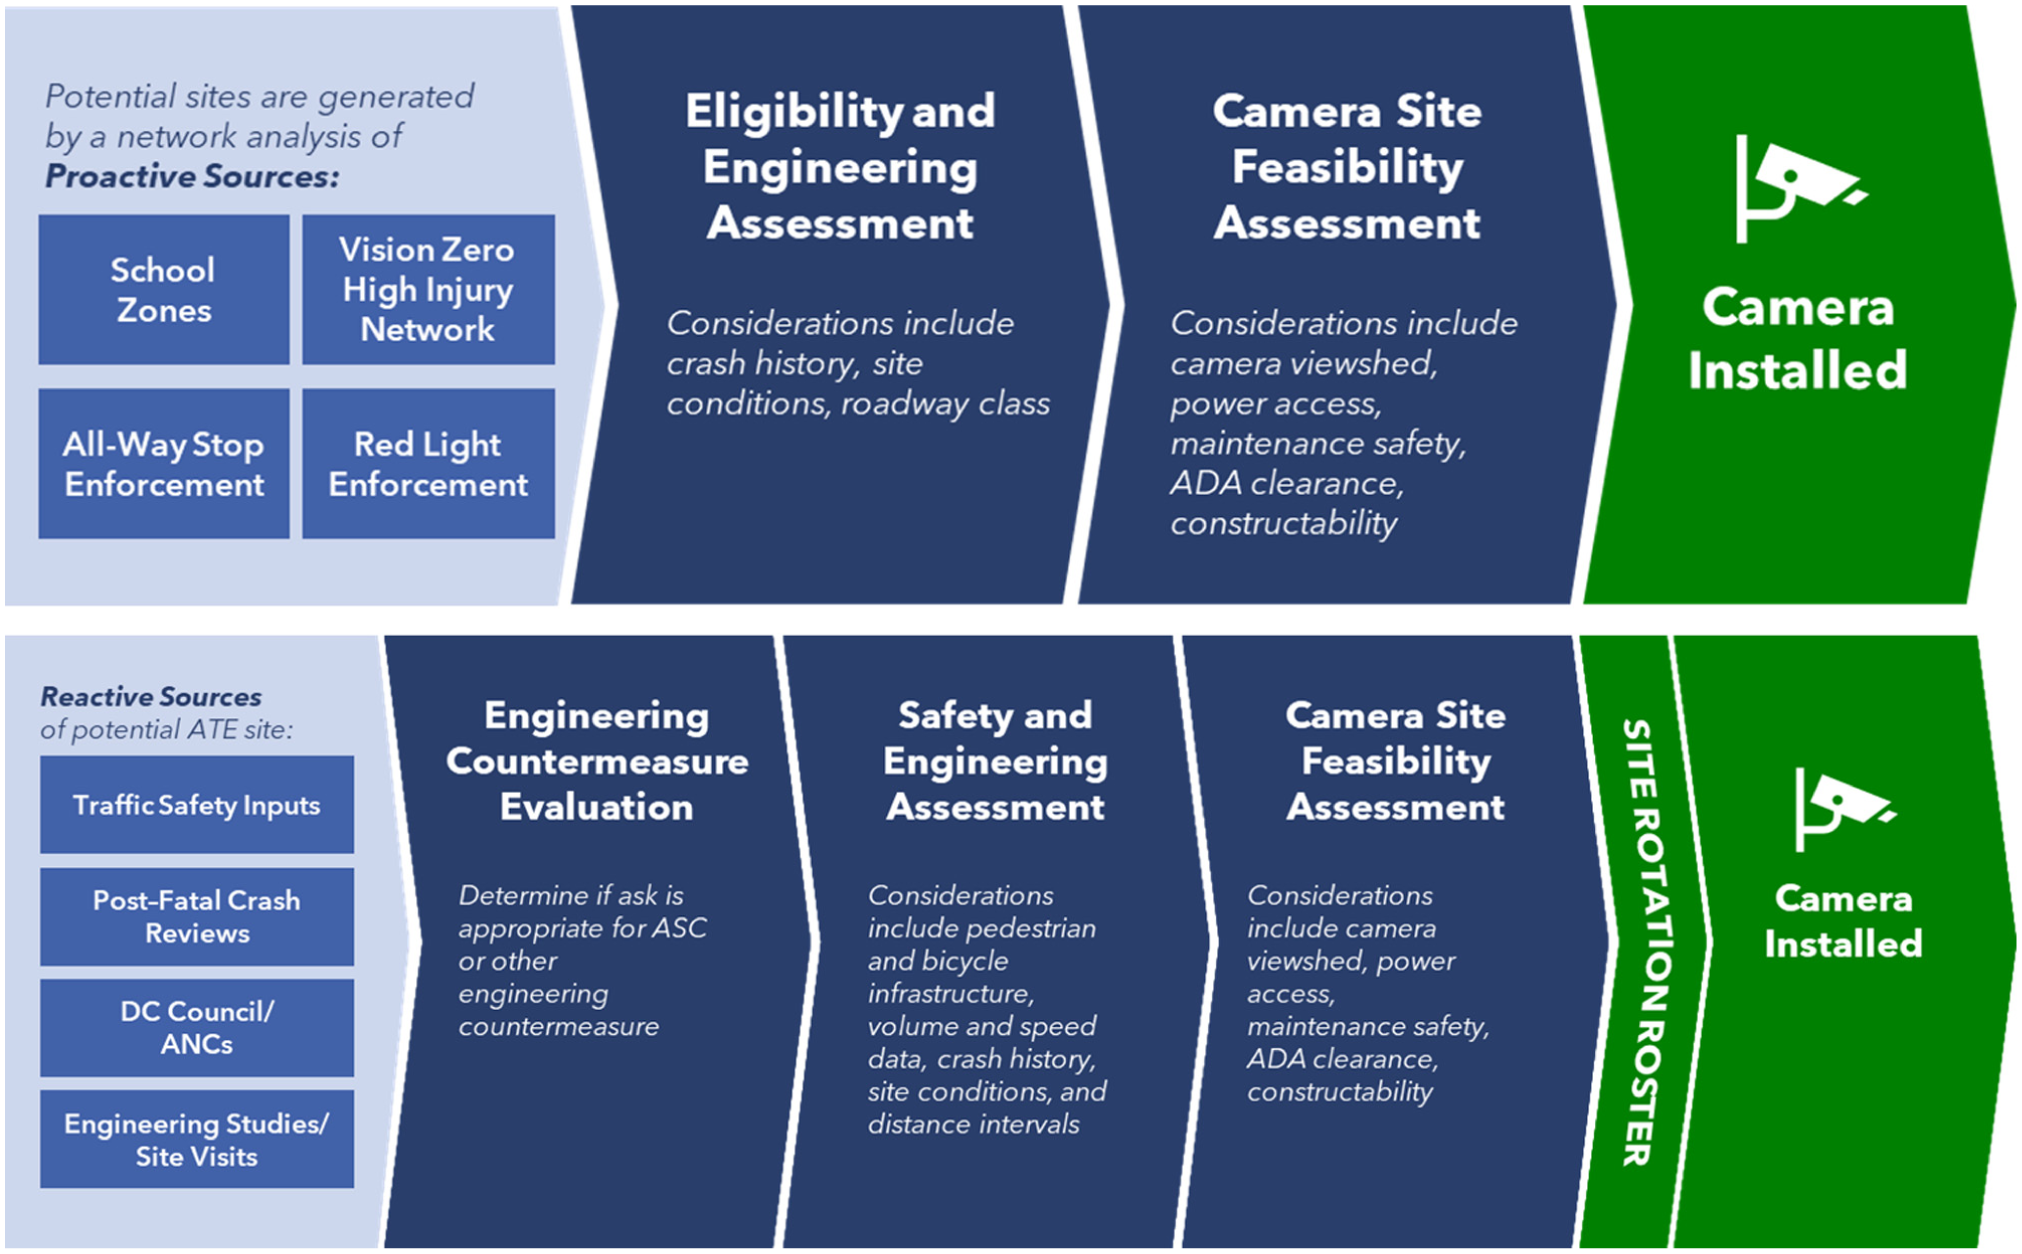
District Department of Transportation selection methodologies ( 75 ).
Fine Collection
Fines for traffic violations captured by SSCs are the same as the fines for violations issued by a police officer and range from $100 to $500 ( 76 ). ATE ticket payment rates have been decreasing since 2014; on average, roughly 30% of all ATE citations go unpaid ( 77 ).
Under the current system, DDOT only has authority to enforce non-payment against drivers registered in D.C., or, less commonly, against out-of-state drivers when parked in a public space within the District. D.C. DMV and the Office of the Deputy Mayor for Operations and Infrastructure (DMOI) have engaged in discussions with both Maryland and Virginia motor vehicle administrators on ticket reciprocity for ATE violations. Neither state wanted to pursue reciprocity for ATE tickets ( 77 ).
The Mayor’s Task Force (described in the “Equity” section below) recommended several actions to address this issue, including working with neighboring states at the state level, exploring lower fines, and reducing fines for drivers who admit fault within 30 days ( 77 ).
Additional Enforcement
A major topic in D.C. includes additional enforcement for the relatively small subset of high-risk drivers who repeatedly fail to obey traffic rules and are not deterred by existing compliance measures (i.e., fines). Currently, the Department of Public Works (DPW) has authority to immobilize or impound any parked vehicle “against which there are 2 or more unpaid notices of infraction.” Further, the Council passed the STEER Act (Strengthening Traffic Enforcement, Education, and Responsibility) in 2024, which if enacted and funded, would allow the District Government to tow and impound vehicles based on the number of tickets accrued over a 6-month period, regardless of payment. However, currently the District Government’s booting, towing, and impound capacity is significantly limited by existing resources ( 77 ).
To be able to comply with the STEER Act, the Mayor’s Task Force on ATE recommends increasing the impound lot capacity and adding in-house booting and towing resources, or contracting out to private contractors ( 77 ). To target dangerous vehicles specifically, the Task Force recommends that the District Government considers coordinating with private towing firms for this group of high-priority vehicles and pay the firms for each high-priority vehicle towed to a DPW facility. The Task Force recommends that the District Government should prioritize towing and impoundment of vehicles that have two or more unpaid citations for driving 21 mph or more over the speed limit, running a red light, or both ( 77 ).
Public Acceptance
D.C. maintains constant communication with the public, providing frequent information sessions through different channels and gathering feedback. Each ward in D.C. has a representative from DDOT that communicates directly with that ward, liaising with local neighborhood groups. DDOT also provides open houses for the City Council to share results from the automated enforcement programs.
The DDOT Public Information Office is charged with running the public outreach campaigns. New cameras are publicized through press releases, and all cameras include signage and a 45-day warning period. The locations of the cameras are available on a dashboard on DDOT’s website.
Data and Evaluation
As per D.C. Official Code § 50-2209.01, DDOT is required to report to the City Council on a semi-annual basis with the following information: (1) the top 15 ATE locations by value of citations generated; (2) the breakdown of where violators have their vehicles registered; (3) the locations where cameras have been added in the last 6 months and the reasons why those locations were chosen; and (4) the amount of ATE citations issued. This data is publicly available.
DDOT has pledged to provide all data publicly on an easily accessible dashboard which shows camera locations and information on violations. A screenshot of this dashboard is shown in Figure 2. The dashboard includes a geographical representation of all the cameras, as well as key data on violations by: camera type; extreme speeders; license plates; and traffic volume.
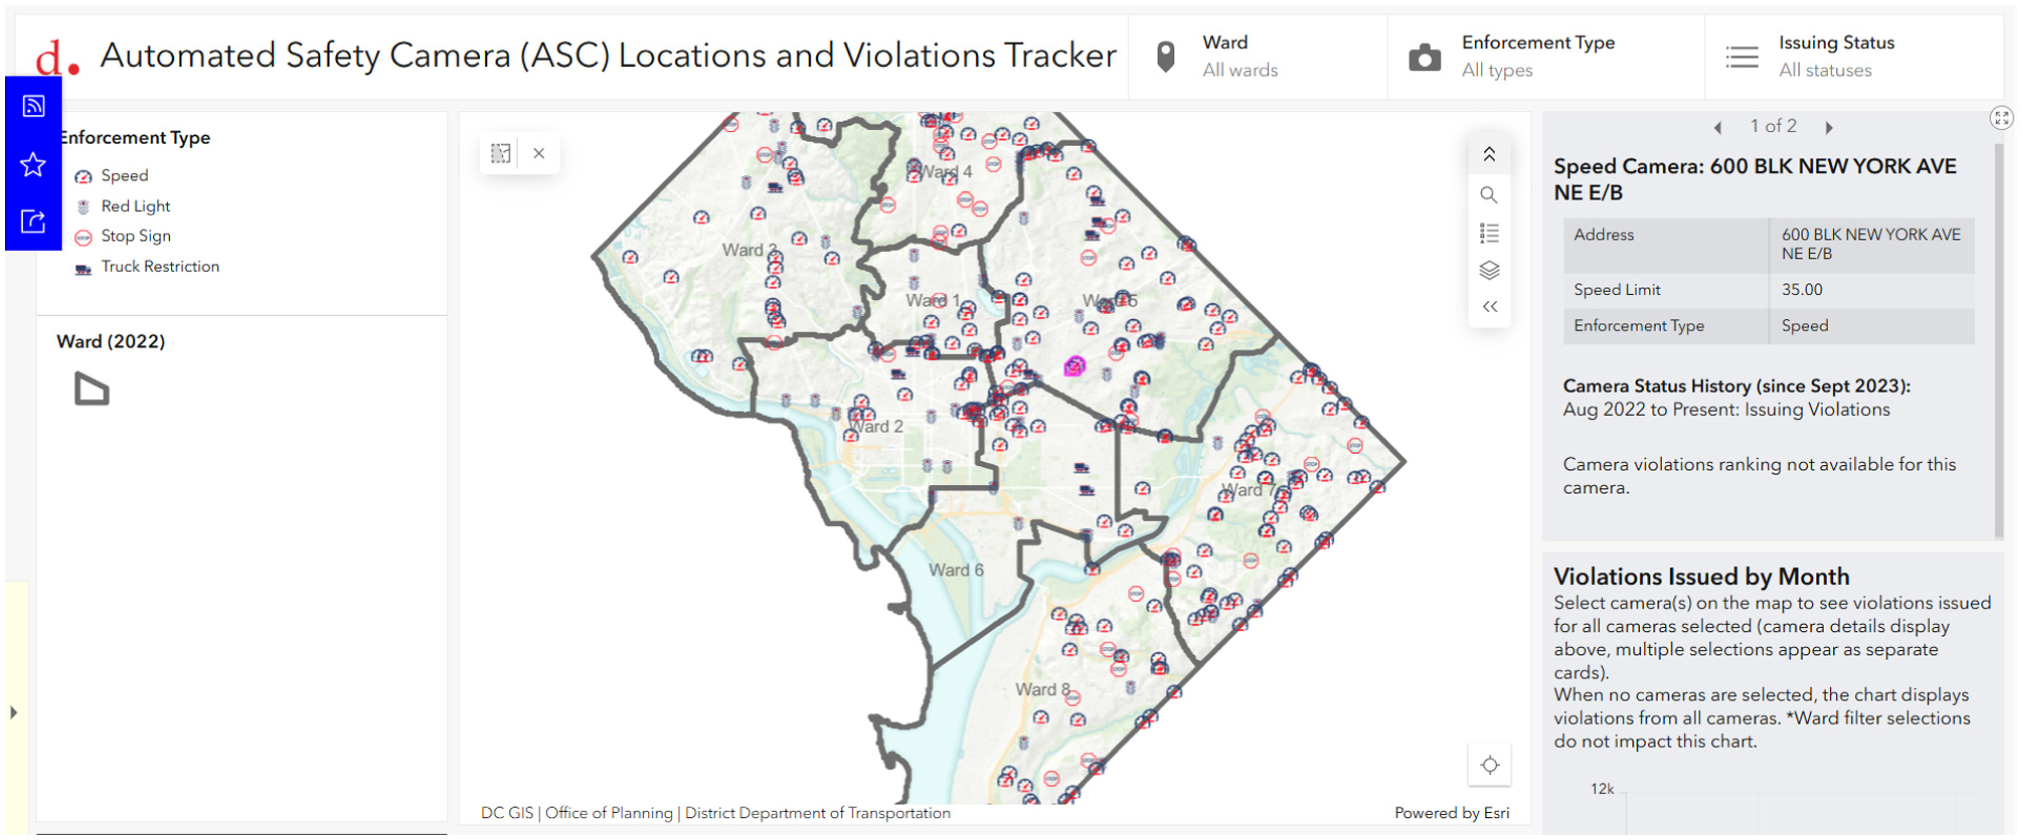
District Department of Transportation automated traffic enforcement dashboard ( 75 ).
Equity
D.C. created the Mayor’s Task Force on Automated Traffic Enforcement ( 77 ) in March 2023 to investigate and provide recommendations on the District’s SSC program and other moving violation laws, including fines. The goal of the Task Force is to mitigate the potentially inequitable effects of the fine, penalty, and enforcement systems on individuals of varying household incomes while maintaining the public safety effectiveness of SSCs.
A preliminary report was released in 2024 ( 77 ) detailing a list of the Task Force’s key recommendations, which will be further evaluated and detailed in a second phase of work. Of note is the recommendation for an income-based fine pilot as an alternative to the current fixed-fines system for automated enforcement violations. The pilot aims to achieve greater fine equity by providing financial relief to certain lower-income District residents. The proposed income-based fine pilot provides a fixed, but lower, fine amount for eligible residents. D.C. residents or ATE ticket recipients whose households receive Supplemental Nutrition Assistance Program (SNAP) benefits would be eligible for a 50% fine reduction. Only first-time offenders and minor violations are eligible.
Furthermore, the DDOT ATE dashboard shows the top repeat offenders by state and number of tickets by state (based on license plate data). In fiscal year 2023–24, 80% of violators had a license plate outside of D.C., with 41% from Maryland, 26% from Virgina, and 12% from other states ( 78 ). This shows that most violators are not local residents, and thus cameras are benefiting rather than fining local residents.
Discussion
The five U.S. case studies provide detailed insight into the current operations and future expansion plans of established SSC programs. These cities are innovating in the realm of new types of enforcement; targeting dangerous drivers; providing open data; and incorporating equity criteria and considerations into their programs. The interviews revealed that while programs differ in structure, administration, and scale, all are navigating similar challenges around fines, revenues, public acceptance, and equitable outcomes.
A key contribution of this study is the ability to place U.S. experiences in dialog with international lessons. The international review highlighted that many countries abroad, particularly in Europe and Australia, have adopted more centralized, network-wide SSC programs. France, for example, created a national-level enforcement system that minimized police involvement and conveyed an omnipresent sense of enforcement. New South Wales has taken a similar approach with its combination of overt and covert strategies to maximize both general and specific deterrence. In contrast, U.S. programs remain largely decentralized, fragmented by state legislation, and highly variable in their scope and design.
The interviews demonstrate that while U.S. agencies operate within different legal and political contexts, they are nonetheless experimenting with innovative approaches not commonly observed abroad. For example, Portland’s traffic diversion class, D.C.’s proposed income-based fine pilot, and New York City’s efforts to target repeat dangerous drivers illustrate new ways of integrating equity, fairness, and behavioral targeting into SSC program design. These innovations respond directly to U.S. challenges around equity, legitimacy, and public acceptance, issues that are less emphasized in countries with more centralized systems and stronger public support.
The comparative analysis presented in Table 3 underscores both the diversity and commonality of SSC programs across U.S. cities. While the number of cameras, legislative frameworks, and administrative arrangements vary considerably, several shared characteristics emerge. All cities rely on state-level authorization, with local ordinances codifying specific program elements. Most agencies issue violations to the registered owner of the vehicle rather than the driver, and all programs are vendor-supported, with vendors typically compensated per camera rather than by citation. Despite these similarities, differences in program organization are notable: D.C. and New York City have fully separated SSC administration from police departments, while other cities still involve police in certain aspects such as contract management or citation verification. These organizational differences influence program efficiency, data reporting, and the ability to integrate enforcement with other safety initiatives.
Thematic Case Study Analysis
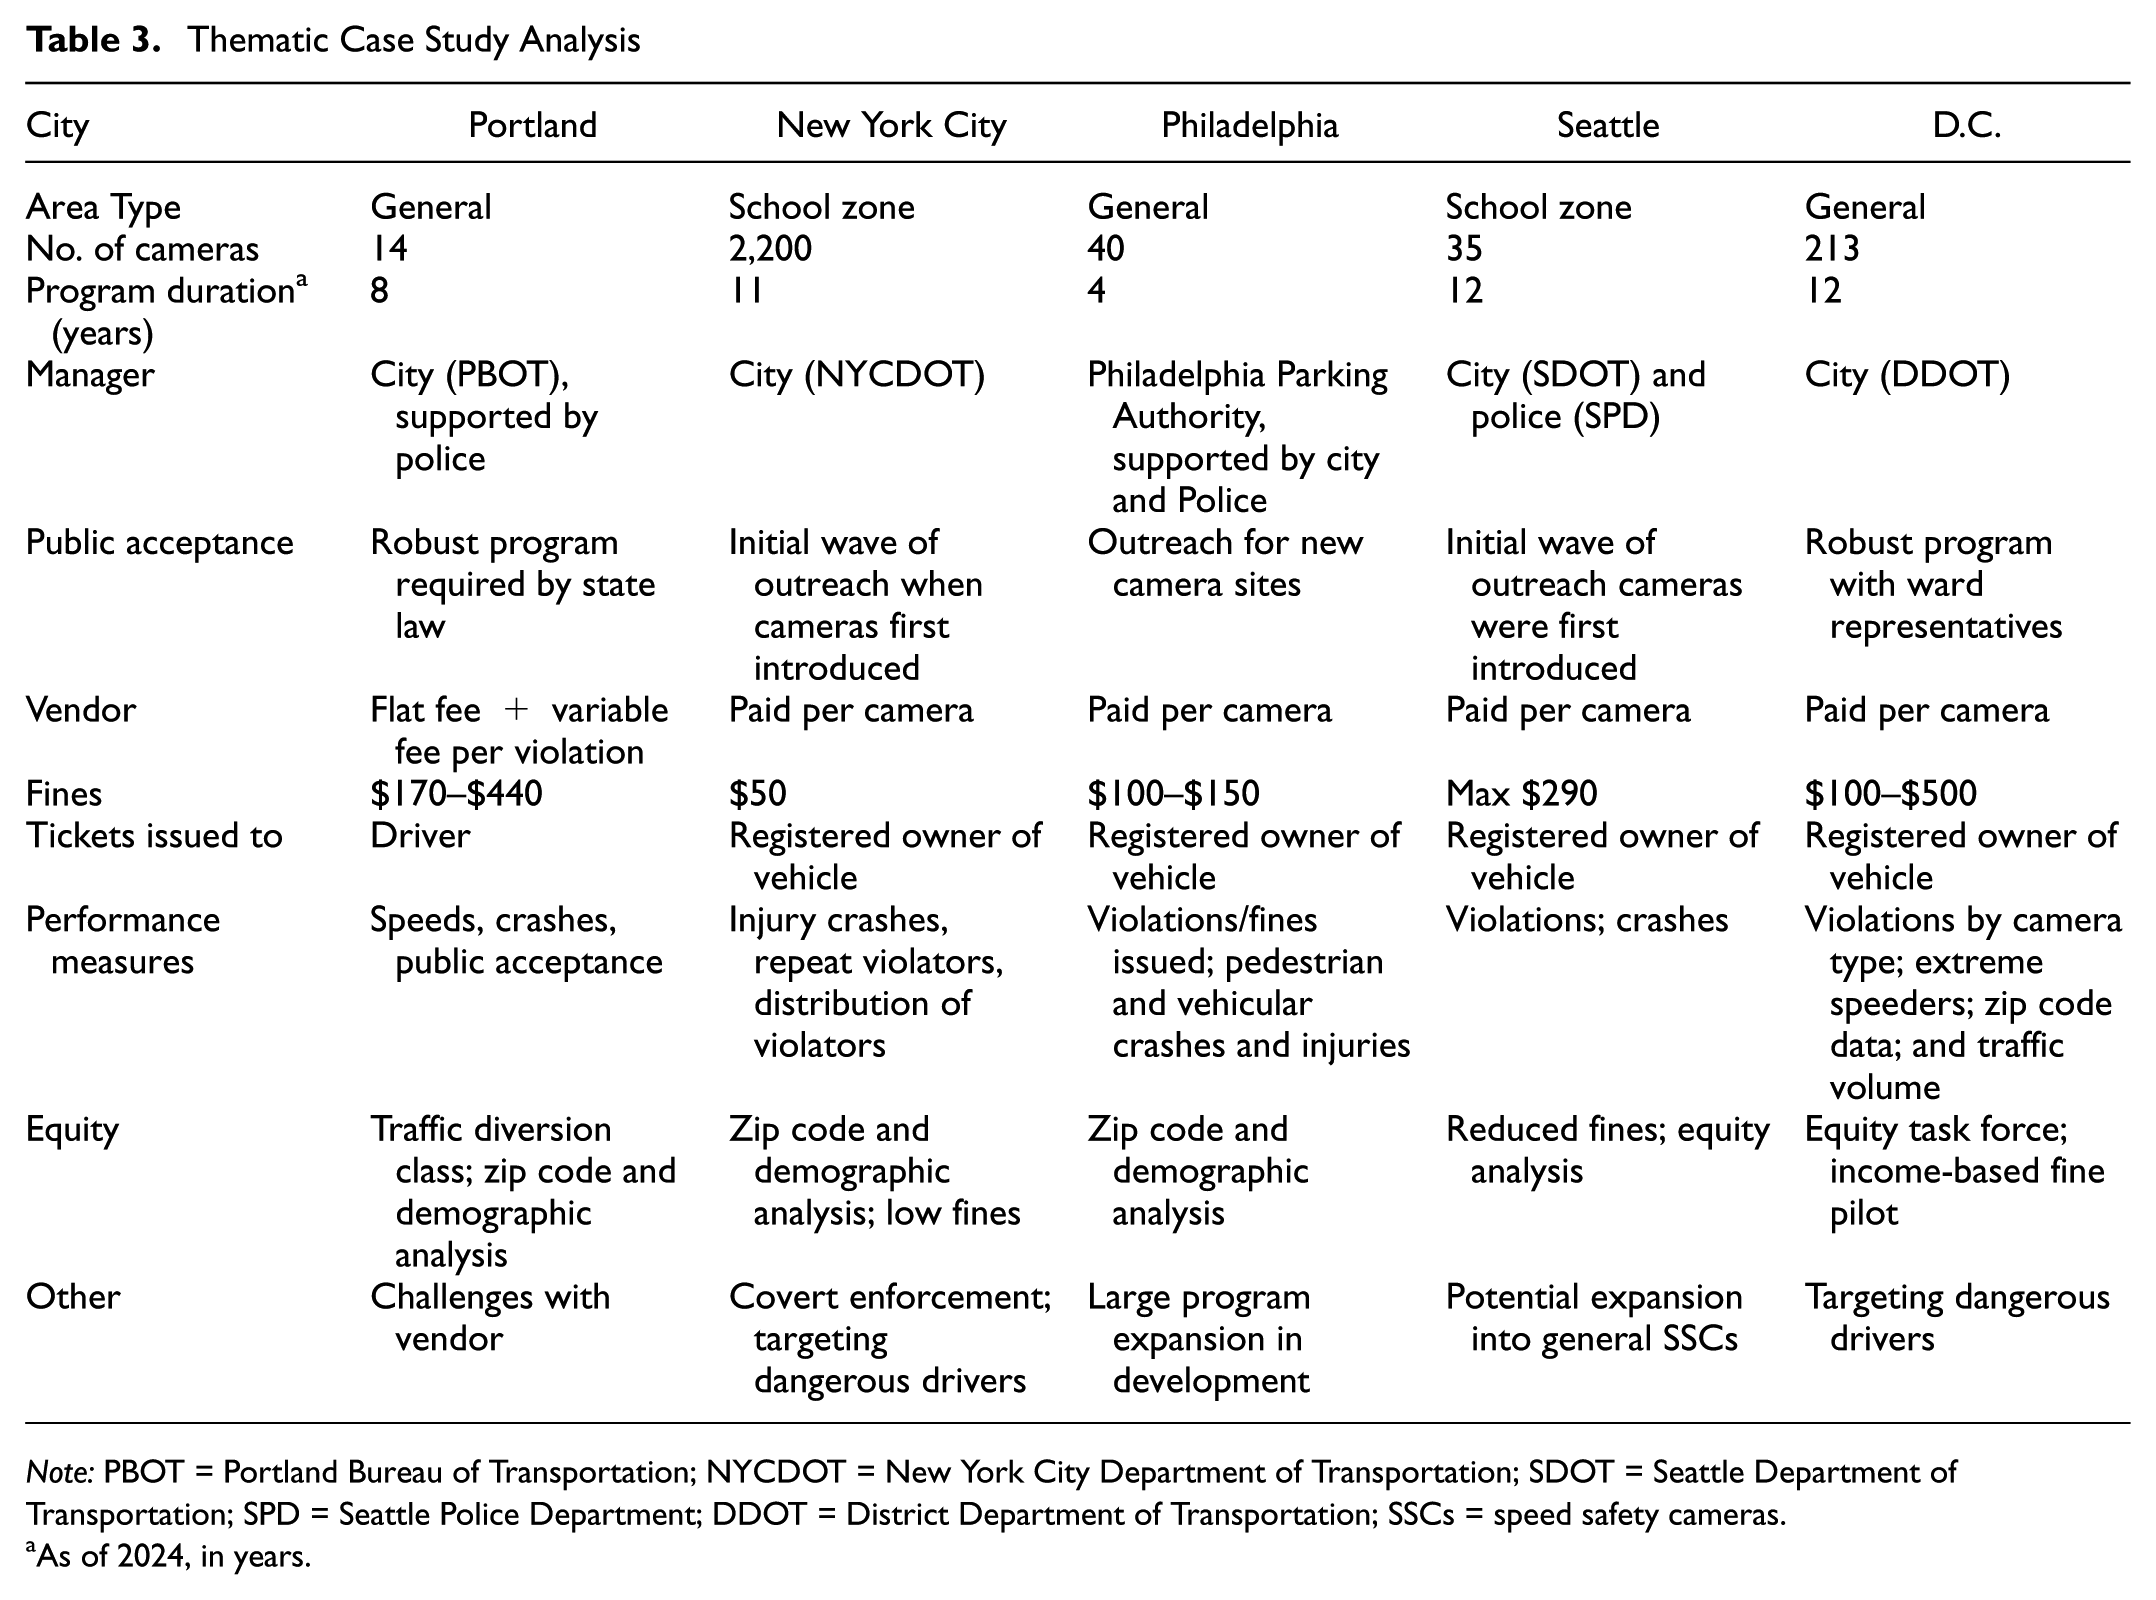
Note: PBOT = Portland Bureau of Transportation; NYCDOT = New York City Department of Transportation; SDOT = Seattle Department of Transportation; SPD = Seattle Police Department; DDOT = District Department of Transportation; SSCs = speed safety cameras.
As of 2024, in years.
Table 4 highlights additional areas of divergence that shape program identity and effectiveness. Fine structures range from flat fees (e.g., New York City) to variable scales based on speed over the limit (e.g., Philadelphia and Portland), with some agencies incorporating novel alternatives such as classes or income-based fine pilots. Outreach and public acceptance strategies also differ, from broad information campaigns and neighborhood engagement (Portland, Seattle) to ward-level information officers (D.C.), or a more covert approach intended to enhance general deterrence (New York City). Equity considerations, while present in all jurisdictions, take varied forms, ranging from demographic and geographic analyses to reduced or income-based fines.
Key Interview Findings
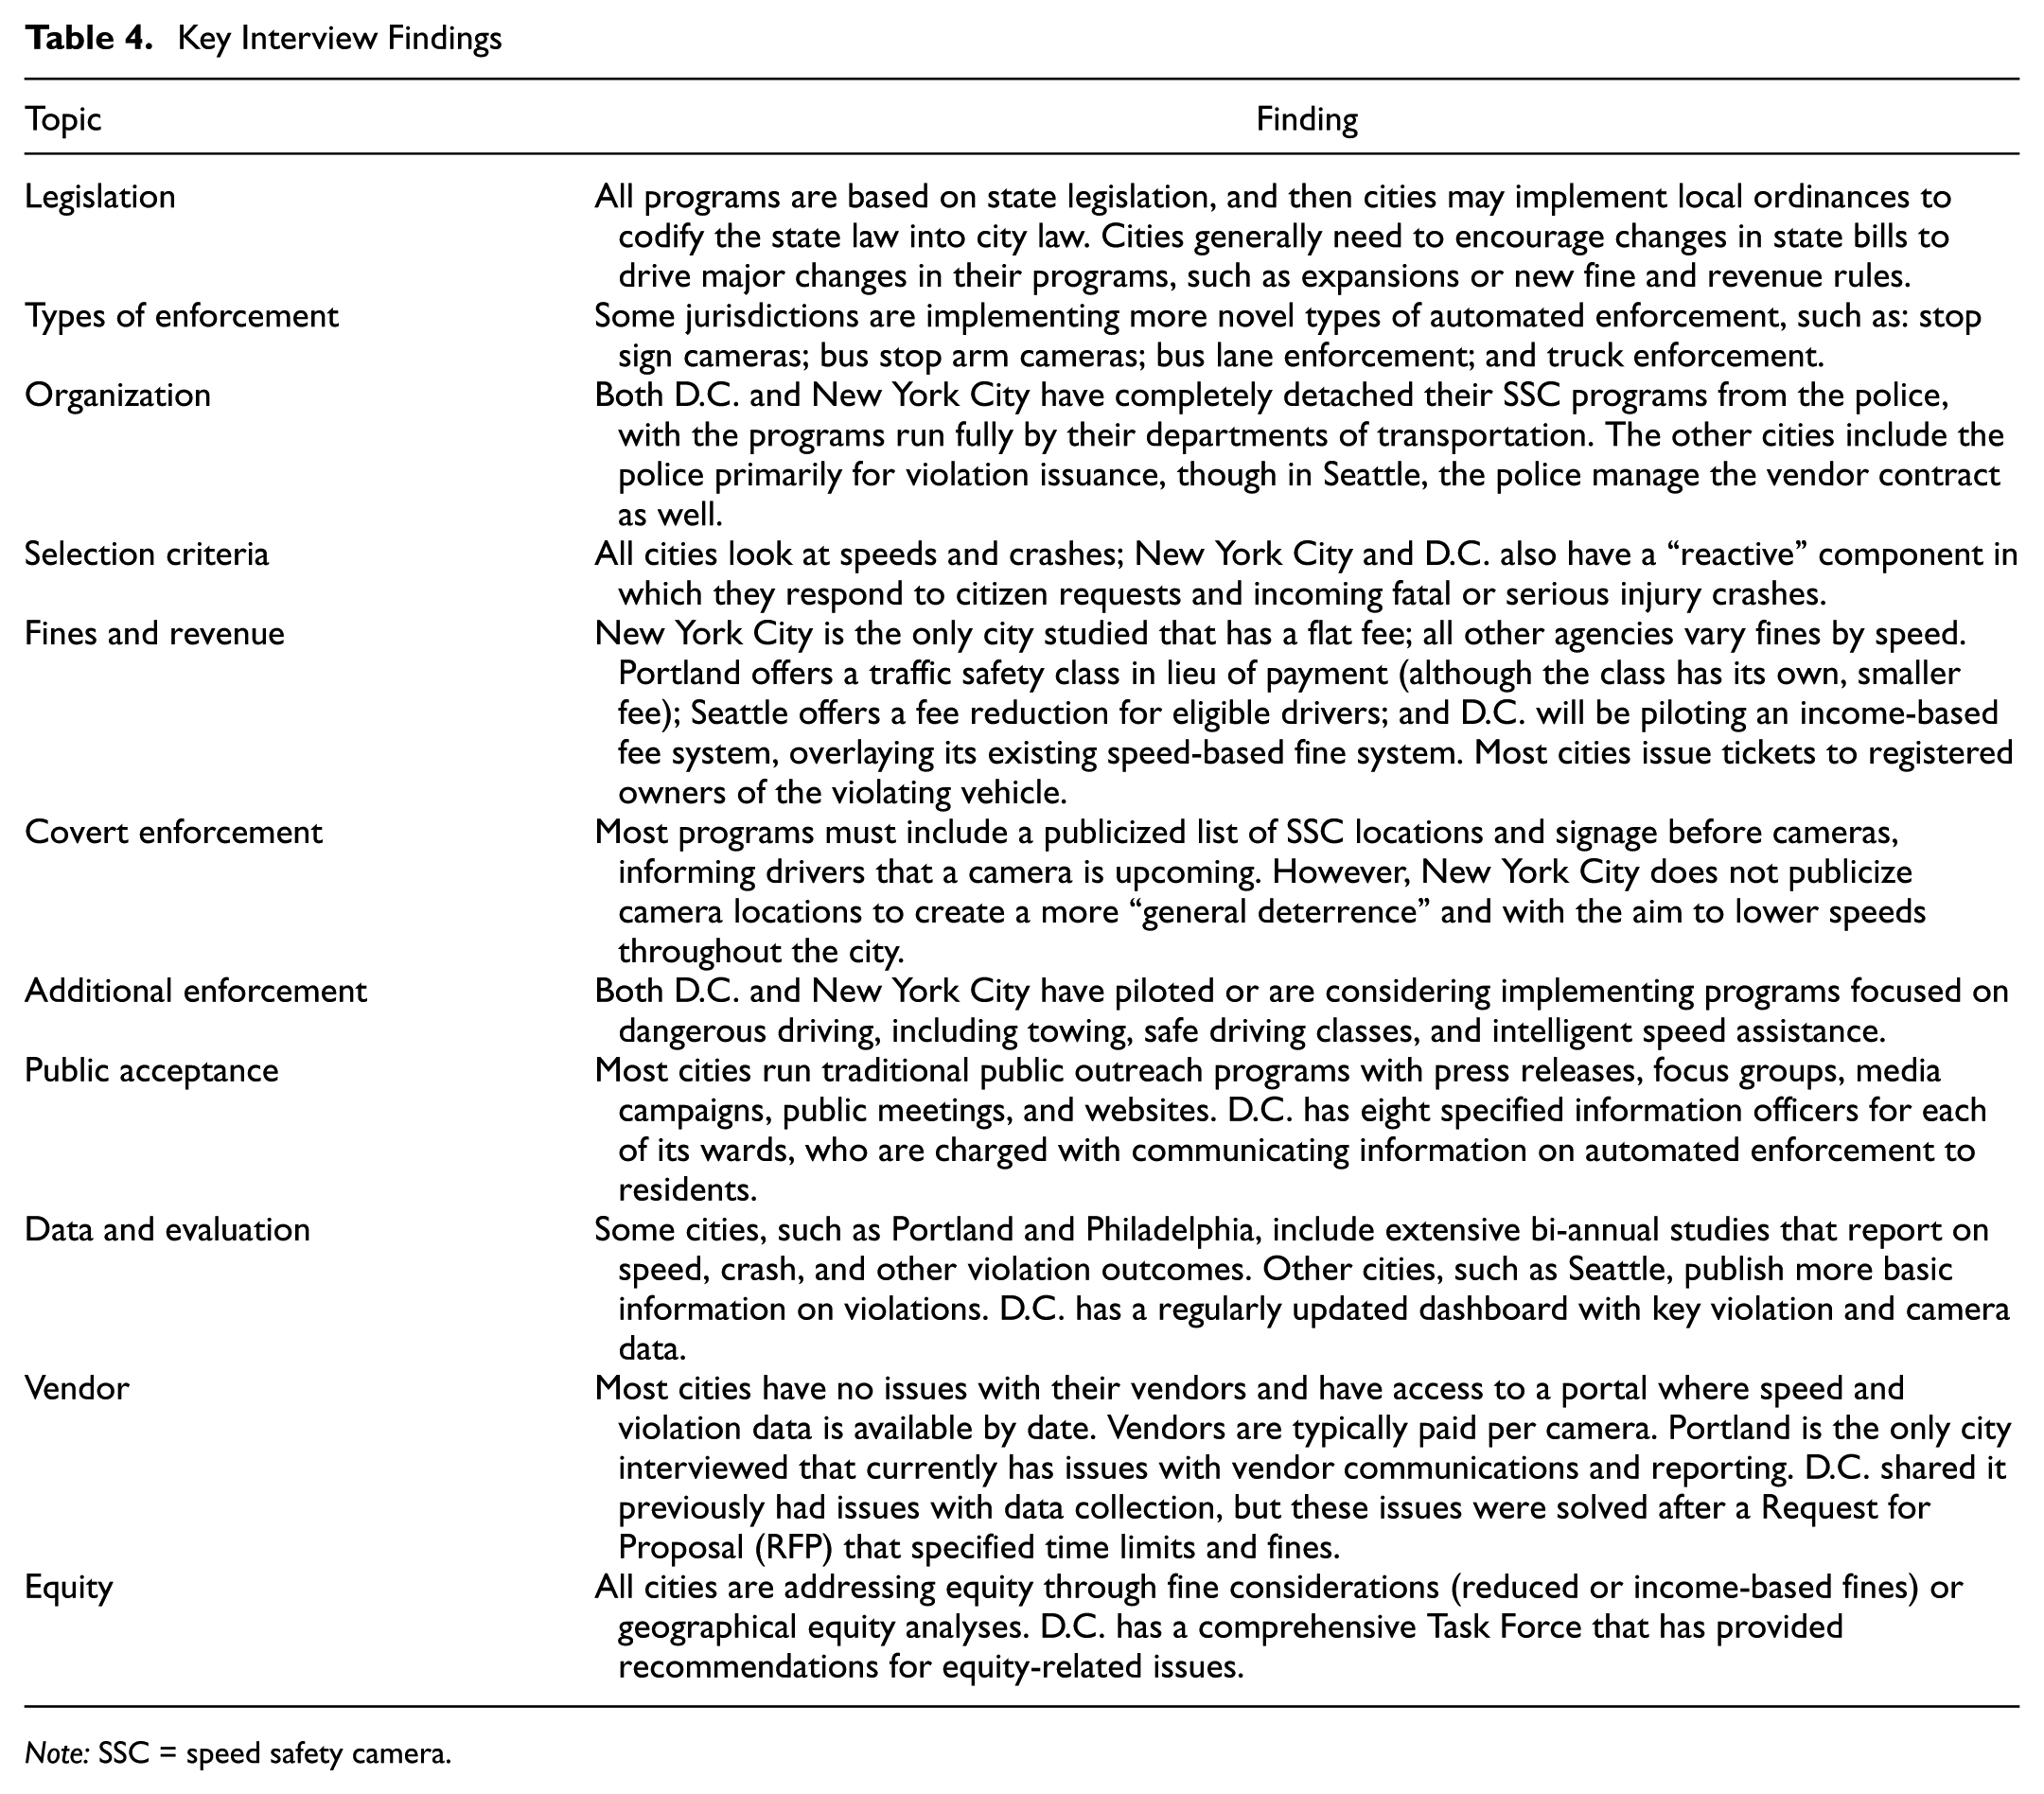
Note: SSC = speed safety camera.
Together, these patterns illustrate how U.S. cities are adapting SSCs to their unique political, cultural, and institutional environments, while still converging on the shared goal of reducing speeding-related crashes.
Key Outcomes
Some of the jurisdictions interviewed conducted formal processes to evaluate reductions in top-end speeding and crashes, as shown in Figure 3. Portland measured reductions in speeding (1+ mph over the speed limit) and found a 71% reduction in speeds across all fixed SSC systems and a 94% reduction in top-end speeding. Other programs, such as New York City and Philadelphia, focused on top-end speeding (11+ mph) over the speed limit, and found reductions of 73% and 89%, respectively.
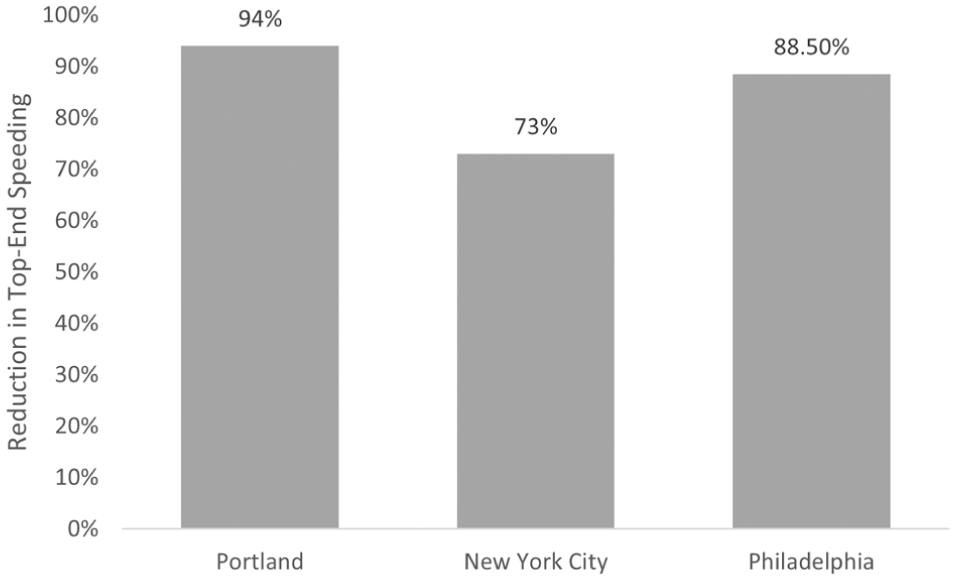
Key outcomes reported.
For crashes, PBOT observed a 17% reduction in speed-related crashes relative to the wider city ( 64 ), while New York City observed a 6.3% decrease in injury crashes relative to non-SSC sites in the city ( 66 ). In Philadelphia, the relative decrease in crashes was 30% for all crashes and 27% for fatal and serious injury crashes as compared with non-SSC sites ( 68 ).
These numbers cannot be directly compared because they measure different crash metrics, and these statistics and publications have not undergone an external peer review like most academic papers. Nevertheless, all the reports and numbers point to a decrease in crashes and indicate that speed cameras are effective at reducing speed-related and injury crashes.
Conclusions
The domestic and international review highlighted that many countries abroad, particularly in Europe and Australia, have adopted more advanced and centralized, network-wide SSC programs. In contrast, U.S. programs remain largely decentralized, fragmented by state legislation, and highly variable in their scope and design; however, significant progress has been made in the last decade.
The interviews were highly valuable in understanding the different ways agencies across the U.S. operate their SSC programs. Each jurisdiction faces unique challenges and circumstances, leading to different SSC program structures, constraints, and extents.
Further, the interviews provided a greater depth of information than that found through publicly available websites and reports, as well as giving insight on challenges that jurisdictions will probably face when implementing SSC programs. All agencies may benefit from a more systematic or standardized way to collect SSC program outcome data and statistics.
Further research could be highly beneficial in establishing best practices to address specific challenges identified in this study, such as covert enforcement, enhanced measures for high-risk drivers, fine systems, and equity considerations. Smaller agencies may lack SSC expertise or face staff or budget constraints and therefore may have additional SSC implementation issues. More research on implementing SSCs in smaller agencies and varied contexts would add valuable insights and may require a different research methodology. Finally, it would be valuable to document and publish SSC outcome results in specialized academic journals focusing on safety, and gather data to update or expand crash modification factors (CMFs) associated with SSC programs.
Footnotes
Acknowledgements
The authors would like to acknowledge the contributions of the interviewed agencies for their time and expertise: Dana Dickman and Clay Veka with PBOT; Christopher Puchalsky (City of Philadelphia Office of Transportation, Infrastructure, and Sustainability); and Sayed Sarchasmah from DDOT. The other interviewees are kept anonymous to protect their privacy.
Author Contributions
The authors confirm contribution to the paper as follows: study conception and design: M. Figliozzi, S. Semensky; data collection: S. Semensky; analysis and interpretation of results: M. Figliozzi, S. Semensky; draft manuscript preparation: M. Figliozzi, S. Semensky. All authors reviewed the results and approved the final version of the manuscript.
Declaration of Conflicting Interests
The authors declared no potential conflicts of interest with respect to the research, authorship, and/or publication of this article.
Funding
The authors disclosed receipt of the following financial support for the research, authorship, and/or publication of this article: The research was partially supported by Oregon DOT (ODOT) research project SPR 873.
The research presented in this paper does not reflect ODOT views or opinions. The authors are solely responsible for any opinions, errors, or omissions.