
Abstract
Accurate characterization of railway ballast is critical for track safety and maintenance; however, traditional field sampling/sieving or two-dimensional images captured are often labor-intensive and limited for a representative analysis. Three-dimensional (3D) point cloud analysis may offer a more comprehensive approach; the dense packing and heavy occlusion of ballast particles restrict image segmentation. This study introduces a novel deep learning pipeline designed for robust 3D railway ballast characterization, BallastAttN. Its core contributions include a comprehensive synthetic training data set from high-fidelity 3D scans of new and degraded ballast particles, an enhanced point cloud segmentation model upgraded with edge-aware voxelization and curriculum learning, and the novel BallastAttN partial point cloud completion model architected to reconstruct complete particle shapes from the highly incomplete views typical of field conditions. The proposed pipeline was comprehensively validated using controlled laboratory experiments with isolated and clustered configurations of real ballast particles in new and degraded conditions. The results show that BallastAttN consistently outperforms the baseline completion framework that utilizes an encoder–decoder architecture mechanism built on attention mechanisms across commonly used size and morphological properties. The performance gap widened substantially in clustered scenarios that are close to the field ballast appearance, demonstrating the model’s enhanced ability to handle occlusion. The predictions were precise in differentiating between new and degraded ballast based on morphological properties, such as 3D sphericity, the Flat and Elongated Ratio, and the Angularity Index. This study establishes a practical framework for automated ballast inspection, for example, with the use of an innovative ballast scanning vehicle developed, paving the way for more efficient and reliable railway ballast maintenance.
Introduction
Railway ballast is a crucial component of track systems to support the weight of passing trains, reduce vertical stress on top of the underlying subgrade, and drain water to keep the track structure dry ( 1 ). The mechanical behavior of ballast is significantly influenced by its particle size and shape properties. These properties can change because of ballast degradation from repeated train loading and weathering ( 1 ), causing detriment to ballast performance, which may negatively affect the stability of the railway track. For instance, the accumulation of fine particles within ballast void spaces, a process known as ballast fouling, impairs the track’s functionality by reducing drainage, causing moisture accumulation, and increasing settlement ( 2 ). Degraded ballast particles exhibit more wear on the surface and less angularity, which were associated with reduced interparticle interlock, leading to weaker shear strength and insufficient lateral stability ( 1 ). Therefore, it is essential to carefully monitor these characteristics for long-term railway maintenance.
Traditionally, ballast field evaluations often begin with visual inspection, a method that relies heavily on the judgment and experience of track inspectors ( 3 ). For quantitative analysis, the conventional labor-intensive approach involves the collection of ballast samples, which will then be subjected to laboratory sieve analysis (ASTM C136) ( 4 ) to determine ballast particle size distributions (PSD). This method can be compromised by the difficulty in obtaining representative samples from the field ( 5 ). For characterizing shape properties, ASTM D5821 ( 6 ) involves determining aggregate angularity via the percentage of crushed particles closely linked to satisfying a certain level of aggregate interlock to carry traffic loads, and using a hand caliper. ASTM D4791 ( 7 ) determines a percentage by weight of particles falling under a certain Flat and Elongated category. The previous test procedures are extremely time-consuming, and the angularity test is based on subjective visual inspection. Specialized laboratory systems such as the University of Illinois Aggregate Image Analyzer ( 8 ) and its enhanced version (E-UIAIA) ( 9 ), were developed to automate these tests and quantitatively measure particle size and a set of two-dimensional (2D) image-based shape indices, including Flat and Elongated Ratio and Angularity Index (AI), from three orthogonal views of coarse aggregate particles (Figure 1). However, this analysis, applicable to ballast samples collected from the field, is limited to single particles, paraded one at a time on a conveyor belt under strict laboratory conditions. For large-scale evaluations, ground penetrating radar is commonly employed to assess ballast layer thickness and general fouling ( 10 ) but lacks the ability to provide detailed geotechnical analyses, including size and morphological information on individual particles.
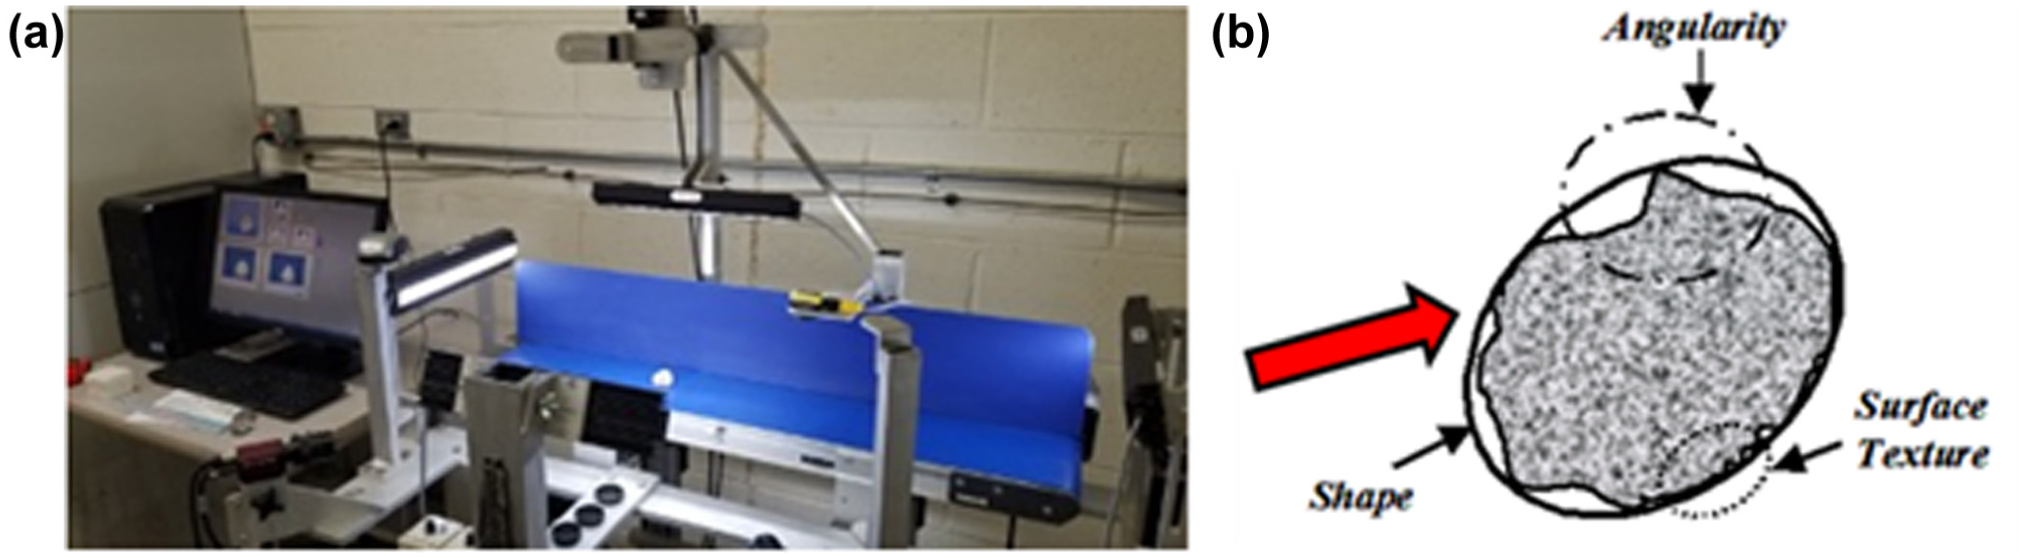
Showing: (a) Enhanced University of Illinois Aggregate Image Analyzer (E-UIAIA); and (b) the morphological indices measured by E-UIAIA.
To address the limitations of conventional methods, research has increasingly focused on leveraging computer vision and deep learning for automated, in situ image-based ballast evaluation. This modern approach involves advanced data acquisition hardware, such as a ballast scanning vehicle (BSV [Figure 2a]) ( 11 ), to capture high-quality field data. The core of the analysis is a deep learning-based 2D image segmentation pipeline trained on a large, task-specific data set of labeled ballast images collected from diverse fields and laboratory settings ( 12 ). From the resulting 2D segmentation masks (Figure 2c), ballast size properties can be computed, including coarse aggregate PSD. More recently, high-precision shape analysis has become possible by employing anchor-free segmentation models coupled with a Grab Cut refinement process to produce detailed masks suitable for calculating the average AI from field images ( 13 ). However, accurately characterizing particles that are heavily occluded, overlapping, or with blurry boundaries remains challenging from a 2D perspective.
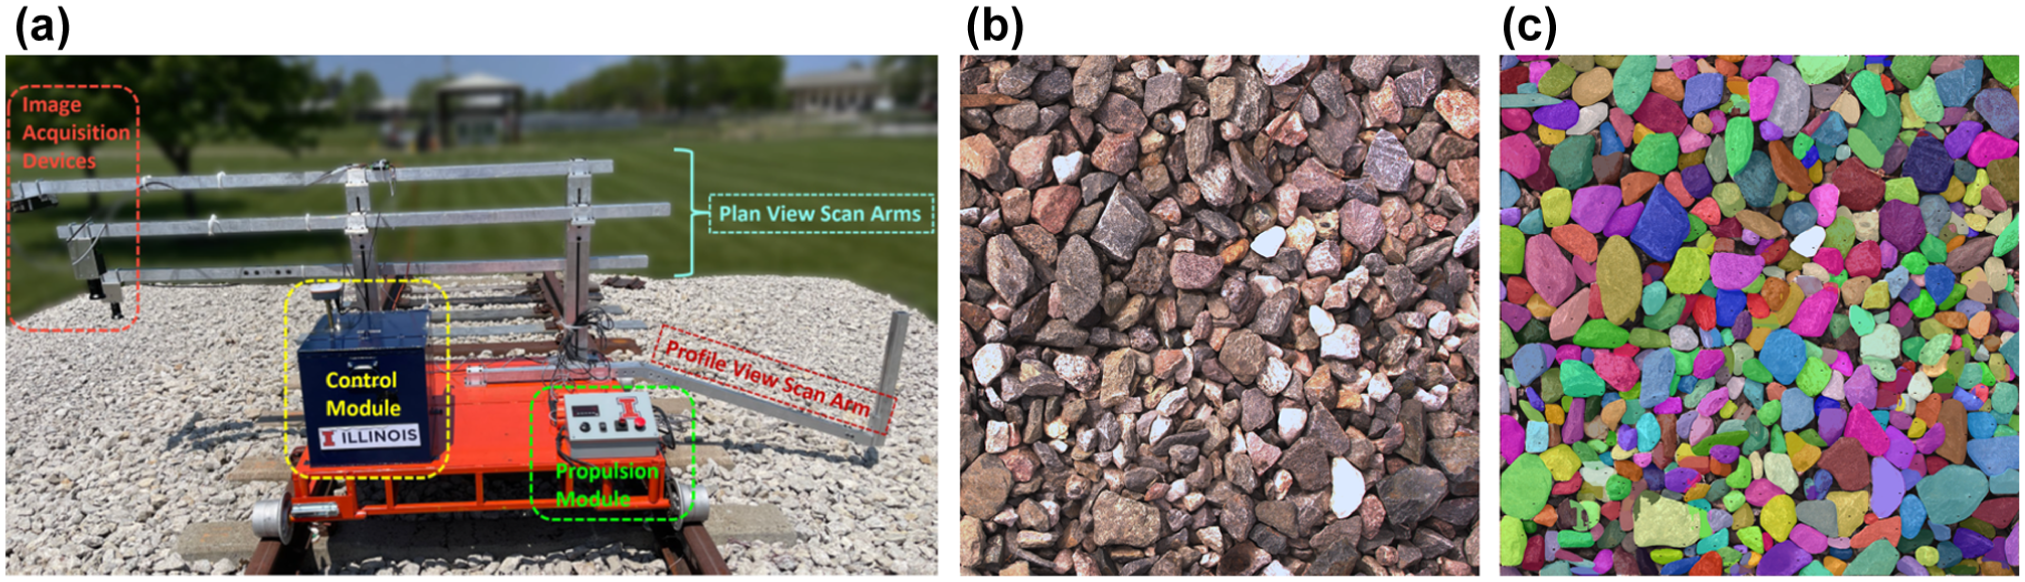
Existing vision-based ballast evaluation method: (a) ballast scanning vehicle (BSV); (b) two-dimensional ballast images captured by the BSV; and (c) its segmentation results, where different colors denote different ballast particles.
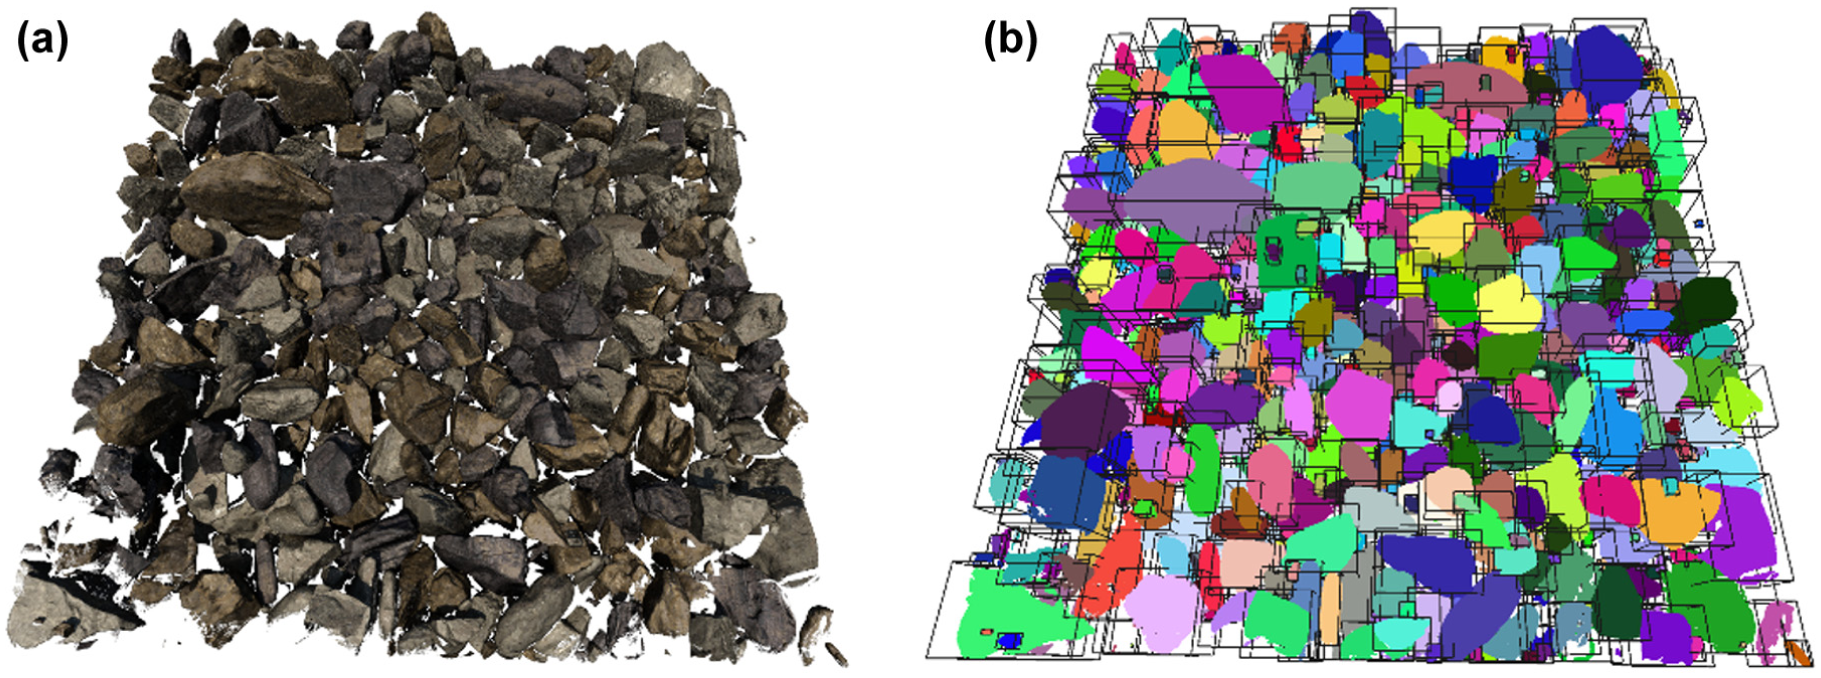
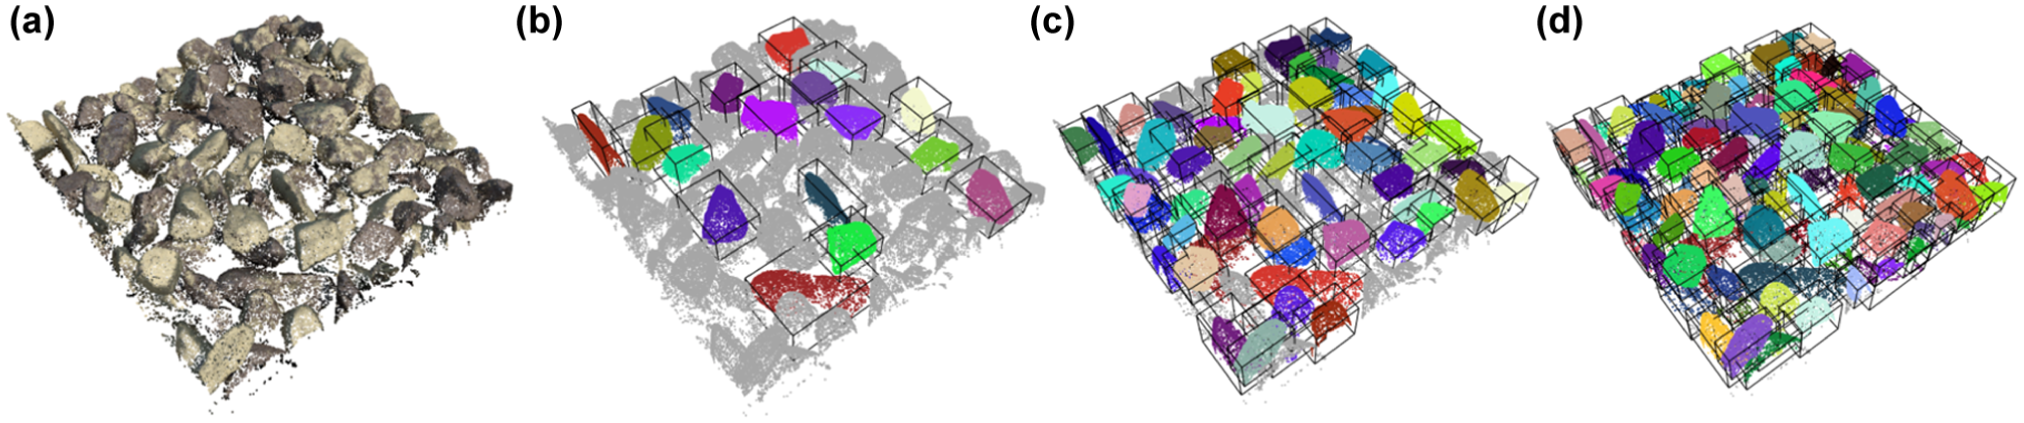
To capture the significant spatial information lost in 2D projections, three-dimensional (3D) deep learning methods have been successfully applied to characterize large riprap aggregates using a reconstruction–segmentation–completion pipeline ( 14 ), where Structure-from-Motion (SfM) was first used to create a 3D point cloud of a stockpile from images captured from multiple viewpoints. Then, deep learning models perform 3D segmentation to isolate individual particles and shape completion to estimate the unseen, occluded portions. The data set required to train both models was generated by a specially designed synthetic data generation process ( 14 ). However, adapting this pipeline to railway ballast is more challenging because ballast consists of a much larger number of smaller, more densely packed particles (Figure 3b) compared with larger, more distinct riprap aggregates (Figure 3a), which leads to severe occlusion and leaves less of each particle’s surface visible. Such complexity makes the 3D instance segmentation and subsequent shape completion more difficult.
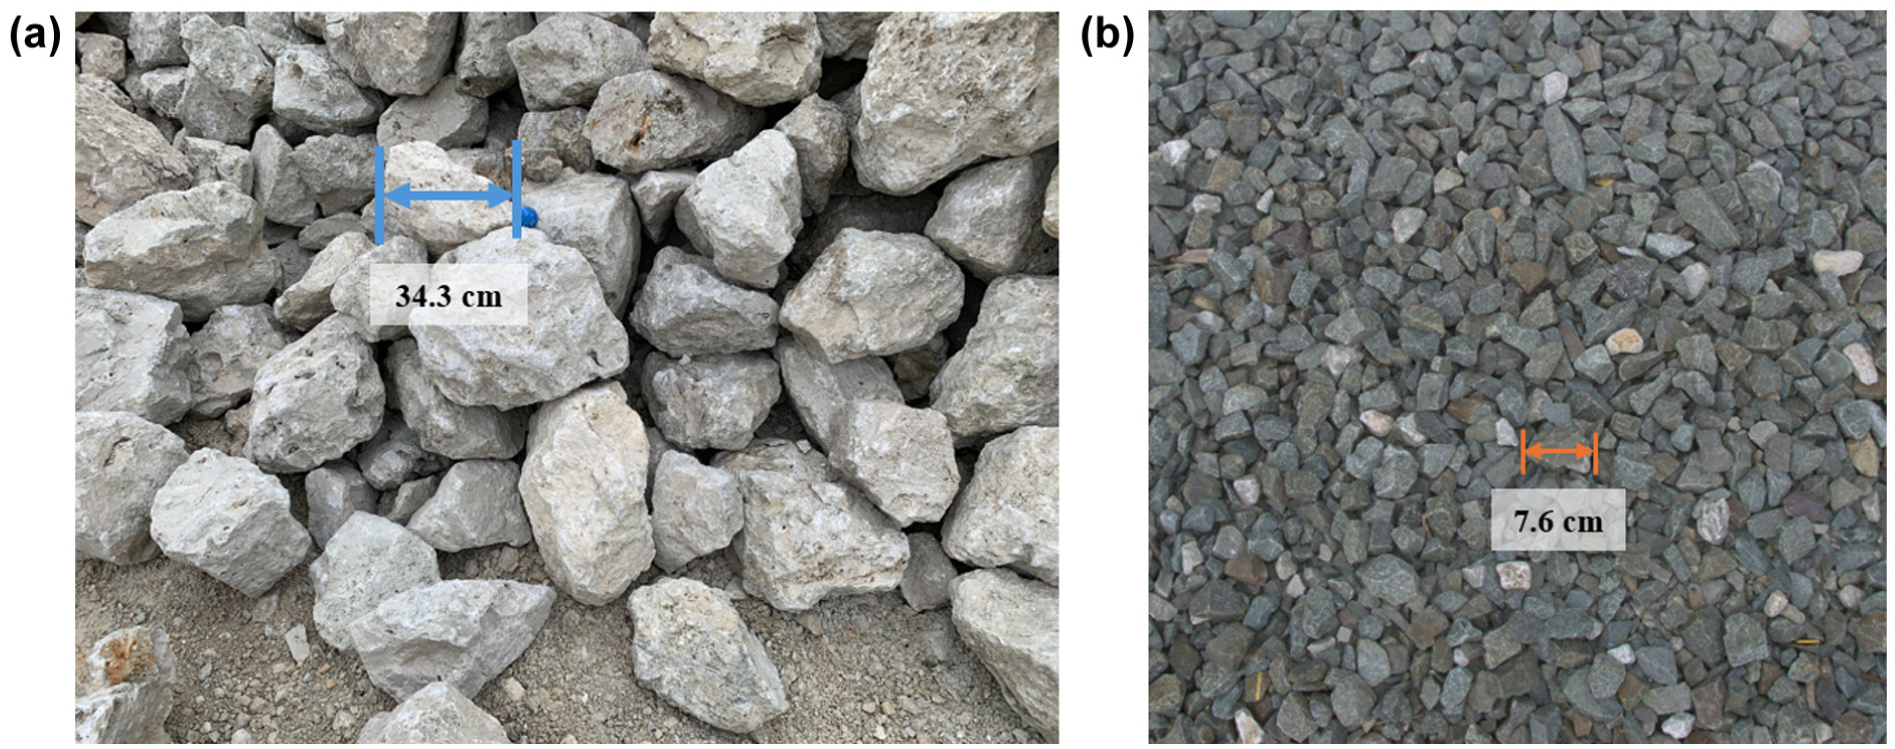
Comparison between: (a) riprap; and (b) railroad ballast in the field.
Recent advances in deep learning, particularly with transformer-based architectures such as Mask3D ( 15 ) for segmentation and a completion framework that utilizes an encoder–decoder architecture built on attention mechanisms (PointAttN) ( 16 ) for shape completion, have provided powerful tools for 3D point cloud analysis. Building on these advancements, this study introduces a novel 3D analysis pipeline designed to provide a comprehensive and robust characterization of railway ballast (BallastAttN). The key contributions of this study are threefold. First, a synthetic 3D ballast data set is established to train and validate the segmentation and completion models. This data set is uniquely built from high-fidelity 3D scans of real ballast particles, including new samples and those at various stages of degradation produced by the Los Angeles (LA) abrasion test (ASTM C131) ( 17 ). Second, an automated deep learning method is needed to execute a reconstruction–segmentation–completion pipeline on data acquired by the area scan camera equipped with the BSV. This includes a novel particle completion model, a deep learning pipeline designed for robust 3D railway ballast characterization, referred to as BallastAttN, which is specifically designed to enhance performance for densely packed ballast particles with limited visibility. Finally, the proposed pipeline needs to be validated using laboratory-engineered ballast samples under isolated and clustered configurations, confirming its capability to provide accurate and robust size and shape analysis.
Objective and Scope
The primary objective of this study is to develop and validate an automated, deep-learning-based 3D analysis pipeline for comprehensive size and morphological characterization of railway ballast. To achieve this objective, the scope of this study is defined by three key tasks. First, the work involves the creation of a task-driven synthetic 3D ballast data set as the foundation for model training and testing. Second, the scope encompasses the development of a deep learning 3D analysis pipeline designed for ballast particles. A key component in this scope is the innovation of a new point cloud completion model (BallastAttN) to address the specific challenges of densely packed ballast particles. Finally, the scope includes the quantitative validation of the integrated pipeline’s performance using laboratory-engineered ballast samples to assess its accuracy and robustness in size and shape characterization.
Establish 3D Ballast Data Set for Deep Learning
Fulfilling the research objective first requires a high-quality and diverse data set. This section details the construction of this data foundation.
Construction of 3D Ballast Particle Repository
First, a comprehensive repository of 3D ballast particles was constructed as the foundation for generating synthetic data sets. To ensure the data set reflects the morphological diversity of in-service ballast, the repository includes particles in new and degraded states. The acquisition process involved two distinct methodologies: (1) high-resolution laser scanning for new particles; and (2) multiview stereophotogrammetry for particles of diverse degradation states simulated with LA abrasion testing. It produces progressively worn ballast particles that increase the diversity of particle shapes in the library.
Digitization of New Ballast Particles via Laser Scanning
The initial library consists of 120 new ballast particles collected from three distinct quarries: (1) a white dolomitic ballast; (2) a gray dolomitic ballast; and (3) a reddish granitic ballast. These materials were selected to capture meaningful variation in color and lithology, improving the diversity and representativeness of the data set and the generalizability of the proposed pipeline built based on the data set. Each particle was digitized using a high-resolution 3D laser scanner (Roland, Hamamatsu, Japan [Figure 4a]). This noncontact method generated a high-fidelity, complete 3D polygonal mesh for each specimen (Figure 5a), forming the baseline for the nondegraded particle set.
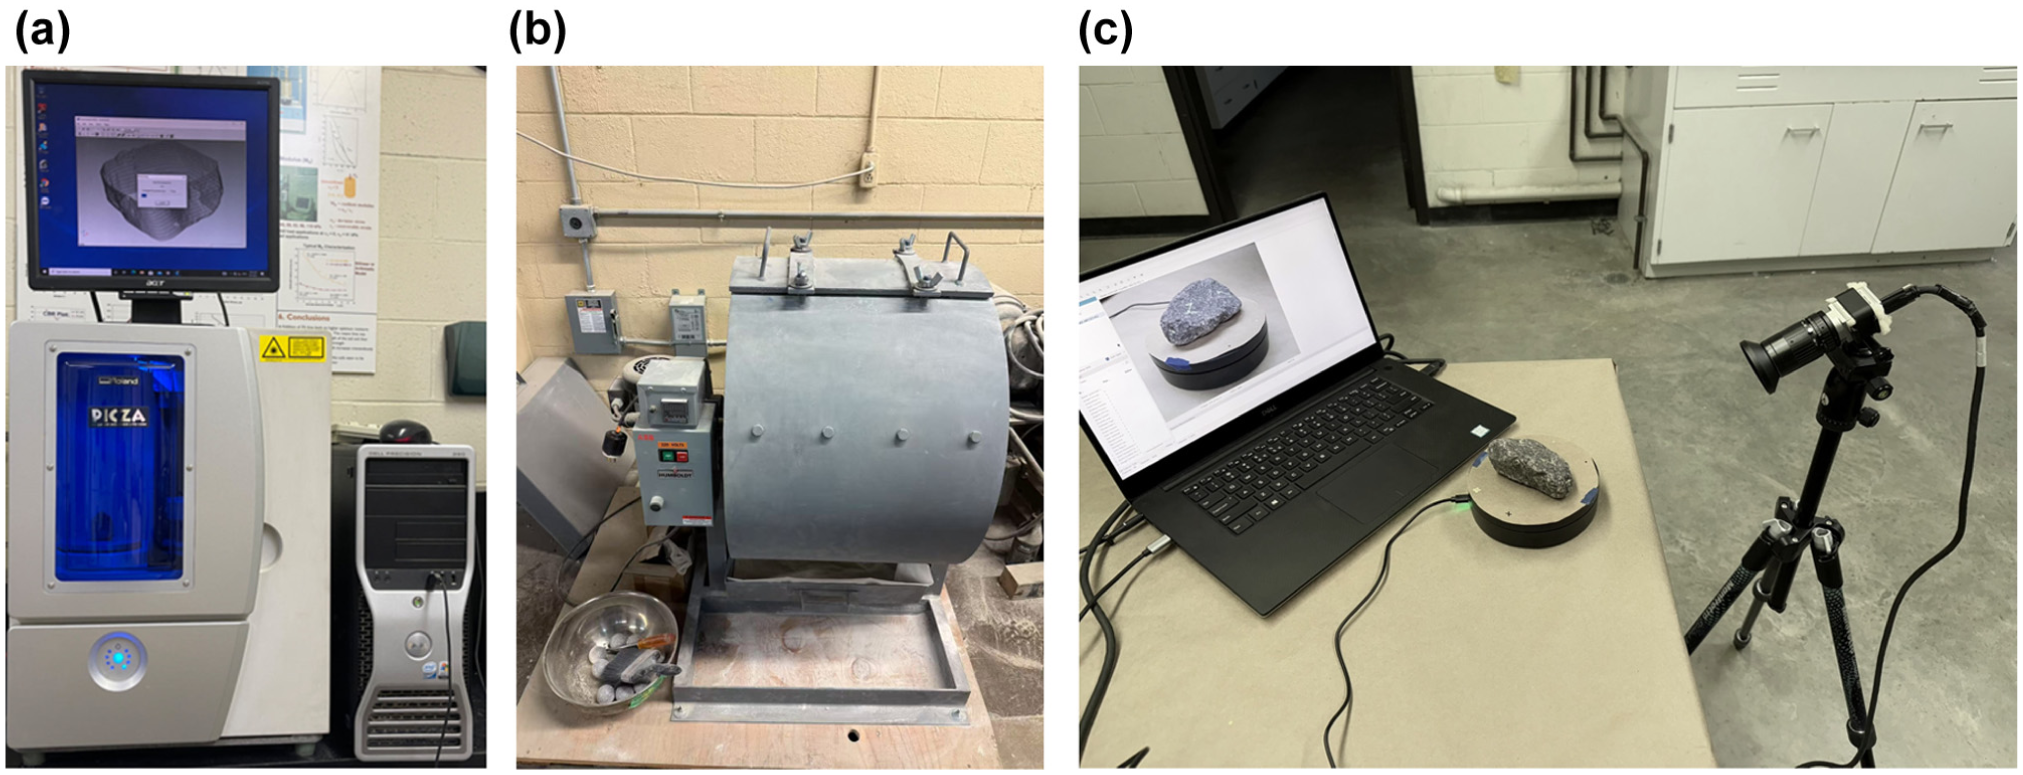
Laboratory settings for the acquisition of three-dimensional (3D) real ballast particle library: (a) 3D scanner for new ballast mesh collection; (b) Los Angeles Abrasion (LA abrasion) test drum; and (c) turntable and camera settings for multiview image collection for ballast particles from LA abrasion tests.
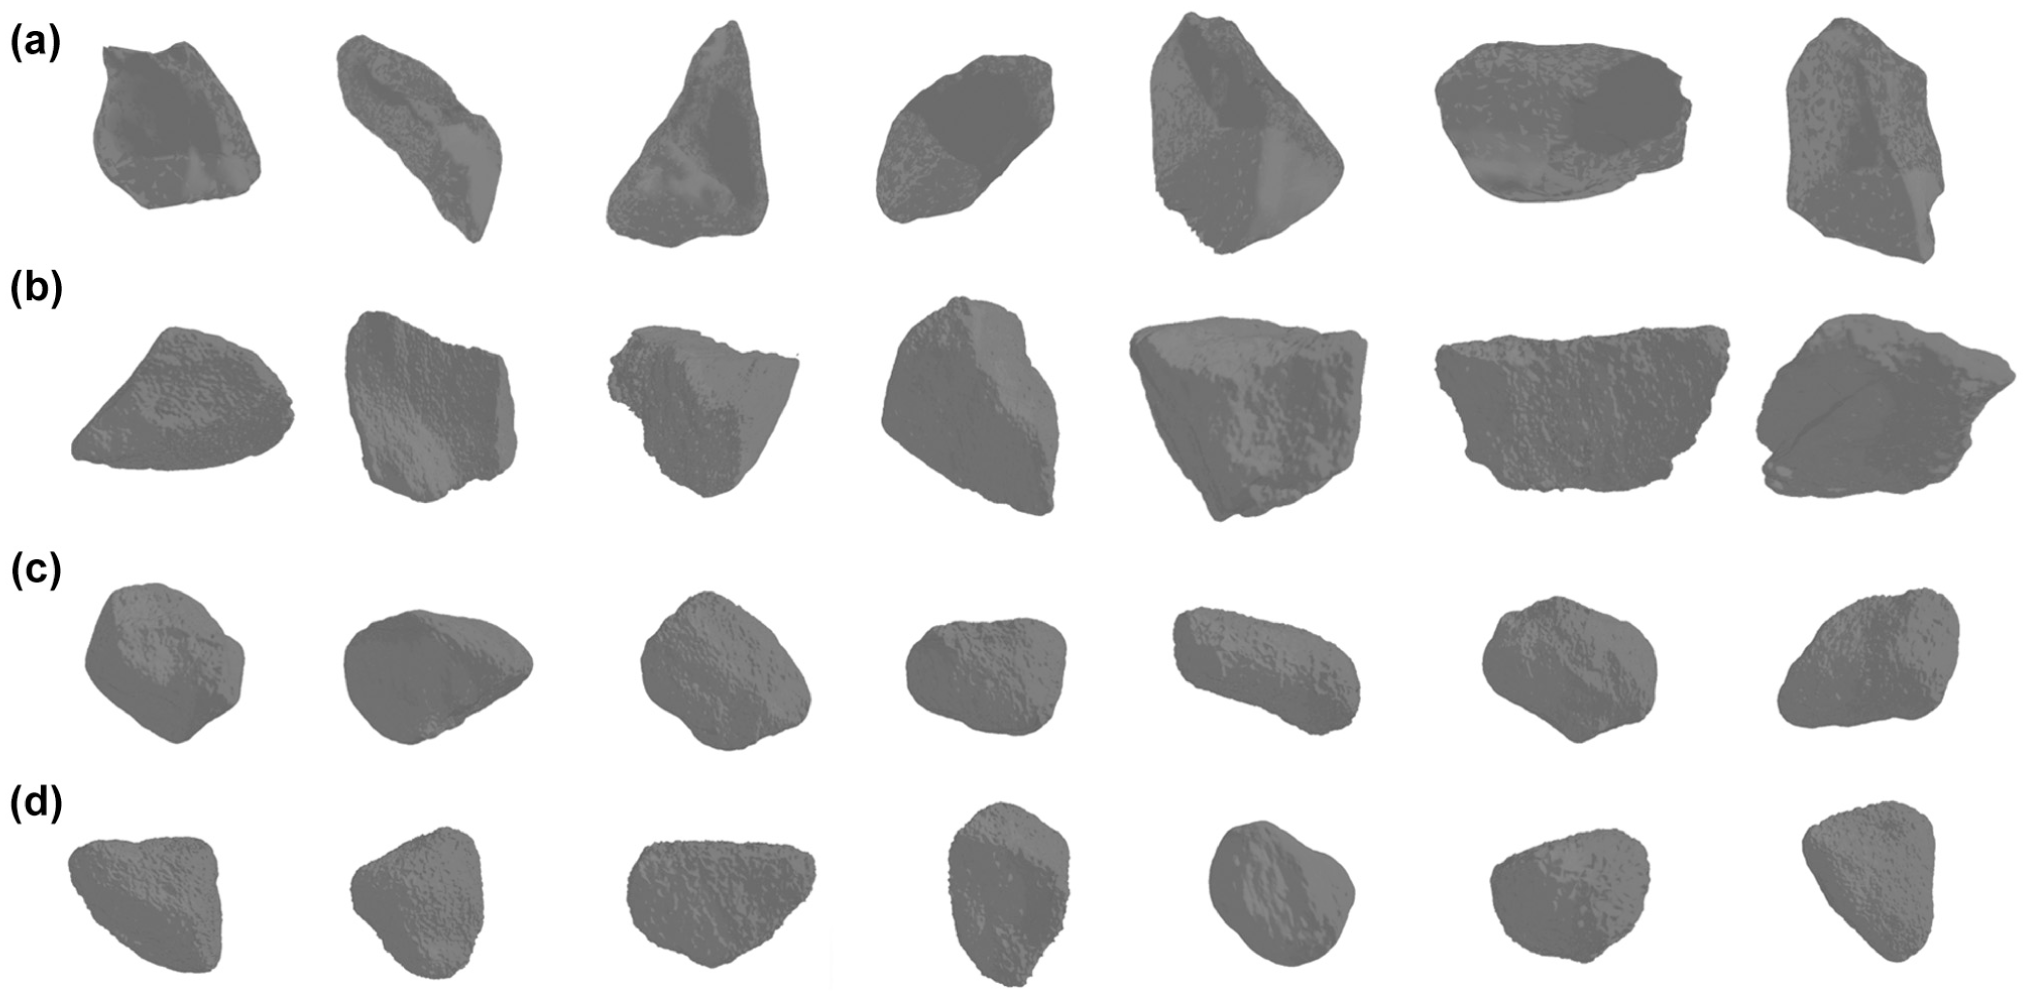
Sample three-dimensional (3D) ballast meshes in the established library: (a) obtained by scanning new ballast with a 3D scanner; (b) reconstructed from multiview images of ballast particles after zero turns; (c) 1,000 turns; and (d) 2,000 turns during LA abrasion testing. Meshes are uniformly rescaled to facilitate visual comparison of shape evolution.
Generation and Digitization of Degraded Ballast Particles
To realistically simulate the progressive degradation of ballast under traffic loading, which results in significant changes to particle morphology (e.g., rounding of edges and particle breakage; 18 ), a controlled laboratory procedure was implemented.
The degradation process was simulated using an LA abrasion test apparatus (Figure 4b). The initial sample consisted of 30 new ballast particles of specified sieve sizes (11 particles at 2 in. [50 mm] and 19 particles at 1.5 in. [37.5 mm]). These were placed in the LA abrasion drum with 12 steel spheres, and the drum was rotated at approximately 30–33 rpm. The test was conducted iteratively. The machine stopped every 250 rotations, and the contents were sieved. Particles retained on the ¾ in. (19 mm) sieve were collected to establish 3D geometry, ensuring that particles with sufficient structural integrity were digitized. Then, these particles were returned to the drum for the next degradation interval. This iterative process was repeated for eight intervals, totaling 2,000 rotations, allowing for the capture of particle morphology at multiple distinct stages of degradation. Figure 6 shows the evolution of PSDs throughout the LA abrasion test.
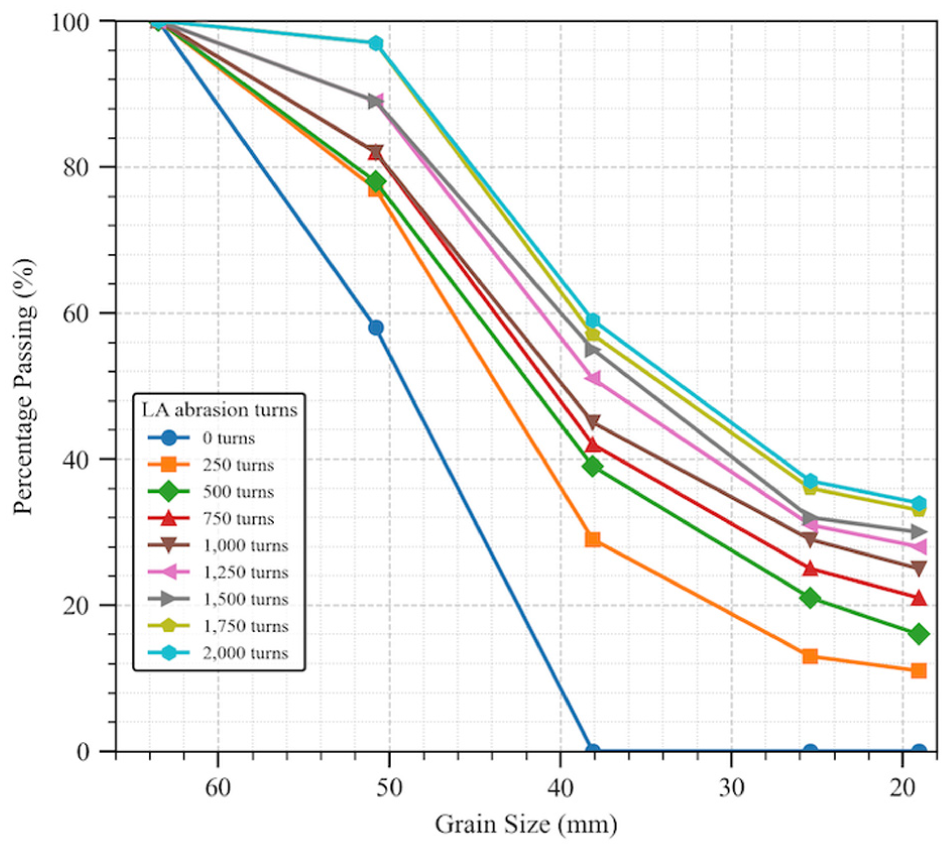
Particle size distribution (PSD) curves of ballast samples generated in the Los Angeles (LA) abrasion test.
From each degradation interval, 3D geometries of approximately 40 selected particles were established using photogrammetry. An area scan camera (2,024 × 1,630 pixels) with an 8 mm lens was mounted at a viewing angle from
To reconstruct a complete 3D shape, this imaging–reconstructing process was performed three times for each particle to generate three partial point clouds, each time with the particle reoriented to expose a different surface (e.g., top, side, and bottom faces). After manually removing artifacts such as the background and the turntable, the three partial point clouds were aligned and merged using a point-based alignment algorithm in Agisoft Metashape. This stitching process yielded a complete and coherent 3D point cloud for each scanned particle, which was subsequently converted into a watertight mesh to support accurate surface area and volume calculations and to enable robust collision detection during physics-based synthetic scene generation.
The resulting repository contains 357 high-fidelity 3D models of ballast particles across a spectrum of degradation levels, from new (Figure 5b) to degraded (Figure 5c and d ) particles. Including the initial set of 120 laser-scanned new ballast particles, the final 3D real ballast repository consists of 477 uniquely scanned particles.
Task-Driven 3D Synthetic Ballast Data Set Generation
3D Point Cloud Segmentation Data Set Generation
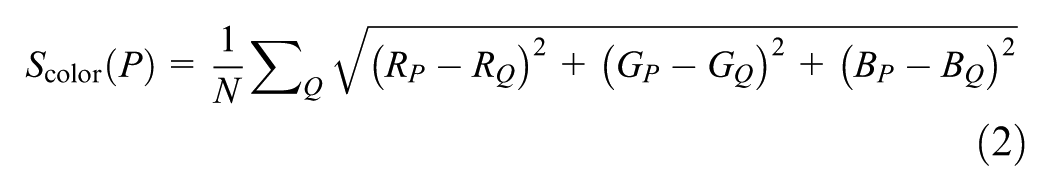
The 3D point cloud segmentation data set is generated using the self-developed synthetic ballast generation pipeline implemented with Blender ( 19 ). First, virtual ballast scenes are created by physics simulation. Each synthetic scene is created using 500–600 particles randomly sampled from the 477 real ballast meshes in the established 3D library. To match a target PSD, each sampled particle is assigned an appropriate size scale before being free dropped into a 1 × 1 m container. Once all particles reach the stable state, the particles will be further compacted to emulate a realistic, densely packed ballast layer. These virtual scenes are rendered using Blender’s Cycles engine repeatedly from a series of different perspectives. The rendering process captures three types of information simultaneously: (1) a standard red, green, blue (RGB) color image; (2) a floating-point depth map saved in extended dynamic range format that provides continuous depth values with precision better than 1 mm; and (3) an object index map. The index map assigns a unique identity (ID) to all pixels belonging to a specific particle, serving as the ground-truth label for each pixel. Finally, these multiview data are fused via inverse projection to produce fully annotated 3D point clouds, in which each point includes its location, color, surface normal (Figure 7a), and a unique particle ID (Figure 7b), creating a high-quality data set ready for training segmentation models.
Example synthetic ballast data for three-dimensional particle segmentation: (a) generated point cloud with color and normal information; and (b) generated point cloud labels (different colors denote different ballast particles) with their bounds.
3D Point Cloud Completion Data Set Generation
Training a 3D shape completion model requires a specialized data set of partial–complete point cloud pairs to help models learn how to predict the geometry of unseen or occluded portions of a particle. The generation process begins with the high-fidelity 3D ballast meshes from the established ballast particle library (Figure 8a). For each mesh, a complete ground-truth point cloud (Figure 8b) is obtained by sampling the mesh surfaces. Diverse techniques are employed to create partial point clouds, as shown in Figure 8, c–e. Some partial point clouds are generated by applying a 3D Perlin noise map ( 20 ), which creates complex, irregular holes and missing sections on the particle’s surface (Figure 8c). Another method involves using a random cut (Figure 8d) to simulate larger fractures or occlusions. Most importantly, to generate partial data that accurately reflects real-world conditions, partial point clouds are extracted directly from the synthetic segmentation data set (Figure 8e). This method provides a realistic representation of what a ballast particle looks like when it is part of a densely packed field ballast spot, with occlusions caused by neighboring particles.
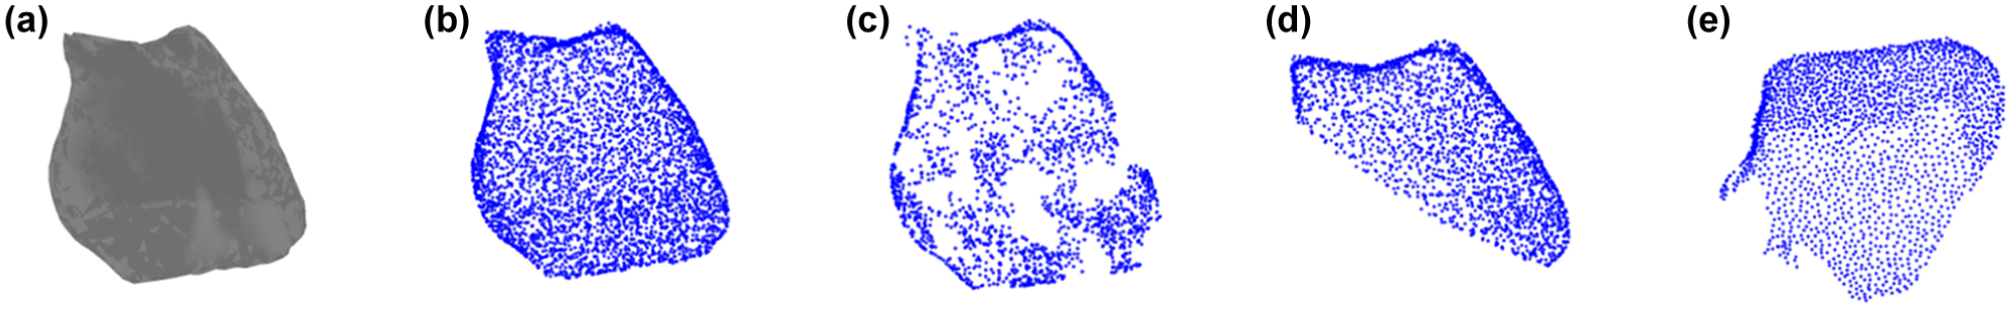
Completion task data set generation: (a) three-dimensional (3D) ballast mesh in the library; (b) complete ballast point cloud sampled from (a); (c) partial point cloud by 3D Perlin noise map; (d) partial point cloud by random cut; and (e) partial point cloud from the synthetic segmentation data set.
Deep Learning-Based 3D Ballast Analysis
This section introduces the complete deep learning-based pipeline for 3D ballast analysis developed in this study (Figure 9).
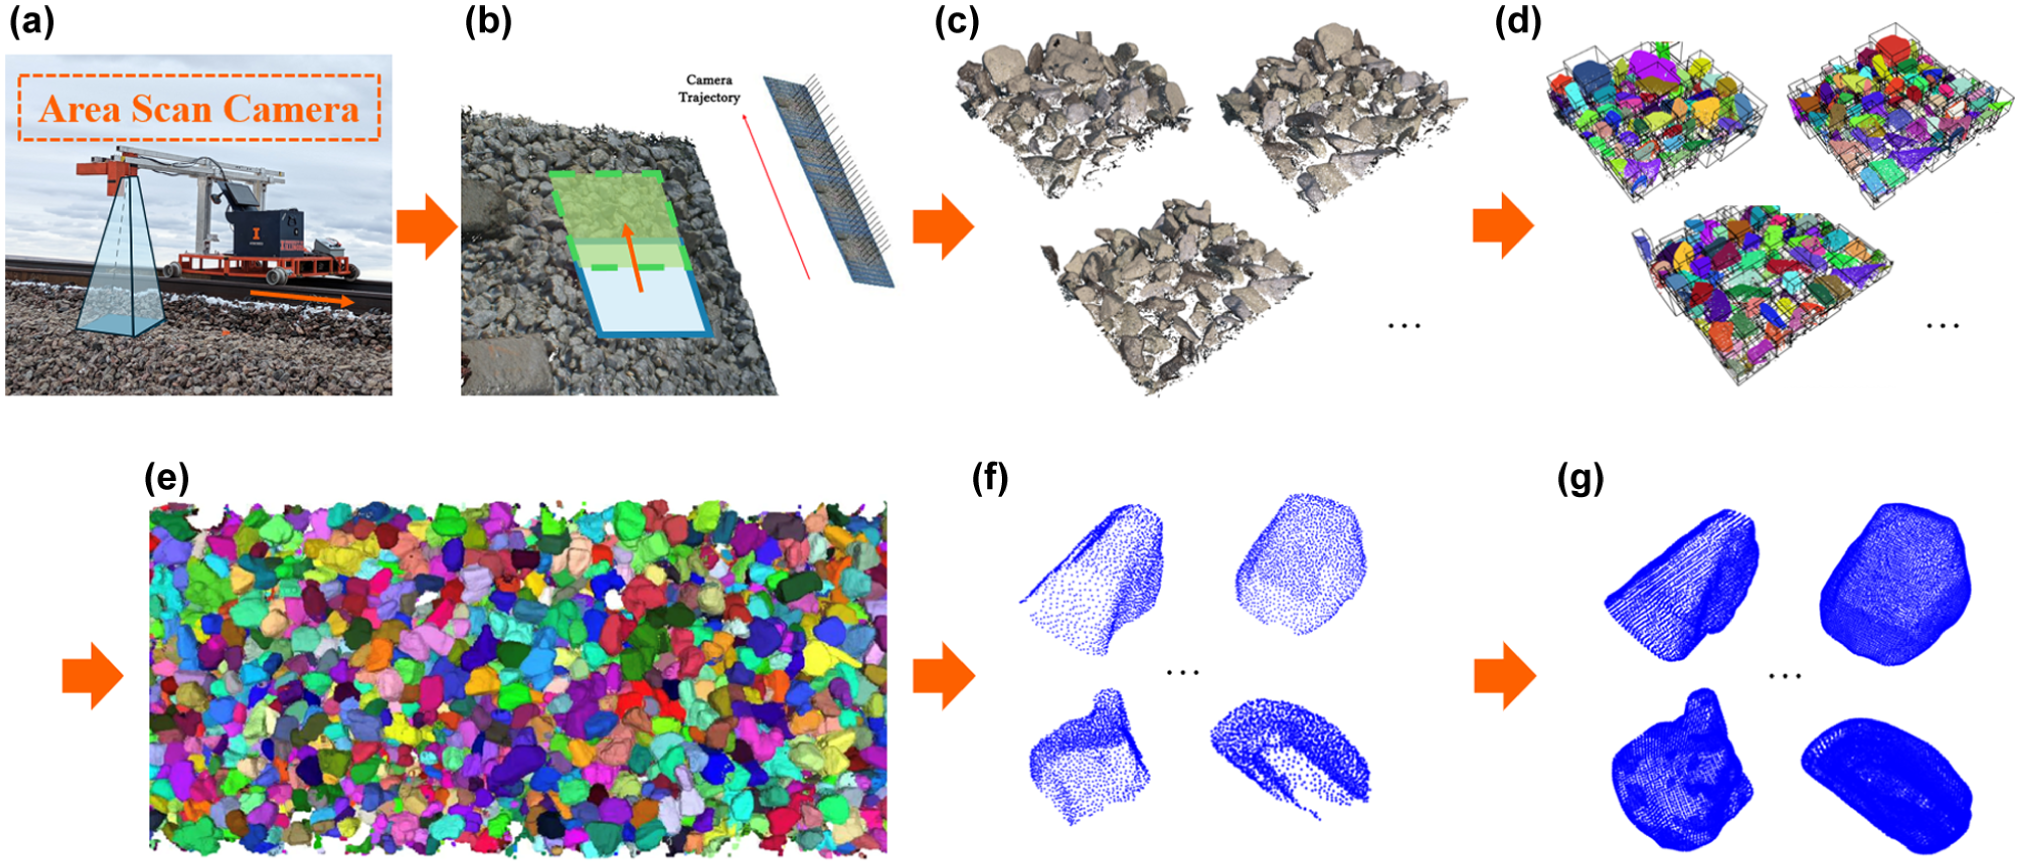
Flow chart of the deep learning-based three-dimensional (3D) ballast analysis: (a) area scan camera mounted on the ballast scanning vehicle (BSV) captures high-resolution images of the ballast shoulder; (b) multiview images are processed to reconstruct dense 3D surface point clouds of the ballast bed; (c) for detailed point cloud segmentation, the reconstructed dense surface point cloud is divided into 20 × 20 cm overlapping patches with a 10 cm stride, a size selected to ensuring both full particle coverage and efficient deep learning processing; (d) point cloud patches are segmented into individual ballast particles using the point cloud segmentation model; (e) merge and consolidate the segmentation results of individual patches; (f) individual ballast particle point clouds are isolated for completion; and (g) completed ballast particle point clouds are obtained by the completion model. The completed point clouds will be used for detailed size and morphological analyses.
First, the BSV scans the target ballast surface with an area scan camera mounted on the BSV, capturing consecutive high-resolution, multiview images while the BSV travels along the railway track (Figure 9a and b ). These images are used to reconstruct dense 3D point clouds of the ballast surface with Agisoft Metashape. The reconstructed point clouds will then be split into overlapping patches (Figure 9c) and fed into the point cloud segmentation model to obtain individual, incomplete ballast particles (Figure 9d). After the segmentation results from all patches are merged and consolidated (Figure 9e), each individual particle’s partial point cloud is isolated (Figure 9f) to be inferred by the point cloud completion model to predict the unseen geometry and generate a complete point cloud (Figure 9g). Finally, these completed 3D point clouds are used for detailed analyses to determine the size and shape properties for each ballast particle. At this stage, the proposed approach focuses on coarse ballast particles with estimated sieve sizes larger than ⅜ in. (9.5 mm), considering limited computing resources and the capability of the segmentation and completion models.
Ballast Particle Point Cloud Segmentation
For point cloud segmentation, this study adopts the state-of-the-art transformer-based 3D instance segmentation model, Mask3D ( 15 ), and applies a set of improvements.
Edge-Aware Point Cloud Voxelization
Like many 3D deep learning models, Mask3D relies on an initial voxelization step to convert the point cloud into a grid format. For densely packed objects such as ballast particles, standard voxelization can be detrimental to segmentation accuracy. When particles are extremely close, points from different adjacent particles often fall into the same voxel. The subsequent averaging or discarding process blurs the distinct boundaries between them, effectively merging separate particles in the voxel representation and making them difficult for the model to distinguish, as shown in Figure 10a and b .
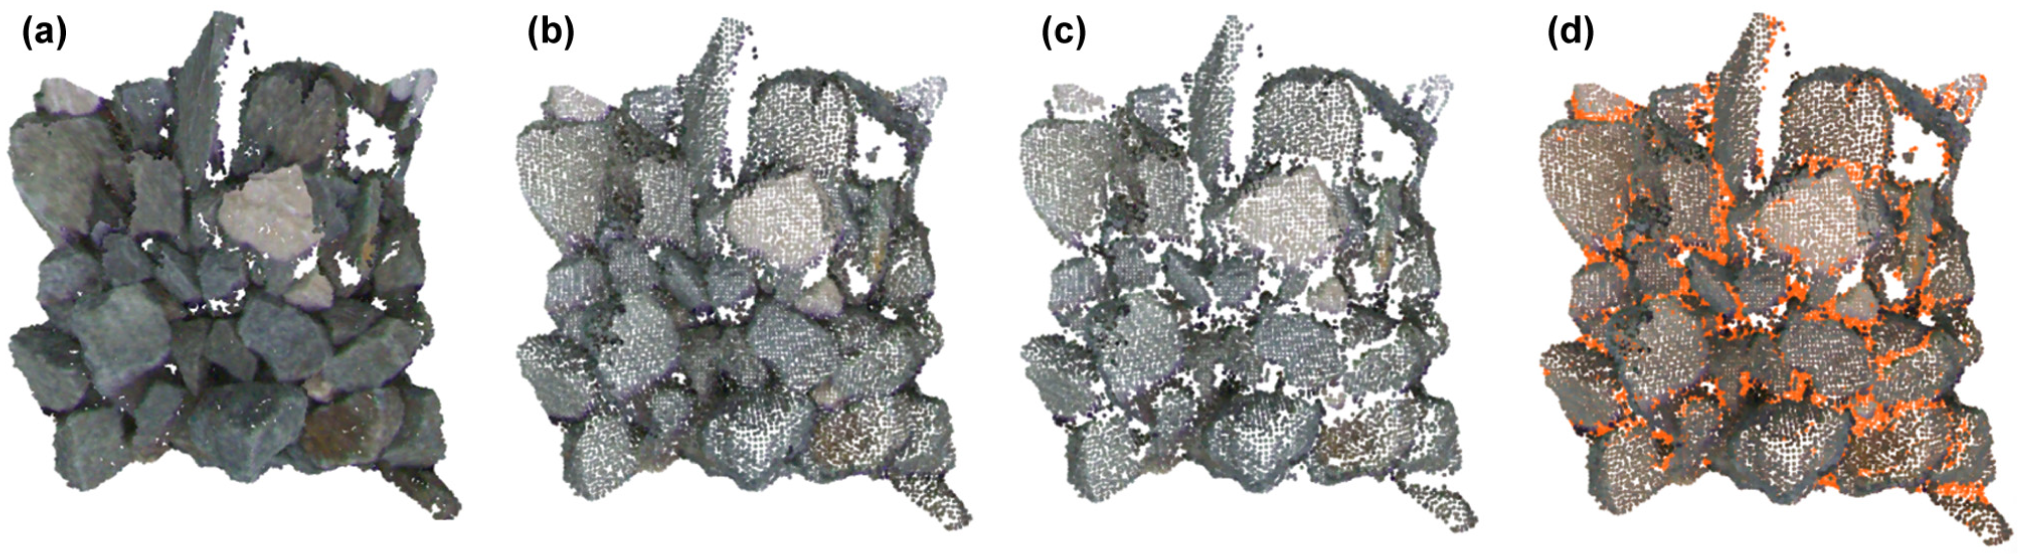
Edge-aware point cloud voxelization to enhance ballast particle segmentation: (a) input ballast particle point cloud (0.2 × 0.2 m); (b) normal voxelization with a voxel size of 0.002 m; (c) edge-aware voxelization with a voxel size of 0.002 m; and (d) difference (orange points) between (b) and (c).
This study enhances the voxelization with a novel edge-aware preprocessing step. This method first identifies points that are likely to lie on the edges between particles. Given that ballast particles are convex (
21
), a sharp angle suggests a high probability of an edge (Figure 11a). Therefore, a normal score (
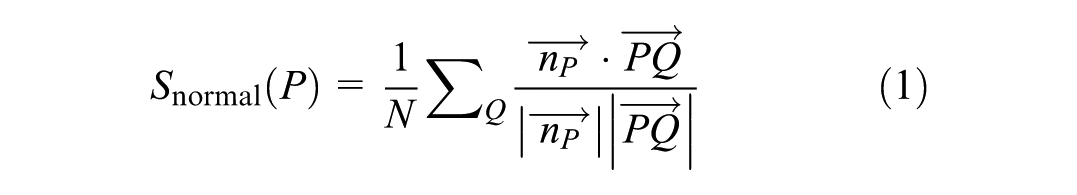
where
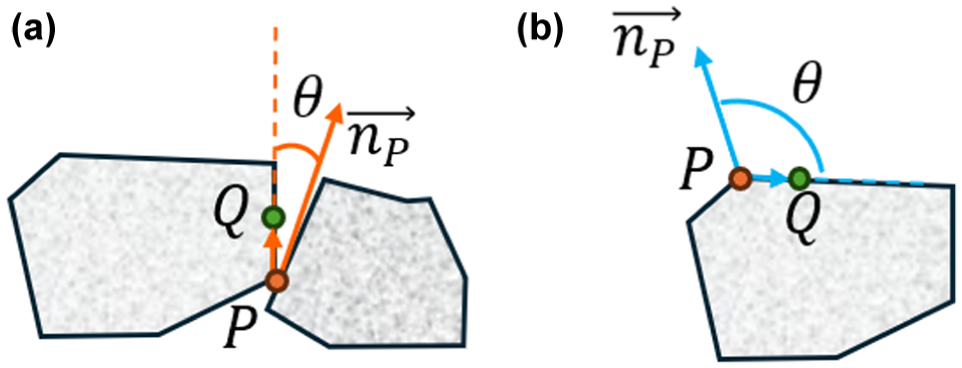
Normal score
Curriculum Learning
Curriculum learning ( 22 ) is a training strategy for machine learning models that mimics how humans learn, starting with easier concepts and gradually progressing to more complex ones. Instead of presenting the model with randomly ordered training data, the data is organized into a “curriculum” of increasing difficulty. This technique is introduced in training the ballast particle segmentation model in this study. The model first trains on an easy-level task with fewer, larger, and more distinct particles (Figure 12b), allowing it to learn the basic features of individual ballast aggregates. It then moves to a medium-level task with more particles that are smaller and more densely packed (Figure 12c). Finally, it graduates to the hard-level task, which involves additional, smaller and heavily occluded particles (Figure 12d). This structured learning plan helps the model build a robust understanding of particle features in a step-by-step manner, improving its overall segmentation performance on challenging, dense point clouds.
Curriculum learning plan for ballast particle point cloud segmentation: (a) input ballast particle point cloud; (b) Easy-level task including 17 particles with more than 2,048 points each; (c) Medium-level task including 58 particles with more than 1,024 points each; and (d) Hard-level task including 117 particles with more than 128 points each.
BallastAttN: Enhanced Ballast Particle Point Cloud Completion
Following segmentation, the resulting isolated ballast point clouds remain incomplete, necessitating a shape completion model to reconstruct their full 3D geometry for accurate morphological analysis. This study adopts PointAttN ( 16 ) as the baseline model, a state-of-the-art completion framework that utilizes an encoder–decoder architecture built on attention mechanisms, eliminating the need for kNN-based local feature extractors. The network first encodes the partial point cloud into a global shape code, then uses a seed generator to create a sparse but complete skeleton of the object. Finally, a point generator progressively refines the sparse skeleton into a dense, fine-grained final shape.
However, the standard completion process has a limitation when applied to heavily occluded ballast. In the pioneering study on 3D analysis of riprap aggregate ( 23 ), the concept of shape percentage (SP) was developed to quantify the completeness of the input partial point cloud (Figure 13). This study suggests that even well-trained models only produce high-confidence completion results for partial inputs with SP values over 70%. During standard data processing, the partial input and the complete ground-truth point clouds are normalized using the same transformation parameters derived from the complete shape ( 24 ); the origin indicates the geometric center of the complete shape. However, for partial input without the complete shape, their transformation parameters can only be derived from the partial information, making the baseline models use the geometric center of the partial input as an anchor to generate the missing geometry.
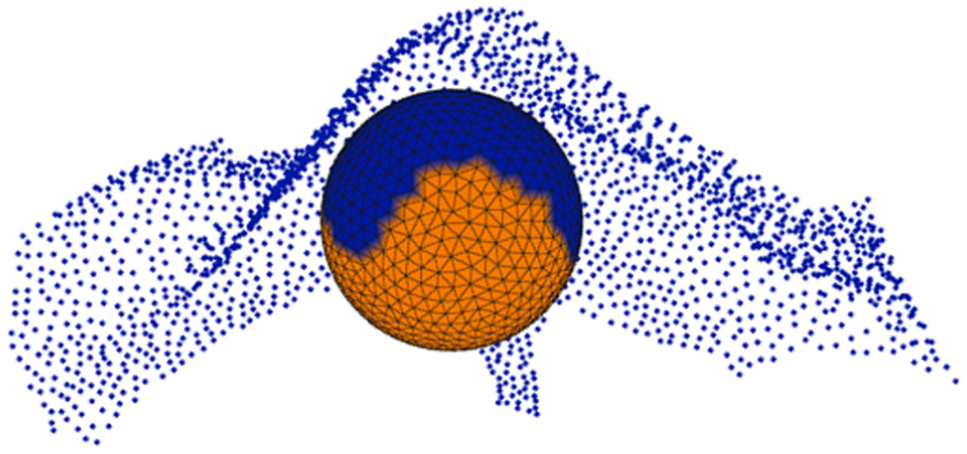
Shape percentage (SP) of a partial shape ( 23 ). The blue region projected on the sphere (center at the geometric center of the complete shape) represents the proportion covered by the partial shape, while the orange region illustrates the missing proportion.
Compared with riprap particles, whose SP values typically from 65% to 85% ( 23 ), densely packed ballast particles often have low visibility with SP values less than 50% in their segmented results, where the center of the visible partial cloud is significantly offset from the true center of the complete particle. This offset causes the baseline model to fail because it is likely to simply cap the open surface of the partial data rather than rebuilding the true missing volume, resulting in an artificially smaller shape.
To solve this, a novel two-stage BallastAttN architecture is proposed (Figure 14). The first stage is a partial point cloud positioning (PPCP) module, which uses a lightweight encoder to analyze the local features of the input partial cloud P, applying a similar architecture to the baseline’s global feature extractor, empowered with geometric details perception and self-feature augment modules ( 16 ). From the local shape code, convolutional prediction heads output two critical pieces of information. One is the estimated transformation parameters, including scale and translation, used to transform the partial cloud so that the center of the original (complete) particle aligns with the origin, and its completed shape sits mostly within the standard cube centered at the origin with an edge length of two. The other is the estimated SP value of the input point cloud as a confidence metric for the completion. During post-processing, particles with SP values below the threshold can be discarded on demand to improve the overall confidence and quality of the results.
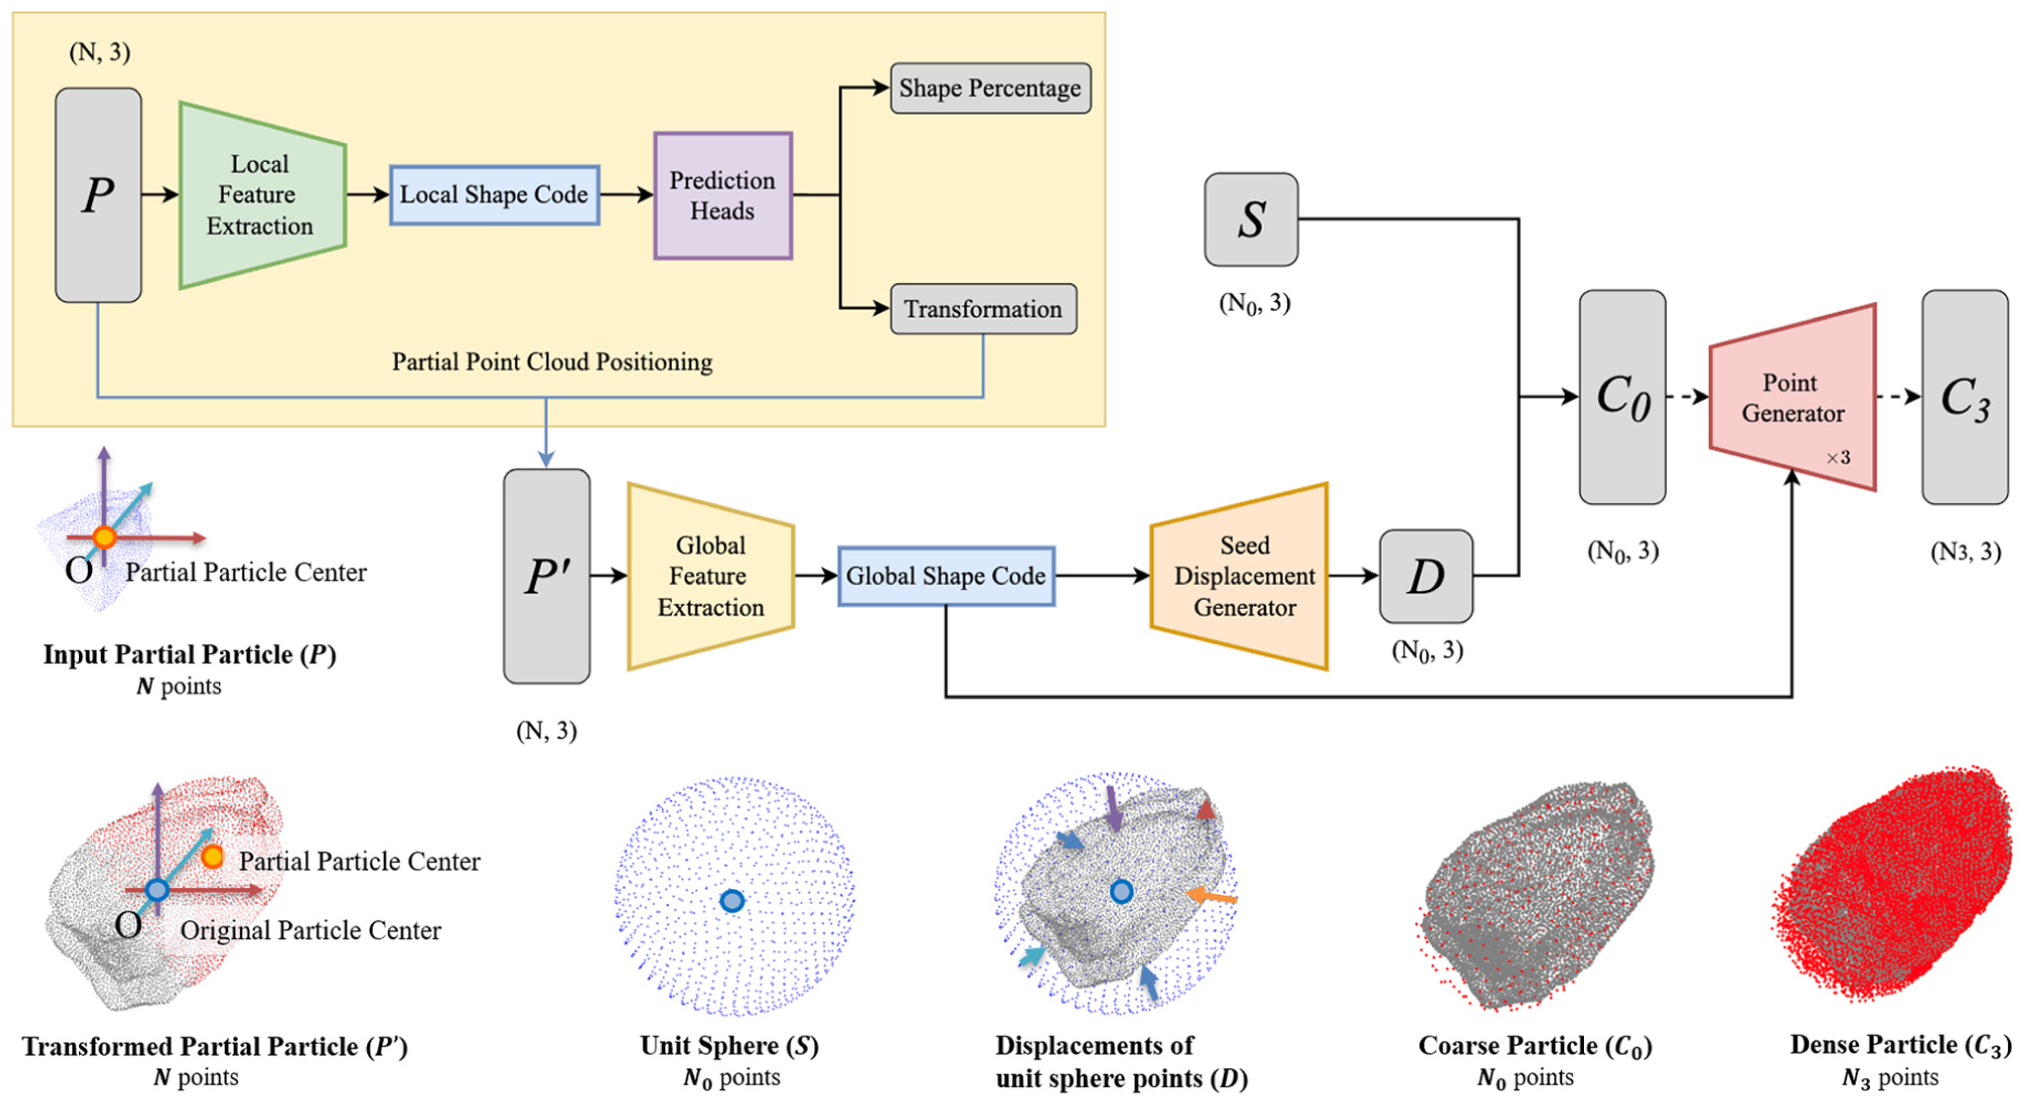
Proposed BallastAttN architecture for three-dimensional (3D) ballast particle completion. A partial point cloud positioning (PPCP) module is proposed to predict proper transformations and the shape percentage (SP) of the input partial point clouds P. Seed displacement generator (SDG) will then learn displacements D from the transformed partial point cloud
After being correctly positioned, the transformed partial cloud
The training process for the proposed BallastAttN is adjusted to fit its two-stage architecture by breaking the learning process into two distinct phases. In the first phase, the primary goal is to train the main completion modules, the global feature encoder, the SDG, and the point generator, to be able to reliably rebuild complete shapes. During this phase, the ground-truth center and scale of the complete particle are provided. This phase isolates the shape completion task without adding the difficulty of simultaneously estimating the partial particle’s transformation. During the first phase, the network is supervised by a Chamfer Distance (CD) loss function (
16
,
23
) to optimize the similarity between the completion results
Once the completion modules are fully trained, their weights are frozen, and the second training phase begins. In this phase, the focus shifts to training the PPCP module. This module takes the input partial point cloud and learns the correct transformation parameters. A mean squared error loss is applied to the predicted transformation parameters and the SP value. During training, the positioning module is validated against the CD between the final output of the entire pipeline and the ground-truth complete shape, ensuring that the positioning module can produce transformations tailored to the completion network that follows it.
Evaluation
Deep Learning Models Performance Evaluation
This section details the performance of the proposed deep learning models for ballast point cloud segmentation and completion during training and evaluation, including the experimental setup, training process, and validation results achieved. All training and validation experiments were conducted on a workstation equipped with an NVIDIA RTX 4090 graphics card with 24 GB of memory.
Ballast Point Cloud Segmentation with Mask 3D
The generated synthetic ballast particle segmentation data set was partitioned into training and validation sets. The training set consists of 1,394 distinct 0.2 × 0.2 m patches, while the validation set contains 25 unseen patches of the same size. To facilitate a curriculum learning approach, the training data was divided into three stages of increasing complexity based on the number of points within particles. The curriculum progressed from an Easy stage with 18,105 large particles (> 2,048 points each), to a Medium stage with 56,482 smaller particles (> 512 points each) and concluded with a Hard stage that introduced 77,674 of the smallest particles (> 128 points each). The validation data set contains a total of 1,537 particles.
In this study, Mask3D was used as the baseline instance segmentation model, configured with a standard Res16UNet34C backbone ( 26 ). The input point cloud is processed with a voxel size of 0.002 m. Each point is represented by a 9-dimensional feature vector, comprising its position (XYZ), color (RGB), and normal vector. The model was trained using a three-stage curriculum learning strategy. Stage 1 (Easy) was trained for 200 epochs, and Stages 2 (Medium) and 3 (Hard) were trained for 400 epochs. The best-performing model weights from the preceding stage were used as the starting point for the subsequent stage, allowing the model to build on previously learned features. The total loss function is a combination of a bounding box regression loss and a Dice loss for segmentation ( 15 ), which effectively guides the model to learn both the location and the precise shape of the particles. As shown in Figure 15, the training loss curve demonstrates the effectiveness of this approach. The loss value decreases sharply during Stage 1 and continues to converge to a stable, low value through Stage 2 and Stage 3, indicating a successful learning curve and model stability.
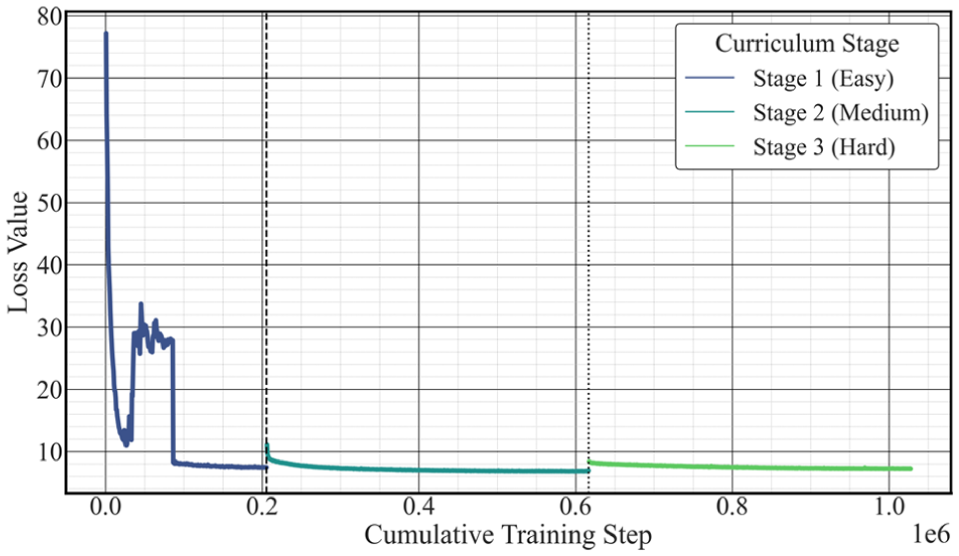
Training loss curve of the segmentation model trained using the proposed three-stage curriculum. The loss values converged as the model progressed through Easy, Medium, and Hard stages of training over 1 million cumulative steps.
The standard metric average precision (AP) is used to quantitatively evaluate the model’s segmentation performance. A higher AP score indicates better overall accuracy in localization and segmentation.
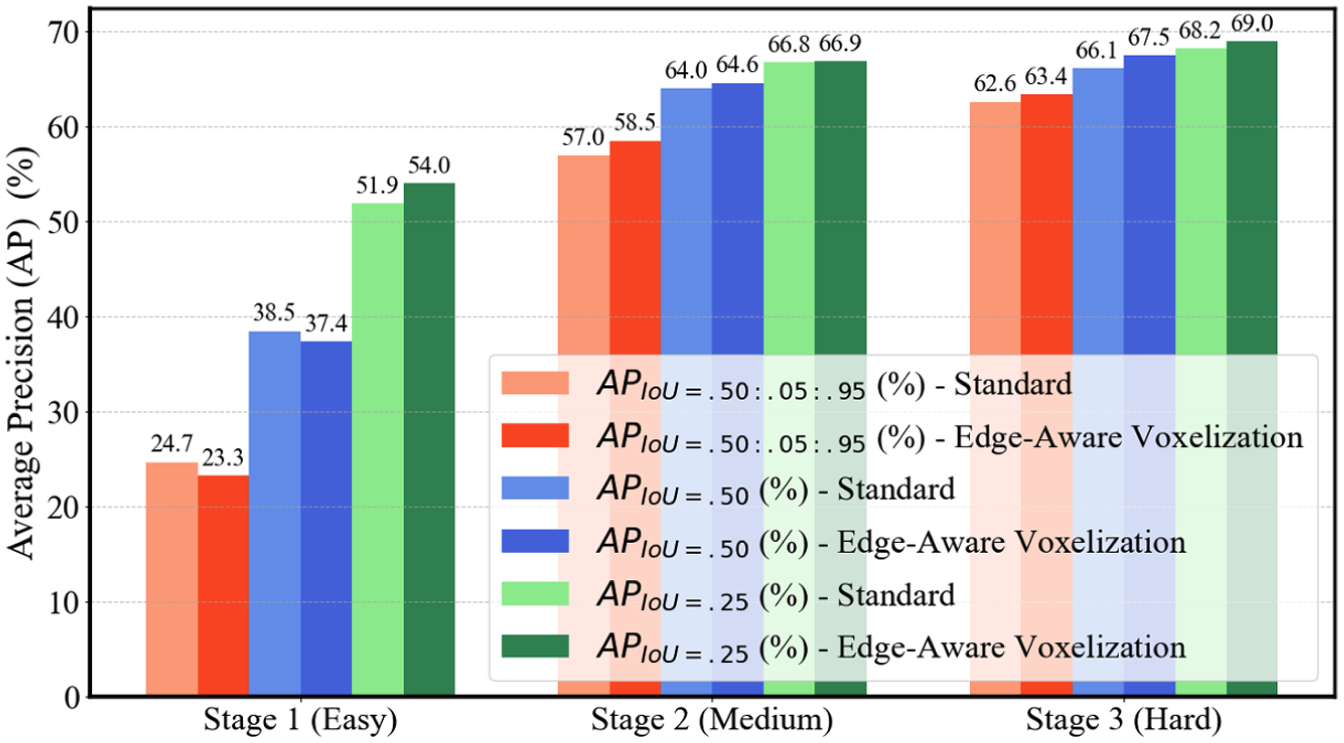
Validation (average precision [AP] %) for the baseline Mask3D model trained in three sequential stages. It also compares the performance of a standard method against the proposed edge-aware voxelization. In all cases, validation performance improves from Stage 1 to Stage 3, and the edge-aware method yields higher scores in later stages where finer particles are included.
Ballast Point Cloud Completion with BallastAttN
The training, validation, and testing data sets for the completion task were established from a collection of 447 high-fidelity point clouds from the established 3D ballast particle repository. From this collection, 95 particles were reserved for the final testing data set, while the remaining particles were used for training and validation. To generate the necessary training data for the shape completion task, these particles were processed through a set of the mentioned methods to create sufficient partial–complete pairs. This resulted in a comprehensive data set consisting of 31,733 pairs for training, 3,819 pairs for validation, and 2,414 pairs for testing.
Two models were trained for comparison: the baseline PointAttN model and the proposed BallastAttN model. Both models were configured with consistent architectural parameters for the global feature encoder and the point generator, accepting a maximum input of 8,192 points, processing them into a 1,024-dimensional shape code, and generating a coarse point cloud
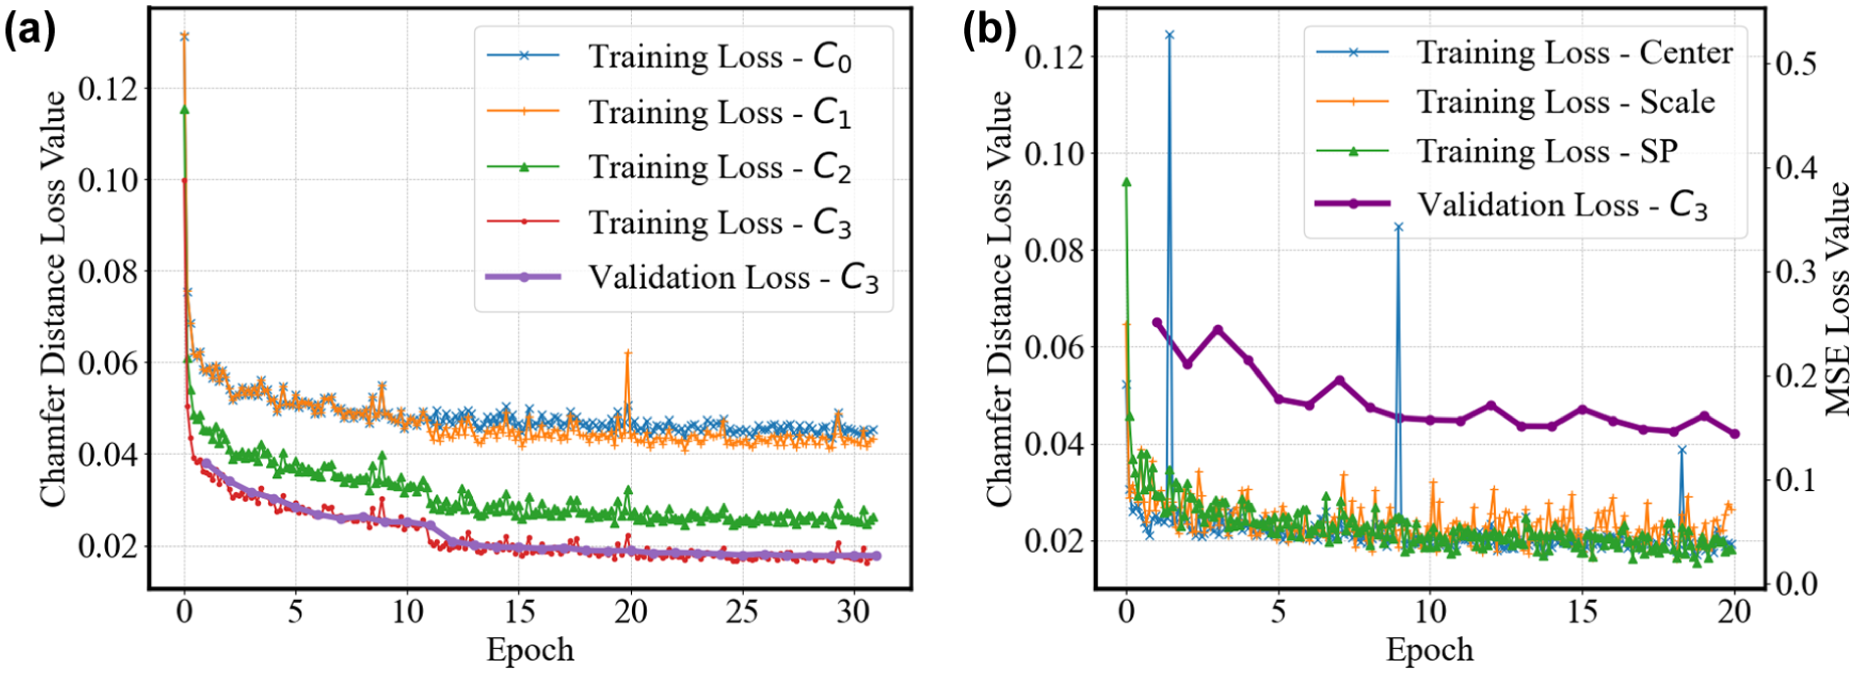
Training and validation performance of the BallastAttN model: (a) training Phase 1: the Chamfer Distance (CD) loss for the model’s coarse-to-fine prediction stages (
The evaluation compared the performance of the fully trained BallastAttN against the baseline PointAttN on the reserved testing data set. The performance of each model was evaluated using the Percentage Chamfer Distance (PCD) calculated by the CD divided by the ground-truth particle’s longest dimension. The BallastAttN achieved an average PCD of 3.07% on the test set, outperforming the baseline PointAttN, which achieved an average PCD of 6.28%. Figure 18a shows how the trained BallastAttN was able to reliably predict SP values for the input partial point cloud by clustering tightly around the ideal
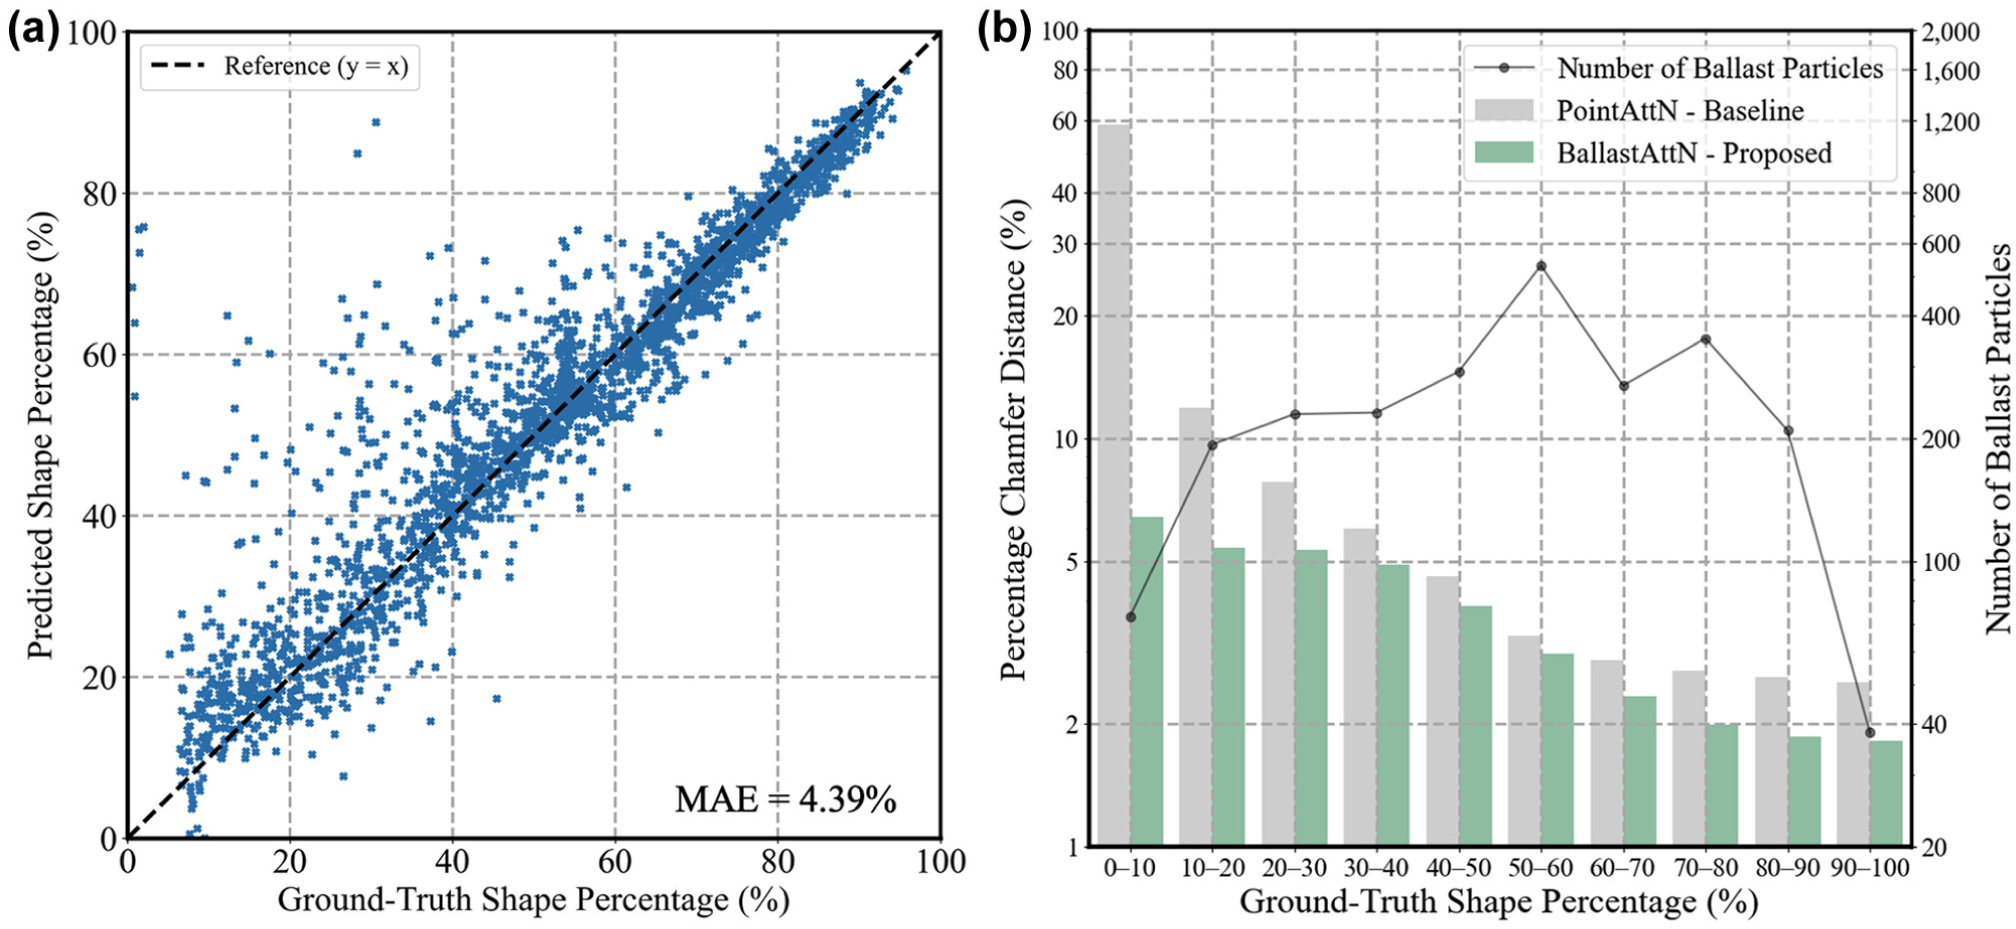
Performance analysis of the proposed BallastAttN model on the test data set: (a) compares the model’s predicted shape percentage (SP) values against the ground-truth SP values; (b) compares the Percentage Chamfer Distance (PCD) of the proposed BallastAttN against the baseline PointAttN model across various SP bins. The superimposed line graph illustrates the distribution of ballast particles within the test data set.
Validation on Controlled Laboratory Ballast Data
Models trained exclusively on synthetic data often encounter a performance deficit when applied to real-world scenarios because of the simulation-to-real gap. To quantitatively validate the efficacy of the trained models in the proposed workflow, a controlled laboratory experiment was designed. This validation utilized a physical data set composed of 120 new and 30 degraded ballast particles, which have been used to acquire high-fidelity 3D geometries via laser scanning and multiview stereophotogrammetry, respectively. According to their surface colors and degradation status, these target ballast particles are categorized into four groups: (1) Gray; (2) White; (3) Red New; and (4) Red Degraded. The experiment was conducted in two configurations within a 0.6 × 0.45 m testbed to evaluate the model under different scenarios.
Isolated configuration. Target particles were arranged with no interparticle contact to assess the model’s baseline performance on individual, unobscured objects (Figure 19).
Clustered configuration. To simulate a more realistic ballast assembly, a substrate layer of background particles was first placed in the testbed. Target particles were positioned on top of this substrate in a dense, clustered arrangement with partial occlusions (Figure 20).
For each configuration, the BSV acquired image sequences along a linear trajectory, mimicking data collection over a railway shoulder in the field. Following the proposed deep learning-based pipeline for 3D ballast analysis, these sequences were subsequently processed using Agisoft Metashape to reconstruct a 3D point cloud of the scene. Then, these point clouds were fed into the trained segmentation and completion models. Finally, the size and shape properties of the completed point cloud will be calculated and compared with the ground-truth shape in the established particle repository to validate the accuracy.
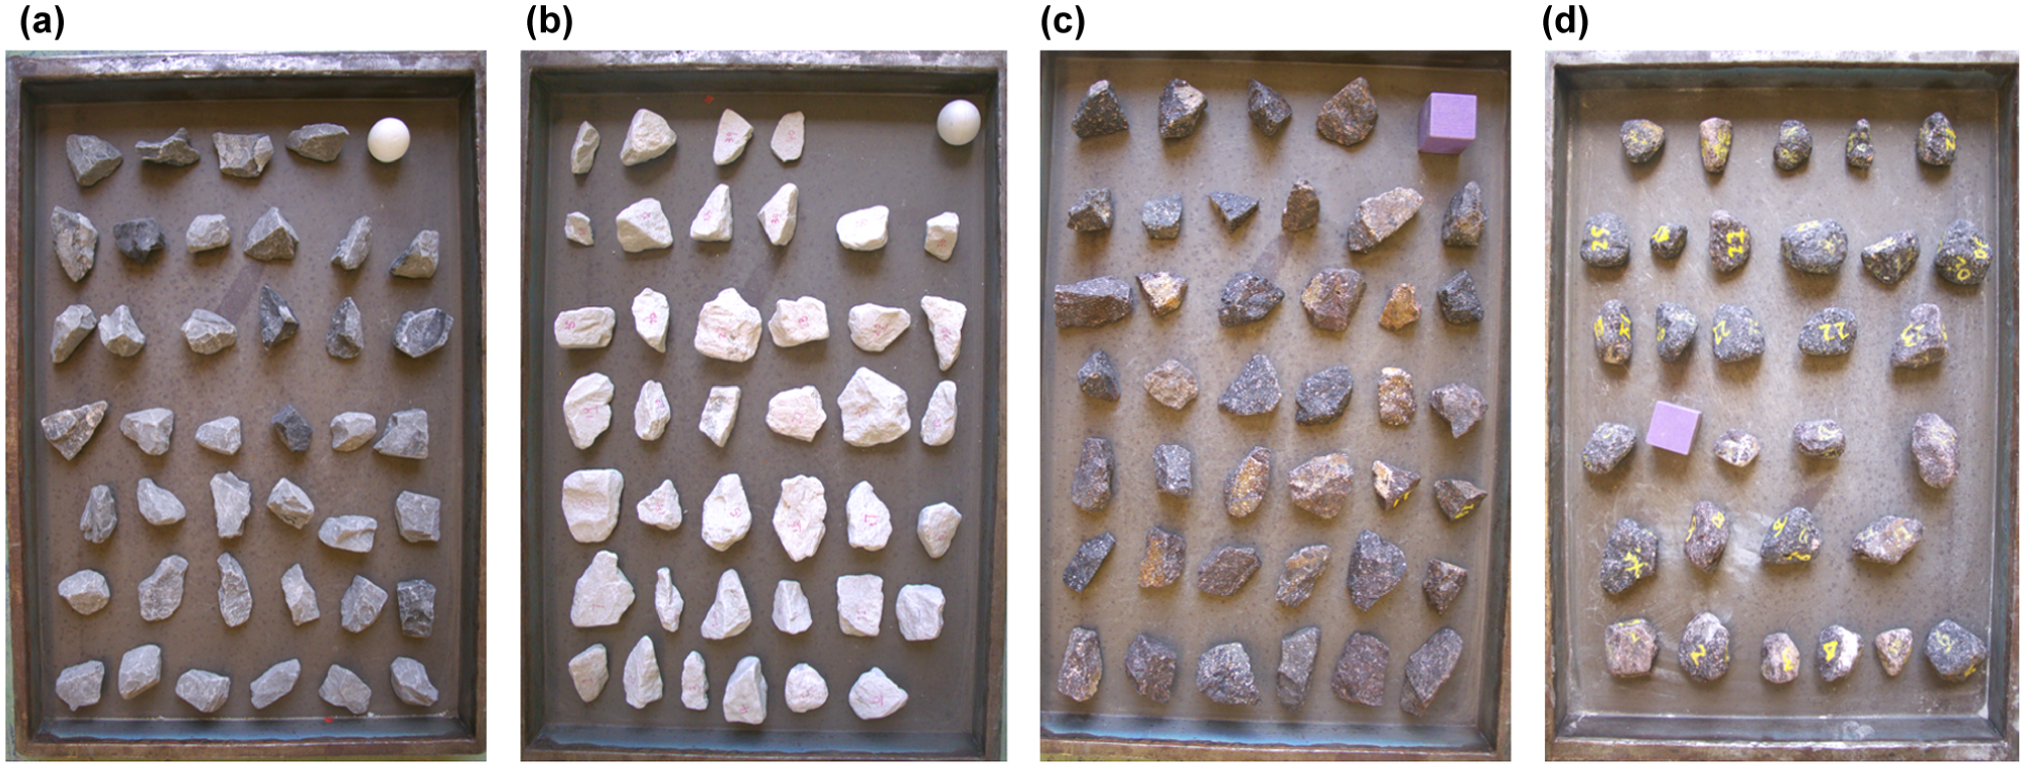
Isolated configuration for laboratory validation: (a) 40 Gray new ballast particles; (b) 40 White new ballast particles; (c) 40 Red New ballast particles; and (d) 30 Red Degraded ballast particles.
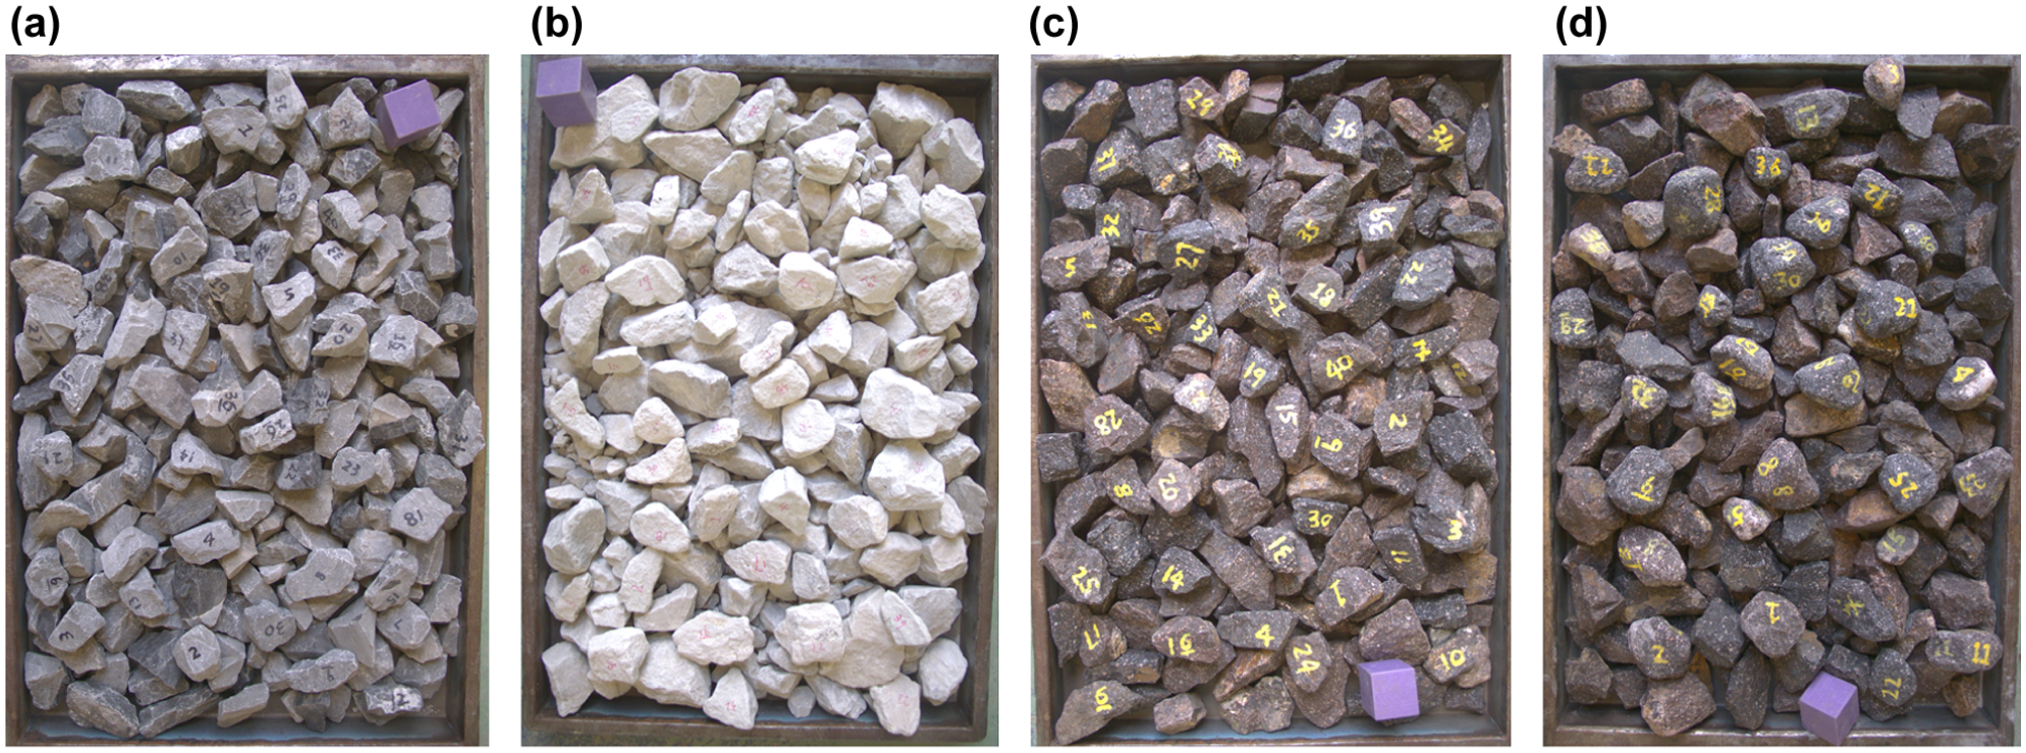
Clustered configuration for laboratory validation: (a) 40 Gray new ballast particles; (b) 40 White new ballast particles; (c) 40 Red New ballast particles; and (d) 30 Red Degraded ballast particles.
Figures 21 and 22 show how the proposed segmentation and completion pipeline was applied in the validation tests, illustrating how individual target ballast particles were segmented from their reconstructed point clouds of isolated and clustered configurations, and how their completed shapes were obtained. For the clustered configurations, an additional operation is required to manually extract the target ballast particles out of the segmentation results for quantitative evaluation (Figure 22, b and c ).
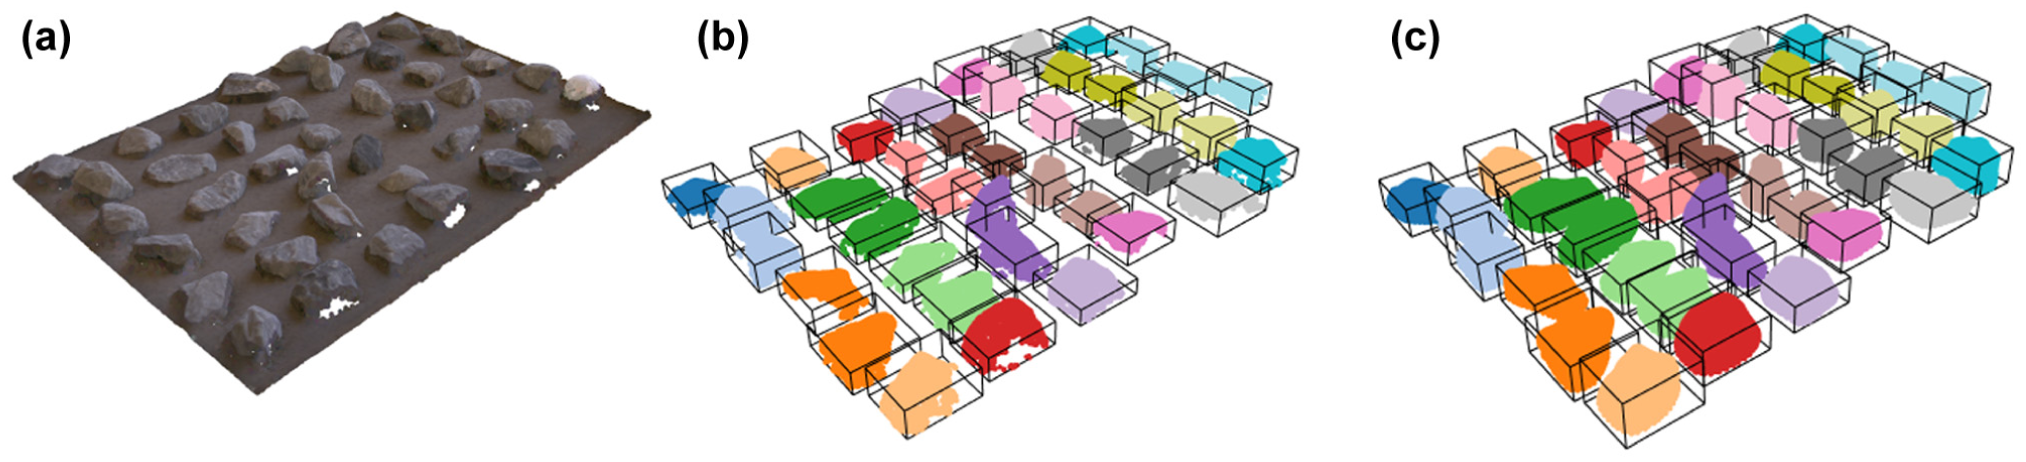
Visualization of proposed segmentation and completion pipeline on 40 isolated Gray new ballast particles: (a) reconstructed three-dimensional (3D) point cloud; (b) instance segmentation results identifying all 40 individual particles; and (c) completion results for all 40 ballast particles.
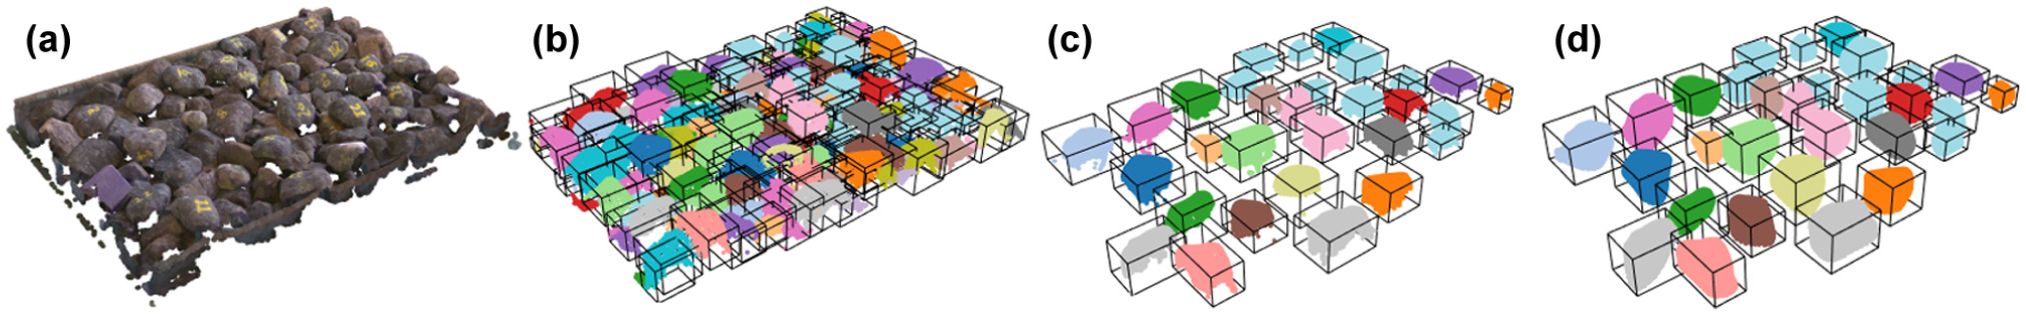
Visualization of the proposed segmentation and completion pipeline on 30 clustered Red Degraded ballast particles: (a) reconstructed three-dimensional (3D) point cloud; (b) initial instance segmentation results of all visible ballast particles; (c) manually isolated segmentation results of the 30 Red Degraded ballast particles; and (d) completion results for all 30 target ballast particles.
To assess model accuracy, predictions were compared from the proposed BallastAttN and baseline PointAttN models against the ground-truth data using nine key size and shape properties highly associated with ballast performance. Size properties include the shortest, intermediate, and longest dimensions, as well as the derived properties of equivalent spherical diameter, surface area, and volume. These fundamental metrics are essential for ballast material selection, determining the load-bearing capacity, packing density, and drainage characteristics of the ballast layer. Morphological properties that govern the mechanical stability of the track include sphericity (Sphericity3D), the 3D Flat and Elongated Ratio (FER3D), and the 3D Angularity Index (AI3D). All the size properties, Sphericity3D and FER3D, are calculated according to definitions and algorithms summarized in Huang’s study ( 23 ). The AI3D metric is calculated based on the optimal ellipsoid approximation algorithm proposed in Zhang and Huang’s ( 27 ) research. The reference AI3D values for sphere, hexahedron, and tetrahedron are approximately 0.01, 0.22, and 0.36, respectively. The primary error metric used is the mean absolute percentage error (MAPE).
Based on the results, the proposed BallastAttN model and the baseline PointAttN provide reasonable estimates of particle size and shape properties, validating that the segmentation and completion models function well under both configurations.
BallastAttN estimated nearly identical average SP for isolated (50.9%) and clustered (50.5%) ballast, with similar ranges. These results indicate that the isolated configuration is not simpler because particles must lie flat for stability, hiding large surfaces and causing severe occlusion.
For the isolated configuration (Figure 23), BallastAttN (solid circles [•]) made more accurate predictions than PointAttN (crosses [×]) across all size and shape metrics. Its predictions show a much lower MAPE and cluster more tightly around the ground-truth reference line, particularly for critical properties such as particle dimensions, volume, and FER3D. This performance gap between the proposed BallastAttN and the baseline PointAttN persists in the clustered configuration results (Figure 24).
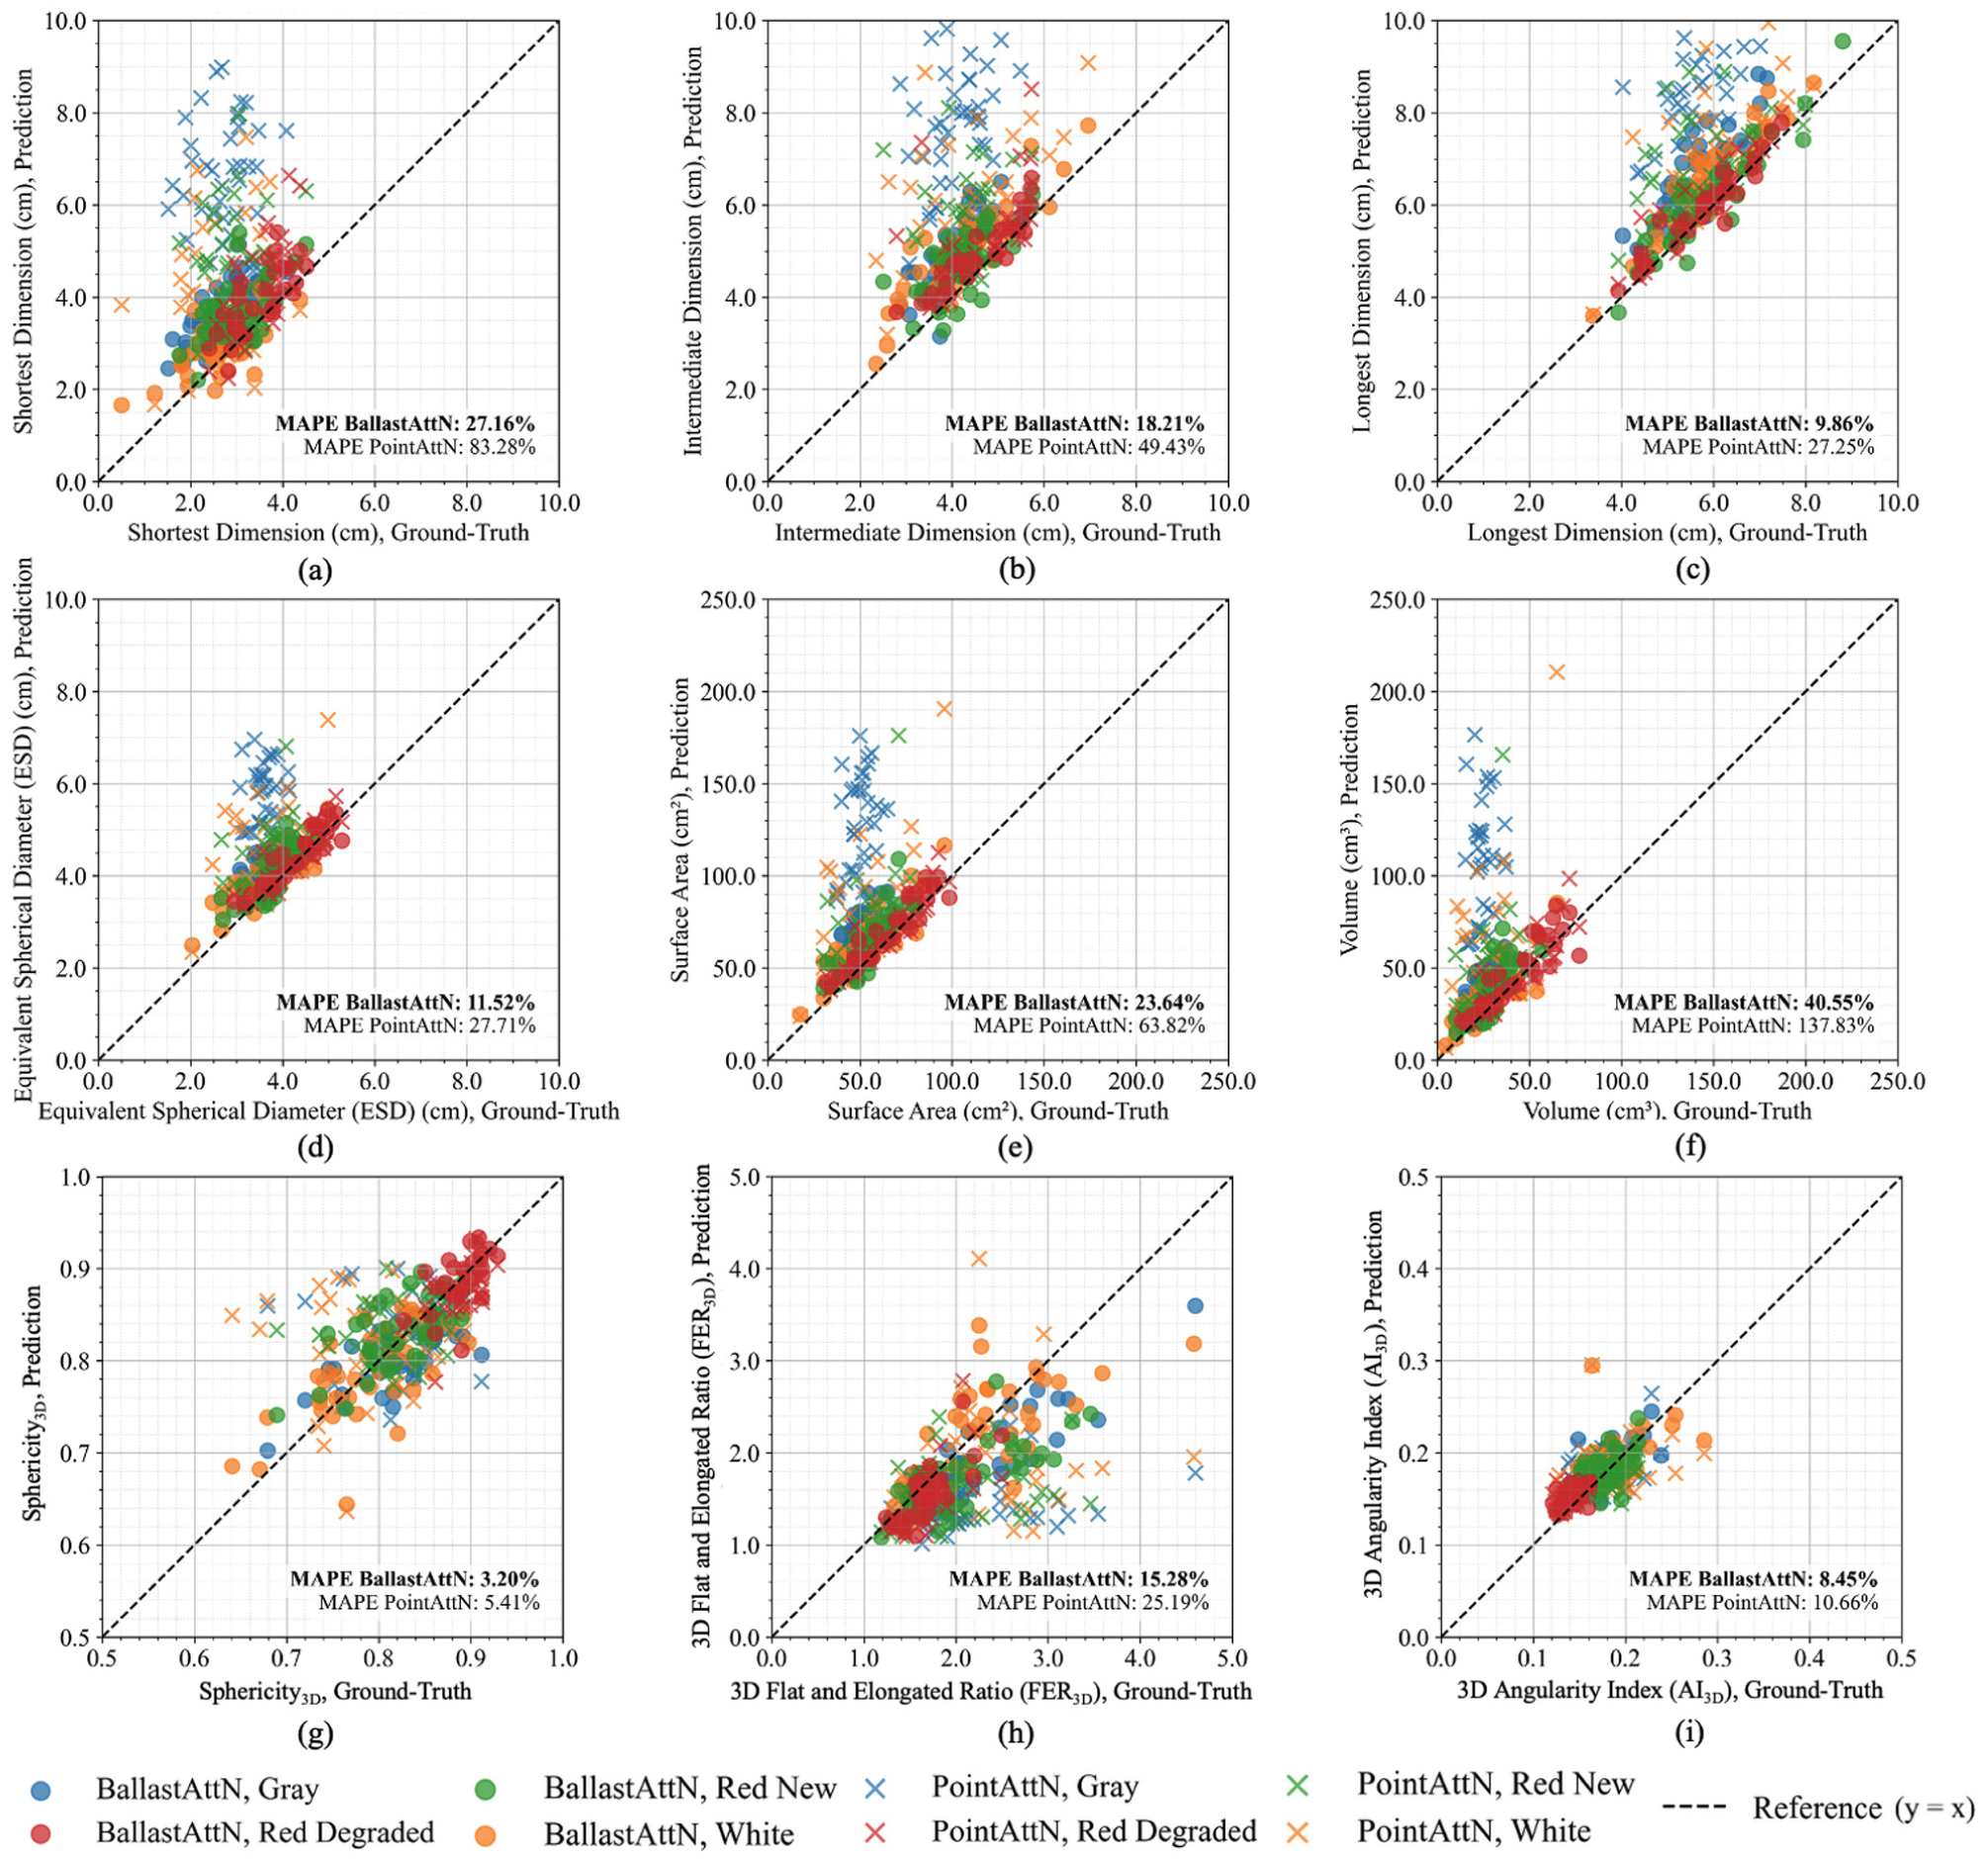
Evaluation results on the isolated laboratory test data. Estimated size and shape properties were compared between the proposed BallastAttN (solid circles [•]) and the baseline PointAttN models (crosses [×]). Subplots show comparisons of (a) shortest dimension, (b) intermediate dimension, (c) longest dimension, (d) Equivalent Spherical Diameter (ESD), (e) surface area, (f) volume, (g) sphericity, (h) 3D Flat and Elongated Ratio (FER3D), and (i) 3D Angularity Index (AI3D).
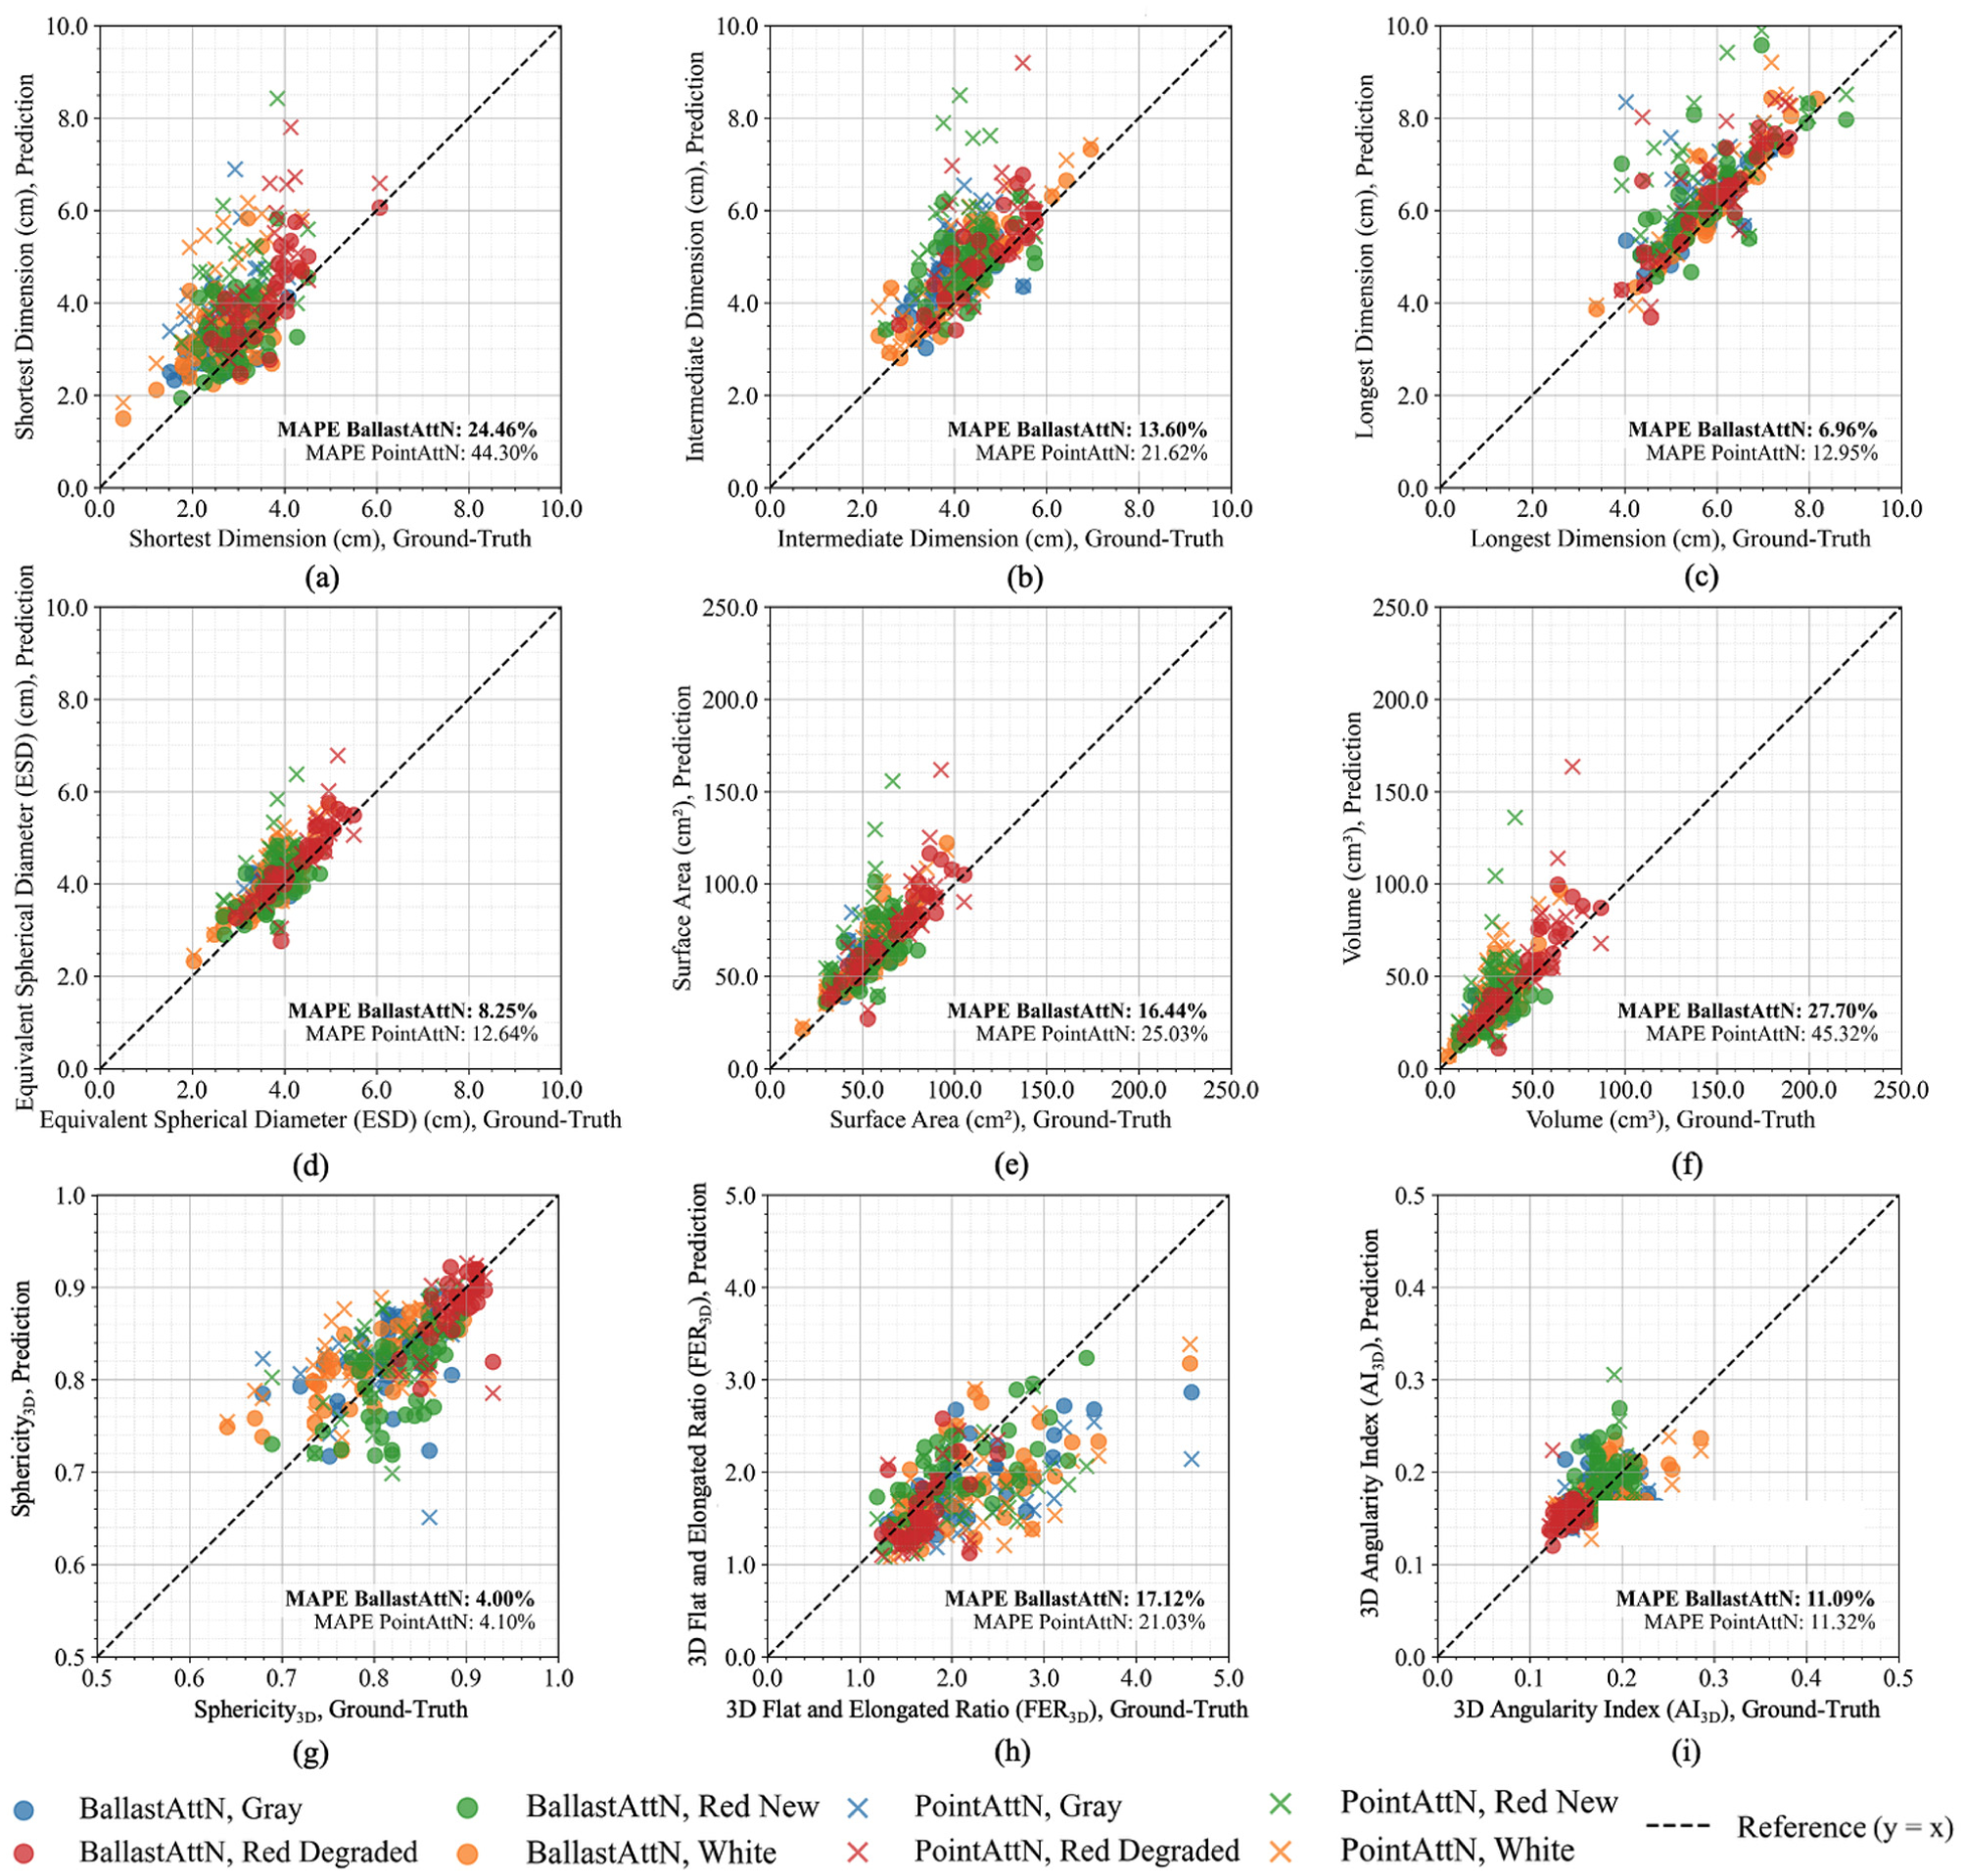
Evaluation results on the clustered laboratory test data. Estimated size and shape properties were compared between the proposed BallastAttN (solid circles [•]) and the baseline PointAttN model (crosses [×]). Subplots show comparisons of (a) shortest dimension, (b) intermediate dimension, (c) longest dimension, (d) Equivalent Spherical Diameter (ESD), (e) surface area, (f) volume, (g) sphericity, (h) 3D Flat and Elongated Ratio (FER3D), and (i) 3D Angularity Index (AI3D).
From the data points shown in Figures 23 and 24, a trend emerges when comparing the Red Degraded particles (red) to the other new particles (other colors). The degraded particles consistently exhibit lower AI3D and FER3D values and higher Sphericity3D values in Figures 23 and 24. For example, in Figure 24, the Red Degraded particles cluster around an AI3D value of approximately 0.15, compared with 0.18–0.19 for other new particles, and a FER3D value of about 1.57 versus 1.88–1.97 for new ballast. Similarly, the sphericity values of Red Degraded particles increase to around 0.88 compared with 0.80–0.82 for new particles. This aligns perfectly with the physical process of degradation, where abrasion wears down the sharp, angular corners of new ballast, making the particles worn, more rounded, and less angular over time. Since the predictions accurately capture these distinct morphological signatures, the proposed 3D ballast analysis pipeline proves its potential to be an effective tool for identifying the state of ballast degradation.
Conclusions and Recommendations
This study successfully developed and validated a novel deep learning-based pipeline for the comprehensive 3D characterization of railway ballast, overcoming the limitations of traditional 2D analysis and existing 3D methods for large-sized aggregates. By creating a synthetic data set from high-fidelity 3D geometries of real ballast particles in various levels of degradation, a robust segmentation model and a new, highly effective completion model, BallastAttN, were trained and validated. BallastAttN was specifically designed to address the severe occlusion common in densely packed ballast layers. The key findings of this research study are as follows.
The proposed BallastAttN model demonstrates a strong improvement in accuracy over the baseline PointAttN model, delivering significantly lower error across nine critical size and morphological properties.
The performance advantage of BallastAttN is pronounced in isolated and cluttered configurations with heavy occlusion, validating its architectural innovations and its suitability for various testing scenarios and practical field applications.
The pipeline can accurately predict key morphological indices, such as the AI3D and FER3D, which are vital for assessing the mechanical stability and health of the ballast layer. The resulting property estimates form clearly separated clusters for new and degraded ballast, demonstrating that the proposed method provides sufficiently precise and discriminative predictions to reliably distinguish between new and degraded ballast particles, offering a powerful new tool for automated railroad ballast maintenance and degradation monitoring.
The overall robustness of the proposed pipeline is demonstrated across diverse testing conditions; it is acknowledged that certain morphological metrics exhibit comparatively larger errors. Such a limitation indicates the room for further augmenting the data set and training more reliable and accurate 3D segmentation and completion models.
Based on these outcomes, several directions for future work are recommended. First, the field deployment of this pipeline can be implemented by integrating it with the BSV for large-scale, automated ballast inspections. In practice, the BSV can be coordinated with ballast regulators or shoulder ballast cleaners to temporarily expose deeper ballast layers ( 28 ). This facilitates the proposed 3D characterization of the subsurface profile, extending analysis beyond the immediate surface layer. To further improve model robustness and support fouling assessment, the 3D digital repository can be expanded to include additional ballast types, particles exhibiting a wider range of degradation conditions, wet ballast particles, and, eventually, naturally degraded ballast collected from field sites, along with representative fouling materials. The resulting quantitative size and shape properties can then be leveraged to optimize maintenance schedules. Although the current work does not model fouling materials smaller than the ⅜ in. (9.5 mm) sieve size, the completed 3D particle geometry provides a structural framework within which fouling accumulation could be inferred. For example, by combining the reconstructed surface with segmentation results of the coarse ballast particles, regions of the bed probably occupied by fouling can be estimated based on reductions in interparticle voids. Finally, the models can be optimized for quality and efficiency, such as supporting real time processing on edge devices to provide inspectors with immediate feedback during field surveys.
Footnotes
Acknowledgements
Special thanks are extended to visiting scholar Dr. Dongsoo Lee for his essential assistance with the laboratory testing.
Author Contributions
The authors confirm contributions to the paper as follows: study conception and design: Erol Tutumluer, Kelin Ding, Qijia Fan; data collection: Kelin Ding, Qijia Fan; analysis and interpretation of results: Kelin Ding, Qijia Fan, Erol Tutumluer; draft manuscript preparation: Kelin Ding, Qijia Fan, Erol Tutumluer. All authors reviewed the results and approved the final version of the manuscript.
Declaration of Conflicting Interests
The authors declared the following potential conflicts of interest with respect to the research, authorship, and/or publication of this article: Erol Tutumluer is a member of Transportation Research Record’s Editorial Board. All other authors declared no potential conflicts of interest with respect to the research, authorship, and/or publication of this article.
Funding
The authors disclosed receipt of the following financial support for the research, authorship, and/or publication of this article: This research was supported by the National University Rail Center of Excellence (NURail CoE), a US Federal Railroad Administration-funded research center headquartered at the University of Illinois Urbana-Champaign and administered by the Rail Transportation and Engineering Center (Grant 69A36524520020RRDIL). The authors gratefully acknowledge this support.