
Abstract
Amid global climate mitigation efforts, China’s road transportation sector faces escalating tensions between persistent transportation scale growth and stringent decarbonization commitments. Existing studies have shown that efficiency improvement—defined as the ability to maximize transport output while minimizing resource inputs and reducing undesirable outputs—is one of the important means to achieve carbon emission reduction. However, the quantitative contributions of efficiency improvement in the change of road transport carbon emissions (RTC) still lack a systematic evaluation. This study pioneers an efficiency-biased production-theoretical decomposition analysis framework to investigate the role of efficiency in RTC changes across 30 Chinese provinces during 2010–2020. Key empirical findings include: (1) total factor production efficiency (TFPE) in road transportation increased from 2010 to 2018 but receded amid the pandemic, exhibiting regional disparities—the eastern region registered the lowest TFPE (e.g., Beijing and Shanghai < 0.6), whereas the central region (e.g., Hebei = 1) achieved optimal performance; (2) the expansion of the transportation scale constituted the principal impetus for RTC escalation, while potential energy intensity and TFPE emerged as key mitigating forces—among factor-specific efficiency effects, except for transport output biased efficiency effect, other factor-biased efficiency effects all contributed to reducing RTC; and (3) the potential for efficiency-driven emission reduction varied by region—capital-biased efficiency predominated in the west (32.9% annual average), labor-biased efficiency in the east (33.4%), while energy and carbon-biased efficiencies exhibited limited potential because of technological entrenchment. These results emphasize the need for region-specific policies: western China should prioritize green infrastructure upgrades, while eastern regions should leverage intelligent transport systems and labor training. The findings provide empirical support for optimizing emission control frameworks and inform strategies to harness efficiency potential for achieving China’s dual carbon goals.
Keywords
Introduction
As the world’s largest developing country, China has achieved remarkable performance in economic development, but this prolific development with high inputs and emissions has led to excessive energy consumption, which has resulted in high carbon emissions ( 1 , 2 ). As a result of its strong dependence on energy consumption, the transportation industry is a main source of carbon emissions ( 3 ). In 2023, China’s transportation sector emitted over 930 Mt of carbon dioxide, approximating Japan’s national emissions in the same year ( 4 ). Notably, road transportation carbon emissions (RTC) accounted for over 80% of the sector’s total ( 5 ), demonstrating its predominant role in transportation-related carbon emissions. According to the National Bureau of Statistics of China, China’s vehicle population has grown remarkably, from 154 million in 2014 to 336 million in 2023 ( 6 ). However, with a vehicle ownership rate of 234 per thousand people in 2023, China still trails developed economies (600–900 per thousand), suggesting substantial untapped market potential ( 7 , 8 ). This growing trend underscores the critical importance of accelerating low-carbon transition in road transport for achieving China’s dual carbon objectives (“2030 Carbon Peak and 2060 Carbon Neutrality”).
The decarbonization of road transport primarily centers on curbing fossil fuel dependency within the transportation sector. The adoption of alternative energy sources ( 9 ) and the enhancement of system efficiency ( 10 ) constitute the primary avenues for reducing fossil fuel consumption in road transport. Accordingly, two targeted solutions include the promotion of new energy vehicles (NEV) ( 11 ) as well as improving efficiency to lower demand ( 12 ). However, battery technology, infrastructure support, and financial barriers have limited the adoption of NEV ( 13 , 14 ). Currently, China’s NEV stock reached 31.40 million in 2024, representing merely 8.90% of total vehicle registrations ( 6 ). This limited market penetration underscores the necessity for efficiency enhancements during the protracted NEV adoption phase.
Enhancing efficiency in road traffic involves optimizing synergies among system elements to maximize transport output while minimizing resource input ( 15 ). Multidimensional performance indicators relating to input and output factors demonstrate direct and indirect correlations with carbon emissions ( 16 ). Specifically, improved input (undesirable output) efficiency directly reduces energy consumption (carbon emissions) per unit transport. For example, some developed countries (e.g., Singapore and Japan) have enhanced their intelligent transportation system to integrate traffic network data from expressways and national highways ( 17 ). By leveraging big data analytics to adjust traffic light timings in real time, they have effectively mitigated traffic congestion and reduced inefficient energy consumption ( 18 , 19 ). Moreover, output efficiency optimization dilutes carbon intensity by boosting transport turnover. California’s high-occupancy vehicle lane policy, promoting carpooling, significantly reduced per-passenger RTC ( 20 ). These offer both theoretical foundations and practical approaches for constructing an “efficiency-driven” low-carbon transportation system.
However, existing studies predominantly focus on energy efficiency as a driver of RTC ( 5 ), yet critically neglect the efficiency dynamics of nonenergy input/output factors (e.g., capital, labor, and transportation volume). This leads to overestimation or underestimation of the actual RTC impact of transportation systems by ignoring other emission reduction pathways, resulting in policy deviations. Meanwhile, China’s vast territory and uneven resource endowments have resulted in pronounced heterogeneity across regions. Such disparities result in significant heterogeneity in road traffic efficiency and RTC reduction pathways ( 21 ). For example, from a capital allocation efficiency perspective, the eastern region attracts quality capital for road transport via its economic edge, forming a “capital-technology-efficiency” virtuous cycle—for example, intelligent transportation systems ( 22 , 23 ). By contrast, central-western regions concentrate capital investment on infrastructure gaps (e.g., highways) because of lower capital returns, leading to diminishing marginal benefits ( 24 ).
Such efficiency divergences among factors necessitate targeted policies to address RTC reduction across regions. Accurately identifying the bias of representative input–output factors, tracking efficiency changes, and quantifying their impacts on carbon emissions as well as associated reduction potential will provide both theoretical underpinnings and practical pathways for building an “efficiency-driven” low-carbon road transportation system.
To identify the impact of efficiency changes in key input–output factors on RTC, this study constructed an efficiency-biased production-theoretical decomposition approach (EB-PDA) framework. The EB-PDA model is applied to empirically examine the RTC change for China’s 30 regions during the period 2001–2020. The results show that the expansion of the transportation scale constituted the principal impetus for RTC escalation, while potential energy intensity and total factor production efficiency (TFPE) emerged as key mitigating forces. Apart from output-biased efficiency change, which increases RTC, biased efficiency changes related to all other factors contribute to its reduction. Notably, capital and labor-biased efficiency changes exhibit the greatest potential for reducing emissions.
The rest of this study is structured as follows. The next section reviews the relative studies, follows by a section describing the newly built methodology. Section 4 describes the data source and data treatment, giving a practical basis for the empirical study. A section presenting the results and discussions pays particular emphasis on efficiency evaluation, key influencing factors identification, and carbon reduction potential discussion. The final section summarizes the major findings and policy implications.
Literature Review
Road Transportation Efficiency Evaluation
Efficiency, in this context, refers to the ability of a decision-making unit (DMU) to maximize outputs while minimizing inputs, considering the specific inputs and outputs related to road transportation. Inefficient DMUs fail to make the most of their resources, even though they have the potential to use resources more efficiently. The data envelopment analysis (DEA) model has been considered as an effective tool for evaluating different aspects of the road transport, such as road safety, third-party logistics companies, and low-carbon transportation. Representatively, Chen et al. ( 25 ) proposed an extended DEA to measure the variable-specific technical inefficiency and the corresponding productivity change of the road transport sector during 2006–2015 in China. This approach facilitates targeted performance improvements by highlighting specific input factors that require optimization.
Malmquist productivity index and Luenberger productivity index are DEA-based methods that highlight the efficiency and technological changes of DMUs over a defined time frame. To incorporate undesirable outputs, the Malmquist–Luenberger (ML) index was developed as an extension of the Malmquist index, thus providing a suitable tool for measuring dynamic environmental productivity changes. The ML index has found widespread application in empirical research within the transport field. For carbon emissions, Liu et al. ( 26 ) employed the ML index to evaluate the green productivity growth of road transportation sector at the provincial level.
Significant progress has been made in evaluating the performance of the road transport sector. However, existing evaluation frameworks remain limited in scope, as most studies concentrate primarily on measuring total factor productivity or total factor energy (carbon) efficiency, while neglecting the systematic assessment of other critical nonenergy factors. This gap is particularly relevant in the context of China’s road transport sector, where interprovincial heterogeneity exists in resource endowments and factor allocation patterns. A systematic efficiency evaluation of key input–output factors can help to precisely identify regional strengths and weaknesses from a factor-oriented perspective, thereby providing a scientific basis for formulating targeted strategies to enhance total factor productivity.
Influencing Factor Analysis by PDA
Understanding the factors influencing RTC is vital to developing targeted and effective emission reduction strategies. To this end, the PDA method has proven valuable and is widely used in environmental research for factor decomposition analysis. Its core idea is to incorporate the technical efficiency of production factors into the Kaya identity, thereby evaluating the impact of production technology-related factors, potential factors, as well as efficiency factors. In recent years, to address specific problems or adapt to particular scenarios, scholars have extensively extended the method ( 27 ). Table 1 summarizes representative studies applying PDA to influencing factor analysis.
Representative Studies on Influencing Factors of Carbon Emissions by PDA Method
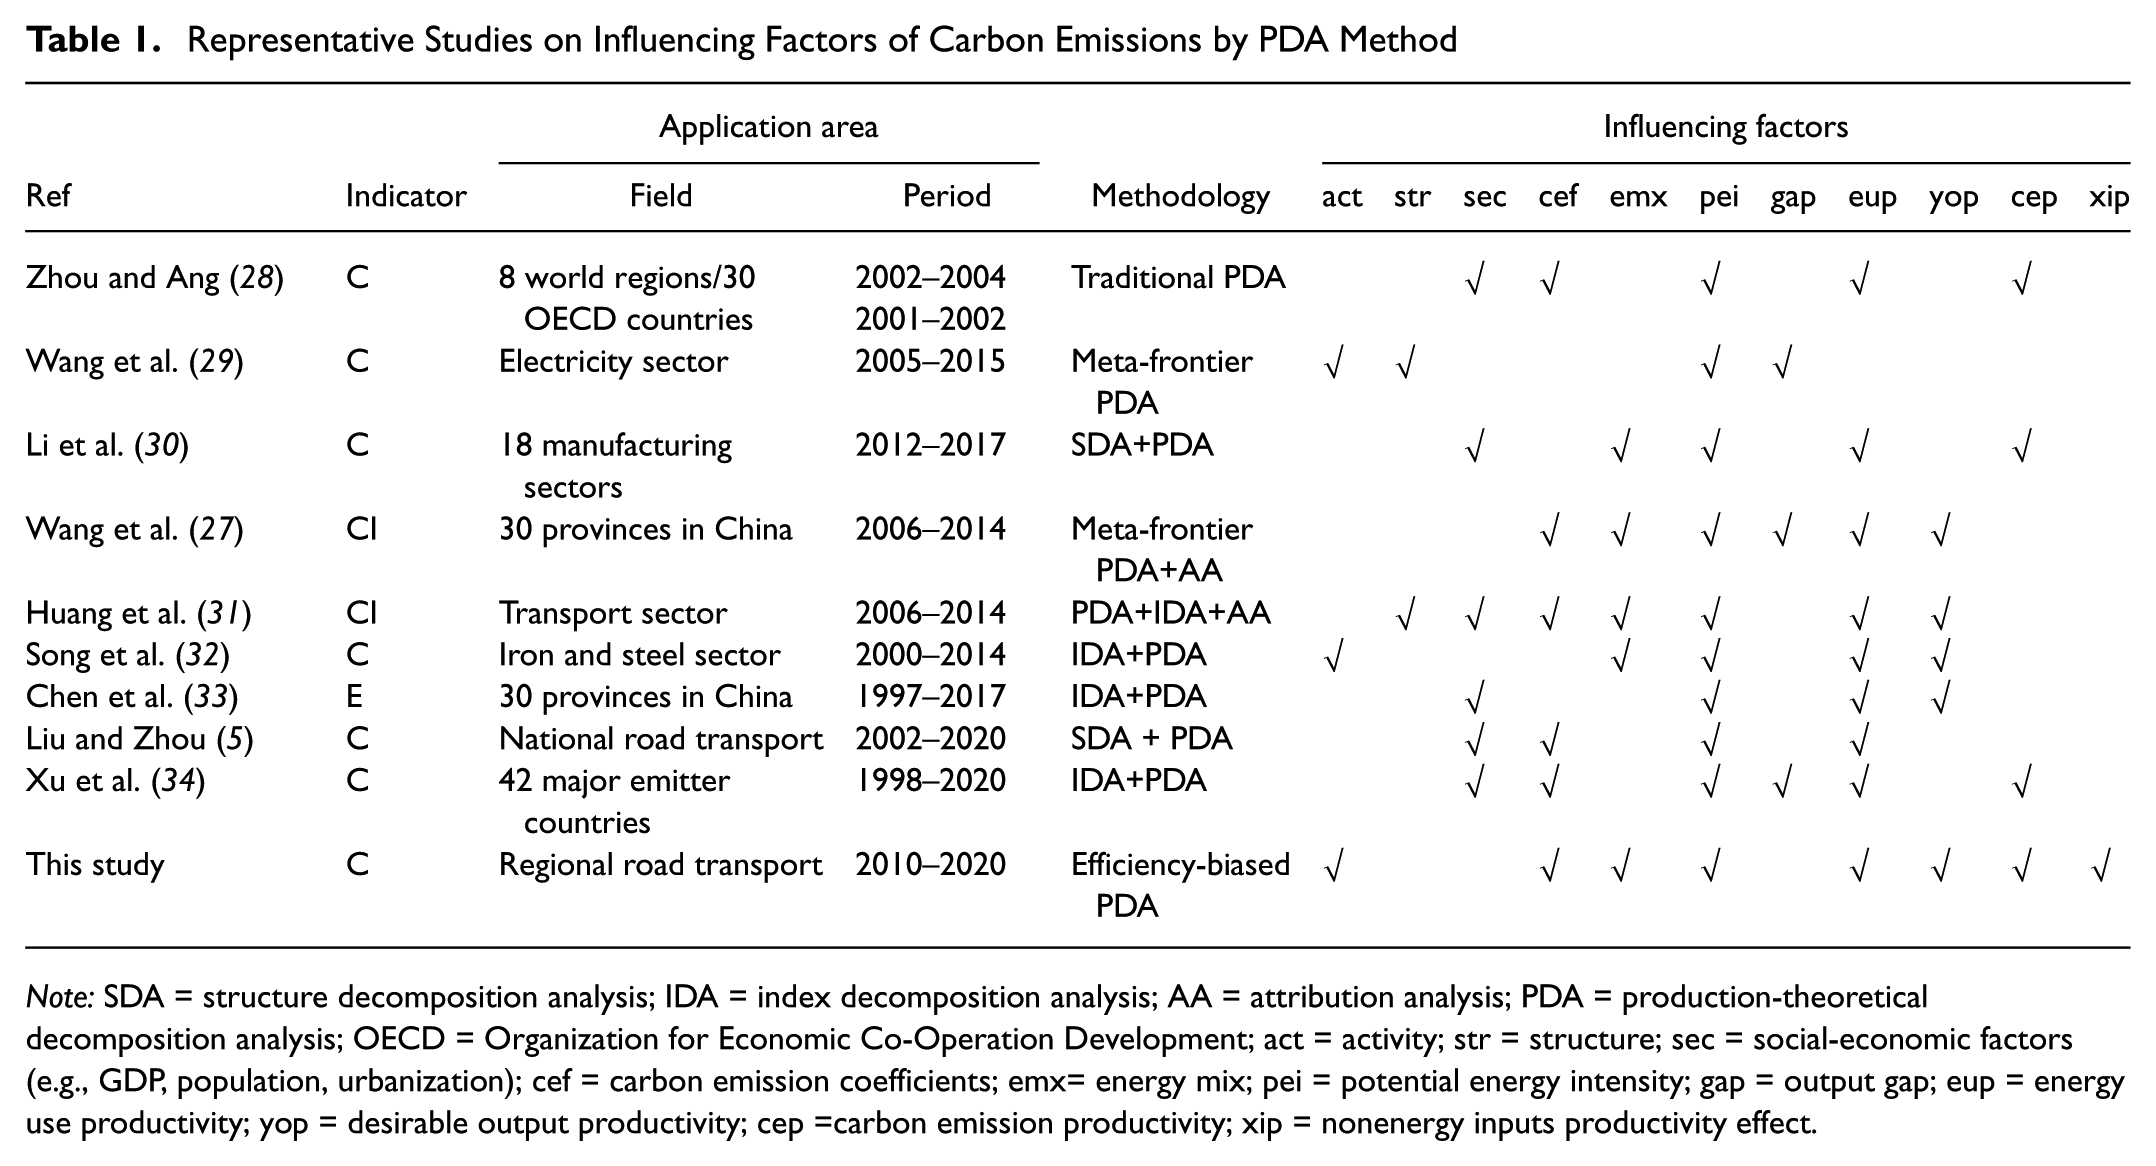
Note: SDA = structure decomposition analysis; IDA = index decomposition analysis; AA = attribution analysis; PDA = production-theoretical decomposition analysis; OECD = Organization for Economic Co-Operation Development; act = activity; str = structure; sec = social-economic factors (e.g., GDP, population, urbanization); cef = carbon emission coefficients; emx= energy mix; pei = potential energy intensity; gap = output gap; eup = energy use productivity; yop = desirable output productivity; cep =carbon emission productivity; xip = nonenergy inputs productivity effect.
In general, PDA extensions fall into two categories: integration with other decomposition methods and combination with specific efficiency evaluation models. Notably, PDA has been widely used to identify the drivers of transportation carbon emissions. Representatively, Liu and Zhou ( 5 ) developed an extended input–output framework integrated with PDA to identify the key drivers of changes in China’s RTC from a supply-demand synergy perspective. The results show that transitioning to low-carbon road transportation requires coordinated efforts across all economic sectors, which provides policymakers with guidance for integrating supply- and demand-side carbon reduction measures.
Overall, PDA results identify the core factors influencing transportation carbon emissions as energy structure, transportation planning, technological level, demand management, and external environment. These factors primarily focus on macroeconomic and social activities, as well as advances in energy conservation and emission reduction technologies, but neglect improvements in factor allocation efficiency within the input–output process. Notably, compared with macropolicy formulation and technological progress, promoting transportation carbon emission reduction by enhancing existing efficiency offers a more significant cost advantage. Therefore, focusing on the road transportation sector, it is necessary to develop a novel decomposition analysis framework, which needs to fulfill two core functions: first, identifying factor-biased efficiency changes; second, clarifying how these efficiency changes affect RTC. Ultimately, this holds great significance for achieving efficiency-driven green road transportation.
Reduction Measures and Potential of RTC
Against the rapid development of road transportation, research focusing on RTC reduction measures in recent years can be primarily categorized into three types: administrative control, economic incentives, and technological promotion.
Administrative control requires the establishment of strict rules and regulations, including rational planning standards, a rigorous motor vehicle access system, exhaust emission standards, and a supervision system. Sun et al. ( 35 ) pointed out that effectively strengthening coordination among various departments and eliminating vehicles that fail emission inspections can actively promote road transportation energy conservation. Economic measures can give full play to the role of economic levers. These measures include reducing purchase taxes on environmentally friendly vehicles to stimulate consumption, adjusting parking fees and congestion charges to restrict private car use, subsidizing buyers of alternative fuel vehicles, and implementing differential tax rates based on vehicle characteristics. In the field of technology, optimizing vehicle design is an effective emission reduction measure—for instance, improving vehicle energy efficiency and reducing driving resistance ( 36 ). Furthermore, the advancement of other technologies, such as intelligent transportation systems, can reduce travel demand and contribute significantly to mitigating emissions.
Focusing on the preceding three types reduction measures, many scholars have conducted research and achieved rich results. However, there remains a relative paucity of studies that quantitatively assess the emission reduction effects of these measures, limiting their ability to provide precise support for practical decision-making. Critically, in the road transportation sector, against the backdrop of current technological development, accurately identifying the emission reduction potential associated with efficiency improvements of different factors would provide a scientific basis for precisely grasping the key directions of emission reduction efforts and formulating more targeted emission reduction strategies in different regions.
Addressing the limitations of existing literature, this study investigates the role of efficiency in shaping carbon emissions within China’s road transport sector. The core contributions are summarized as follows. Theoretically, we have innovatively developed an EB-PDA method to analyze the influencing factors of RTC changes. Unlike conventional PDA approaches, the EB-PDA method overcomes the constraints in characterizing efficiency-related dynamics and establishes a structured analytical framework that elucidates how biased efficiency drive RTC evolution. This advancement allows for a more precise identification of the pathways through which efficiency disparities influence RTC variations. Empirically, focusing on China’s road transport sector, our analysis not only reveals the central role of efficiency in curbing RTC but also quantifies the potential and specific trajectories for emission reduction via efficiency gains. The findings offer actionable insights for policymakers, industry practitioners, and other stakeholders to design coordinated and effective strategies to mitigate RTC growth.
Methodology
This study aims to uncover the influencing factors of RTC changes through decomposition analysis, emphasizing the role of efficiency variations. The methodological framework mainly consists of three steps, as shown in Figure 1. First, according to the Kaya identity, RTC changes are decomposed into four factors by IDA method: emission factors effect, energy structure effect, energy intensity effect, and transportation scale effect. Secondly, we integrate traditional PDA method to refine energy intensity effect into potential energy intensity effect and total factor production efficiency (TFPE) effect. Thirdly, recognizing TFPE as a comprehensive measure of input–output factor efficiency, this study innovatively develops an efficiency-biased PDA method (EB-PDA), decomposing it further into five aspects: energy, capital, labor, transportation output, and carbon emission biased efficiencies, respectively. On completing the decomposition and identification of these efficiency factors, we explore their potential for emission reductions.
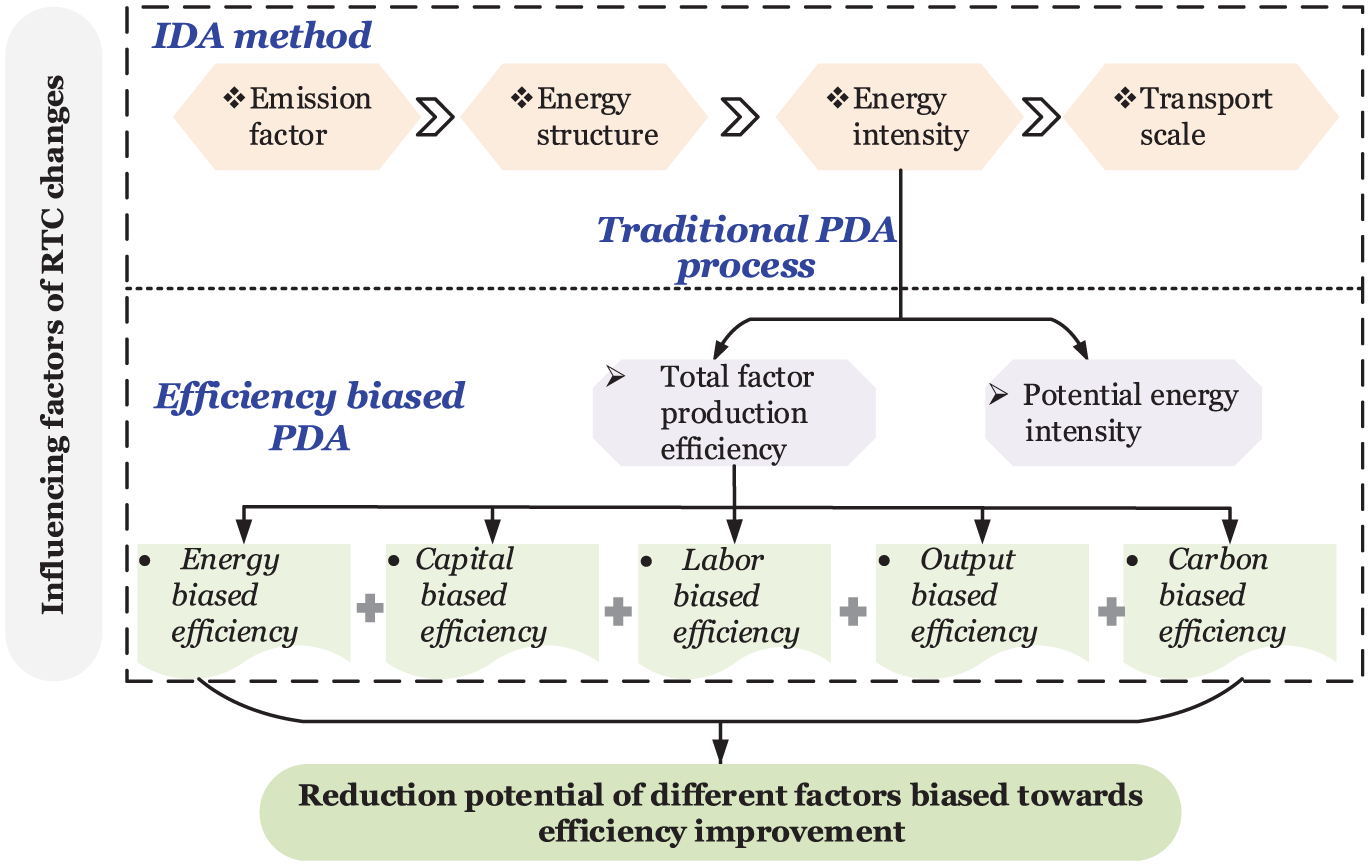
Methodological framework.
Influencing Factors of RTC by Index Decomposition Analysis Method
As a widely used method, Kaya identity has good properties such as time reversibility, factor reversibility, polymerization, and zero value robustness ( 37 ). Given that, the Kaya identity is applied to decompose RTC to identify the driving factors that come from transportation service production process. The i-th region’s RTC can be expressed as follows:
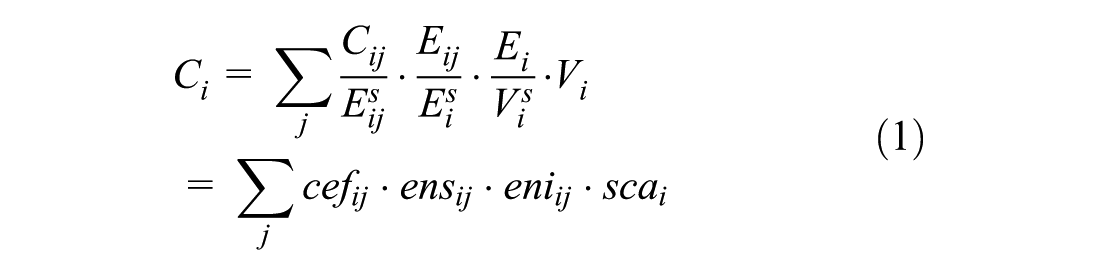
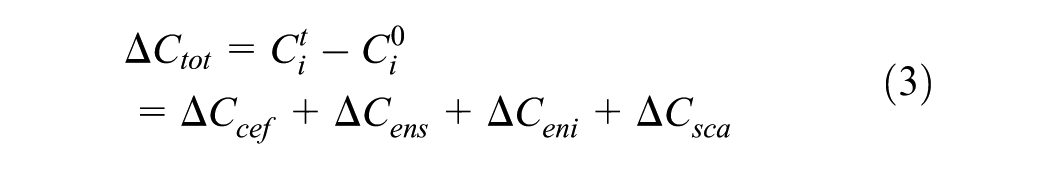
where cef, ens, eni, sca indicate carbon emission factor, energy structure, energy intensity, and transportation scale, respectively; i indicates the i-th province; j represents the j-th type of energy consumption in road transportation; C stands for RTC, E stands for road transportation energy consumption, and V stands for road transportation revenue ton kilometers. As such,
Thus, the change rate of RTC in the i-th region during the period of [0, t] can be decomposed as
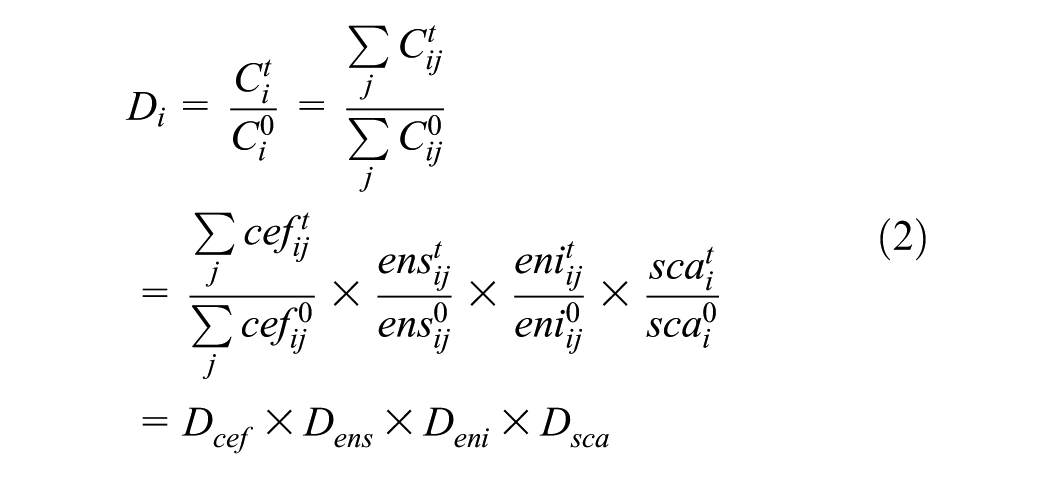
where
The IDA method is a commonly used approach to quantify the actual contribution of various factors to RTC changes. In relation to the IDA approach, the Laspeyres and arithmetic mean Divisia index (LMDI) have been widely used since 2000. LMDI’s advantages include its theoretical foundation, adaptivity, easy operation, and readability ( 27 ). Following Huang et al. ( 31 ), the LMDI additive decomposition model is used to decompose the influencing factors of the i-th region’s RTC in this study. Then, the decomposition in the base period and the reporting period is as follows:
where

The Traditional PDA Process
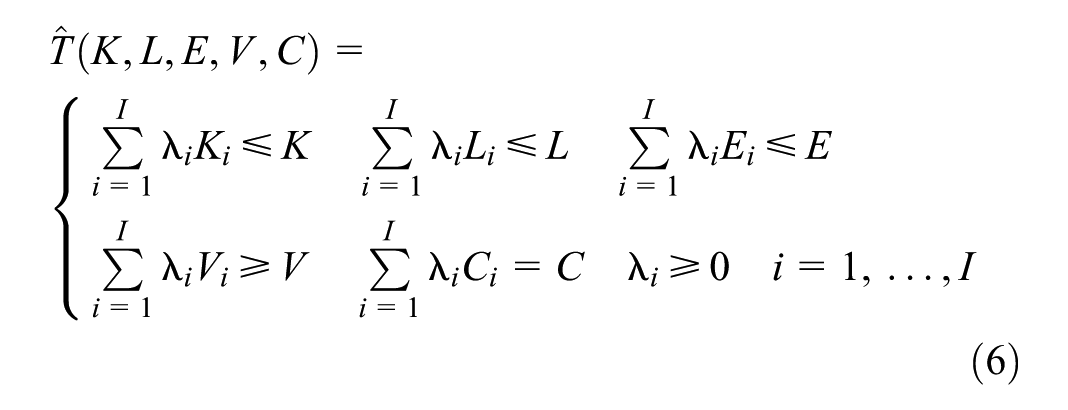
To further identify which factors drive the change for energy intensity, the PDA model was constructed. The traditional PDA framework is primarily built on the theories of environmental production technology (EPT) and distance functions. Following Wang et al. ( 27 ), DMUs use finite inputs to produce outputs. This study takes energy consumption (E), capital investment (K), and labor (L) as inputs. Using these inputs produce road transportation revenue ton kilometer as output (including both passenger and freight, V) to calculate the biased efficiency of different factors in different regions. In the process of providing transportation services, road traffic will inevitably produce carbon emissions, so we regard carbon emissions (C) as the undesirable output. As such, the production technology set (T) can be formulated as

where T is usually assumed to be a closed and bounded set. The production technology in Equation 1 can be defined as EPT. The EPT must satisfy the assumptions of traditional production theories, which include the closed set, convex set, and the strong disposability of input and desirable output (
38
). Further, the assumptions of weak disposability and null-jointness must be satisfied to characterize the EPT (
27
). Specifically, the weak disposability assumption recognizes that reducing undesirable outputs is not free; it can only be achieved by sacrificing a proportionate amount of desirable output: if
For an input–output combination (
where
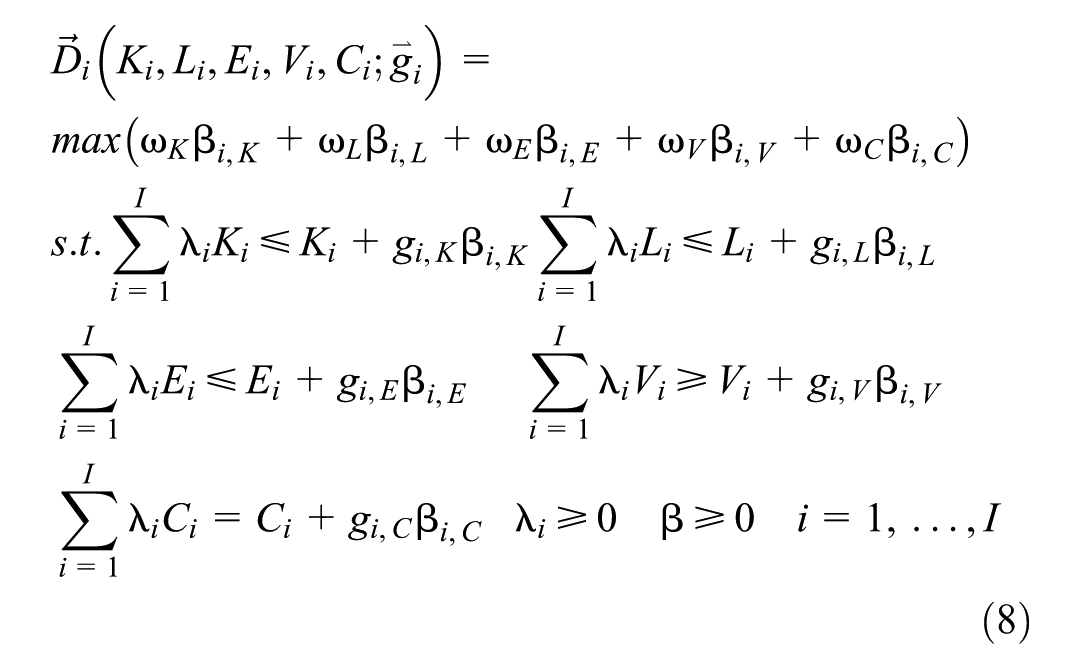
Compared with the directional distance function, the nonradial directional distance function (NDDF) allows the inputs and outputs to be adjusted nonproportionally. To quantify the specific improvement potential for each input and output and provide targeted guidance for efficiency optimization, according to Wang et al. ( 29 ), we employ the NDDF, as is shown in
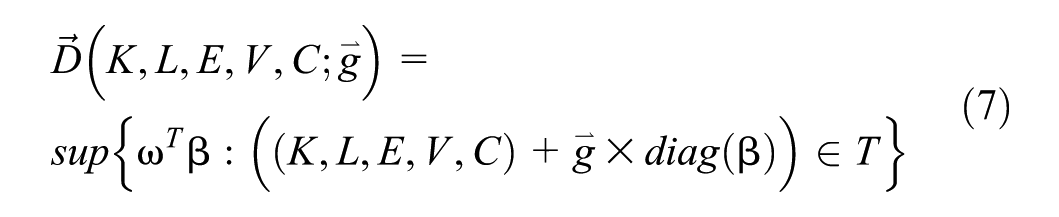
where
To avoid different efficiency scores because of the different weight vectors settings, following Zhang and Choi (
39
), the direction vector is set as
Based on this, the energy intensity changes of the i-th region during the period of [0, t] can be decomposed as
where
Efficiency-Biased PDA and Reduction Potential
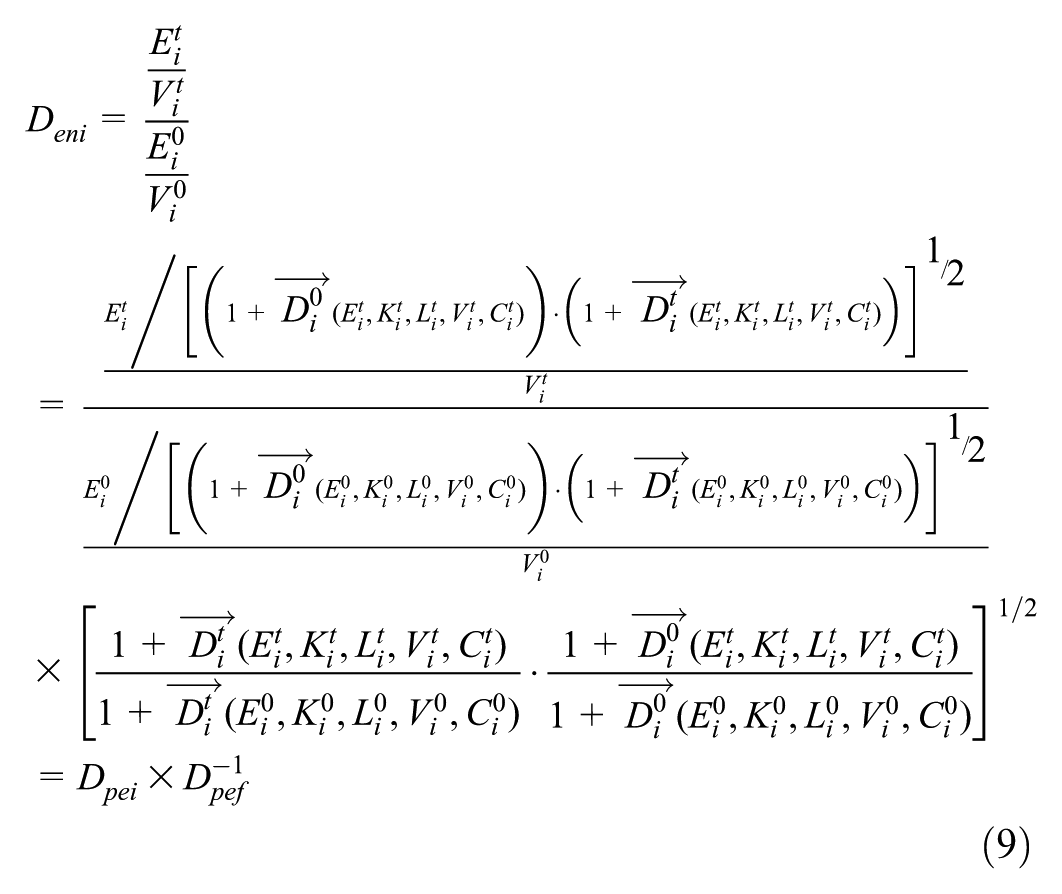
Recognizing that the efficiency change is nonneutral, the TFPE effect in Equation 9 can be further decomposed into measures of different biased efficiency terms. That is,
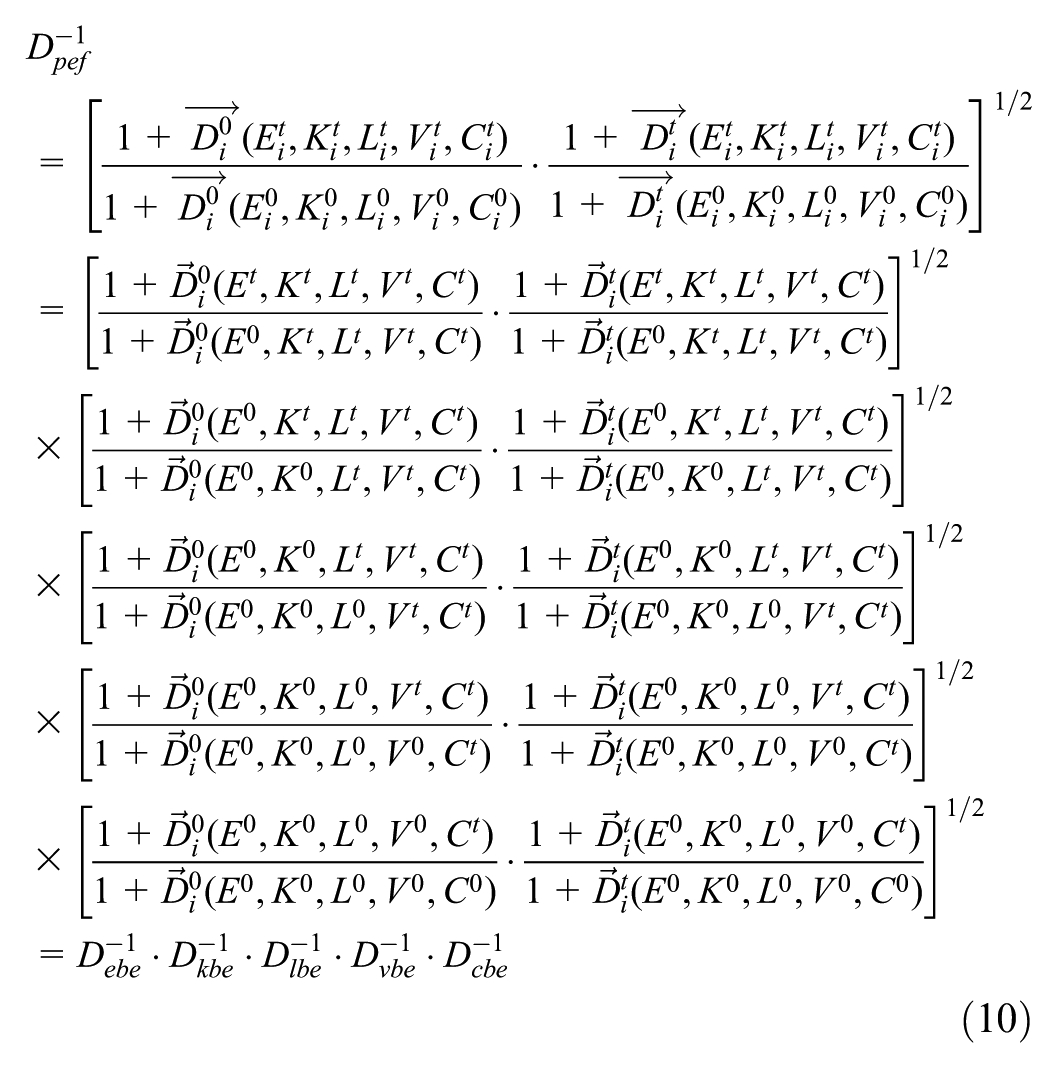
where
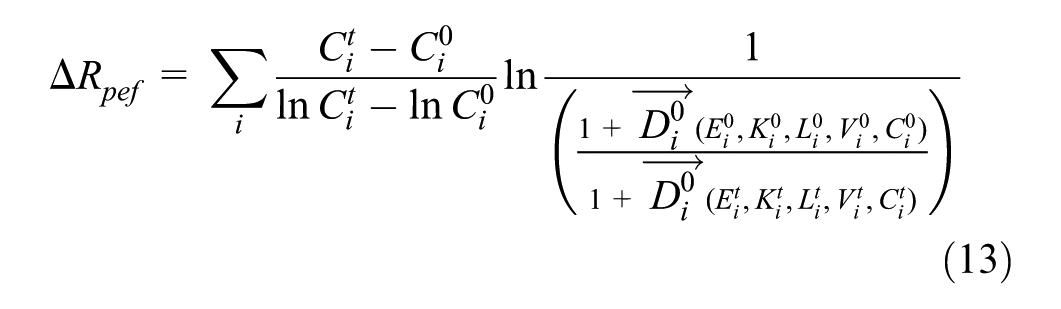
When combined with Equations 2, 9, and 10, the changes of RTC are attributed to nine influencing factors as
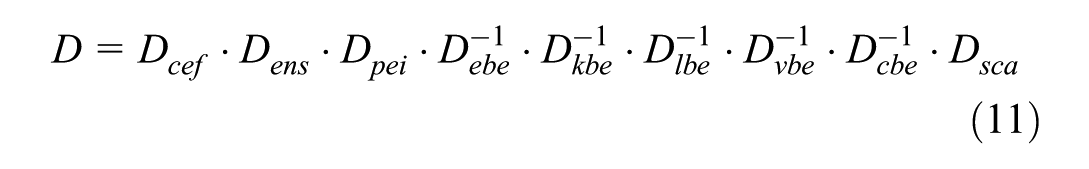
Then, the contribution of the preceding influencing factors to the change of RTC during the period of [0, t] is as follows:
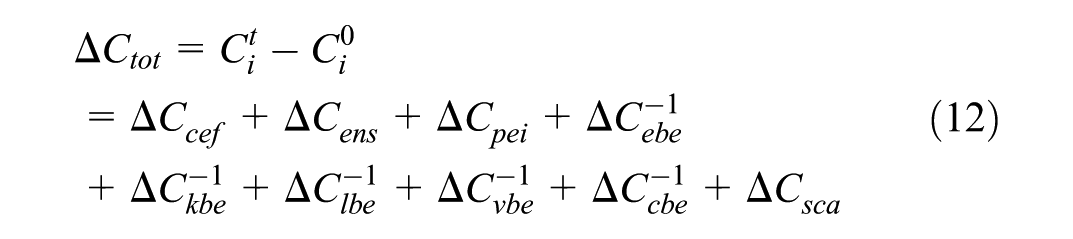
Referring to Equation 4, each factor in Equation 12 can be accurately calculated. Table 2 summarizes the factors and their economic connotations that govern RTC changes in Equations 11 and 12.
Influencing Factors of RTC and Their Connotations
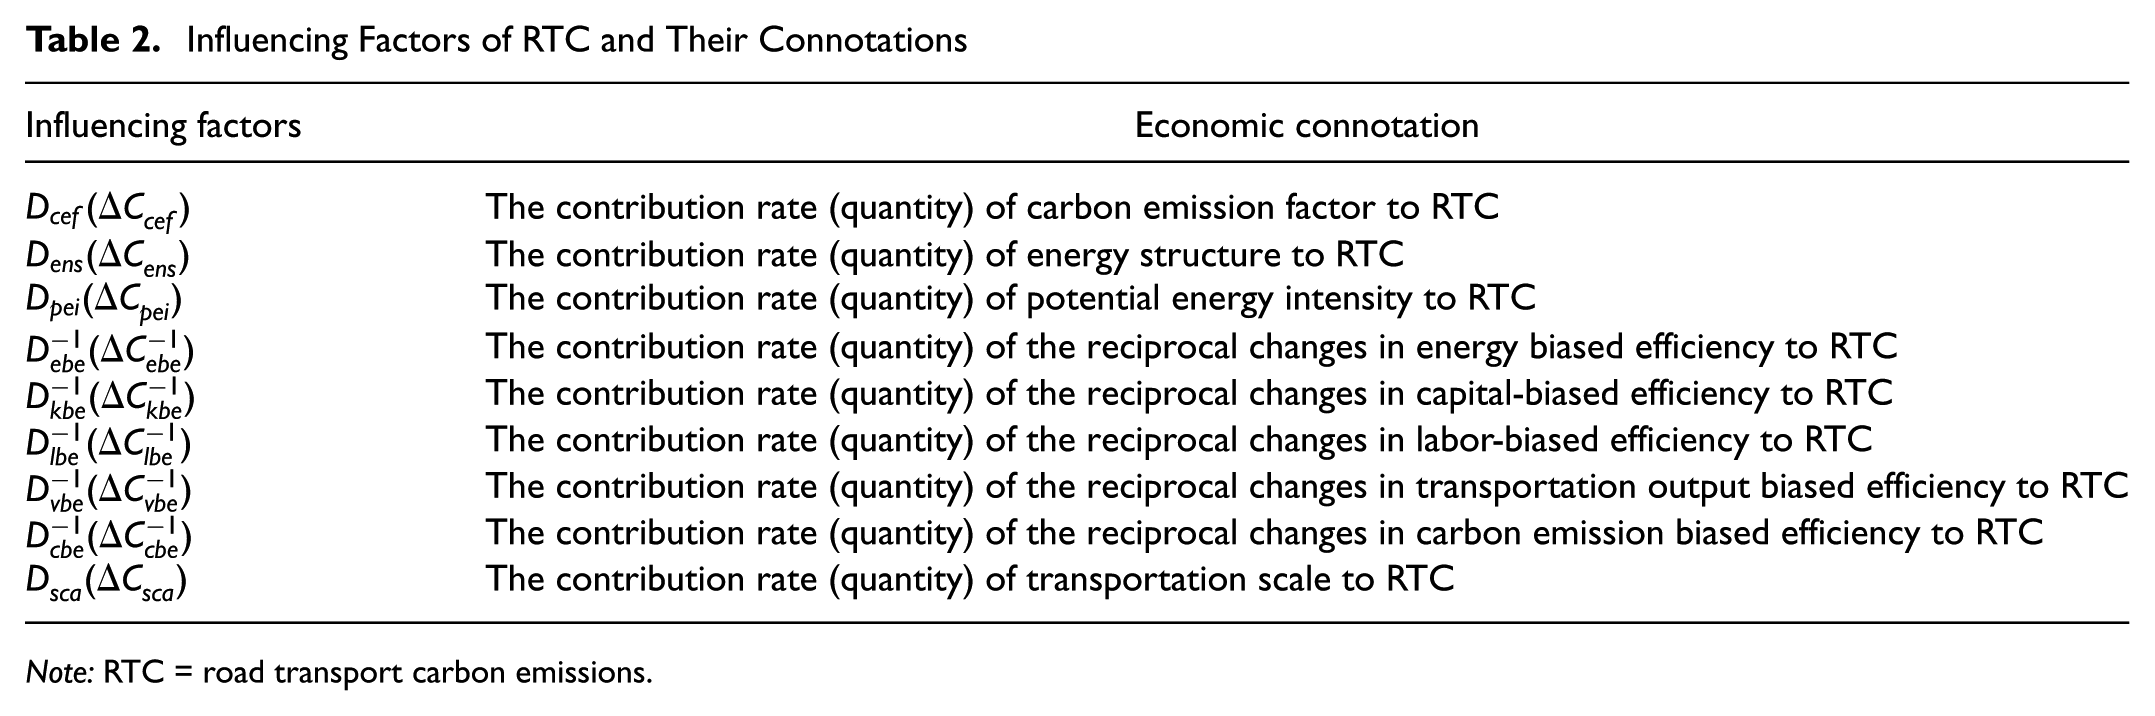
Note: RTC = road transport carbon emissions.
On this basis, we further identify the RTC reduction potential of TFPE and its specific biased efficiency improvement.
According to Equation 8,
Following the idea of Bian et al. (
40
), under the condition that all other factors remain unchanged—including the current level of technology and the scale of transportation—and assuming that all targeted input and output factors are operating efficiently (i.e.,
In particular, the reduction potential of
Data Description
During 2010–2020, China’s economy exhibited sustained rapid growth, driving substantial expansion in transportation infrastructure with particularly prominent development in road traffic. This economic trajectory renders the period strategically representative for analyzing RTC. Notably, the pandemic-induced emission reduction from late 2019 to 2020 provides an exceptional opportunity to investigate nontraffic-scale determinants of emission variations. Focusing on direct RTC from fossil fuel consumption, this study covers 30 provinces in China. Following the approach of Qi et al. ( 41 ) and Liu and Zhou ( 42 ), and considering regional differences in economic development, industrial structure, and policy orientation, these provinces are classified into three regions: the eastern region (Beijing, Tianjin, Hebei, Liaoning, Shanghai, Jiangsu, Zhejiang, Fujian, Shandong, Guangdong, Guangxi, Hainan), the central region (Shanxi, Inner Mongolia, Jilin, Heilongjiang, Anhui, Jiangxi, Henan, Hubei, Hunan), and the western region (Chongqing, Sichuan, Guizhou, Yunnan, Shaanxi, Gansu, Qinghai, Ningxia, Xinjiang).
To address the production process of China’s road transport sector, this study employs a set of input and output variables consistent with the established literature (e.g., Huang et al. [ 31 ]). Key parameters include three input indicators (capital, labor, and energy), one desirable output (transport scale), and one undesirable output (RTC). Among these, capital investment (K) was calculated using the perpetual inventory method. Following the idea of Liu and Lin ( 43 ), the transport scale (V) was calculated by integrating passenger turnover with freight turnover through a 10:1 conversion ratio, sourced from the China Transport Statistical Yearbook ( 44 ). Energy consumption (E) and carbon emissions (C) data were derived from five vehicle categories: passenger vehicles, freight vehicles, tricycles, low-speed trucks, and motorcycles. The definitions and data sources for these variables are summarized in Table 3.
Definitions and Measurements of Input and Output Variables
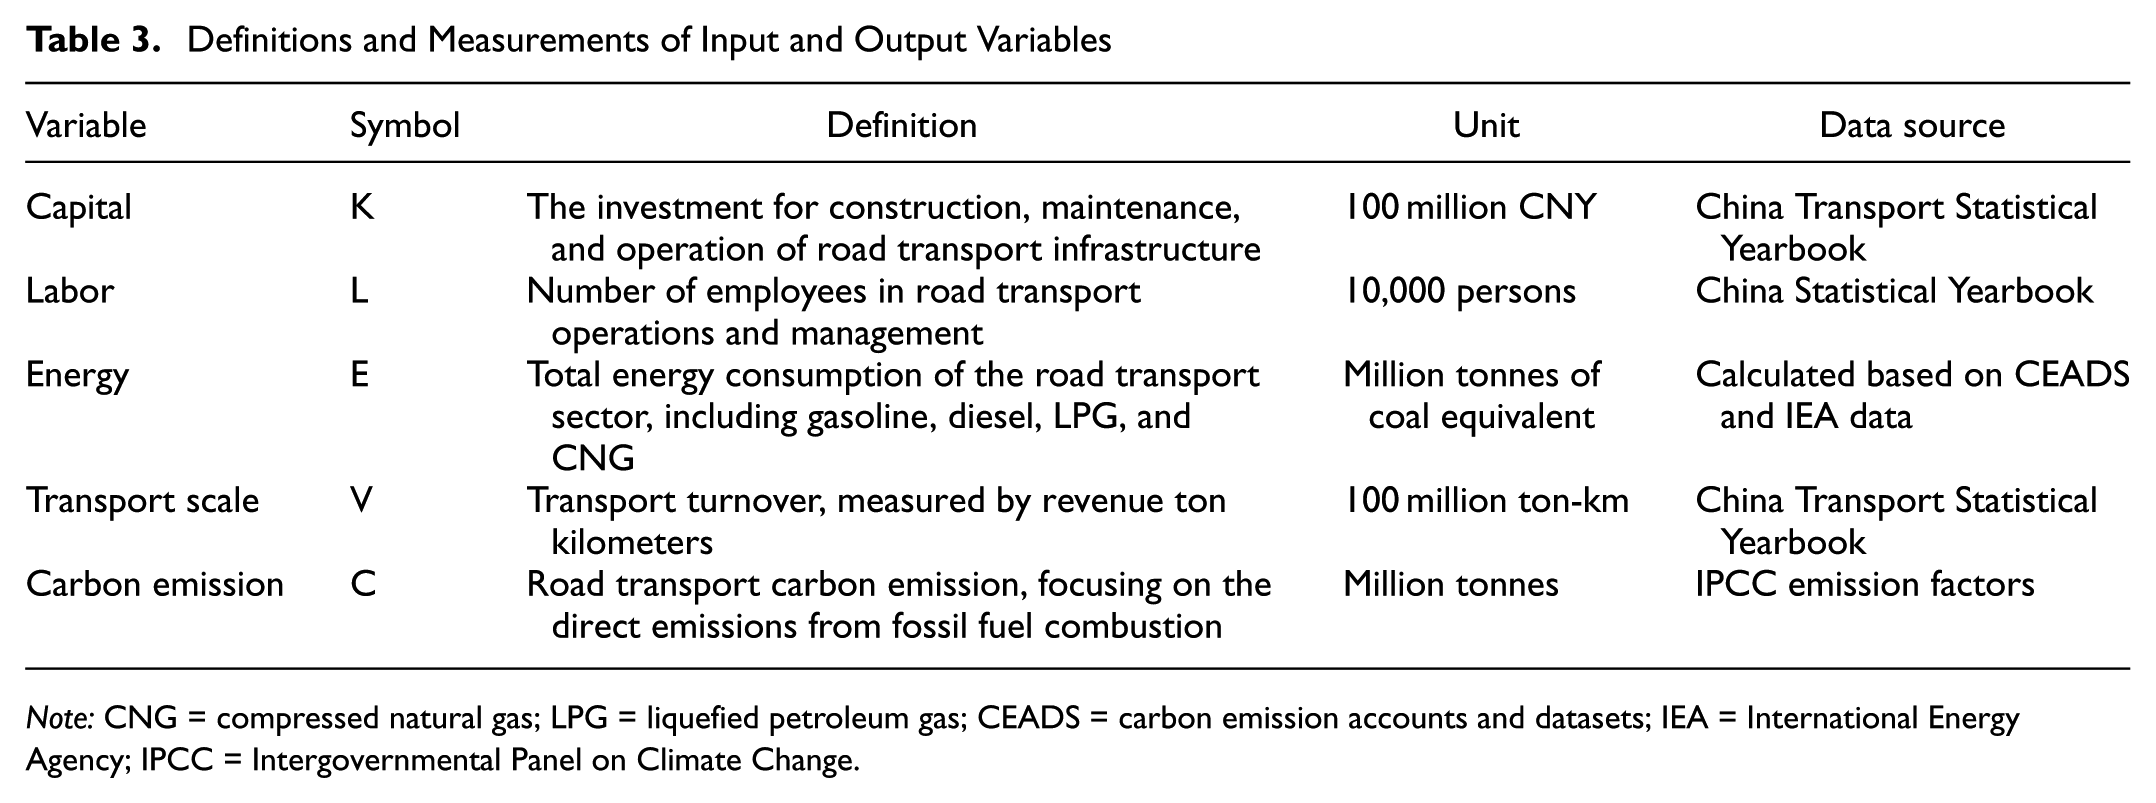
Note: CNG = compressed natural gas; LPG = liquefied petroleum gas; CEADS = carbon emission accounts and datasets; IEA = International Energy Agency; IPCC = Intergovernmental Panel on Climate Change.
Specifically, energy consumption analysis indicates that gasoline and diesel constitute the predominant energy sources for road transport, supplemented by liquefied petroleum gas (LPG) and compressed natural gas (CNG) in public transit systems ( 26 ). According to carbon emission accounts and datasets (CEADS), gasoline consumption data for 30 provincial transportation departments are accessible ( 45 ). The entire gasoline consumption in the transport sector stems from road traffic, while over 99% of CNG and LPG usage is attributed to road traffic. Consequently, the consumption of gasoline, CNG, and LPG in road traffic within each province corresponds to their overall consumption in the transportation sector ( 46 ). Concerning diesel, the bulk of diesel consumption in the transport sector is because of road traffic, with a minor portion attributed to rail and inland water transport. Although data on diesel consumption by rail and inland water are available from the International Energy Agency (IEA) ( 4 ), they are limited to country-level aggregations. For diesel allocation, CEADS-provided provincial transport-sector data underwent methodological refinement: rail and inland waterway consumption, estimated using IEA’s national-level data combined with provincial turnover statistics, were subtracted to isolate road-specific usage. This analytical framework assumes minimal regional variation in energy intensity, ensuring methodological consistency across spatial dimensions.
On the basis of energy data obtained, the top-down method is extensively employed in China’s carbon emission inventory because of its superior data availability and advantages in macrolevel carbon emissions calculations. In this study, we adopt a top-down approach to investigate road transportation carbon emissions by estimating energy consumption in gasoline, diesel, LPG, and CNG. Furthermore, we estimate carbon emissions from fuel combustion, as recommended by the Intergovernmental Panel on Climate Change (IPCC) ( 47 ). According to the IPCC, the accounting method for RTC emissions in the i-th region is as follows:

where i represents the i-th region,
Results and Discussions
Road Transportation Efficiency Analysis
The TFPE of road transportation showcases the system’s capacity to optimize transportation service output with minimal resource inputs—energy, capital, and labor—while mitigating carbon emissions ( 48 ). Figure 2 presents the evolution trends of TFPE across Chinese 30 regions during 2010–2020. Temporally, road transportation TFPE increased from 2010 to 2018, particularly in the economically and technologically advanced eastern region. However, from 2019 to 2020, lockdowns, movement restrictions, and economic slowdowns caused by the pandemic, drastically reduced road traffic demand, leading to insufficient resource utilization and affecting production efficiency. The pandemic’s global economic impact may also indirectly affect road transportation investment and maintenance, exacerbating efficiency declines ( 49 ).
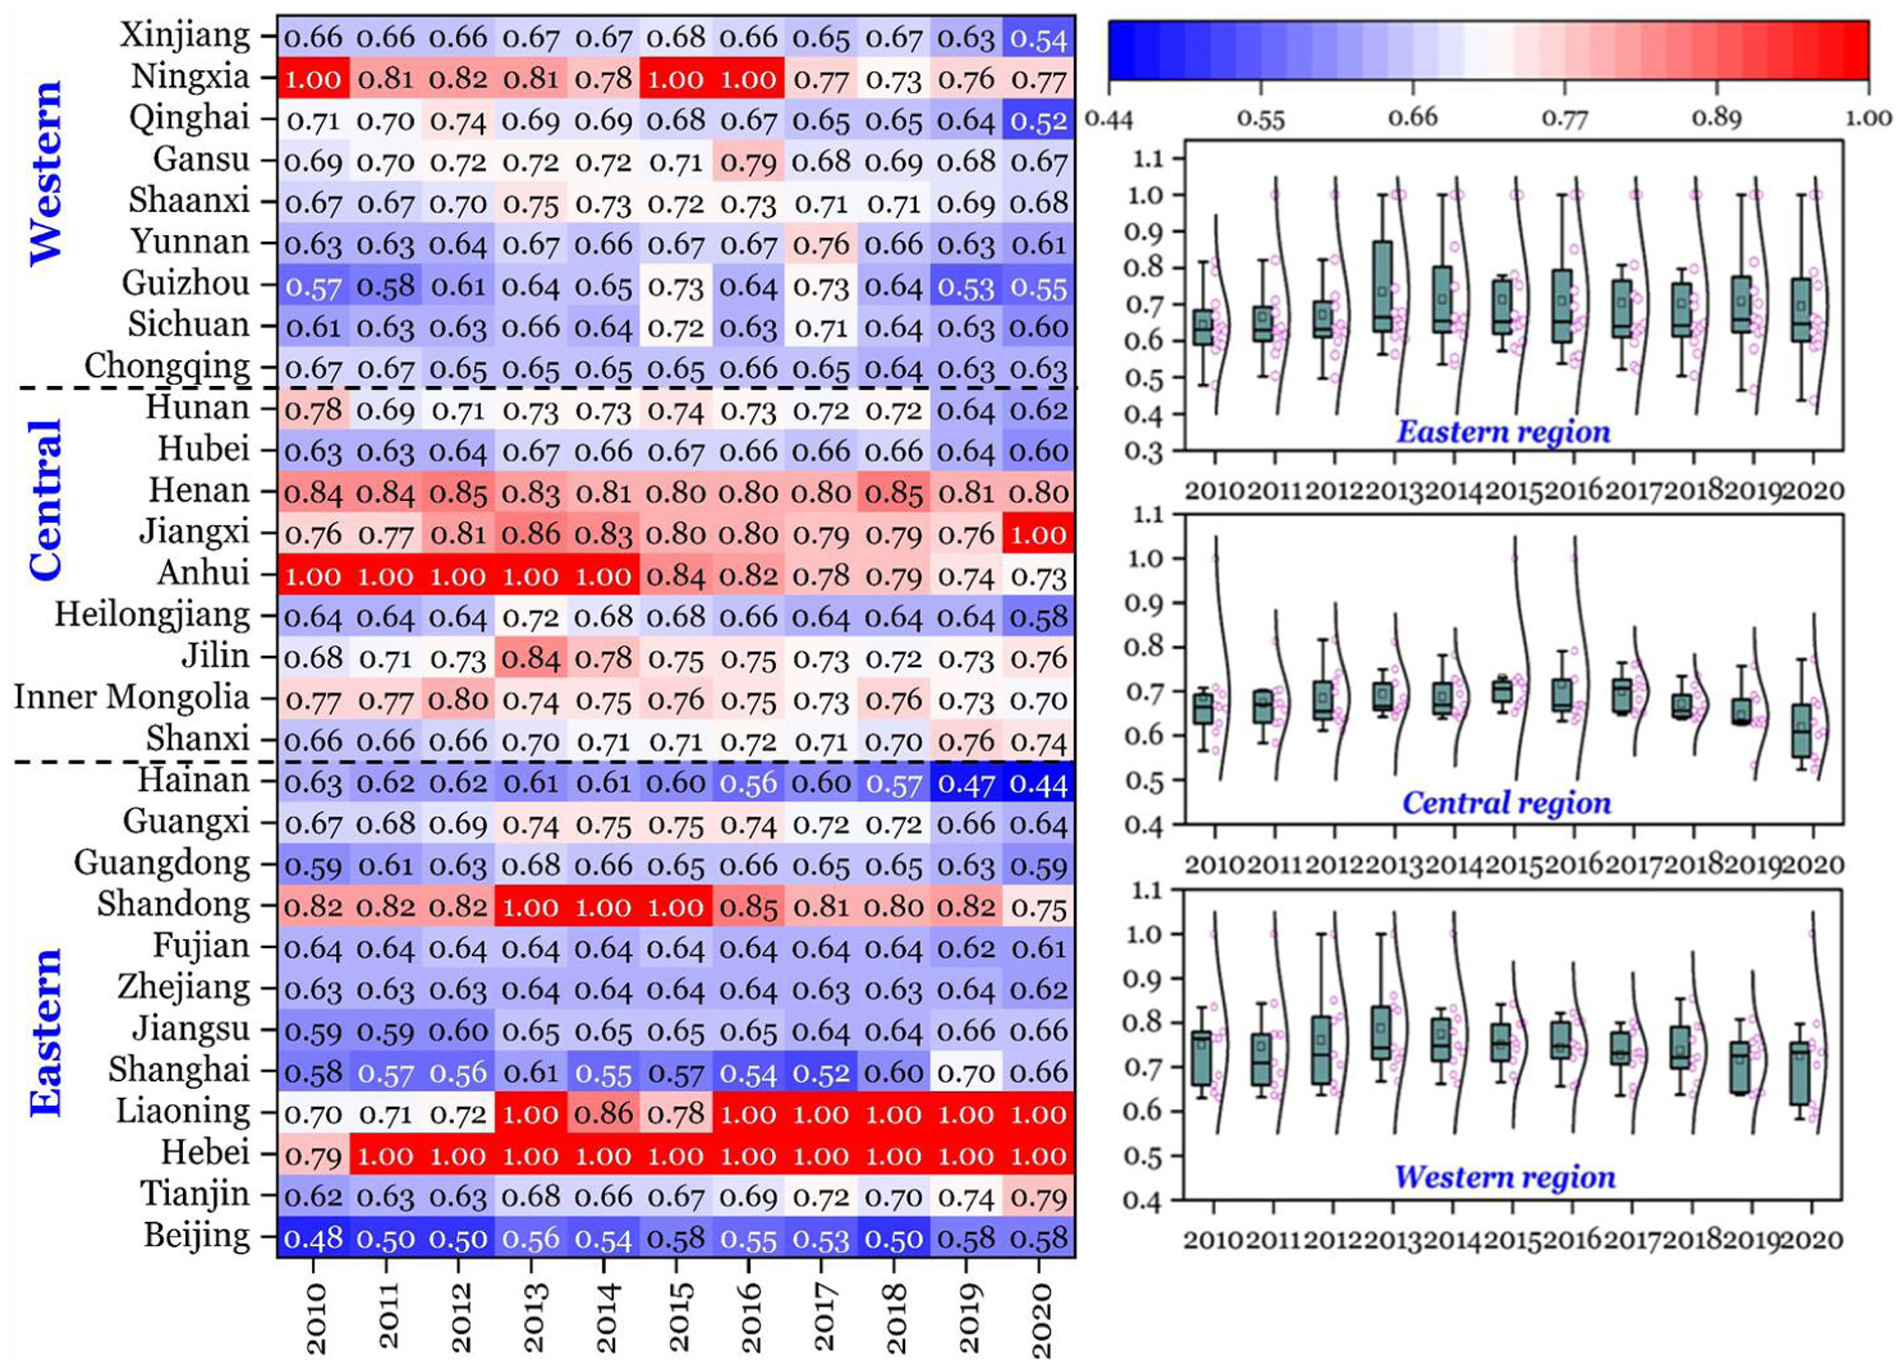
Total factor production efficiency of road traffic and efficiency distribution in different regions, 2010–2020.
As is shown in Figure 2, the eastern region exhibited the lowest TFPE, with Beijing, Shanghai, and Hainan being below 0.6. In contrast, the central region demonstrates relatively high values. Peak performance was demonstrated in several regions, most notably in Hebei Province, where annual TFPE values were sustained at optimal levels throughout the 2011–2020 period. This observed divergence aligns with regional development trajectories. Despite the eastern region’s developed economy and comprehensive road facilities, early development has led to issues such as traffic congestion and aging infrastructure, hindering production efficiency improvement ( 50 ). Conversely, the central region, though lagging in road construction, continuously enhances its transportation network and facility quality and efficiency. Abundant land resources, exemplified by Anhui and Henan, keep construction costs low, favoring production efficiency improvement. In addition, the central region’s progress in industrial transfer and urbanization strongly supported road transportation development. These may explain why the TFPE of road transportation in the central region is relatively higher than that in the eastern region.
Specifically, the TFPE framework synthesizes the synergistic integration of energy utilization, capital allocation, labor productivity, transportation output capacity, and carbon emission mitigation within road transport systems. As depicted in Figure 3, total factor efficiencies of these factors exhibited distinct regional characteristics and temporal trends (for details see Appendix 1 online).
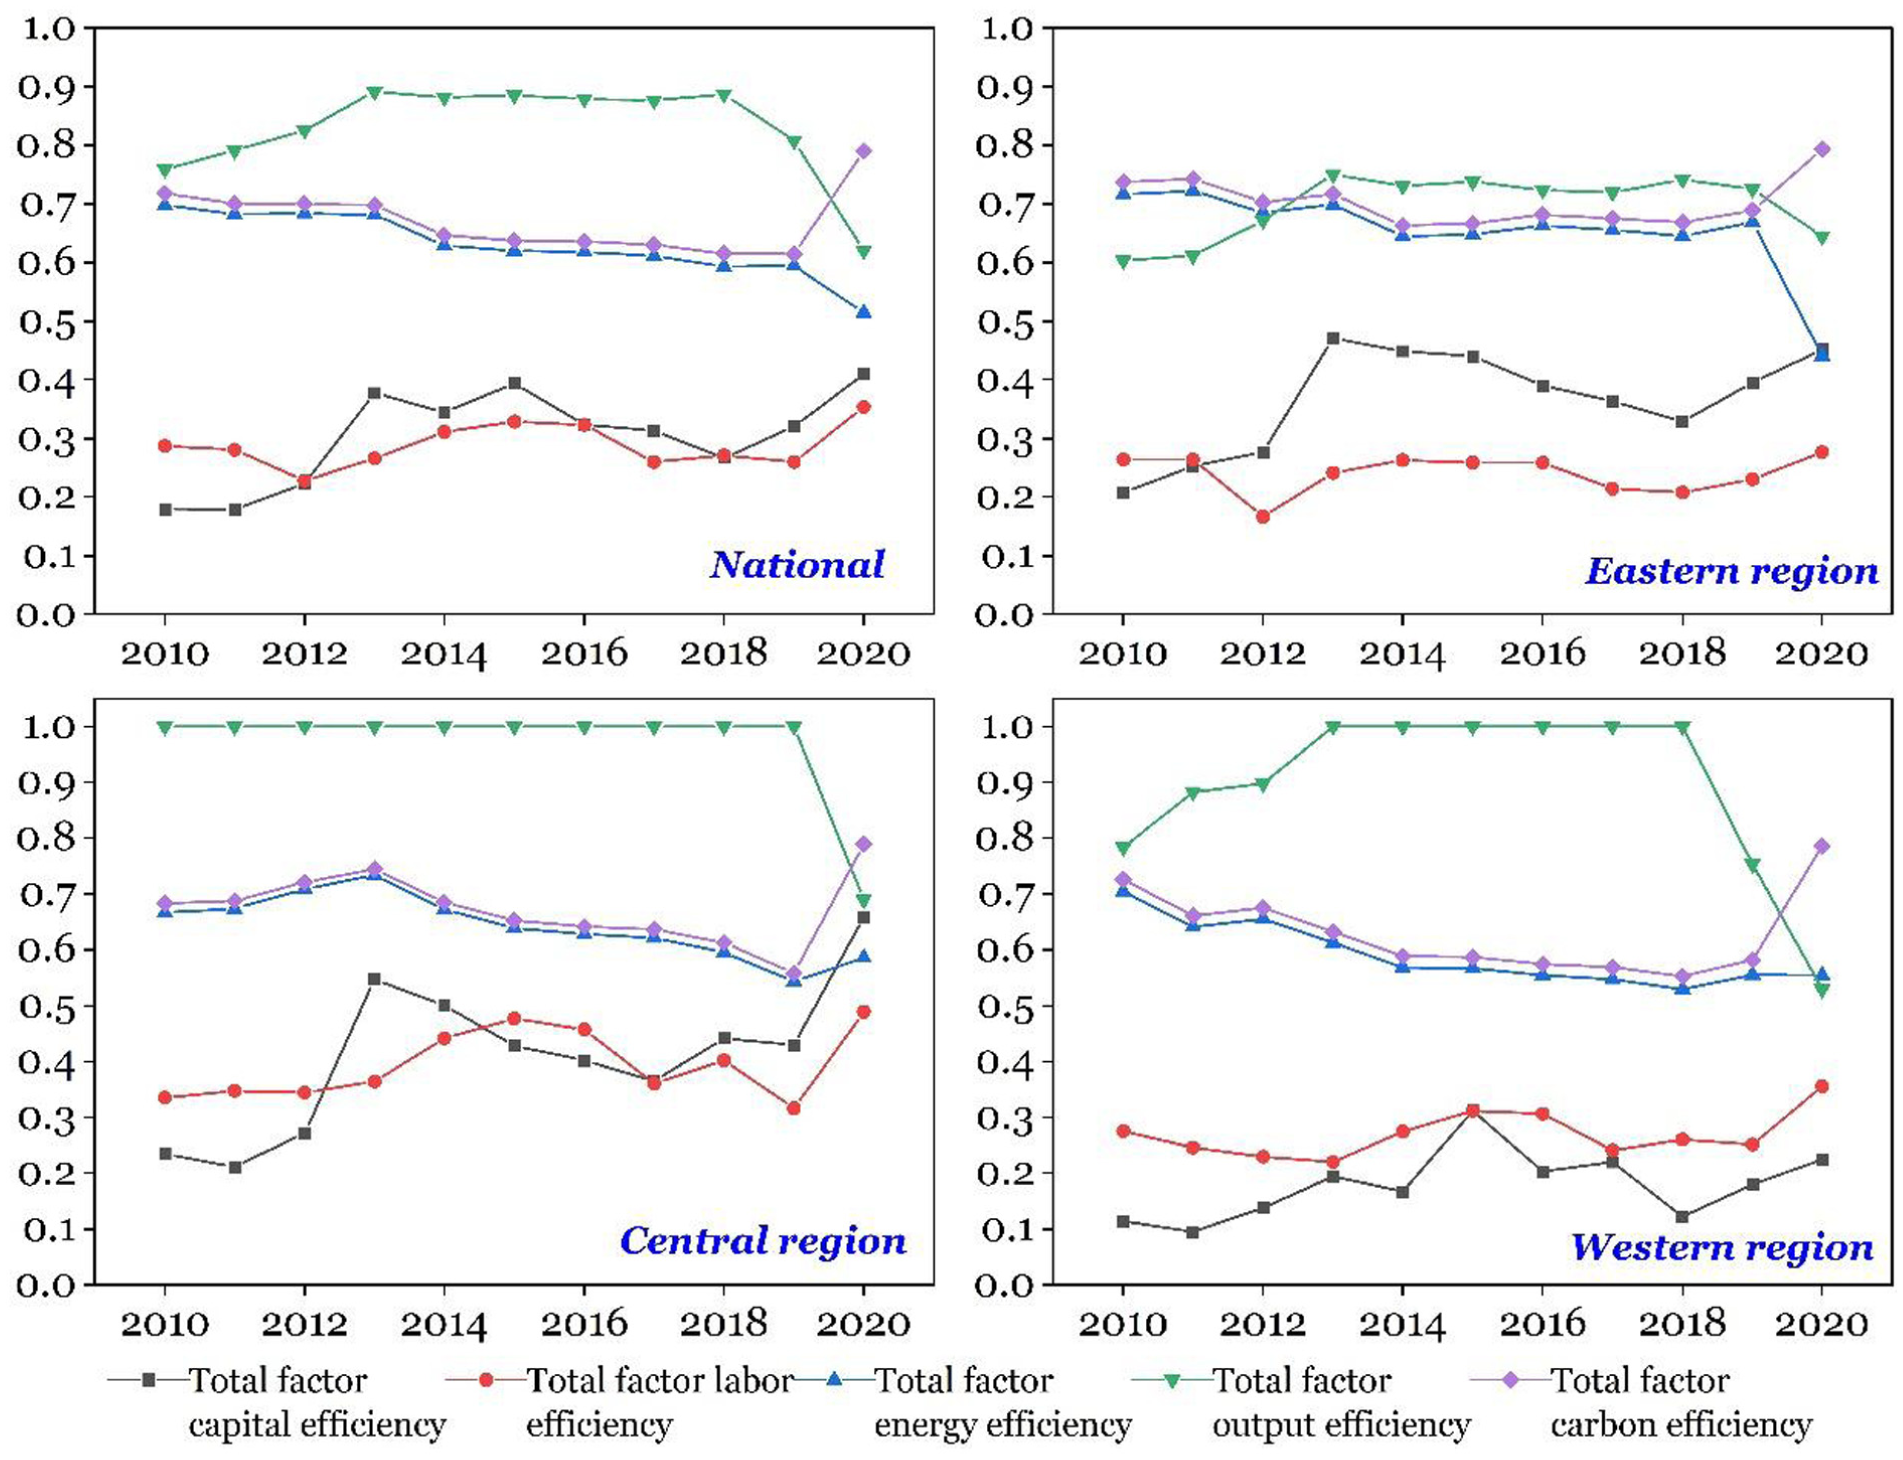
Evolution trend and regional characteristics of different factor efficiencies in China’s road transport sector, 2010–2020.
In general, three pivotal drivers emerge in TFPE enhancement: total factor output efficiency, energy efficiency, and carbon emission efficiency. Regional analyses reveal heterogeneous patterns in production efficiency components during 2010–2020. Transportation output efficiency exhibited a dual-track growth pattern, with eastern regions benefiting from intelligent transportation systems and western regions through infrastructure expansion ( 31 ), stabilizing post-2013 as network effects saturated. Conversely, energy and carbon efficiencies displayed synchronized declines across regions during 2010–2019. The high correlation between energy efficiency and carbon efficiency arises from RTC being predominantly derived from fossil fuel consumption. Thus, improvements in energy efficiency (e.g., reduced energy use per transport output) directly lower RTC, leading to synchronized trends in the two efficiencies prepandemic. The western region registered the most severe efficiency erosion, exhibiting 21.2% and 19.8% declines in energy and carbon emission efficiencies respectively—43% greater than the national average degradation rate. This geographical disparity correlated with two systemic constraints: systemic structural and technological constraints. First, the inadequate intermodal connectivity in western China has perpetuated a high dependency on private vehicles, which accounted for 68.3% (51.4% in eastern) of passenger traffic ( 42 ). The underdevelopment of integrated transport networks—such as efficient linkages between railways, long-distance buses, and urban transit—limits viable low-carbon travel alternatives ( 19 ). This forced a greater reliance on private cars and less efficient road freight, directly inflating energy consumption. Second, the delayed adoption of advanced emission control technologies has severely hampered carbon efficiency. The low compliance rate with the stringent China VI emission standards—only 34.7% in the west versus 72.1% in eastern provinces—means a significantly larger portion of the vehicle fleet operates with higher emission factors ( 42 ). This lag creates a tangible performance gap in carbon efficiency, as a newer, compliant fleet directly translates to lower RTC per kilometer driven.
Notably, both capital efficiency and labor efficiency exhibited afluctuating upward trends, with more pronounced effects observed in the central region. This was primarily attributed to substantial government investment in transportation infrastructure (Figure 4), enhancing road quality and capital efficiency. Furthermore, technological advancements and industrial upgrades have improved the quality of labor in the road transportation sector, boosting labor efficiency. Notably, provinces such as Hubei, Hunan, and Henan have achieved significant accomplishments in road transportation construction by strengthening infrastructure and road networks, thereby increasing transportation capacity and service quality, and fostering regional economic development ( 26 ). Simultaneously, these provinces have focused on enhancing labor force quality through driver training and management, automation, and intelligence enhancements, reducing manual operations, and further promoting total factor labor efficiency.
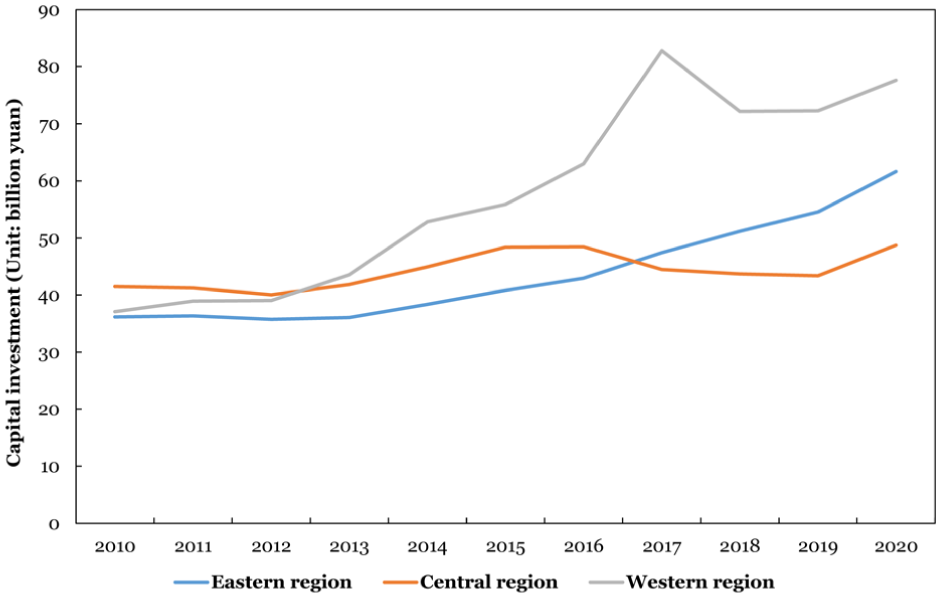
Evolution trends of capital investment in road transportation by different regional governments, 2010–2020.
Drivers of Road Transportation Carbon Emissions
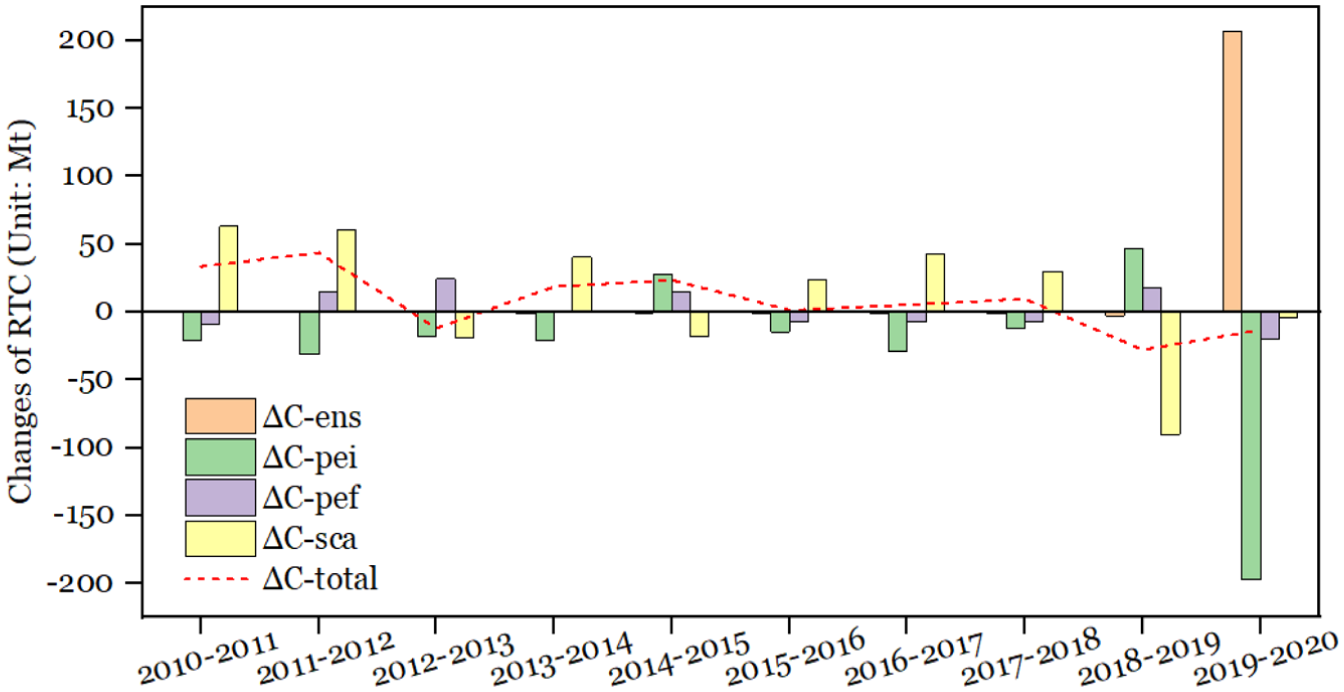
To further investigate the mechanism of RTC changes, we applied the PDA method to identify the major driving factors behind the RTC. Specifically, the decomposition analysis proceeded in two steps. First, based on the traditional PDA process, the RTC change was decomposed into five factors: the carbon emission coefficient effect (
Influencing factors of changes in national RTC, 2010–2020.
The effect of
The effects of
Transportation scale expansion emerged as the primary growth driver. As is shown in Figure 6, regional analysis reveals
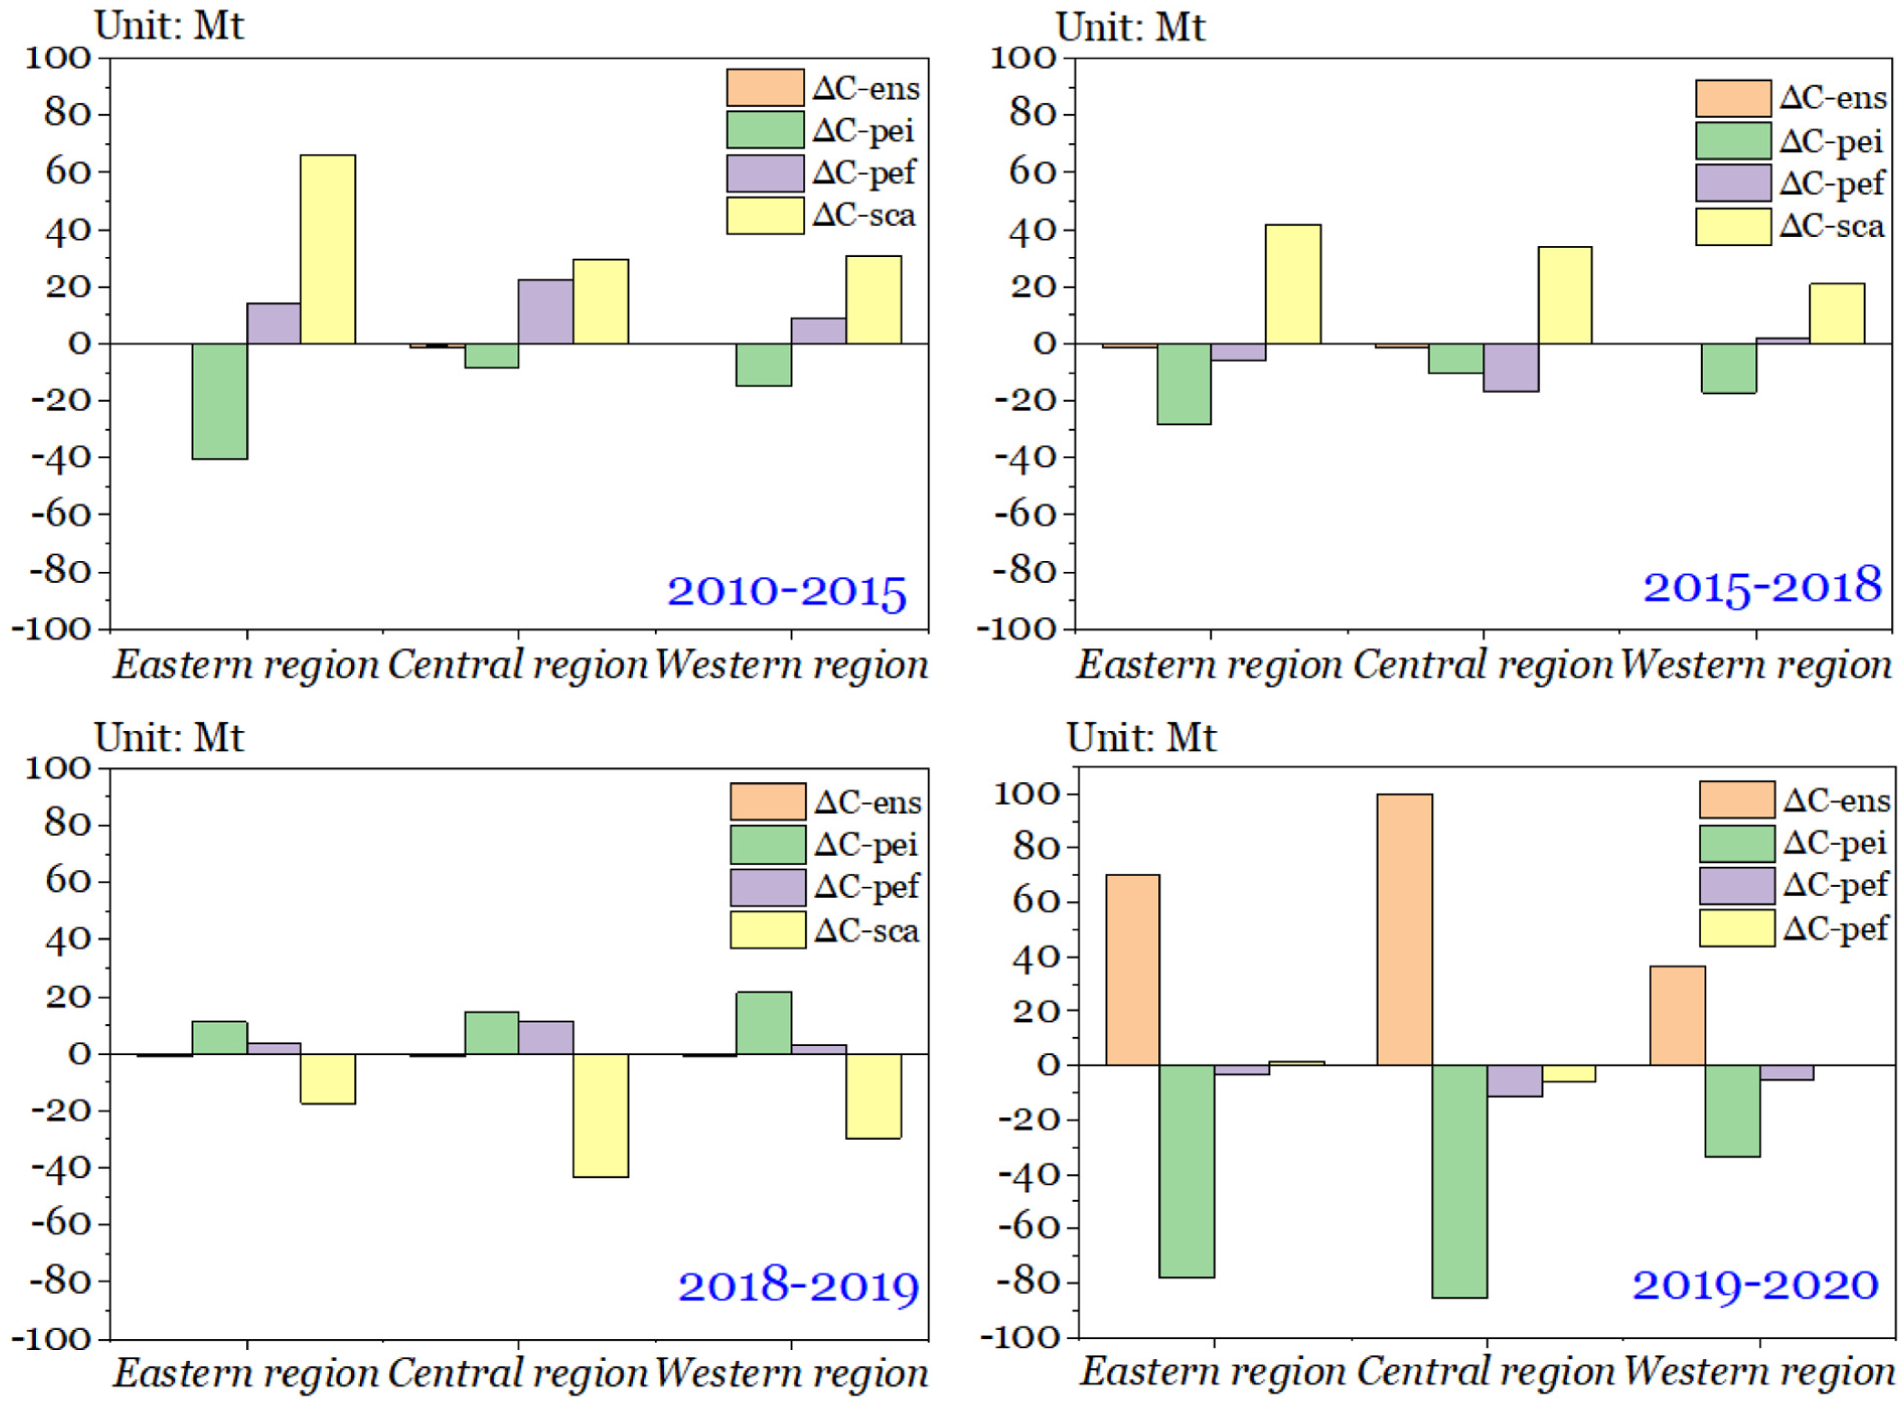
Influencing factors of changes in regional RTC, 2010–2020.
The results show that
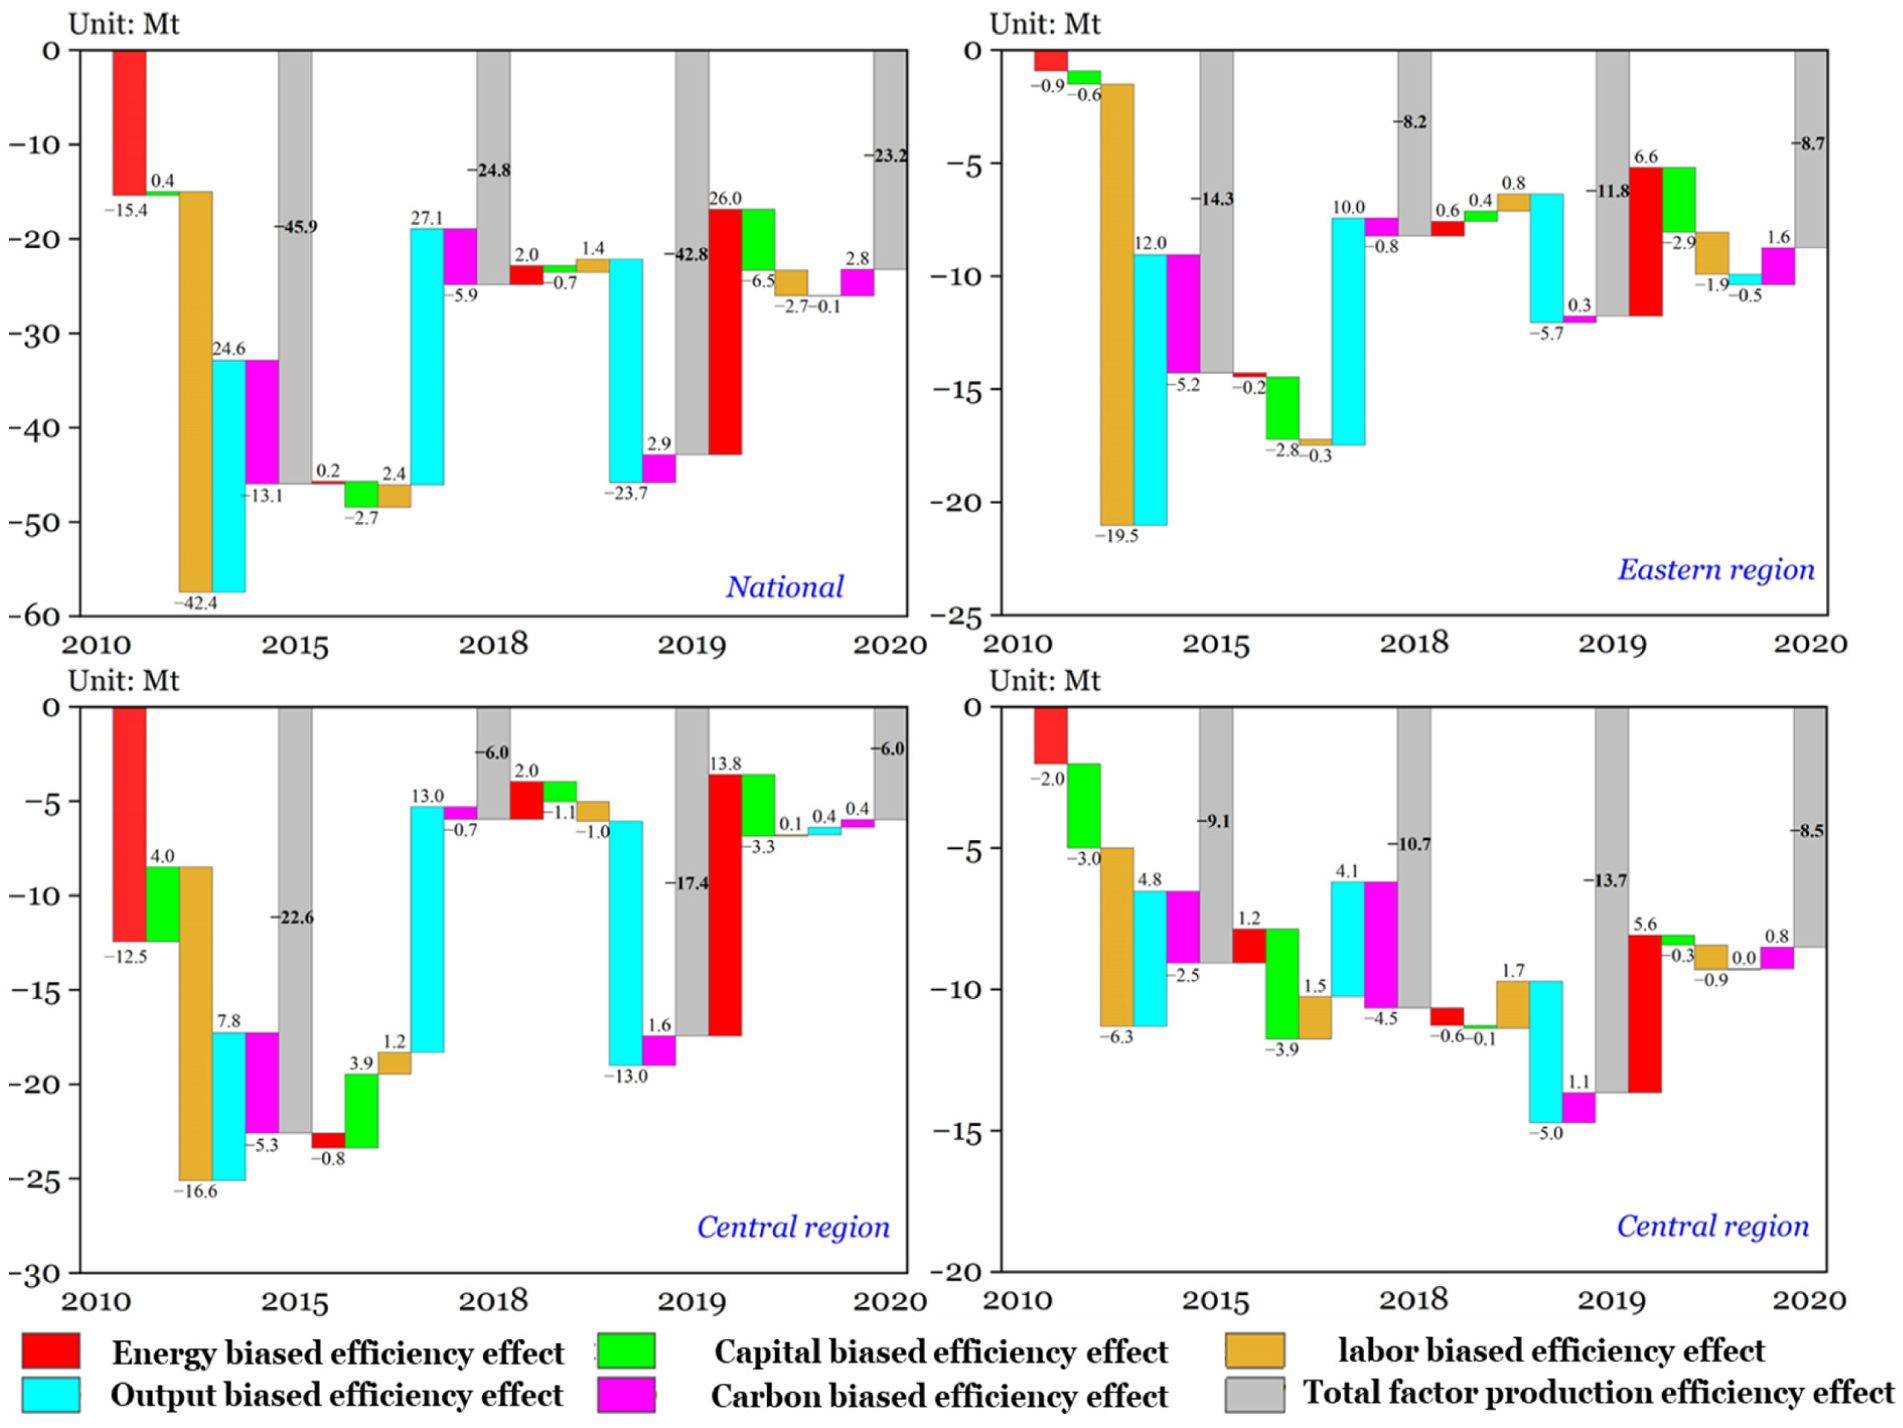
The impact of different factor-biased efficiency changes on national and regional RTC, 2010–2020.
As Figure 7 delineated, from 2010 to 2018, gains in transport output-biased efficiency led to a 51.67 Mt increase in RTC. This reflects the inherent tension between optimizing transport operations and reducing emission side effects. Other factors biased efficiency, including energy, capital, labor, and carbon emissions, all contributed to reducing RTC. Labor-biased efficiency effect restructuring emerged as the predominant mitigation vector, accounting for 40.03 Mt emission reductions, underscoring human capital’s pivotal role in low-carbon transition mechanisms. Paradoxically, pandemic-induced mobility restrictions triggered countervailing emission dynamics: energy biased efficiency and carbon-biased efficiency effects became emission accelerants, while transport output biased efficiency enhancements functioned as mitigation vectors. This inversion mechanism principally stemmed from disproportionate reductions in public transit operations coinciding with surges in private vehicle modal share. These paradoxical effects manifested most acutely in central China, where infrastructure and development characteristics amplified the modal shift repercussions.
In particular, there exists divergent patterns in capital-biased efficiency during 2010–2018. While eastern and western regions demonstrated comparable trends, the central region underwent a transition toward efficiency-oriented investment that paradoxically induced a 7.89 Mt cumulative increase in RTC. The most pronounced effect emerged during 2011–2012, accounting for 3.11 Mt of RTC growth, with Hunan, Anhui, and Heilongjiang provinces exhibiting the strongest response. This phenomenon can be explained through three interlinked mechanisms. First, the structural economic transition during China’s growth deceleration phase weakened traditional growth drivers, particularly in infrastructure-related investments ( 27 ). Second, the national strategic reorientation of transportation investments toward western regions and Belt and Road partner countries diverted resources from central provinces. Third, compounding fiscal constraints at local government levels coupled with rising factor costs (labor and energy) collectively depressed investment efficiency.
Carbon Reduction Potential of Efficiency Improvement
By utilizing the efficiency improvement scope of various factor biases as weights, we further quantify the emission reduction potential for each factor bias. The detailed results of reduction potential are presented online in Appendix 3. To investigate the correlation between efficiency and emission reduction potential, we construct a “production efficiency–reduction potential matrix”, which visually highlights the provincial heterogeneity in factor input efficiency and emission reduction scope within the road transportation sector. As illustrated in Figure 8, the matrix categorized each province into four quadrants, with efficiency values along the horizontal axis and emission reduction potential along the vertical axis. In particular, the center point in Figure 8 represents the average levels of TFPE and the RTC reduction potential across different regions.
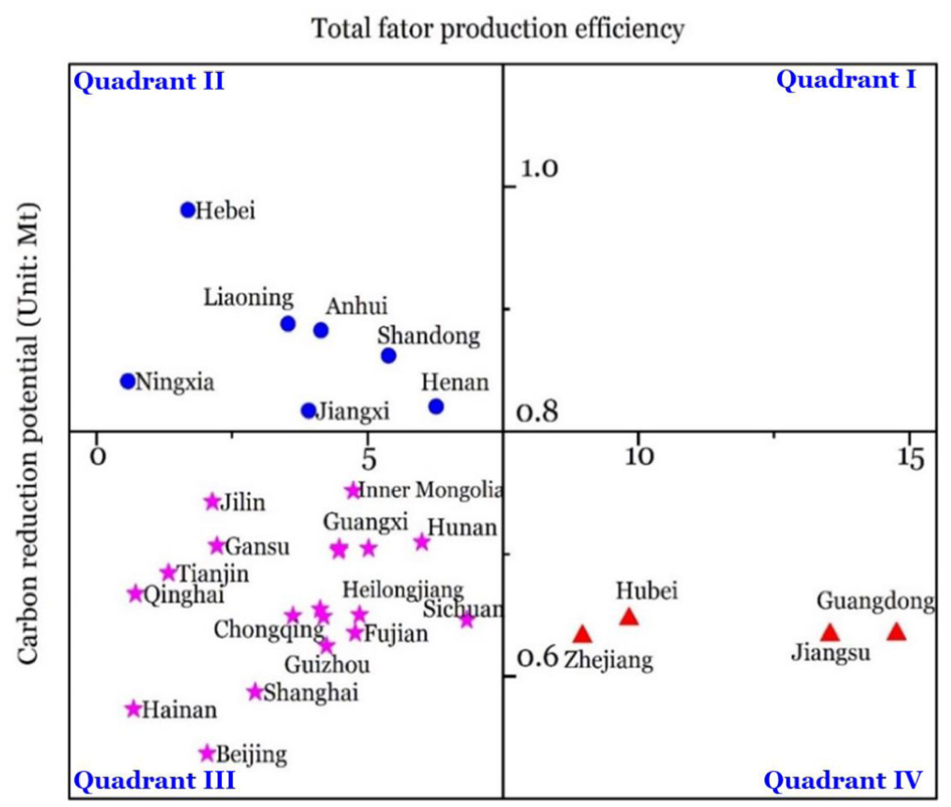
Road transportation total factor production efficiency and its RTC reduction potential, 2010–2020.
Figure 8 reveals distinct spatial clustering patterns across provincial performance metrics. The majority of provinces concentrate in quadrant III, with sparser distributions observed in quadrants II and IV. Notably, quadrant I remains unoccupied. This absence aligns with practical realities as quadrant I theoretically represents the optimal state of concurrent high production efficiency and significant emission reduction potential. However, elevated production efficiency typically corresponds to diminished improvement capacity, thereby naturally limiting emission reduction potential in high-performing regions.
Provinces in quadrants II (e.g., Hebei, Anhui, Shandong) exhibit high production efficiency but limited emission reduction potential, necessitating a focus on technological innovations, such as promoting NEV (e.g., hydrogen fuel heavy-duty trucks) or intelligent dispatch systems. Provinces in quadrant III (e.g., Qinghai, Hainan, Chongqing) face a “double low” trap and can overcome scale limitations through regional collaborations, such as jointly establishing logistics hubs. Provinces in quadrants IV (e.g., Jiangsu, Zhejiang, Guangdong) demonstrate low production efficiency but substantial emission reduction potential, reflecting extensive development in road transportation. Improvements in both management efficiency (e.g., optimizing road network utilization) and technical efficiency (e.g., promoting electrification) are required.
Road transportation TFPE exhibited spatial heterogeneity shaped by composite factors including endowment structures, developmental stages, and technological capabilities. Figure 9 delineated regional variations in RTC reduction potential and factor allocation patterns across efficiency enhancement pathways. The right-hand side of Figure 9 illustrates the average share of emission reduction potential attributed to each type of biased efficiency over the 2010–2020 period. It synthesizes data from all intermediate years (2010–2011 to 2019–2020) to reflect long-term, consistent contribution patterns, rather than focusing on a single year or isolated time intervals. Capital-biased efficiency contributed substantially to emission mitigation, particularly in western China (32.9% annual average), followed by central (31.0%) and eastern regions (27.5%). Conversely, labor-biased efficiency demonstrated greater potential in eastern China (33.4%), with central (32.7%) and western regions (30.9%) trailing sequentially. These metrics reflect infrastructure optimization and labor allocation’s differential impacts on decarbonization.
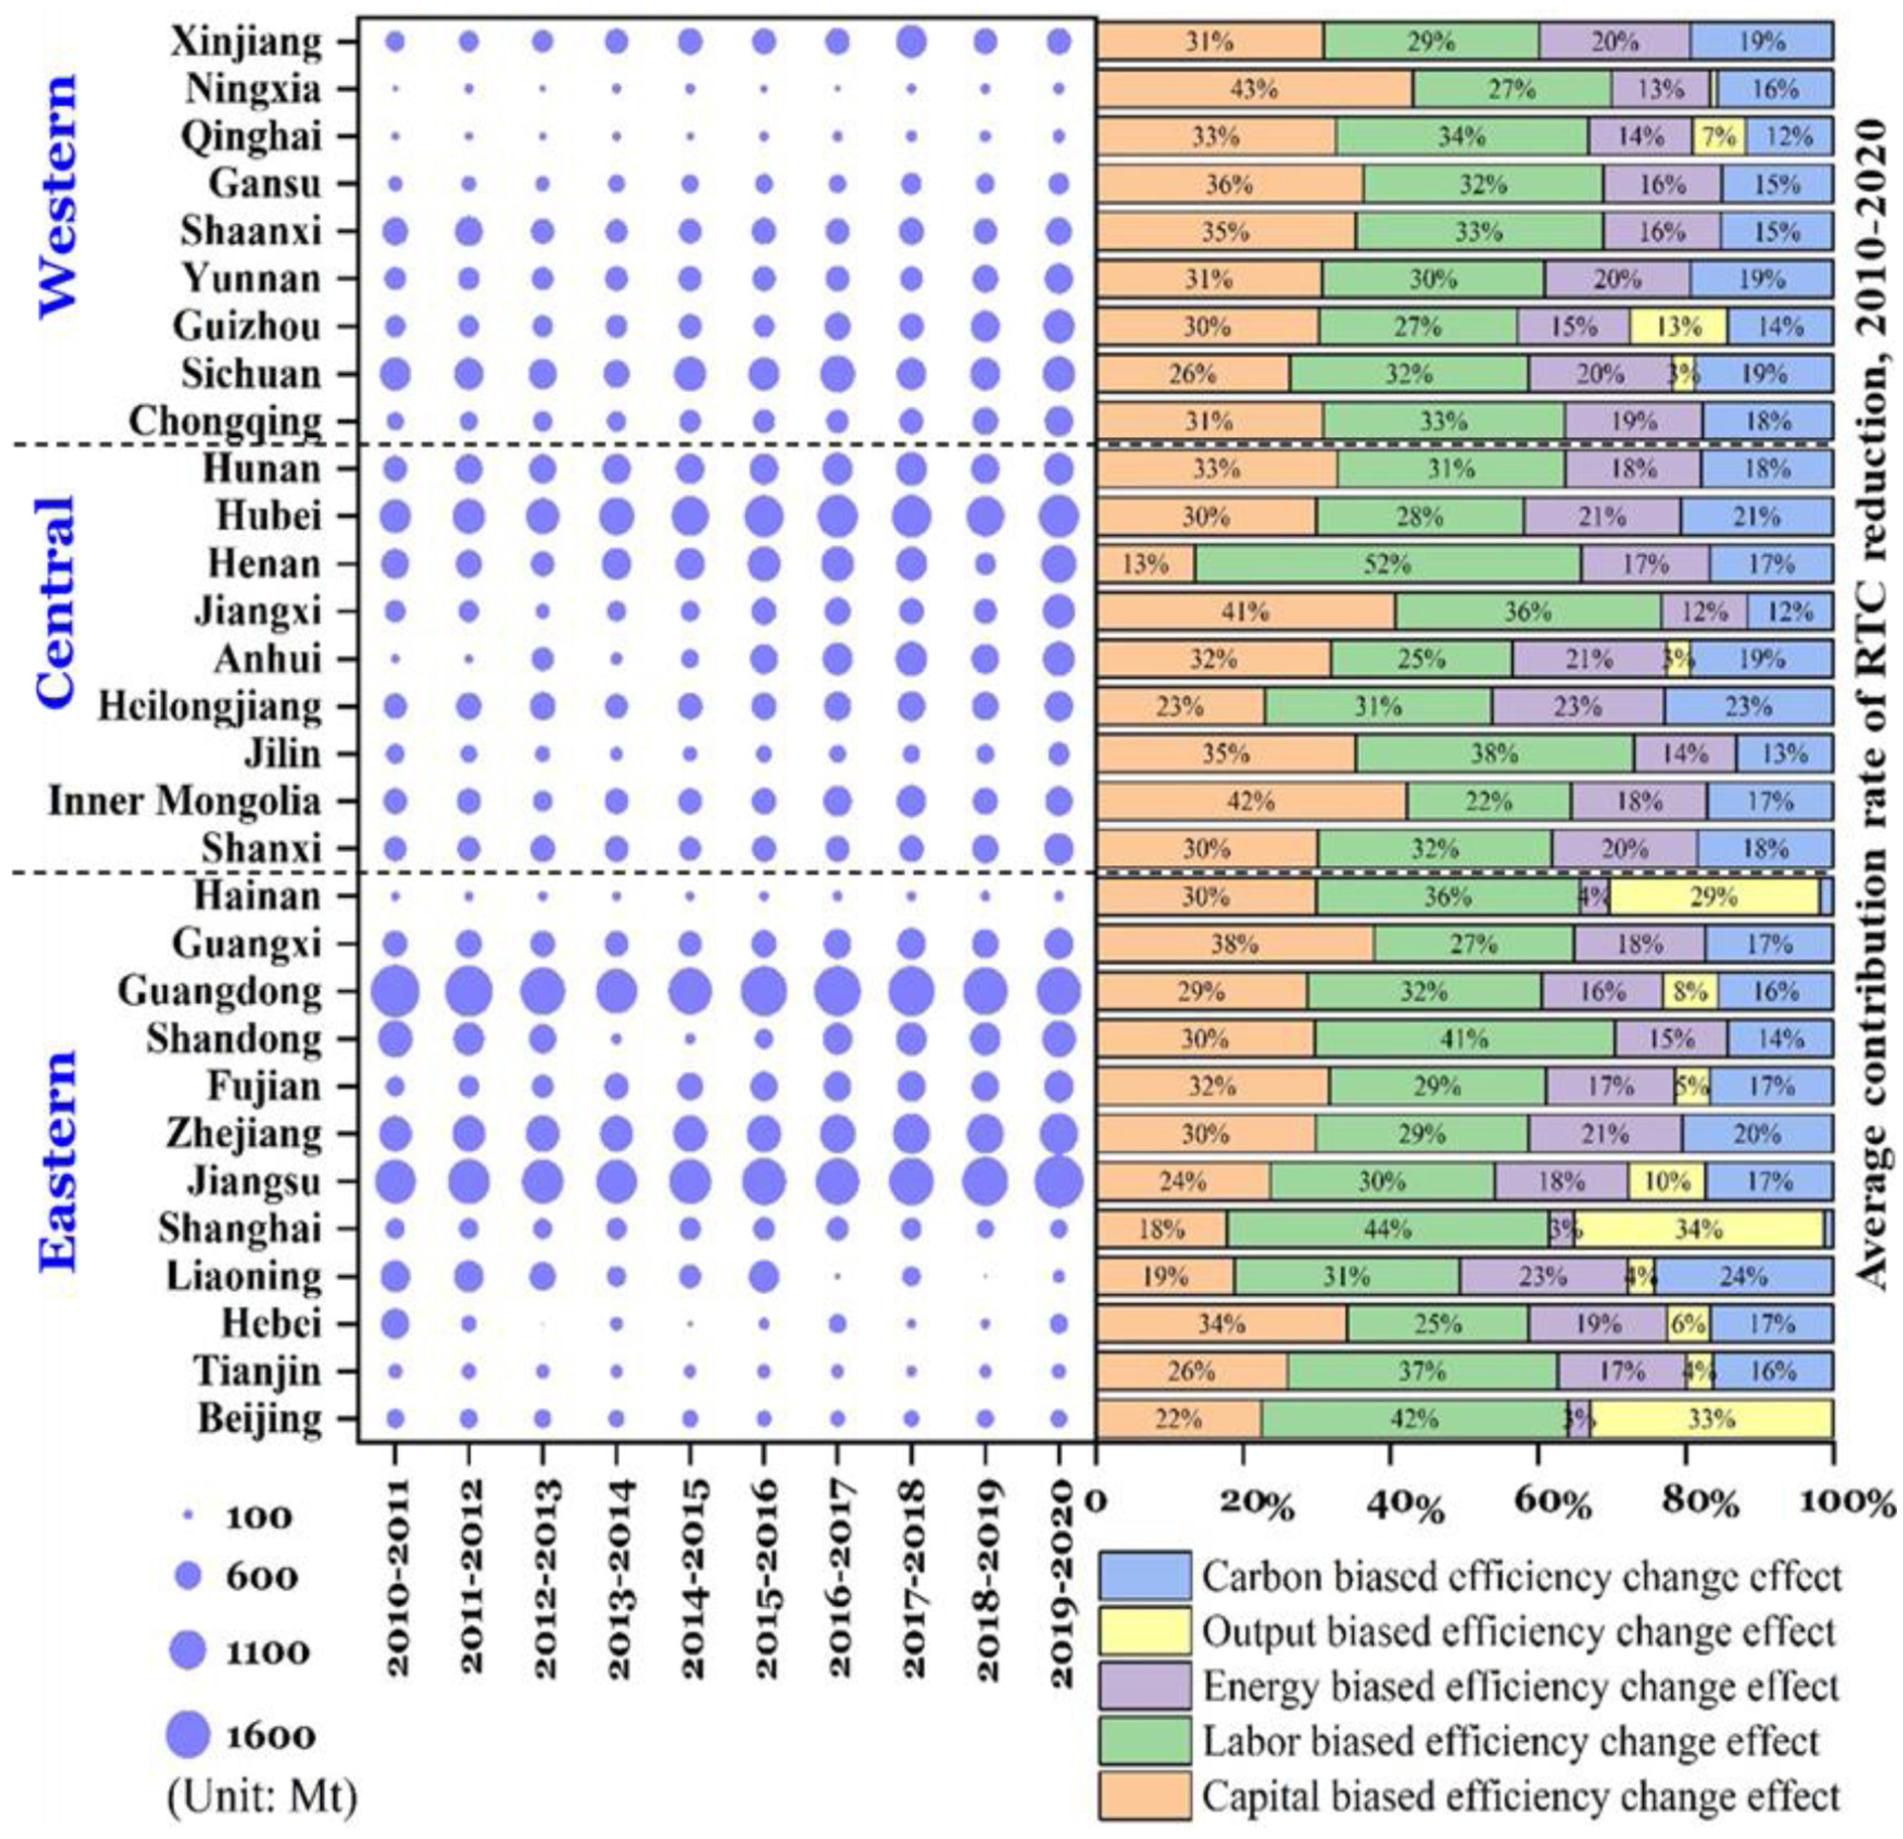
Efficiency-oriented RTC reduction potential in different regions.
The observed regional disparity can be attributed to the following factors. In western China, the transportation sector faces two key infrastructural constraints: suboptimal road networks force aging diesel trucks into inefficient high-load operations, sustaining high carbon intensity; and insufficient charging infrastructure hinders the adoption of electric vehicles ( 34 ). Strategic investments—such as deploying smart highway systems and renewing heavy-duty fleets with NEV—could achieve significant marginal emission reductions through operational optimization. In contrast, eastern regions, which are approaching capital saturation, require labor-intensive improvements: enhancing drivers’ eco-driving skills through standardized training, and deploying AI-based routing systems to reduce empty-load rates. This approach aligns with the region’s capital-intensive economic structure and its annual labor cost escalation of 7%–9% ( 6 ).
Notably, energy- and carbon-biased efficiencies demonstrated limited mitigation contributions (15%–20% lower than capital/labor optimizations across regions), constrained by technological lock-in effects. Both energy efficiency improvements and clean energy transitions require extended technological maturation and systemic upgrades, yielding diminishing marginal returns in short-term policy cycles ( 24 ). This necessitates region-specific mitigation strategies: western China should prioritize capital-intensive green infrastructure modernization (e.g., Hebei Province’s digital freight platform pilot reduced empty-load rates by 12% points [2020–2022]), while eastern regions must leverage labor enhancement through intelligent transport system integration. Particularly, output-biased efficiency exhibited the weakest reduction potential. China’s distinct geoeconomic landscape, herein the central and western regions handle 65%–70% of national bulk freight (e.g., coal, minerals), may explain this phenomenon. The preoptimized long-haul corridor networks employed for these goods achieve consistently high vehicle utilization rates of 85%–90% ( 42 ). This near-full-load operation significantly dilutes energy consumption and emissions per unit of transportation output, resulting in an energy intensity substantially lower than that of the fragmented, short-haul logistics system prevalent in eastern China. Consequently, for these already highly optimized transport systems, which have already reaped environmental benefits from high efficiency, the headroom for further emission reduction is relatively limited.
Strategic alignment of regional efficiency endowments with targeted policy interventions enables cost-effective decarbonization while advancing systemic transformation in road transportation systems. Provinces should prioritize differentiated pathways based on dominant efficiency gaps: energy/carbon-biased efficiency regions (e.g., Heilongjiang, Xinjiang) require infrastructure modernization through LNG fleet mandates and photovoltaic-integrated charging hubs, as exemplified by the Hexi Corridor project. Capital-biased efficiency areas (e.g., Inner Mongolia, Ningxia) benefit from intelligent transportation upgrades, such as dynamic speed harmonization systems proven to decrease congestion-related energy waste. Labor-biased efficiency priority zones (e.g., Beijing, Shanghai) can achieve optimization through AI-driven logistics platforms. For example, Zhejiang’s Four-Port Cloud Platform demonstrating significant RTC reductions in empty-load rates.
Conclusions and Policy Implications
Conclusions
While efficiency enhancement constitutes a crucial mechanism for RTC mitigation, its implementation pathways are substantially shaped by regional resource heterogeneity and exogenous constraints. This study proposes an EB-PDA method that innovatively elucidates new insights into the influencing factors of efficiency bias of different factors in China’s road transport. The empirical findings of this study offer warning signals about the main role of efficiency in RTC reduction, and the direction and potential of future emissions reduction through improving efficiency. The main research findings are summarized in the following three key aspects.
First, China’s road transport TFPE showed regional disparities amid overall growth. It demonstrated an upward trend from 2010 to 2018, yet declined during 2019–2020 because of the pandemic. Significant regional disparities existed: the eastern region posted the lowest TFPE (below 0.6 in Beijing, Shanghai, and Hainan) constrained by congestion and aging infrastructure. By contrast, the central region performed best, with Hebei maintaining optimal levels because of cost-effective construction and infrastructure upgrades. Total factor output efficiency grew through intelligent systems in the east and infrastructure expansion in the west. Energy and carbon efficiencies declined nationwide, with the west suffering the sharpest falls (21.2% and 19.8%, 43% above the national average). Capital and labor efficiencies fluctuated upward, especially in central provinces.
Second, RTC in China were driven mainly by transportation scale expansion and curbed by efficiency improvements. The eastern region, with the largest demand and growth, saw a 55.5% cumulative emission rise, followed by the western and central regions. The potential energy intensity effect plays a crucial role in RTC reductions across all three regions. The energy structural effect demonstrates a progressively enhanced mitigation effect, cutting RTC by 7.30 Mt despite pandemic disruptions. TFPE contributed a total reduction of 23.24 Mt. All factor-biased efficiencies lowered emissions except the output-biased effect. Notably, capital-biased efficiency showed regional divergence: eastern and western regions demonstrated parallel declining trends, whereas the central region registered a 7.89 Mt increase in RTC over 2010–2018.
Third, RTC reduction potential varies significantly across provinces because of factor-specific efficiency differences. Using a production efficiency-reduction potential matrix, we find most provinces fall into Quadrant III (low efficiency, low reduction potential). Regional patterns depend on resource endowments, development stages, and technology. Capital-biased efficiency dominated emission cuts in the west (32.9%), followed by the central (31.0%) and eastern regions (27.5%), underscoring the importance of infrastructure upgrades in less developed areas. Labor-biased efficiency was most effective in the east (33.4%). Energy- and carbon-biased efficiencies offered limited potential because of technological lock-in. Output-biased efficiency exhibited the weakest reduction potential, showing that emission reduction cannot rely solely on output expansion.
Policy Implications
First, considering the disparities in TFPE and its subdivided efficiencies across different regions, the eastern region should leverage its advantages in intelligent transportation systems to further deepen the application of technologies and enhance energy and carbon efficiency. It can reduce emissions by promoting NEV and optimizing traffic signal systems to alleviate congestion. As the central and western regions continue to improve their infrastructure, they should prioritize efficiency enhancement, drawing on the intelligent technology experiences of the eastern region to avoid inefficient expansion. In response to the decline in efficiency during the pandemic, it is essential to establish emergency traffic management mechanisms to safeguard transportation efficiency during exceptional periods. Meanwhile, it is crucial to strengthen inter-regional technological exchanges and cooperation, facilitating the transfer of intelligent technologies from the eastern region to the central and western regions. This will enable a balanced improvement in efficiency and harness the pivotal role of efficiency in emission reduction.
Second, given that the scale effect is the primary driver of RTC growth, it is imperative to reasonably regulate transportation scale, optimize the transportation structure, develop multimodal transport, and alleviate the pressure on road transportation. It is essential to fully leverage the emission reduction potential of the energy intensity effect and the energy structure effect by increasing the application of clean energy in the transportation sector, raising fuel standards, and promoting a low-carbon transition in the energy structure. Concerning the emission reduction contribution of production efficiency, continuous investment in research and development should be made to enhance the efficiency of transportation vehicles and management. In response to the emission increase caused by the capital-biased efficiency effect in certain regions, investment directions should be optimized to ensure that capital is channeled toward high-efficiency and low-carbon sectors.
Third, based on the “production efficiency–reduction potential matrix,” differentiated strategies should be formulated for provinces in different quadrants. For the majority of provinces located in the third quadrant, it is necessary to simultaneously enhance production efficiency and tap into emission reduction potential. Increased investment should be directed toward improving capital-biased efficiency in western provinces and labor-biased efficiency in eastern provinces, thereby unlocking their emission reduction potential. To address the issue of limited contributions from energy and carbon-biased efficiency, it is crucial to break through technological lock-in by developing and promoting advanced energy-saving and carbon capture technologies. In cases where output biased efficiency potential is weak, output modes should be adjusted to prioritize low-carbon-oriented transportation production. Through policy guidance and financial support, regions should be encouraged to leverage their comparative advantages, thereby comprehensively enhancing their emission reduction capabilities.
In particular, from a global perspective, to promote the replication and promotion of relevant experiences, differentiated strategies should be formulated based on national income levels. For developed countries, it is recommended to focus on decomposing “labor biased efficiency (replacement by smart technologies) and carbon-biased efficiency (clean energy transition)” to align with their “technology-driven emission reduction” needs. For developing countries, emphasizing the analysis of “capital biased efficiency (infrastructure upgrades) and output biased efficiency (transport structure optimization)” is suggested to suit their “dual focus on development and emission reduction”. These global-oriented strategies can also provide reference for optimizing China’s regional emission reduction paths, realizing mutual benefit between domestic and international emission reduction cooperation.
Limitations and Future Outlook
This study has several limitations that warrant further investigation. First, the analysis is conducted at the provincial level without disaggregation into prefecture-level cities or by transport mode (i.e., passenger and freight), potentially overlooking fine-grained spatial and operational heterogeneity at the subprovincial scale. Second, the study period covers 2010 to 2020, capturing only the early stage of the COVID-19 pandemic and excluding post-2021 data that reflect the transport sector’s long-term recovery and the rapid uptake of NEV, thereby limiting insights into recent decarbonization trends. Third, while the proposed EB-PDA quantifies efficiency bias effects and their emission implications, it does not incorporate counterfactual policy simulations to assess the effectiveness of specific emission reduction instruments. Future research could extend the analytical framework to the city or modal level, incorporate updated postpandemic data, and integrate econometric or scenario-based modeling to evaluate region-specific low-carbon policies and offer more actionable implications for road transport decarbonization.
Supplemental Material
sj-docx-1-trr-10.1177_03611981261443295 – Supplemental material for How Do Changes in Efficiency Affect Road Transportation Carbon Emissions? Efficiency-Biased Production-Theoretical Decomposition Analysis
Supplemental material, sj-docx-1-trr-10.1177_03611981261443295 for How Do Changes in Efficiency Affect Road Transportation Carbon Emissions? Efficiency-Biased Production-Theoretical Decomposition Analysis by Xiao Liu, Yumeng Dai, Fei Huang and Dequn Zhou in Transportation Research Record
Footnotes
Author Contributions
The authors confirm contribution to the paper as follows: study conception and design: Xiao Liu, Yumeng Dai; data collection: Xiao Liu, Yumeng Dai, Fei Huang; analysis and interpretation of results: Xiao Liu, Dequn Zhou; draft manuscript preparation: Xiao Liu and Yumeng Dai. All authors reviewed the results and approved the final version of the manuscript.
Declaration of Conflicting Interests
The authors declared no potential conflicts of interest with respect to the research, authorship, and/or publication of this article.
Funding
The authors disclosed receipt of the following financial support for the research, authorship, and/or publication of this article: Authors are grateful to the financial support from the National Social Science Foundation of China (no. 23BGL226).
Supplemental Material
Supplemental material for this article is available online.
References
Supplementary Material
Please find the following supplemental material available below.
For Open Access articles published under a Creative Commons License, all supplemental material carries the same license as the article it is associated with.
For non-Open Access articles published, all supplemental material carries a non-exclusive license, and permission requests for re-use of supplemental material or any part of supplemental material shall be sent directly to the copyright owner as specified in the copyright notice associated with the article.