
Abstract
The Commodity Flow Survey (CFS), a shipper-based survey in the U.S., produces public and confidential data about goods movement. This study examines the characteristics of the uses and users of confidential CFS data by analyzing two datasets: 44 proposals requesting confidential CFS data and the metadata of 849 proposals requesting any confidential data (CFS and non-CFS). The metadata was analyzed to compare proposals requesting CFS with those not requesting it. Both qualitative (human review) and quantitative (machine review using the latent Dirichlet allocation topic model) were applied. Additionally, Transport Research International Documentation (TRID) records were reviewed to compare research using public versus confidential CFS data. Human review of the 44 proposals summarized submitters, research areas, variables, and feedback. Results show high valuation of CFS data, with emphasis on economic topics, strong interest in additional geographic detail, and preference for shipment value over weight. Term frequency analysis showed “supply chain” as the most frequent two-word term in the 44 proposals, while “freight,” most common in TRID records, did not rank among the top 25 one-word terms. Topic models confirmed the qualitative review’s findings, highlighting business and economic themes as central among the 44 proposals. Analysis of the 849 metadata entries revealed the CFS-related topic differed substantially from others, underscoring the dataset’s unique and irreplaceable nature. The qualitative and quantitative approaches complement each other, offering a comprehensive understanding of CFS’s research value. Additional findings are discussed in the paper.
Introduction
The Commodity Flow Survey (CFS) is a shipper-based survey conducted every 5 years in the U.S. through a partnership between the Bureau of Transportation Statistics (BTS), the U.S. Department of Transportation, the U.S. Census Bureau, and the U.S. Department of Commerce ( 1 ). The survey samples over 100,000 establishments in the industries of mining, manufacturing, wholesale trade, auxiliaries (i.e., warehouses and distributions centers), and select retail and service trade industries that ship commodities. Data requested include type of commodities shipped, shipping origin and destination locations, value and weight of shipments, and mode of transportation used for shipping. The collected data provides a comprehensive, multimodal picture of in-scope national freight flows and represents the only publicly available source of data for highway freight ( 1 ). Additionally, CFS is the primary source of data for the Freight Analysis Framework (FAF) program (see the Bureau of Transportation Statistics’ report Comparison of Commodity Flow Survey and Freight Analysis Framework for 2017 Domestic Freight Flows for the comparisons between CFS and FAF in the 2017 data) ( 2 ).
As for the CFS data available to data users, there are two versions: the public release version and the confidential version. Publicly available CFS data can be accessed through the websites of the BTS and U.S. Census Bureau. Confidential CFS data are available through a limited access at the Federal Statistical Research Data Centers (FSRDCs), partnerships between the U.S. Census Bureau, federal statistical agencies, and leading research institutions ( 3 ). The U.S. Census Bureau operates 33 FSRDCs across the country partnering with over 50 research institutions. To gain access to an FSRDC, data users must submit a project proposal through the Standard Application Portal (SAP) that meets the requirements of the agency responsible for the data they propose to use ( 4 ).
To continue to improve CFS data, it is imperative to understand who uses CFS data and for what purpose. There are a few different ways to understand this, such as conducting a survey to users of CFS data and reviewing reports analyzing or citing CFS data. Each has its own unique merits and challenges. For example, asking questions directly to data users through a survey is a good way to collect useful information (e.g., who they are, how they use, for what they use, and what limitation they face). However, there is no comprehensive list of data users that can serve as a sample frame for a survey in general.
Even if such a list is available, it is difficult and time-consuming for the BTS or the U.S. Census Bureau to conduct a survey of the data users. For a federal agency or an entity using federal funds to collect data from 10 or more people, clearance from the Office of Management and Budget (OMB) must be obtained before conducting the survey, as required by the Paperwork Reduction Act (PRA) of 1995, Public Law No. 104-13 ( 5 , 6 ). The process of obtaining clearance can take considerable time and involves several tasks, including developing Supporting Statements Part A, which justifies the data collection to ensure compliance with the PRA requirements and other associated laws, and Part B, which outlines the sampling plan and statistical methods ( 7 ). Additionally, it requires preparing and testing a survey questionnaire, obtaining approval through an internal agency review, posting the data collection plan in the Federal Register for public comments, and, if necessary, revising the plan to reflect those comments. In summary, conducting a survey is not a trivial task, even if potential respondents have been identified. It should be noted that PRA clearance has been obtained for each of the CFS data collections.
Continuous efforts have been made to understand the uses and users of public release CFS data without conducting a formal survey. For example, the Innovations in Freight Data Workshops, hosted biennially by TRB since its inauguration in 2017, have served as a venue to collect feedback from CFS data users. The summary of the most recent Innovations in Freight Data Workshop (September 19–21, 2023) is documented in Transportation Circular ( 8 ). In addition, freight-related committees of TRB facilitate collection of needs and expectations of CFS data by email solicitation to their members and friends. It should be noted that discussion and conversation at public conferences, webinars, and forums are exempt from PRA clearance, which enables the collection of input from data users ( 5 ).
However, comparable efforts have not been undertaken for confidential CFS data, primarily because of the absence of such established mechanisms for gathering input, as are available for public CFS data. A total of 44 proposals have been found to request confidential CFS data in 2011–2022. Thus, it would be possible to construct a sample frame for a survey targeting all users of confidential CFS data by listing submitters of the proposals. However, conducting the survey presents the challenge of obtaining PRA clearance. Moreover, to develop an effective survey, it is necessary to understand the general characteristics of the target population, which could be done through the approaches used in this study.
Because 44 proposals were deemed feasible for human review, it would be possible to understand the uses and users of confidential CFS data by human reviewers reading the proposals with predetermined review focuses. Difficulties would arise if new review focuses were established or if the predetermined focuses needed to be changed during the reviews, as occurred in this study. In addition, it was challenging to quantify certain aspects of the reviews, such as the frequency of specific words and phrases found in the proposals such as “export” and “supply chain.” Listing all relevant words and phrases of interest was infeasible before reviewing the papers.
The overall goal of this study is to understand the characteristics of the uses and users of confidential CFS data. Specifically, this study aims to identify the types of data user, the research areas where CFS data are used, the frequently used data elements, and the desired data elements that are lacking in the current data. The study also aims to uncover themes shared among the proposals. These aims were achieved by reviewing the proposals requesting access to confidential CFS data. Additionally, this study examines whether proposals requesting access to CFS data differ from those that do not. This was done by reviewing the metadata of all proposals requesting confidential data, both with and without CFS requests. The metadata analysis provides a broad perspective on the use of confidential data, including CFS data.
The study used both human review (i.e., review by human readers) and machine review (i.e., review by computer program). These two types of review are intended to complement each other, and this study sought to shed light on how they could be used effectively. It is noteworthy that this study represents the first effort specifically aimed at understanding the uses and users of confidential CFS data.
Differences between Two Versions of CFS Data
Publicly available CFS data can be accessed through both BTS and U.S. Census Bureau websites. For example, the BTS webpage (https://www.bts.gov/topics/historical-cfs-data) links to multiple U.S. Census Bureau data portals, including Census Enterprise Dissemination Services and Consumer Innovation (CEDSCI) visual tables, ZIP download tables, microdata files, and API endpoints. Data users can access the CFS Public Use File (PUF) which provides shipment-level information and can be used by anyone for any purpose. Although PUF and confidential CFS data both provide detailed shipment-level information, there are noticeable differences. PUF requires thorough disclosure avoidance procedures by the U.S. Census Bureau to remove any possibility of establishment disclosure ( 5 ). Such protections include data top coding, noise application, and collapsed variable categories. Meanwhile, confidential CFS data are not subject to these same protections because of the restricted access in place, and includes establishment-level response information. Confidential CFS data is often referred to as “T13” data because it was collected under the authority by Title 13 of the United States Code, which protects the confidentiality of the data collected from individuals and businesses. The major differences are summarized in Table 1 ( 9 ):
Differences in Maximum Level of Detail between Two Commodity Flow Survey (CFS) Data Sources
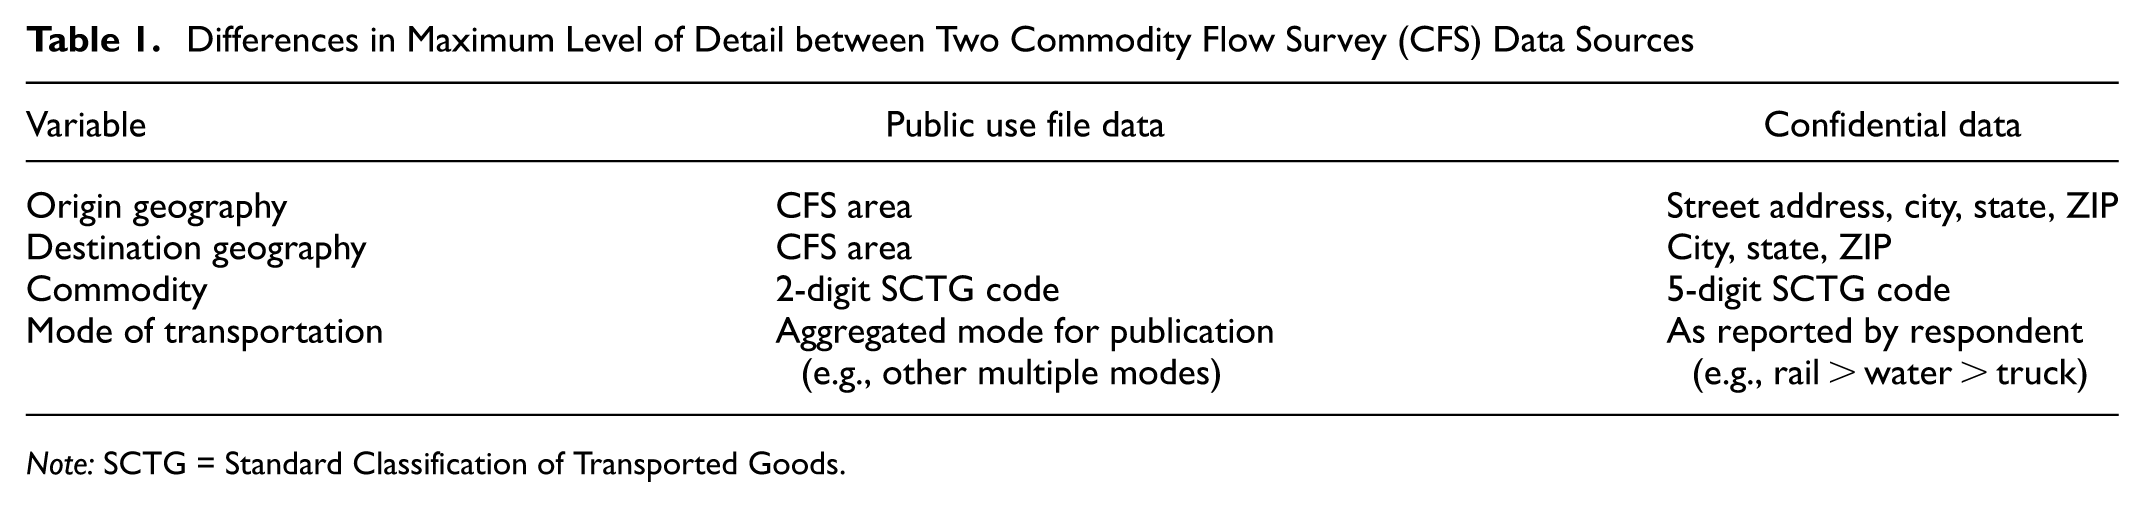
Note: SCTG = Standard Classification of Transported Goods.
Detailed modeling and analysis work would benefit from access to confidential CFS data. However, any research, estimates, or products produced from its use must also undergo disclosure avoidance procedures to prevent unauthorized disclosure.
Methods
Acquisition of Study Data
We obtained two sets of text data for this study: 1) project metadata and 2) project proposals. Project metadata are available in spreadsheet format containing metadata of proposals having requested data access and available for download at the U.S. Census Bureau website. The metadata contain project title, abstract, FSRDC location, principal investigator, project start year, submitters, and datasets requested in proposals ( 10 ). We downloaded the metadata file on October 17, 2023, including a total of 849 proposals requesting access to about 230 datasets (e.g., CFS, Annual Retail Trade Survey, Longitudinal Employer-Household Dynamics, Longitudinal Business Database, Census of Manufactures, and Foreign Trade Data) from 1998 through 2023. Among the 849 proposals, the Washington, DC, FSRDC was the most frequently requested site for data access (95 proposals), followed by the Boston FSRDC (93 proposals), the Chicago FSRDC (80 proposals), and the Michigan FSRDC (63 proposals). On average, each proposal requested between eight and nine datasets, with the number of datasets requested ranging from a single dataset to as many as 58.
Project proposals are documents in PDF format, submitted through the SAP that meets the requirements of the agency responsible for the data that the proposals intend to use ( 4 ). Proposals must show a benefit to U.S. Census Bureau programs, have a statistical purpose, require non-public data, be feasible given the data, and pose no risk of unauthorized disclosure. If approved, data users need to obtain security clearance to access confidential data through FSRDCs.
We requested the U.S. Census Bureau to share the proposals that requested access to confidential CFS data and obtained 44 proposals which requested access to confidential CFS data in 2011–2022 in a secured manner in February and November, 2023. The proposals describe a research plan, uses of the requested data, funding sources, processes to ensure confidentiality, intended FSRDC locations for data access, and benefits to the U.S. Census Bureau incurred from the research work. They usually describe the topic of investigation, describing its importance and the extent of current research into the field. The proposals have well-defined research questions and specific plans for most of the data they request. There was a great variation across the proposals in details of research focus, specific uses, and analysis methods.
Analysis of Study Data
Two approaches were used to analyze user engagement with confidential CFS data: qualitative and quantitative approaches. The qualitative approach (human review) uses humans to read the proposals and extract contents. The review results are summarized and presented in tabular and graphical formats. The quantitative approach (machine review) uses a computer to read the proposals and extract contents, specifically text analytics to extract texts from the spreadsheet file and the PDF documents, convert them to numerical representation, and perform quantitative analysis on the numbers.
Qualitative Approach
A qualitative approach was used to extract and analyze the substance of the proposals. We divided the 44 proposals roughly evenly between two of this paper’s authors, each of whom read and summarized their respective works. They identified the proposals’ focal research topics, mentions of CFS keywords, and variables used for study; additionally, they identified the context for the use of CFS data and limitations that CFS data posed to those who submitted the proposals. They noted methods that were planned to be used, highlighting those that were interesting or novel. Proposals that mentioned the high importance of CFS data for certain techniques were recorded. The professional associations of the proposals’ submitters were also captured. These findings were then consolidated into a single document.
Quantitative Approach
A quantitative approach was used to complement the qualitative approach and text analysis techniques were applied. Text analysis is a method to quantify the frequency of text, such as words found in a document. “Text” is considered as unstructured data and often contain information (e.g., words) not relevant to the study of interest. A series of preprocessing steps was performed to convert unstructured text data into structured text data formats suitable for analysis. To quantify text data, “term frequency” was used, defined as the number of times a term appears within a document. The calculation involves simply counting the frequency of each term in the document. The overall flow of text analysis process is visually summarized in Figure 1, and R software was used to process and analyze the text data.
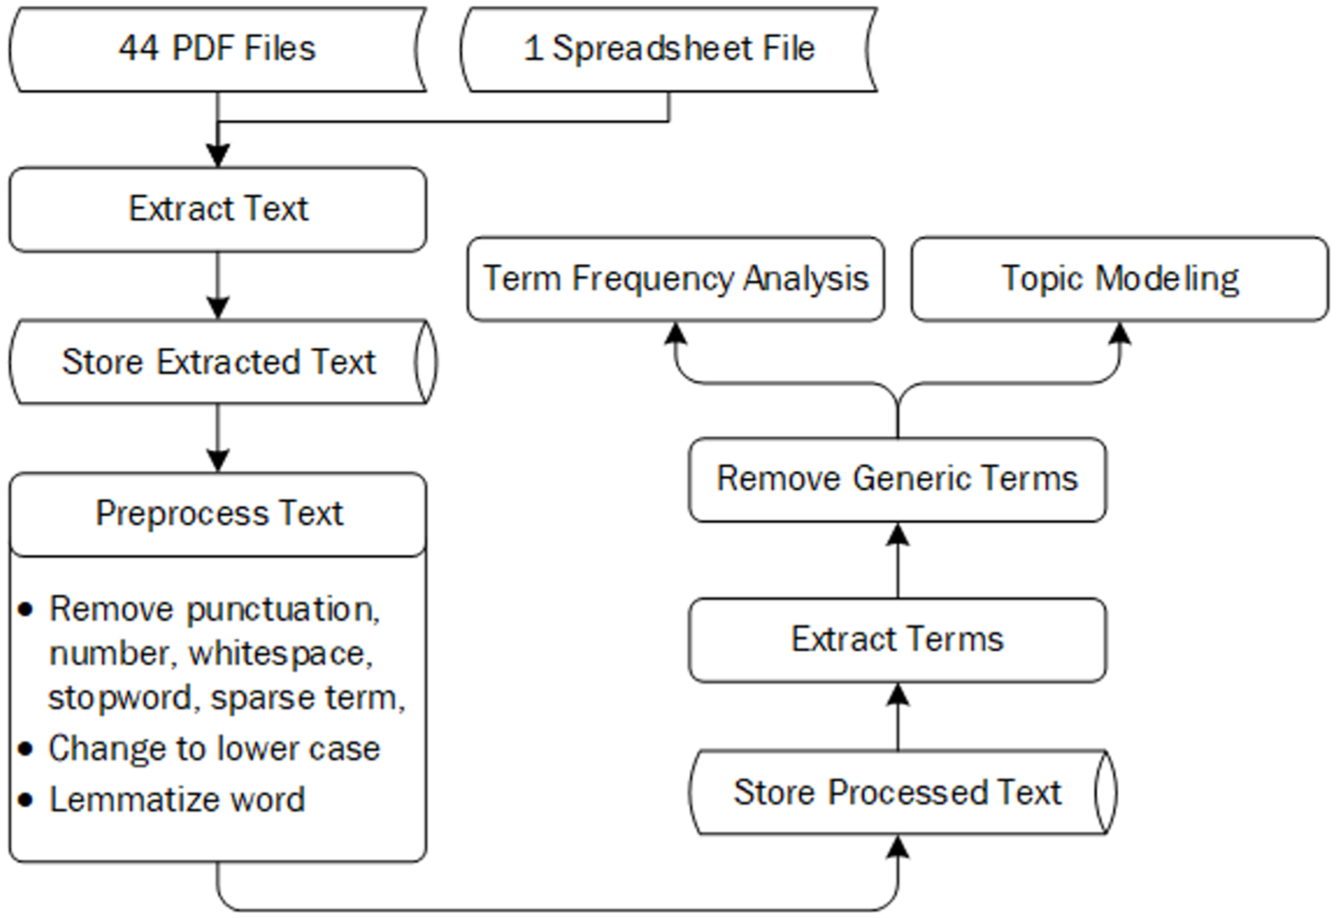
Workflow of text analysis for project metadata and proposals.
As for the 44 project proposals in PDF format, an R script was developed to detect the .pdf extension of all files in the working directory and create a vector storing the file names. Text extractions were then performed with the vector created as input. Specifically, the pdf_text() function in R was used to render all textboxes on a text canvas and returned a character vector of a length corresponding to the number of pages in the PDF file ( 11 ). The length in pages of each file was also extracted. The texts extracted from all the 44 files were stored in a single data object, with an indication of the source file. As for the spreadsheet file storing the metadata of the 849 project proposals, the text from the title and abstract columns was extracted and stored in separate datasets.
Preprocessing the text involved several tasks, including removing punctuations, numbers, and whitespaces, converting the text to lowercase, and applying stemming and lemmatizing to the words. Removing specific types of character and converting to lowercase are self-explanatory. “Stop words” are terms that do not contribute significantly to the semantics of the content and are typically removed during preprocessing. Removing stop words helps reduce the size of the dataset, which not only improves processing efficiency but also shortens training time ( 12 ). Custom stop words that were deemed irrelevant for the analysis and removed included “can,”“use,”“using,”“used,” and “also,” as well as quotation marks, dashes, and other words not related to the subject of focus from the extracted texts. Lemmatization relies on accurately determining the intended part-of-speech and the meaning of a word based on its context to reduce the word to its root form. For example, a lemmatization algorithm can map “runs,”“running,” and “ran” to the root form (i.e., lemma) of “run” ( 13 ).
Stemming is a technique used to reduce inflected or derived words to their base or root form, known as the “word stem.” This process helps to normalize words and group together different forms of the same word, making text analysis more efficient by treating variations of a word as a single entity. For example, the words “programming,”“programmer,” and “programs” all can be reduced to the common word stem “program.” Stemming algorithms work by identifying and removing common prefixes and suffixes found in inflected or derived words and it uses a list of frequent affixes to truncate the end or beginning of the word, reducing it to its root form ( 13 ). It should be noted that stemming was initially attempted and resulted in undesirable outputs. For example, stemming “productivity” and “products” resulted in the same word “product” and the meaning of “productivity” was lost. As a result, stemming was not applied for this analysis, and consequently, is not shown in Figure 1.
For the analysis of texts from the 44 proposals, additional preprocessing was performed to remove infrequently occurring words, using a sparsity parameter in which the analyst specifies the proportion of documents in which a term must appear to be retained ( 14 ). “Sparsity” indicates how often certain terms appear in the documents. For example, the sparsity parameter of 0.90 retains terms that appear in at least 90% of the documents, while terms that appear in fewer than 90% of the documents are removed. This parameter is determined based on the analyst’s judgement considering the study purpose and needs.
In addition to removing stop words, additional words were removed based on preliminary term frequency analysis. Those words, called “generic terms” in this study, include “year,”“paper,”“ et al.,” and “different,” as few examples. Identifying generic terms for removal is an iterative process and depends on the field of the study. In addition, the number of words to be considered together is also an important consideration. Thus, identifying and removing generic terms were performed separately for one-word, two-word, and three-word terms.
Term frequency analysis was conducted by counting and displaying the most frequently appearing terms in a bar chart. A term can consist of more than one word. This study explored the number of words for a term and limited it to three words for succinctness and created bar charts, called “N-gram” (i.e., unigram) for one-word terms, “bigram” for two-word terms, and “trigram” for three-word terms. This analysis reveals focuses of text based how frequently each term appears across the documents.
Topic modeling was conducted to identify underlying topics or themes using natural language processing (NLP) and text mining methods. Topic modeling leverages computing power and automation to systematically explore and analyze large volumes of text data, enabling identification of underlying themes ( 15 ). It was applied on the extracted words to discover topics characterizing the projects in the project metadata and proposals. Among many topic models, the most frequently used one, latent Dirichlet allocation (LDA), was used. LDA is a Bayesian hierarchical probability generation model capturing similarities across different data components. Each data component consists of a document, and the collection of documents is referred to as a corpus. A document is considered as a mixture of topics, where each topic is a probability distribution over a set of terms; in this framework, each document itself is a probability distribution over a set of topics ( 12 ). Topics are identified when similar sets of words consistently occur together across multiple documents. These recurring word patterns help to cluster related terms and group them into distinct topics.
The number of topics needs to be determined before estimating a topic model and there are various ways to determine the number of topics ( 16 ). It should be noted that the true number of topics is unknown. It can be determined by an analyst based on their expert judgement and/or a quantitative method. This study employed both methods—a quantitative method on the project metadata, specifically the harmonic mean technique, and an expert judgement in conjunction with a quantitative method on the project proposals. For topic modeling of the project proposals, the most appropriate topic for the given number of topics was chosen based on coherence. Coherence score measures how well a topic is supported by text. A higher value of coherence indicates that the LDA model is performing well, with specific topics representing the text being analyzed more accurately. This suggests that the terms within each topic are more semantically related, making the topic more meaningful and interpretable. The UMass coherence score, commonly used for evaluating topic models, was calculated to assess the quality of the topics generated by the LDA model ( 17 ). This score helps determine how well the top terms within a topic are related to each other, with a higher score indicating better coherence and more meaningful topics.
It is important to note that topic models, such as LDA, are multi-membership models, meaning that a single document can be associated with multiple topics or themes. This characteristic requires a sufficient volume of text to properly develop a topic model. While there is no universally established threshold for the minimum word count in topic modeling, it is generally recommended that a corpus contain at least a few thousand words, with each individual document consisting of several hundred words, to ensure meaningful topic extraction.
Results and Discussion
The results from the analysis of the texts using both qualitative and quantitative approaches are summarized and discussed separately. The qualitative approach was performed by two human reviewers, while the quantitative approach was executed by R 4.0.2 and RStudio 2023.12.1.
Qualitative Approach
The results are summarized separately for submitters, research areas, data elements, and feedback. The 44 project proposals have a median length of 18.5 pages, with the longest being 34 pages and the shortest being six pages. Each proposal contains an average of 7,910 words, with a range from 1,897 to 12,138 words and a median of 8,037 words.
Submitters
Most of the submitters listed in the proposals were associated with universities. Some submitters specified their academic association with graduate-level business schools within universities. Other submitters named themselves as members of the National Science Foundation or the Federal Reserve Board. Finally, a few submitters cited their associations with the National Bureau of Economic Research and the U.S. Department of Agriculture. The number of submitters noted in a proposal ranges from one to nine, with a median of three submitters, as shown in Figure 2.
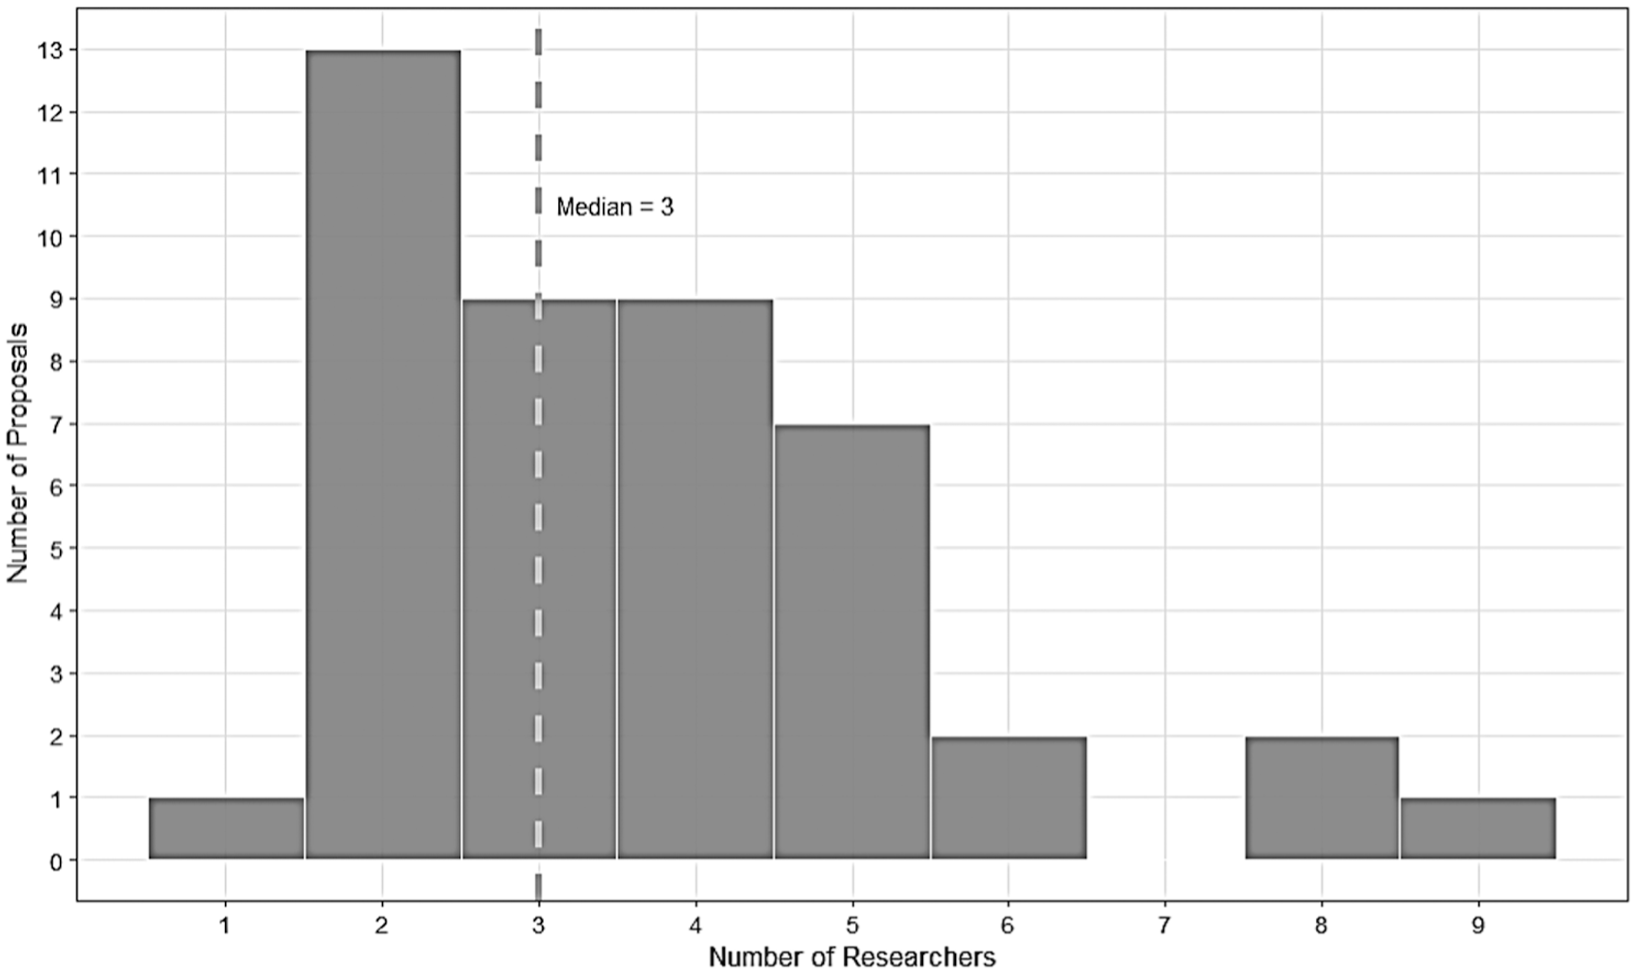
Number of participating submitters in the 44 project proposals requesting confidential Commodity Flow Survey data (2011–2022).
The submitters looking to access confidential CFS data were well-credentialed and generally worked in economic research. Academic economic research appears to receive strong interest. It may be possible that less-credentialed researchers faced roadblocks to submitting proposals for accessing confidential CFS data. More research would be necessary to consider this issue, but the priority for confidential CFS data is to maintain their federal confidentiality requirements; it is expected that such data protections prevent full, unfettered accessibility that would be ideal for less sensitive data products.
Searching for articles and papers at Transport Research International Documentation (TRID) with a keyword of “commodity flow survey” limited to articles, papers, reports, books, collections, and records with abstracts brought up 378 entries (as of April 29, 2024). TRID is an integrated database combining the records from TRB’s Transportation Research Information Services (TRIS) database and Organisation for Economic Co-operation and Development (OECD)’s Joint Transportation Research Centre’s International Transport Research Documentation (ITRD) database ( 18 ). Many of these entries were papers from transportation-related journals such as Transportation Research Record, Transport Policy, and Research in Transportation Business and Management. Many of them appear to have used publicly available CFS data and tables. Among the 378 entries, the vast majority (363) included “freight” in their records.
Research Areas
Every proposal except one involved economic research. The specific areas of research can be roughly divided into four categories: business practices, market phenomena, high-level trends, and synthesis approaches. A few proposals incorporated work in the field of public health in association with pandemics and pollution. Table 2 summarizes research areas in the four categories.
Categorization of Research Areas Identified in 44 Project Proposals Requesting Confidential Commodity Flow Survey Data
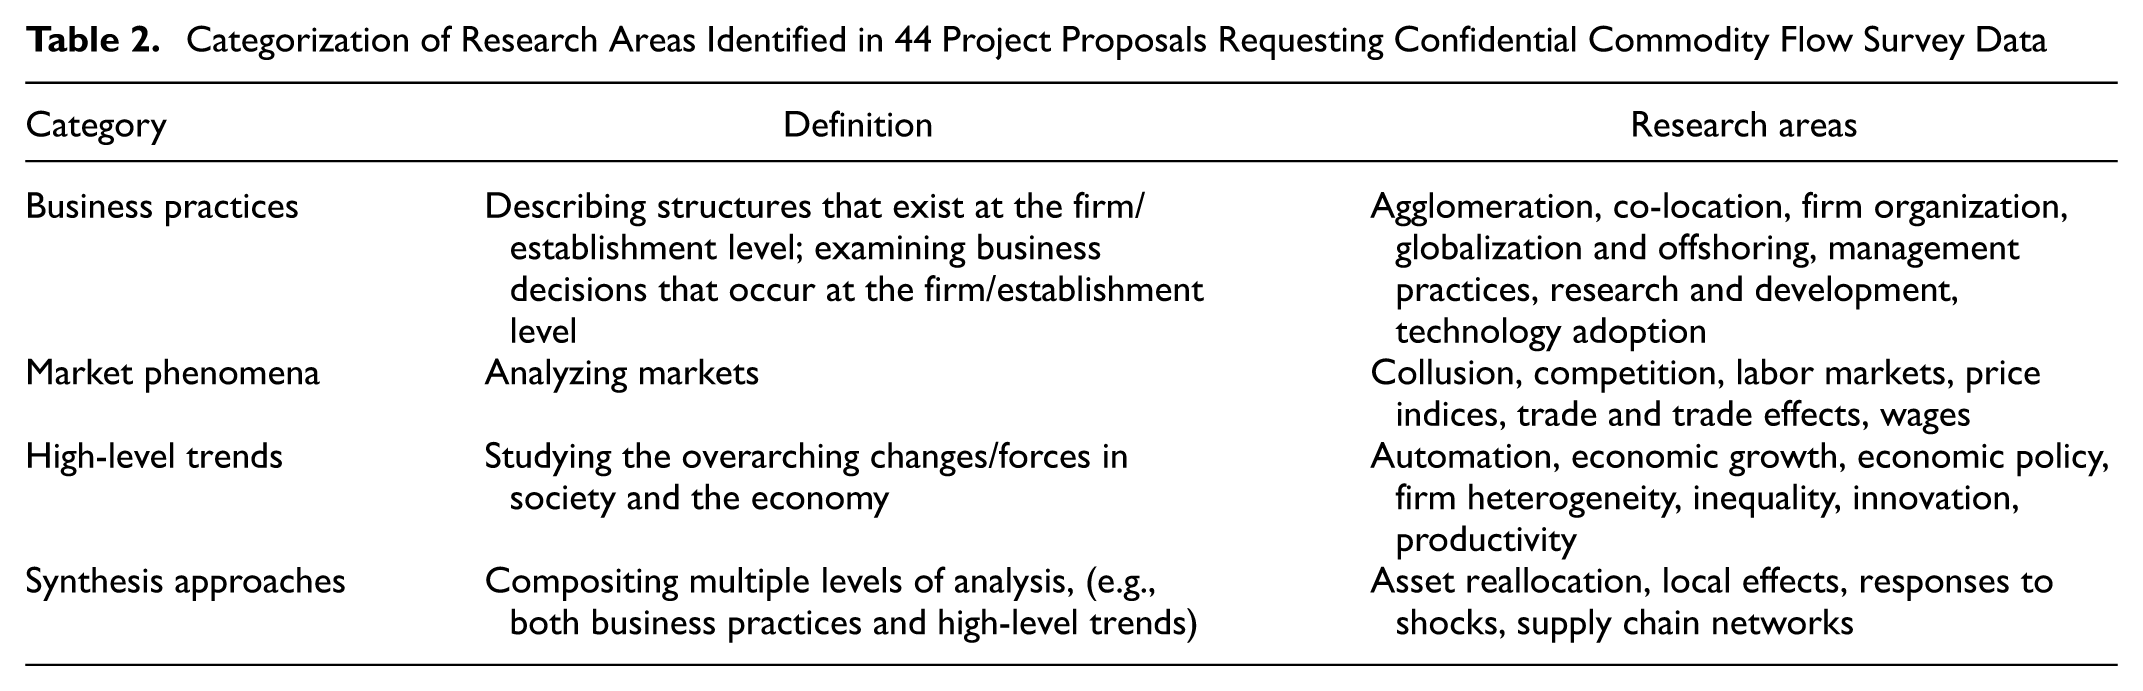
It should be noted that these four categories of research area were identified as the human reviews progressed and correspond to key topics within each proposal, rather than to the individual proposals themselves. Each proposal generally addresses multiple topics, which may span across more than one category in the table. For example, many proposals include topics that are classified under the category “Synthesis approaches.”
Data Elements
Intended use of specific CFS variables was mentioned in the proposals and is summarized in Figure 3. Specifically, geographic variables, such as origin and destination of shipments, were the most used, in 31 proposals, while shipment value was used the second most, in 21 proposals. The export and commodity (Standard Classification of Transported Goods [SCTG]) variables were used by 12 proposals, respectively, shipment weight used by nine proposals, shipping distance and import variables by four proposals each, and shipping mode and industry (North American Industry Classification System [NAICS]) variables by three proposals each.
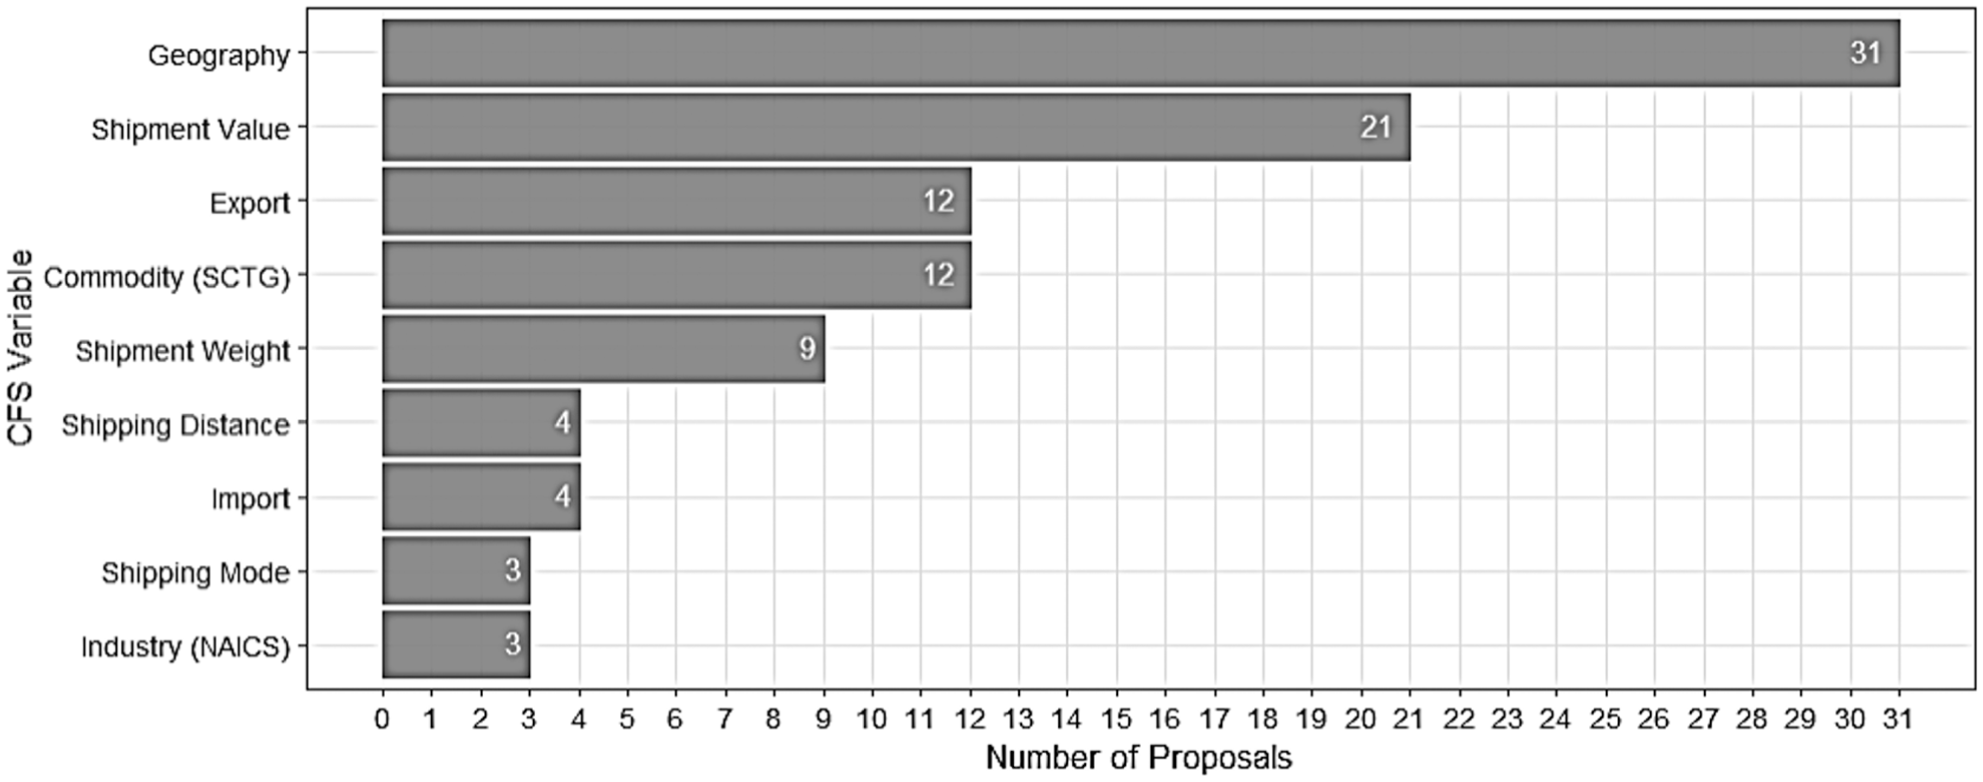
Bar plot of Commodity Flow Survey (CFS) variables found in the 44 project proposals requesting confidential CFS data (2011–2022).
Clearly, the geographic information provided by CFS is useful to data users, suggesting that even more geographic data may be considered for provision to users. The geographic information is used not only for analysis but also for data linkage across different datasets. It is unsurprising that proposals which primarily focused on economic aspects place greater emphasis on shipment value rather than shipment weight. Similarly, economic researchers favored export research and commodity analysis.
Shipping mode is a key variable for transportation practitioners and researchers, yet it has garnered limited attention in research utilizing confidential CFS data. Given that the majority of the proposals focus on economic research, it is somewhat surprising that NAICS did not receive higher attention, as it is closely associated with economic analyses. However, it is possible that NAICS information is available in other datasets requested alongside CFS data, potentially explaining the relative lack of interest in it in these proposals.
Feedback
CFS data were found to be highly important to a majority of the proposals. Most feedback was of a more general nature: each proposal described the benefits to the U.S. Census Bureau that follow the proposed research and, in these sections, submitters often noted small flaws or data gaps in existing census data. However, 38 of the 44 proposals described how CFS data would be used, and the data were characterized as indispensable for many analysis subjects, such as firm-level trade, supply chain, market size, changes in firm shipping because of shocks, geography of firm sales, cross-industry connections, linkages between regions and industries, transportation because of firm shipping, and shipping mode choice.
Several proposals incorporated explicit feedback about CFS data. Specifically, data users requested variables such as fuel price, shipping speed and cost, weight-to-value ratio, and destination firm. Finally, several proposals raised the issue that agriculture analysis is made difficult by the CFS scope design, because livestock and food shipped from farms are outside its scope.
This explicit feedback primarily reflects demands for more data, a common request across most data collection programs. Meeting these demands is challenging, mainly because the resources allocated for data collection have remained relatively constant over time for most data programs. However, by leveraging administrative records and technological advancements, it may be possible to collect more data and more detailed data without exceeding the current resource constraints.
Adding more data involves two key aspects: increasing shipment records and including additional data elements in the data collection. For CFS, more shipment records could be achieved through the cooperation of shippers who maintain shipment records in databases, along with the system capabilities to collect and process large volumes of data stored in various formats. For 2022 CFS, BTS and the U.S. Census Bureau received an entire shipment log for limited reporting periods, rather than sampled records, from certain shippers. The 2022 CFS collected about 100 million initial unvalidated records, compared with about 6 million final validated records in 2017. The final number of validated records for the 2022 CFS is expected to be approximately 83 million. The 2022 CFS final tables (CEDSCI and visual) were released on June 26, 2025, and the 2022 CFS PUF is scheduled for release in Fall 2025 ( 19 ).
For future data collection, ongoing efforts should focus on encouraging more shippers to provide complete shipment logs, while also exploring methods to capture key data elements without adding to their reporting burden. For instance, during the 2022 CFS, several large firms took advantage of the bulk data submission option, as they typically maintain shipment records in database systems. In contrast, smaller businesses often keep invoices and shipment logs in less structured formats, such as PDFs or paper documents. Leveraging intelligent document processing tools that combine artificial intelligence with optical character recognition can help transform these unstructured formats into machine-readable text, which can then be extracted and stored in databases in usable formats for CFS.
Collecting additional data element is another key demand for more data. Shipping cost, as highlighted in the feedback of the qualitative review of this study and through feedback channels for public CFS data, such as the Innovations in Freight Data Workshops, is an important and useful piece of information ( 8 ). This is being explored for inclusion in future data collection efforts.
It should be noted that adding a question to the CFS questionnaire involves significant preparation, coordination, and approval. One of the considerations is estimating the time a respondent would spend answering the additional question, including the time required to retrieve and maintain information. Adding a question increases the total time burden on respondents, and this increase must be justified in the submission of the information collection request to OMB. Another consideration is conducting cognitive interviews for the new question to ensure that respondents understand and answer the question as intended. These interviews help identify potential issues with question clarity and interpretation, ensuring that the data collected is valid and reliable. In summary, while adding a question may seem straightforward, the process of integrating it into the survey questionnaire is more complex and time-consuming than it appears.
The feedback provided in the proposals offers new insights into the needs of data users, and also confirms data gaps that we had previously recognized through public channels. It aligns, to some extent, with the demand for additional data that has been recognized by users of public CFS data. The types of analysis for which CFS is essential should be further researched, and any future changes to CFS should aim to facilitate these analyses. Some of the desired information is challenging to collect because of the nature of CFS. For instance, agriculture and international trade are out of the scope of CFS. To complement CFS in these areas, FAF was developed by collecting and integrating additional data into CFS.
Quantitative Approach
Text analysis was separately performed on the project metadata and proposals. Potential differences between proposals that request access to CFS data and those that do not were examined. The evaluation was carried out through analysis of the metadata associated with all proposals submitted for confidential data, including both those with and without CFS requests. This process yielded a comprehensive overview of the utilization of confidential data, with particular attention to CFS data.
Metadata of 849 Project Proposals
Metadata of the 849 proposals, referred to in this paper as the “849 metadata entries,” were analyzed by term frequency and topic modeling, focusing specifically on two elements: the title and the abstract ( 10 ).
Term Frequency Analysis
Titles and abstracts from the metadata were examined to gain a general understanding of the focus of the 849 metadata entries. Three separate analyses were performed by the number of words in a term: one-word term, two-word term, and three-word term. In addition to general stop words, generic terms were further removed to uncover popular terms reflecting the characteristics of the proposals.
Frequently found one-word terms appearing at least 20 times in the titles and at least 200 times in the abstracts are summarized. The term “firm” comes at the top, 155 times, followed by “market” (91), “labor” (90), “business” (53), “productivity” (51), and so on, in the titles. As for the terms in the abstracts, “firm” is the most found word (1,695 occurrences), followed by “market” (599), “business” (533), “economic” (509), “establishment” (493), and “labor” (490). The terms appear to be related mostly to business, economy, and labor, such as firm, market, employment, trade, and worker, but to cover a range of subjects such as house, health, innovation, social, and residential. The top two one-word terms are the same in both the titles and abstracts. However, it is difficult to understand the focuses of the proposals based on a single word. For example, “house” could be an economic issue when a term “market” is attached while could be a social issue when “low-income” is attached.
To develop better insights from the titles and the abstracts, terms composing two adjacent words (i.e., two-word terms) were examined, and those from abstracts are visualized in the bigram in Figure 4. The results provide more clear understanding of the proposals. “Labor market” comes top and “firm level,”“health insurance,”“establishment level,”“plant level,” and “household dynamic” follow. The terms are closely related to business and economic aspects, although some distinctive terms such as “residential segregation,”“criminal justice,” and “information technology” also emerge. Consecutive three words (i.e., three-word terms) were also examined in the title and abstracts. “Labor market outcome” appeared the most, with 18 occurrences in the titles, and 44 occurrences in the abstract.
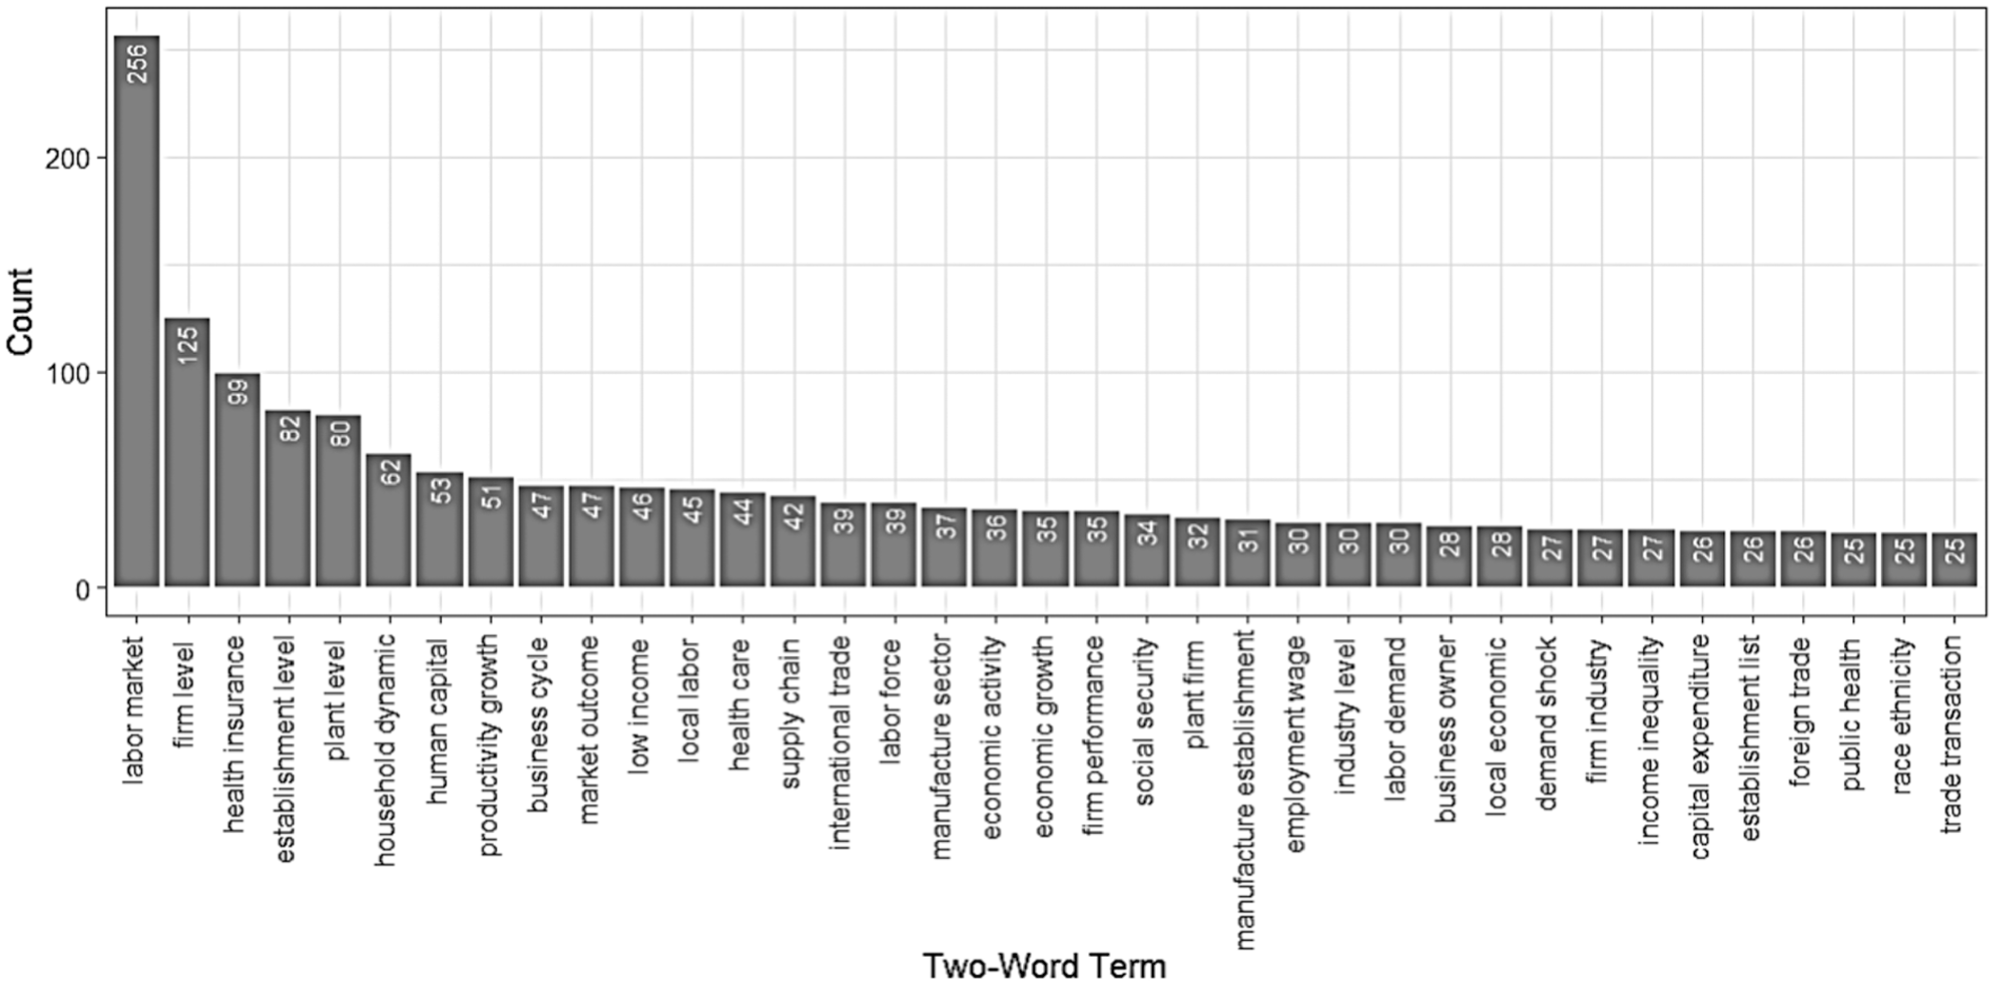
Bigram of two-word terms in abstracts of the metadata of the 849 project proposals requesting confidential data (1998–2023).
Figure 5 presents the two-word and three-word terms as a word cloud, with a different number of terms included—the top 100 terms are shown in the cloud. “Firm” and “labor market” stand out as the top one-word and two-word terms. In the two-word cloud, the top terms appear alternately above and below “labor market,” generally matching the bigram (Figure 4). Although the clouds visually appear informative, a key caveat is the absence of quantitative information (word frequency).

Word cloud of one-word and two-word terms in abstracts of the metadata of the 849 project proposals requesting confidential data (1998–2023): one-word terms (left) and two-word terms (right).
The 849 metadata entries cover various subjects yet mostly explore issues in business, economy, and labor market. Two-word terms appear to provide clearer insights into project characteristics than either one-word or three-word terms.
Topic Modeling
To discover latent topics of the 849 metadata entries, topic modeling was performed using an LDA model. However, typical topic models such as LDA are not well-suited for analyzing short text because they assume each document can belong to multiple topics, which are considered as multi-membership models. In contrast, the Short Text LDA with Clustering model, which assumes that each document belongs to only one topic, is better suited for analyzing short text and could be more effective for this type of data ( 20 ). Although there is no established threshold for the minimum number of terms required for topic modeling, it is generally recommended that the corpus includes at least a few thousand terms, with each individual document containing few hundred terms. For the titles of the 849 metadata entries, the average term count is 10, ranging from 2 to 31. This low term count in each document limits the effectiveness of LDA topic model, making it unsuitable for this context.
On the other hand, the abstracts contain an average of 200 terms, ranging from 15 to 1,042, and were deemed acceptable for topic modeling. The initial corpus, constructed from the abstracts, contains 172,718 tokenized terms, indicating the abstracts are suitable for LDA topic modeling. It should be noted that six proposals had no text in the abstract column of the metadata file, meaning a total of 843 abstracts were used for topic modeling.
The number of topics was determined based on the harmonic mean method ( 21 ). To find the optimal number of topics for the corpus, a sequence of LDA models was estimated based on Gibbs sampling by ranging the number of topics from 2 to 100 by an increment of 1; Gibbs sampling tends to produce more coherent and interpretable topics ( 22 ). The number of topics (n = 47) corresponding to the highest harmonic mean of the log-likelihood values of the models was determined to be optimal. This suggests existence of diverse themes among the 843 abstracts.
Top five terms were extracted to express the 47 latent topics, which are plotted in Figure 6. The topics show diverse issues ranging from technology, health, and diversity to education, energy, and immigration. The most frequent topic is associated with trade, including export and import, followed by topics associated with innovation and technology, health care, and ethnic issues.
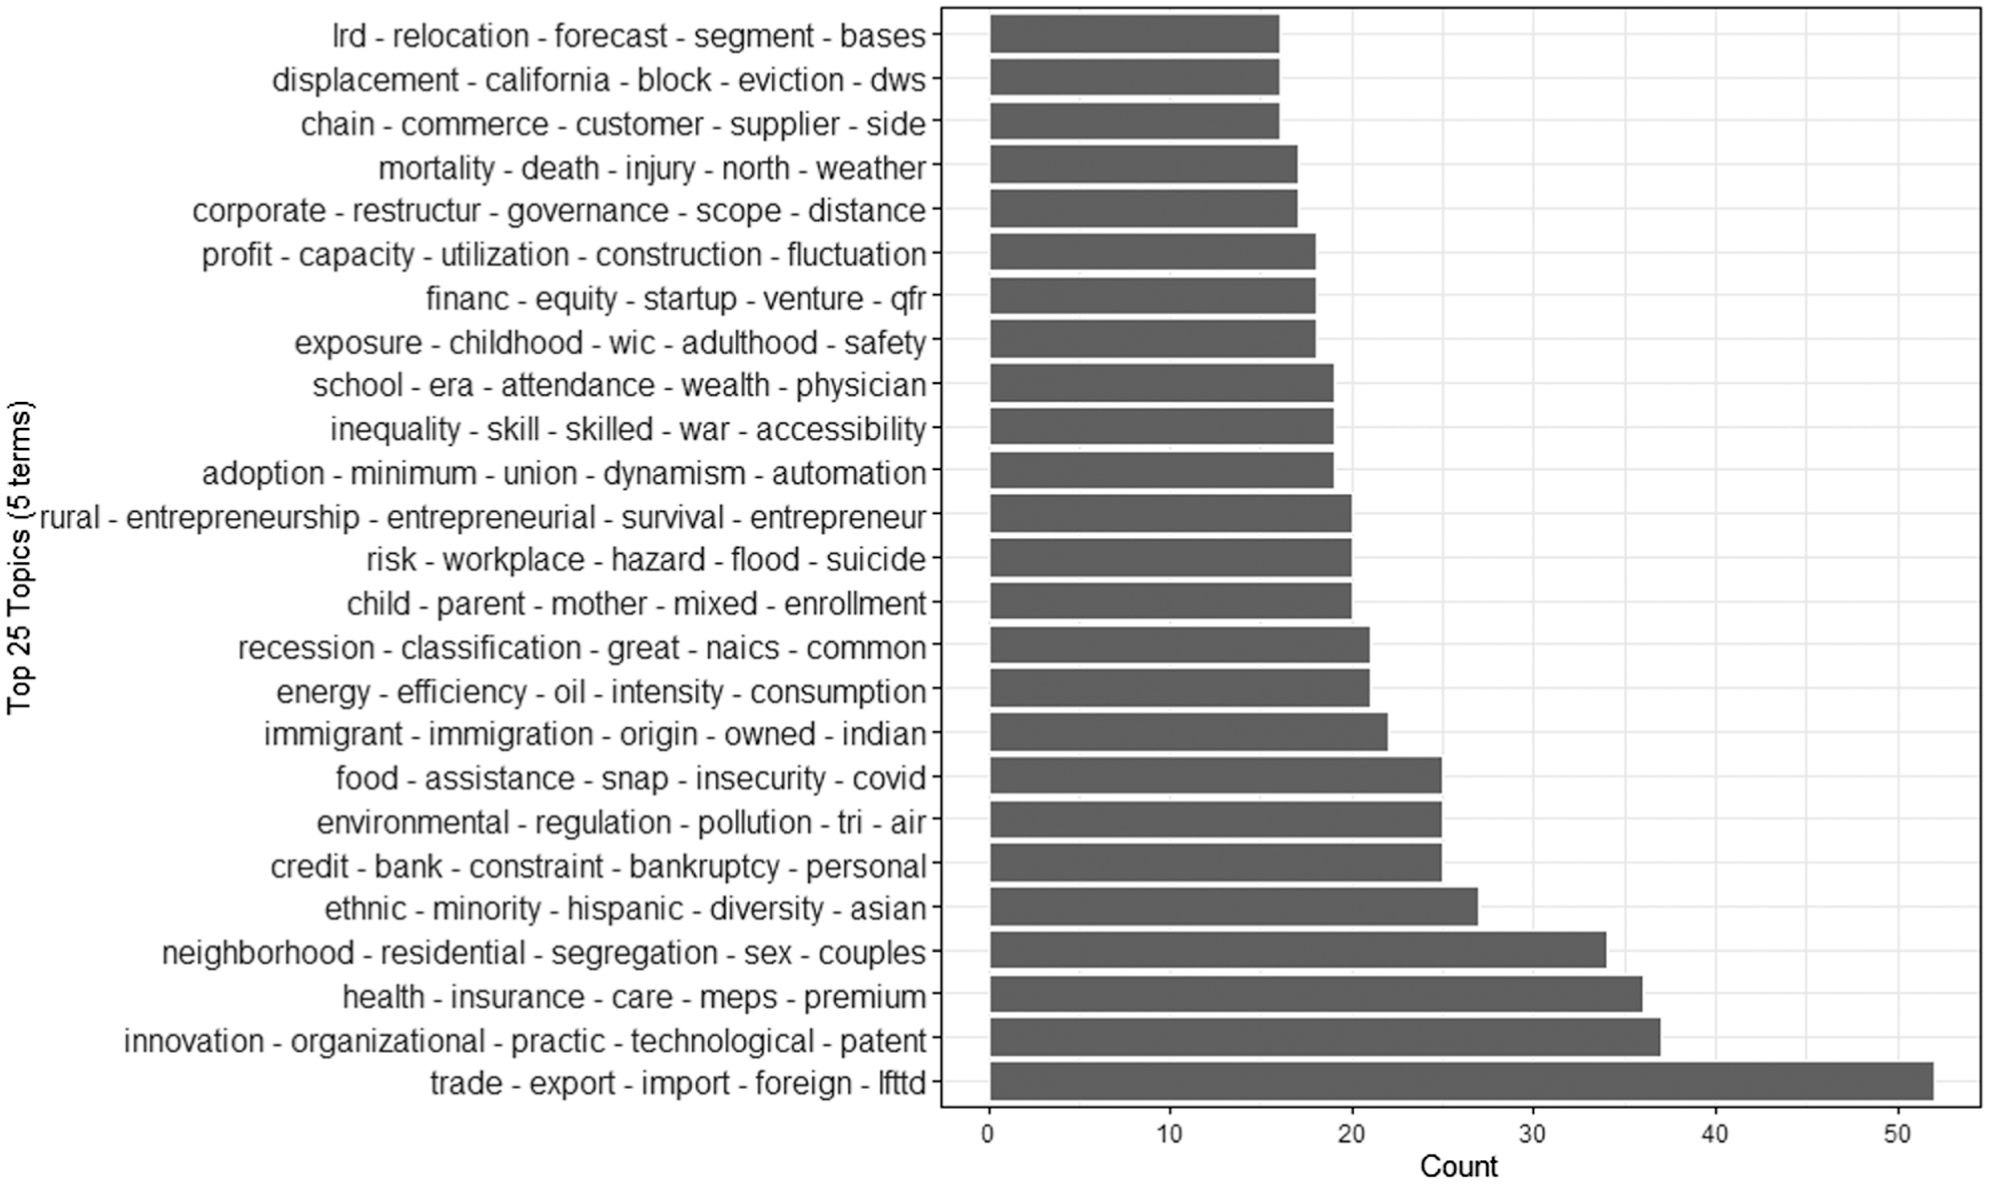
Top 25 five-term topics generated from the abstracts of the 843 proposals requesting confidential data (1998–2023).
To effectively visualize and interpret topics generated by LDA topic modeling, LDAvis was used to create Figure 7 ( 23 ).
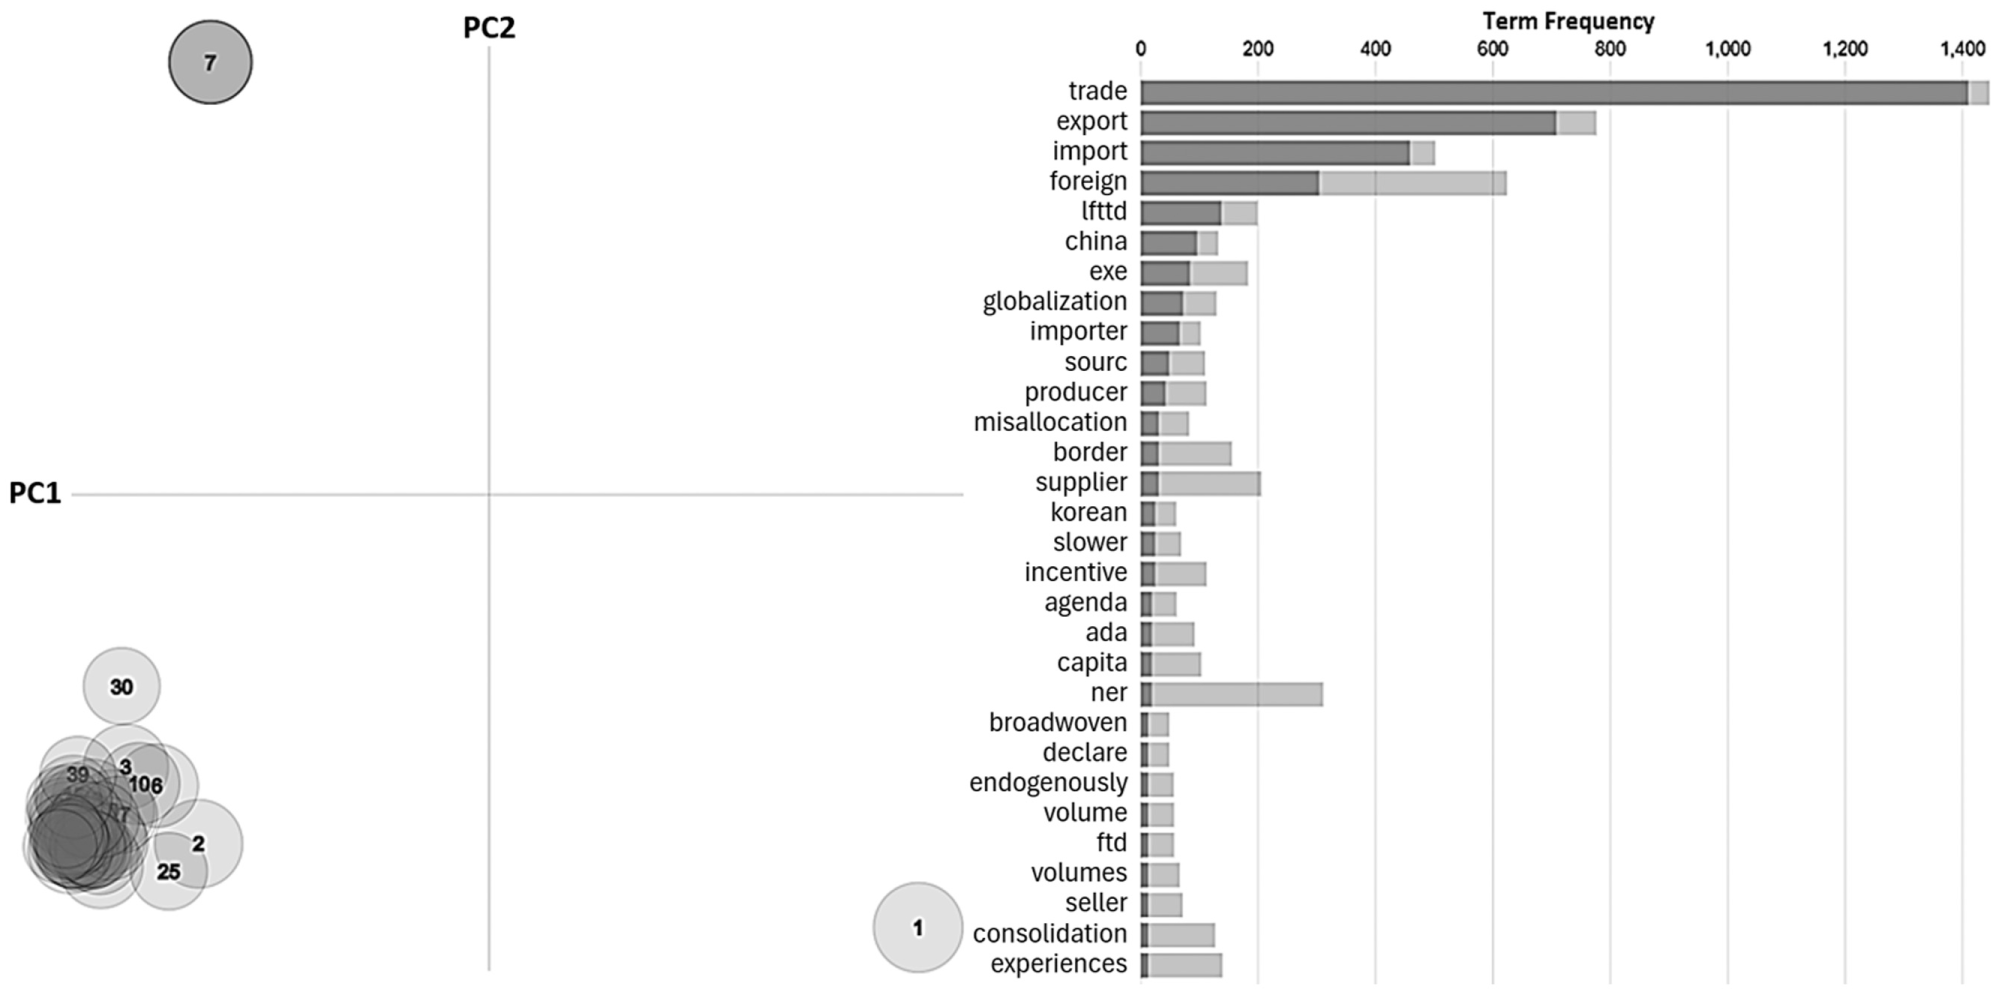
Visualization of the 47 topics extracted from the abstracts of the 843 proposals requesting confidential data (1998–2023): scatter plot (47 topics) (left) and bar plot (Topic 7) (right).
LDAvis employs principal component analysis to reduce the dimensions of the topic-term matrix and to display the topic model results in an interpretable fashion. The scatter plot (Figure 7 left) shows the distribution of 47 topics in a principal component space, with PC1 and PC2 representing the first and the second principal components of the topic-term matrix, respectively. The plot, called the “inter-topic distance map,” illustrates the relationship among topics by visualizing their relative distances after multidimensional scaling ( 24 ). The size of each circle is proportional to the frequency of topics, meaning that a larger circle corresponds to a more prevalent topic in the corpus.
The bar plot (Figure 7 right) displays the 30 most relevant terms for the selected topic. Terms are ranked by their relevance scores, which make each topic more distinctive and aid interpretation. The relevance score is not a direct count but reflects a term’s frequency within the topic adjusted for its overall frequency in the corpus (see Sievert and Shirley for technical details) ( 23 ). As a result, a term may occur frequently yet still have a low relevance score; a high relevance score indicates that a term strongly represents the topic. Each term is shown with two bars: dark gray for terms highly relevant to the selected topic and light gray for terms common overall but less distinctive. This plot helps convey the semantic meaning of the topic.
The distance between circles on the scatter plot (Figure 7 left) represents the semantic relationship between the corresponding topics. Topics whose circles are close to each other are more similar, while those farther apart are less related. Three visually distinct groups of topic are observed. Topics 1 and 7 are notably distant from each other as well as the remaining 45 topics. Topic 1 is associated with terms “health – insurance – care – meps – premium,” which can be labeled as “Health Insurance and Care,” indicating a focus on healthcare access and financing. The term “meps” refers to the Medical Expenditure Panel Survey, a dataset that collects detailed information on the cost, utilization, and coverage of health care and health insurance ( 25 ).
Topic 7 corresponds to terms “trade – export – import – foreign – lftld,” which can be labeled as “Trade and Foreign Export-Import.” This topic is closely related to CFS data. This suggests that research associated with CFS is unique among all the projects requesting access to data through FSRDCs. The bar plot (Figure 7 right) presents the term frequencies specific to Topic 7, highlighting its distinct nature. The ratio of the length of the dark bar to that of the light bar indicates the prevalence of each term. For example, the bar for “trade” demonstrates that the term is predominantly associated with Topic 7, appearing approximately 98% of the time within the topic. A similar, though to a lesser degree, predominance is observed for other top terms such as “export” and “import.” It should be noted that the bar plot was created with the relevance parameter set at 1.0, which ranks terms within a specific topic ( 23 ). Changing the relevance to any value within the range of 0 to 1 did not alter the top three terms. Twenty-five of the 47 topics are displayed in Figure 6, with each topic represented by its top five terms.
The top five datasets most frequently requested in proposals that included CFS were: 1) the Census of Manufactures, 2) the Annual Survey of Manufactures, 3) the Standard Statistical Establishment Listing, 4) the Longitudinal Business Database—No Revenue, and 5) the Longitudinal Foreign Trade Transactions Database. Meanwhile, the top five datasets requested in proposals that did not include CFS were: 1) the Census of Manufactures, 2) the Standard Statistical Establishment Listing, 3) the Annual Survey of Manufactures, 4) the Longitudinal Business Database—No Revenue, and 5) the American Community Survey. Notably, four out of the five datasets were common to both groups. This overlap suggests that, while the types of data requested are largely similar, the specific research focus may differ between proposals linked to CFS and those not. The proposals that included CFS requested an average of 16 datasets (including CFS), whereas those that did not include CFS requested an average of eight datasets. This difference suggests that research using CFS data may be inherently more complex, often necessitating a wider range of datasets to conduct a comprehensive analysis than research not using it.
44 Project Proposals Requesting CFS Data
Texts extracted from the 44 proposals that requested access to confidential CFS data were analyzed. A total of 13,188 terms were identified after removing stop words, generic terms (e.g., prepositions, conjunctions, and pronouns), and punctuation. One-word and two-word analysis of term frequency was performed for the 44 proposals. Three-word term frequency was not performed for the 44 proposals, reflecting the findings of the term frequency analysis of the 849 metadata entries.
Term Frequency Analysis
Among the one-word terms, “firm” was found the most often (2,621 occurrences), followed by “establishment” (1,498), “trade” (1,228), “economic” (1,224), “productivity” (935), “shock” (898), “plant” (846), “industry” (820), and “manufacturing” (641). These terms are mostly related to economy and business aspects. The term “firm” was also noted as the most frequent in the analysis of the 849 metadata entries. It is worth noting that “freight,” mostly found in records containing “commodity flow survey” in TRID searches, is not found in the top 25 terms. This means “freight” would be rarely used in economic or business-focused research, whereas it is often found in transportation-focused research.
Among two-word terms, “supply chain” was found most frequently (200 occurrences), followed by “commodity flow” (120), “economic review” (106), and “capacity utilization” (71), as shown in Figure 8. It is interesting that “labor market,” found the most frequently in the corresponding analysis of the metadata (Figure 3), is not found in the 44 proposals (Figure 7).
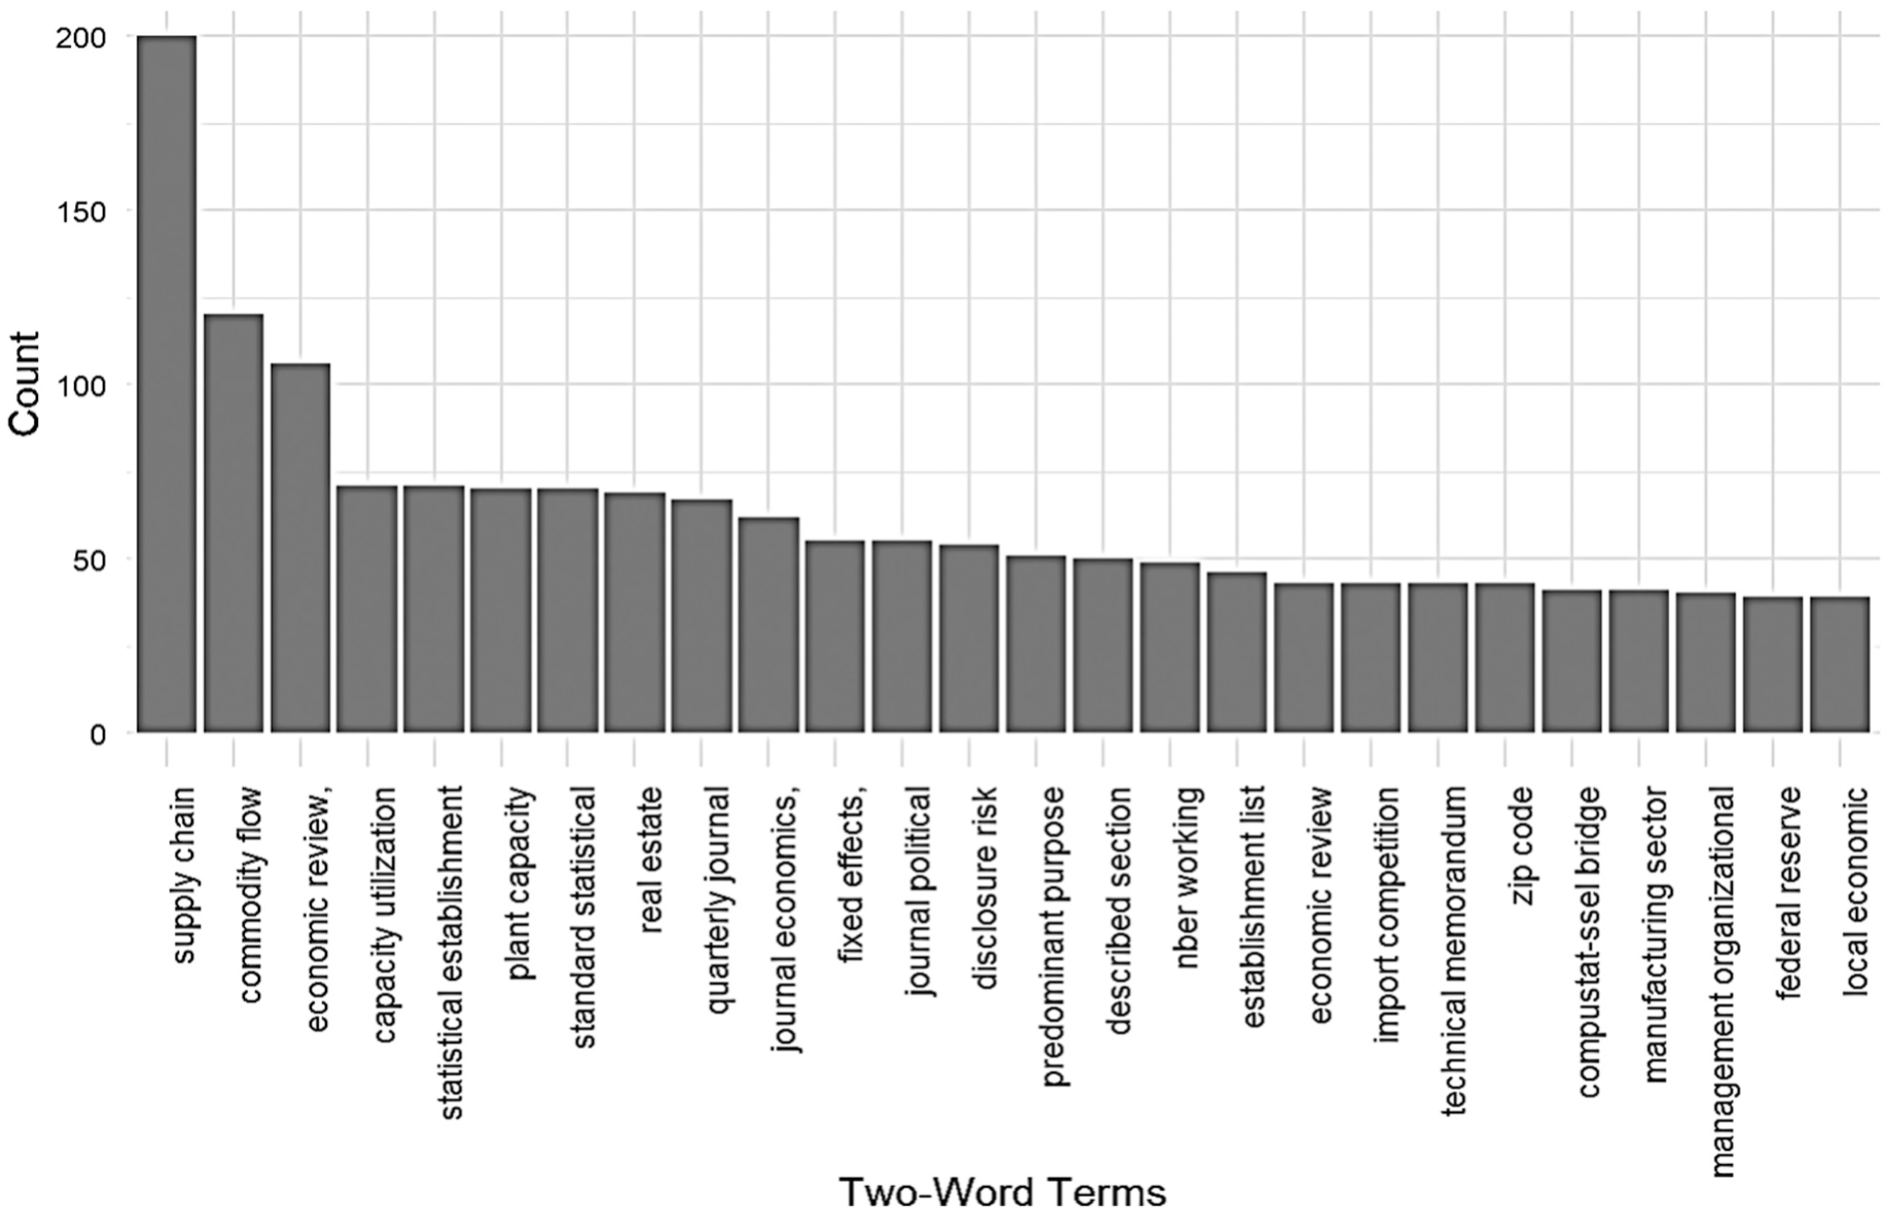
Bigrams of two-word terms in the 44 proposals requesting confidential Commodity Flow Survey data (2011–2022).
Based on the results of the term frequency analysis and the TRID search, we can infer that the term “supply chain” is most likely used in research addressing economic and business issues, while “freight” is more commonly found in research focused on transportation issues. This distinction highlights the different focal points of studies using CFS data, whether public or confidential.
From a geographic perspective, supply chains involve not only the origin and destination of a shipment but also intermediate locations where shipments are temporarily stored or transferred between modes of transport. Capturing such information is challenging under the current CFS survey design. However, advances in technology (e.g., shipment tracking systems) and/or enhancements to the CFS survey design could make it feasible to collect these data—perhaps not for all shipments, but for a sufficiently large subset to enable meaningful analysis. Such improvements would also respond to the desire for more detailed geographic information identified during the human review of the 44 proposals.
Topic Modeling
For LDA modeling, the number of topics needed to be selected in advance. Models with topic counts ranging from 2 to 15 were examined. Common terms found in the topics across the models included “firm,”“industry,”“establishment,” and “business.” Among the topic models generated, Figure 9 shows the results of a six-topic LDA model, displaying only the top 10 terms for each topic based on beta probability values. The horizontal axis (beta) represents the probability of a term being included in the corresponding topic. All the six topics have “firm” in their top two terms based on the beta probability. Topic 5 includes “firm,”“plant,”“industry,”“employment,” and “economic,” and records the highest coherence score, −1.09, implying it would be the best at describing the underlying theme of the 44 proposals among the six topics.
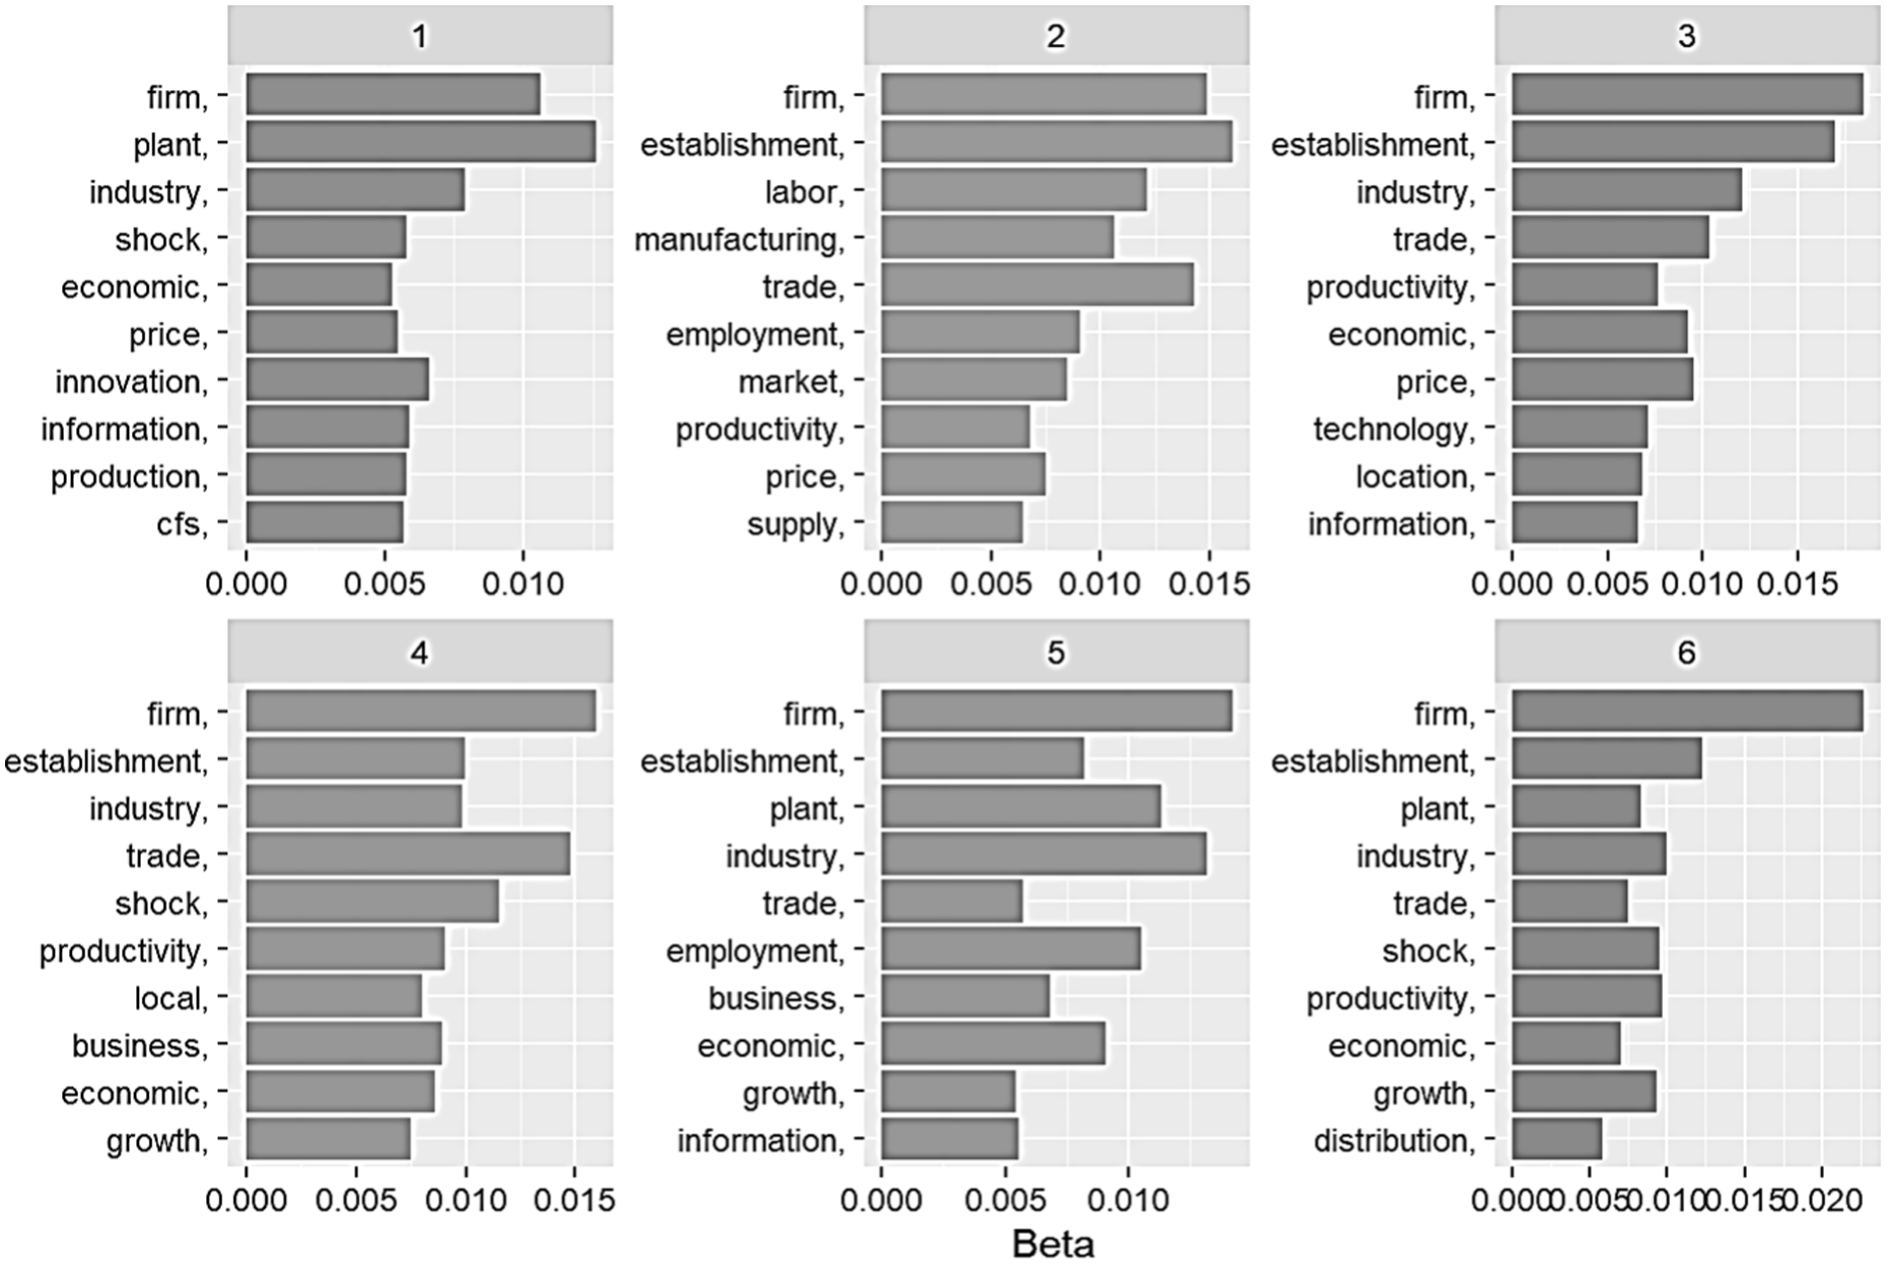
Six main topics from the latent Dirichlet allocation model applied to 44 proposals requesting confidential Commodity Flow Survey data (2011–2022).
Based on the topic models developed, thematic patterns shared across the 44 proposals were identified. The term “firm” consistently ranked highest across all topics, although its beta values varied in magnitude. Nearly all topics centered on economic or business themes, aligning with the qualitative review findings on research areas (see Table 1 for the qualitative categorization of research topics). While the six topics shared a common economic or business focus, distinctions emerged through unique terms within each topic. For example, Topic 1 was characterized by “innovation” and “production” and Topic 3 by “technology” and “location.” Drawing on the term composition, the topics can be labeled as follows: Topic 1—Firm-level production and innovation shock; Topic 2—Labor and supply in manufacturing markets; Topic 3—Technology and location in industrial productivity; Topic 4—Local business growth and economic shock; Topic 5—Business and employment in industrial plants; and Topic 6—Distribution and growth in economic shock.
A topic model is a powerful tool for document review, enhanced by computing power. However, it is important to note that analysts should possess a certain level of understanding about the content of the documents being analyzed. Without this knowledge, there is a risk of identifying non-existent themes or overlooking existing ones. Additionally, a topic model such as LDA relies on the bag-of-words approach, which disregards the order of words. Other NLP models, for example transformer-based models such as bidirectional encoder representations from transformers, process text in parallel and capture contextual information in a bidirectional or autoregressive manner and provide more comprehensive summaries for improving understanding of the content ( 26 ). Future research may benefit from employing methodologies that explicitly capture word order sequences, such as deep neural networks, to derive a more nuanced understanding of the semantic content of the text (26, 27).
Conclusions
This study reviewed the 44 proposals having requested confidential CFS data from 2011 to 2022 and also the metadata of 849 proposals having requested any type of confidential data from 1998 to 2023. Both qualitative (i.e., human review by reading the proposals) and quantitative (i.e., machine review by performing text analysis) approaches were used. It should be noted that the study findings and conclusions are limited to the proposals using confidential data, including CFS data accessible through FSRDCs, not those using publicly available CFS data.
In the qualitative approach, two of the authors of this paper read the 44 proposals requesting confidential CFS data and summarized the notes about the submitters, research topics, data elements, and feedback about CFS data found in those proposals. Typically, two to three submitters were involved in each proposed project. Most of the submitters were associated with a prestigious higher education institution and some of them with national associations/federal agencies such as the Federal Reserve Board and National Science Foundation. The research topics concentrated on economic aspects and are categorized into four groups: business practices, market phenomena, high-level trends, and synthesis approaches. Geographic information of CFS data was the most desired, followed by shipment value, export/import, and commodity. Shipment value information was more often sought than shipment weight, reflecting the economic nature of the research topics.
In the quantitative approach, text analysis, including term frequency and topic modeling techniques, was applied to the spreadsheet of the metadata of the 849 proposals requesting access to any confidential data including CFS and non-CFS data and the PDF files of the 44 proposals requesting access to confidential CFS data, separately. In the titles and abstracts of the metadata, the one-word-term “firm” and two-word term “labor market” were most frequently found, implying the proposals focused on issues in business, economy, and labor markets associated with firms or at firm level. Inferred from the inter-topic distance of the 47 topics uncovered from the 849 metadata entries, a topic most likely related to CFS, specifically “trade-export-import-foreign-lftld,” is unique, distant from the other topics (see Figure 7).
In text analysis of all the texts (e.g., titles, abstracts, body of the proposals, and references) extracted from the 44 proposals requesting confidential CFS data, the one-word term “firm” and two-word term “supply chain” were most often found. It is noteworthy that “freight” was not found in the top 25 one-word or two-word terms. This contrasts to “freight” being mostly found in documents containing “commodity flow survey” in the transportation research field. Topic modeling results suggest the proposals focused on business and economic aspects of issues involving various areas such as manufacturing, employment, and technology. Within the topics derived from the topic models, a geography variable is frequently included, and the shipment value variable is mentioned more often than the shipment weight variable.
Based on the results of both qualitative and quantitative approaches, the following conclusions are drawn:
Proposals requesting data through FSRDCs hold CFS data in high regard and are unique. CFS data are highly important to a majority of the 44 proposals requesting confidential CFS data based on the qualitative review. By the quantitative review, although almost all of the 849 proposals having requesting access to confidential data through FSRDCs were associated with economic or business research, the topic related to CFS was different from the other 46 topics unearthed by LDA model according to the distance measured across the topics. This can be interpreted that the proposals accessing confidential CFS data are unique in their underlying themes. Thus, the unique nature of CFS data, combined with its high importance, strongly indicates that CFS is irreplaceable by any other data.
Geography is the most desired type of information provided by CFS data. Geographic information was most commonly noted in the 44 proposals and frequently appeared in the topics derived from these proposals. It aligns with the perspectives of users of public CFS data, that is, transportation researchers and analysts. More granular and additional geographic information are desired for future CFS data collection and estimation efforts.
Shipment value appears more useful than shipment weight in proposals requesting confidential CFS data. Shipment value was more frequently sought than shipment weight in the 44 proposals accessing CFS data, reflecting the proposals’ focus on economic research. This finding is in contrast with shipment weight being more important in research in transportation field. It is noteworthy transportation research often uses publicly available CFS data and FAF data.
Proposals requesting data through FSRDCs center around economic research. Terms and topics extracted from the 849 metadata entries and from all the texts of the 44 proposals requesting CFS data are closely related to economic and business issues. The one-word term “firm” was the most frequently found both in the metadata and the 44 project proposals. As for the two-word terms, “labor market” was most often found in the metadata while “supply chain” was the most frequent in the 44 proposals.
The term “supply chain” is most likely used in research addressing economic and business issues while “freight” is typically associated with research in transportation. The two-word term “supply chain” was the most often found in the 44 proposals. Although the term “freight” was frequently found in transportation research according to the TRID search, it did not appear in the top 25 one-word or two-word terms within the 44 proposals.
Both qualitative (human review) and quantitative (machine review) approaches complement each other rather than serving to replace each other. The qualitative approach is capable of identifying contextual information that the quantitative approach fails to capture. For instance, feedback about CFS data—such as missing and desired data elements—is challenging and difficult for a topic model to identify but can be effectively captured by a human reviewer reading the documents. Additionally, although topic models are powerful tools for processing and analyzing large volumes of text, human analysts are essential in interpreting model-generated results. Analysts should have a certain level of contextual understanding of the text being analyzed, which can be achieved by reviewing a subset of the documents.
It is important to note that this study focused on the uses and users of confidential CFS data, while also incorporating insights gathered from users of public CFS data.
Footnotes
Acknowledgements
The authors thank Berin Linfors at the U.S. Census Bureau for providing the FSRDC proposals and information about the project metadata.
Author Contributions
The authors confirm contribution to the paper as follows: study conception and design: C. Fan, R. Grube, Y.-J. Kweon; data collection: R. Grube, W. Zeng, M. Carter, Y.-J. Kweon; analysis and interpretation of results: W. Zeng, M. Carter, Y.-J. Kweon; draft manuscript preparation: Y.-J. Kweon, W. Zeng, M. Carter, R. Grube. All authors reviewed the results and approved the final version of the manuscript.
Declaration of Conflicting Interests
The authors declared no potential conflicts of interest with respect to the research, authorship, and/or publication of this article.
Funding
The authors disclosed receipt of the following financial support for the research, authorship, and/or publication of this article: This research was supported in part by an appointment to the U.S. Department of Transportation Research Participation Program administered by the Oak Ridge Institute for Science and Education (ORISE) through an interagency agreement between the U.S. Department of Energy and the U.S. Department of Transportation. ORISE is managed by Oak Ridge Associated Universities under DOE contract number DE-SC0014664.
All opinions expressed in this paper are those of the authors and do not necessarily reflect the policies and views of the Bureau of Transportation Statistics, the U.S. Department of Transportation, the Oak Ridge Institute for Science and Education, or the U.S. Department of Energy.