
Abstract
The safety and operational effectiveness of pedestrian hybrid beacons (PHBs) and rectangular rapid flashing beacons (RRFBs) are well established. However, their performance depends on pedestrians actuating these traffic control devices before crossing. Past research has mostly evaluated drivers yielding to these devices using staged crossing protocols. Further research studying how real-world pedestrians and drivers use these devices is needed. We use field video footage data to investigate factors linked to road user behaviors at pedestrian crossings and a survey of pedestrian attitudes and motivations at urban locations in North Carolina. Among other findings, we found evidence of a link between pedestrian refuges and increased actuation and yield rates, whereas pedestrian and driver behaviors worsen at crossings where a sidewalk is absent on one side. We found higher odds of yielding for PHBs, while pedestrians were less likely to actuate those devices compared with RRFBs. In general, factors such as increased traffic and longer crossing distances were associated with more actuations. Survey responses indicated that conditions and roadway elements that increase friction or safety risk during the crossing (heavy traffic, fast cars, and longer crossing distances) motivate pedestrians to actuate the devices more frequently. A comparison of pedestrian waiting times showed that pedestrians experienced 52.0% shorter wait times at actuated RRFBs compared with actuated PHBs, a finding that might help explain the higher rates of actuation at RRFB sites.
Keywords
Introduction
With pedestrian deaths in the United States reaching a 40-year high of over 7,500 in 2022, it is crucial to deploy proven countermeasures that improve safety for crossing pedestrians. Traffic control devices (TCDs) such as pedestrian hybrid beacons (PHBs) and rectangular rapid flashing beacons (RRFBs) have been well established to increase driver yielding to pedestrians and reduce pedestrian crashes (1–5). For example, an early study of PHBs reported that the device is associated with a 69% pedestrian crash reduction ( 6 ), and a more recent before–after evaluation of 186 locations in Arizona with PHBs found a 45% reduction in pedestrian-related crashes, either fatal or involving injury, associated with PHB installations ( 7 ).
The safety effectiveness of PHBs and RRFBs is well established, but it hinges on pedestrians crossing at the designated locations and actuating the devices before crossing. But not all pedestrians actuate the devices, nor do all vehicles yield to pedestrians when devices are activated. The literature about where and why pedestrians actuate these devices is limited. Motivated by conversations with transportation officials in North Carolina about this knowledge gap, we recognized the need to study actuation and yield rates, as well as pedestrian attitudes and motivations at urban crossings. We believe that such a study might prove useful in the decision-making process for future deployments, or when modifying current deployments for optimized operations.
Current Literature on Driver Yielding
The most frequently used method to establish the effectiveness of these devices has been a staged crossing protocol (i.e., when a researcher poses as a pedestrian to prompt motor vehicles to yield the right of way). Generally, these studies tend to indicate good yielding behavior around both device types ( 8 , 9 ). Notwithstanding, Fitzpatrick et al. reported high yielding rates for both PHBs (89%) and RRFBs (86%) in Texas ( 10 ). Other research has found that there are no significant differences in yielding performance for varying RRFB flashing patterns ( 11 ).
However, a study obtained different results from studying staged and actual pedestrian behavior. On the one hand, they found that the RRFB tended to increase driver yielding when present and active using staged pedestrians, while they could not find significant changes when looking at actual pedestrians crossing ( 12 ).
Based on video footage, researchers studied driver yielding at uncontrolled midblock RRFB crosswalks at two Montana locations. The study found that active RRFBs were associated with increased yielding as well as other factors such as proximity of pedestrians to the crosswalk, size of the group crossing, and peak periods. Researchers emphasized the visibility of crosswalk users as a very important determinant of driver yielding ( 13 ).
A recent study in Vermont evaluated driver yielding at six locations representing rural and suburban transition zones. Using a paired before-after-with-comparison group design, researchers found statistical evidence of RRFB effectiveness: increased odds of driver yielding but increased odds of pedestrians crossing out of the crosswalk ( 14 ).
An observational study of 600 pedestrians at six locations in Seattle, WA, found increased odds of pedestrians waiting for the signal to cross when they actuated RRFBs in the absence of rain, at corners, and with longer cycle lengths ( 15 ).
Current Literature on Pedestrian Actuation
A recent evaluation studied 112 PHB locations in Tucson, AZ. This research used pedestrian and bicycle crash records from 2018 to 2021 and classified their sample by crash history and the availability of actuation data. This study found that young male pedestrians were less likely to actuate PHBs. Findings also suggested a link between increased crashes and nighttime crossings, regardless of actuation status ( 16 ).
A study based on 20 locations in Las Vegas, NV, found that the odds of pedestrian actuation increased for RRFBs (odds ratio [OR] = 3.61) and for circular flashing beacons (OR = 4.54) compared with PHBs and traffic control signals. Actuation odds similarly increased with larger vehicle platoons and with increasing speed limits. No significant differences were observed among the number of lanes present except for 8 to 10 lanes, which had higher actuation odds than five lanes ( 17 ).
Study Motivation
Given the scattered literature about actuation rates and pedestrian attitudes toward RRFBs and PHBs, this research aims to expand on these topics to better document the factors influencing the decisions of pedestrians to actuate these devices and understand how actuation affects yielding rates. Specifically, we seek to articulate the relationship between pedestrians’ proclivity to actuate and drivers’ decisions to yield. This improved understanding is important because the safety benefits of these TCDs depend on periods of proper operation of the devices and road users behaving as expected.
Although some efforts to study those aspects have been documented, there is a need to better understand how these metrics relate to each other. Identifying and understanding factors that make users more or less likely to actuate these devices should be helpful to agencies in deciding whether and where to deploy them in the future and how to modify current installations for improved performance.
Methodology and Results
The current effort comprised two complementary parts: 1) an observational study based on field video footage to record and document pedestrian behavior immediately preceding the crossing; and 2) a survey of pedestrian attitudes and motivations at a subset of the study locations.
Observational Study
In coordination with the North Carolina Department of Transportation (DOT), we evaluated the characteristics of multiple pedestrian crossings derived from video footage. North Carolina DOT provided a file with their 2022 statewide inventory of RRFB and PHB devices, totaling 234 locations.
We noted clear imbalances in the distributions of key variables such as speed limit, annual average daily traffic (AADT), number of lanes, and surface width. RRFBs tend to be primarily at locations with a posted 35-mph speed limit and with fewer lanes, narrower crossings, and lighter traffic. We used propensity scores to select a balanced probability sample to minimize confounding between PHB and RRFB sites ( 18 ) to contrast the performance of the two devices. We limited the study to the vicinity of Charlotte and Raleigh.
Figure 1 shows the distributions of the key covariates: statewide in the first row, and for the final sample of 15 locations in the second row where it is apparent that the imbalances in key covariates are softened compared with the statewide distributions.
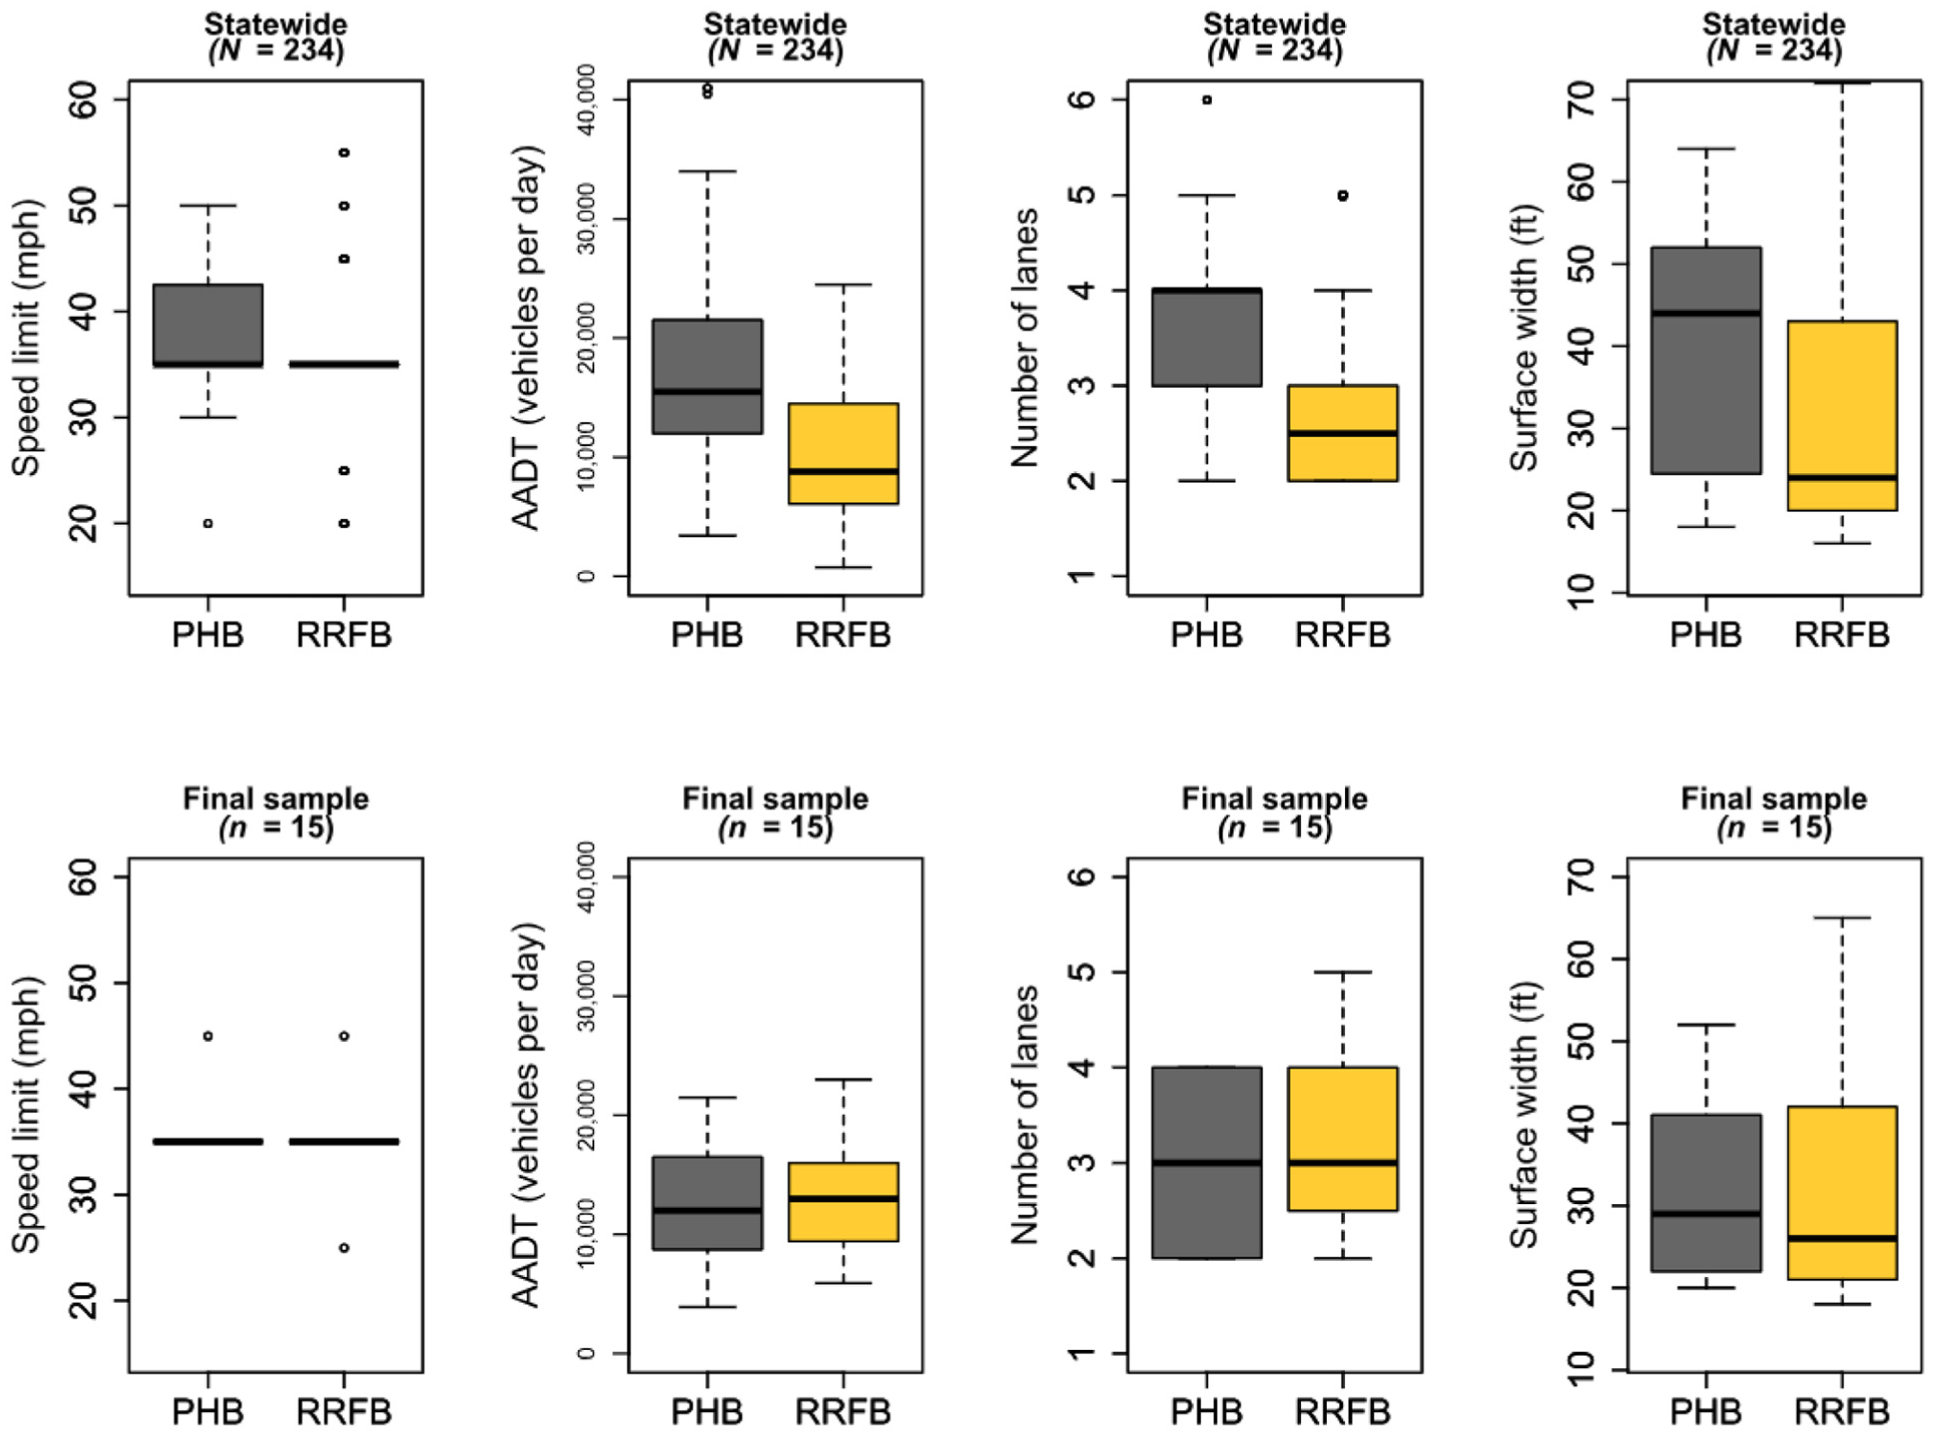
Marginal distributions of covariates by device type.
The better balance in the final sample comes at the cost that comparisons between devices are valid for a reduced range of covariate values as Figure 1 also shows.
Note that PHBs tend to be installed under a wider range of conditions statewide in North Carolina than represented in this study.
Data Collection and Reduction
The set-up for a typical study location is shown in Figure 2. Two cameras were installed to document the behavior of arrivals from both sides. The placement was optimized to observe the actuation button of the TCD, the PHB lenses, or the RRFB LEDs to determine if the device was actuated before an observed crossing.
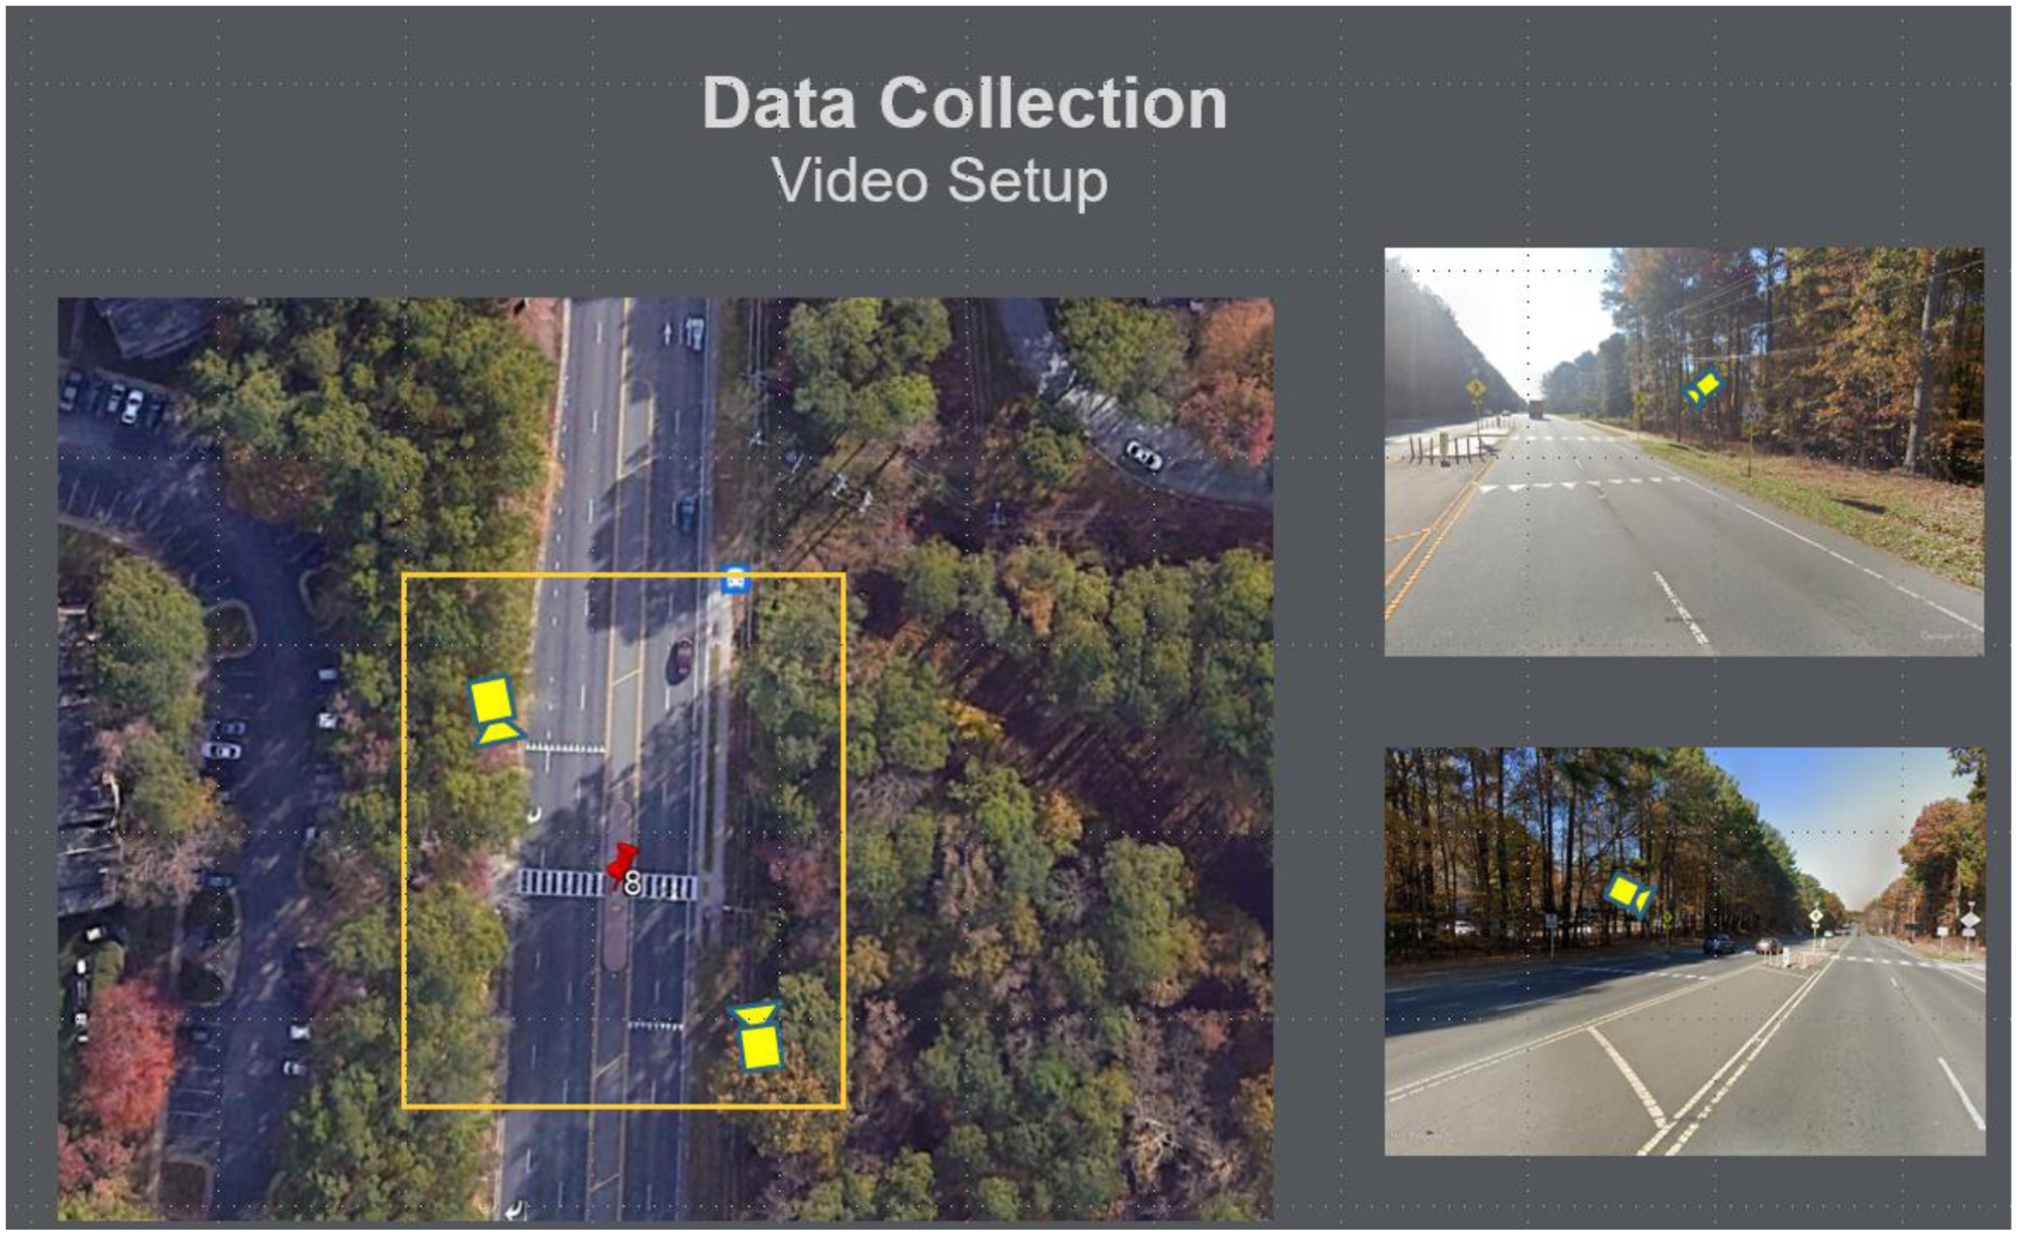
Video collection set-up for a typical location.
A regional traffic-engineering company was hired to collect a complete week of footage (7 days, 24 h a day) during the fall of 2023 (October and November) and manually extract the characteristics of each crossing using a template provided for that purpose. A total of 3,624 crossings with complete data were coded for analysis. Table 1 shows descriptive statistics for the key variables collected or calculated as described.
Descriptive Statistics per Crossing (n = 3,624)
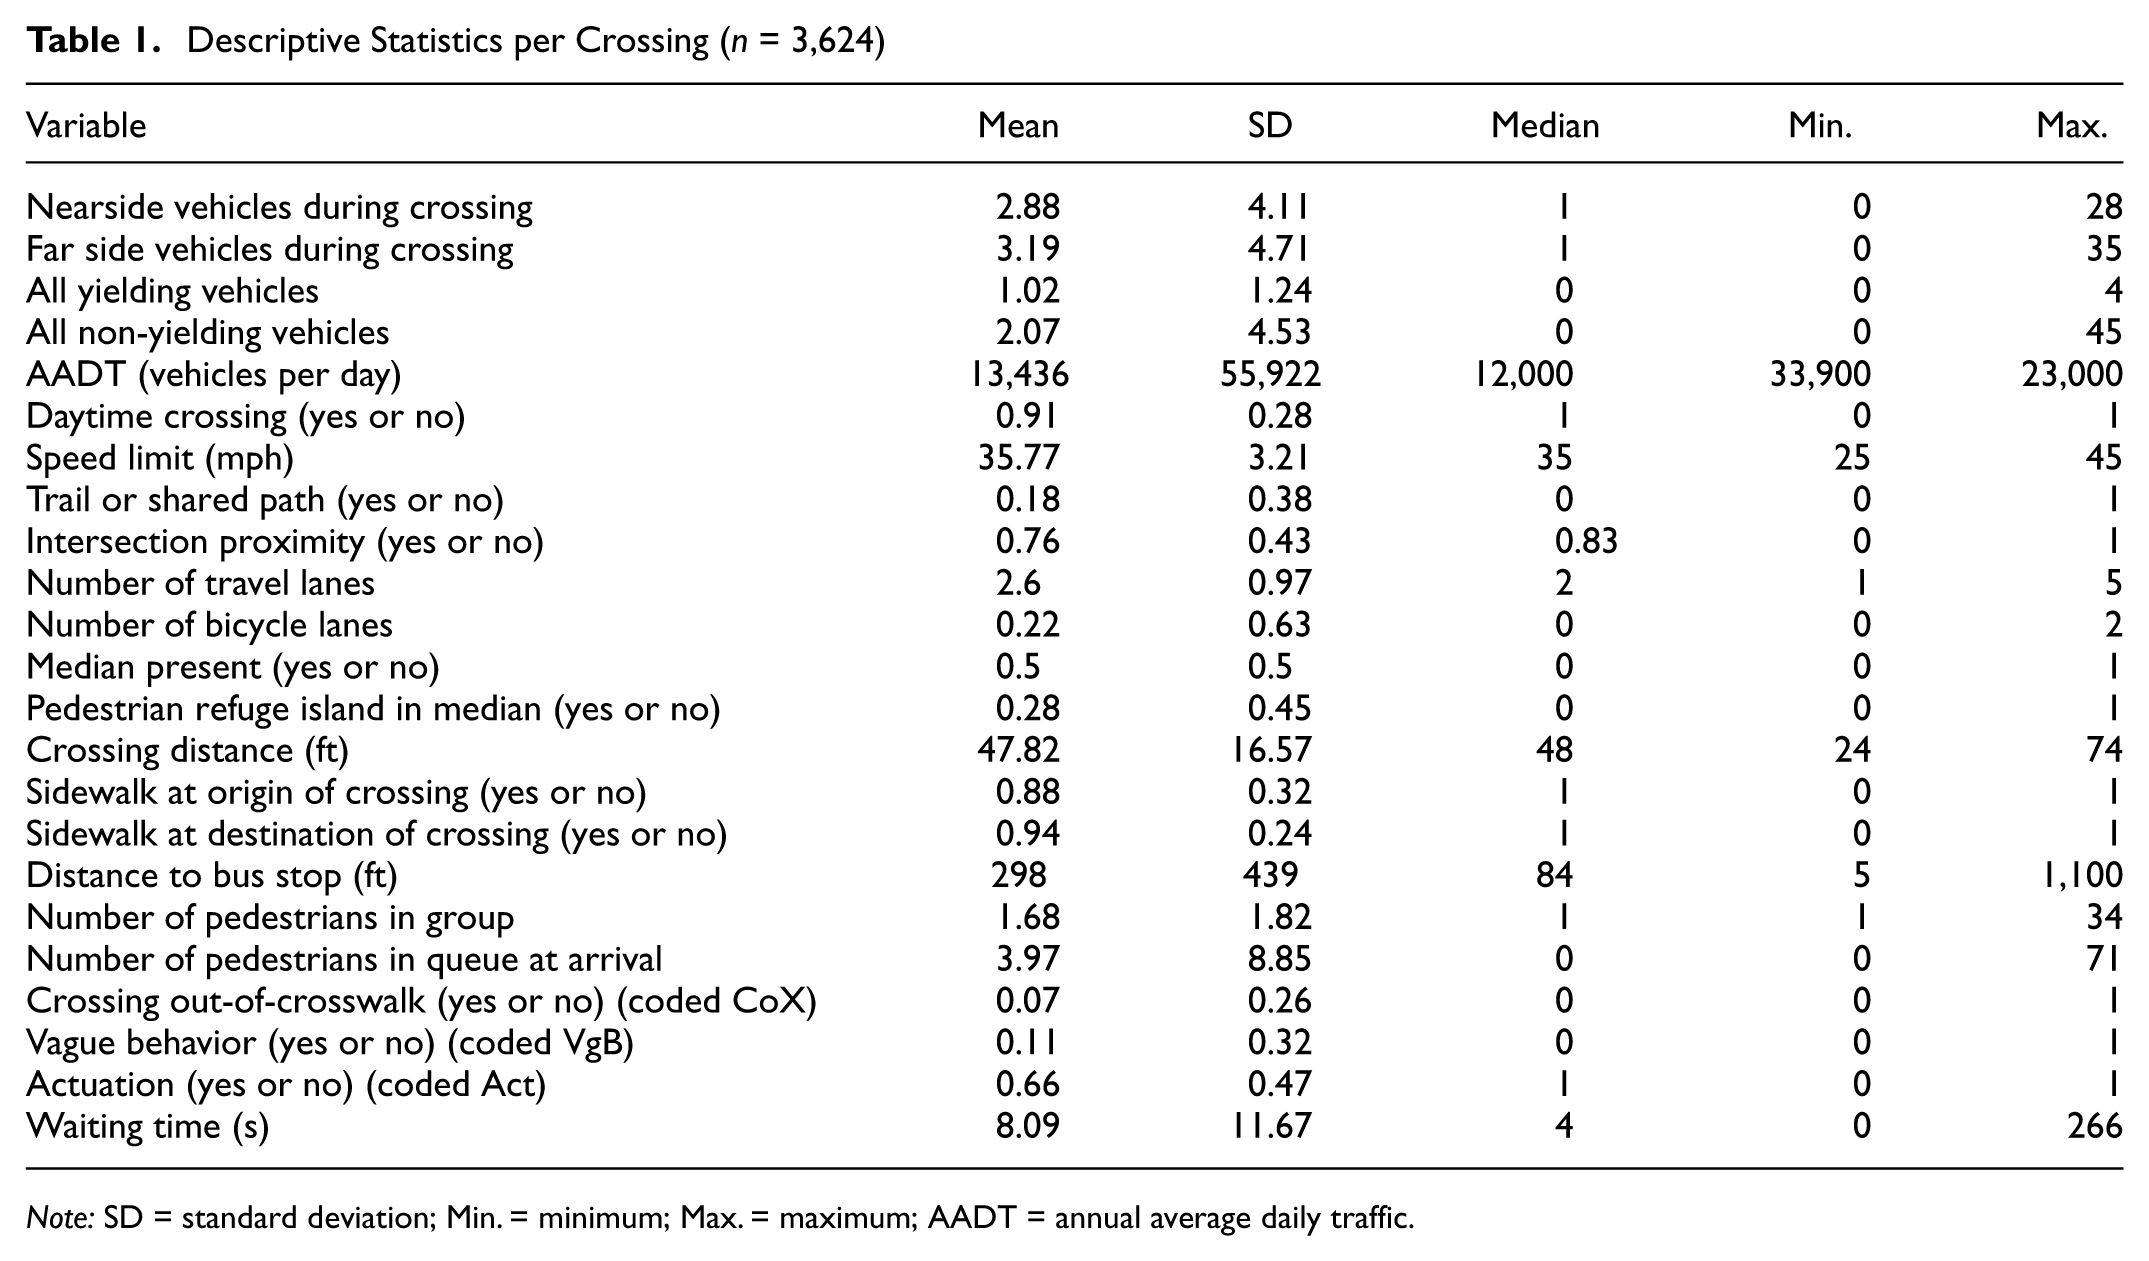
Note: SD = standard deviation; Min. = minimum; Max. = maximum; AADT = annual average daily traffic.
With regard to the indicator variable “Intersection proximity,” we coded the situations where the midblock crossings were close to an intersection (100 ft or less) for potential impacts of the intersection on the crossing. The variable “Trail or shared path” represents locations where either a trail or a shared path crossed a road.
The variable “Pedestrian refuge island in median” implies that a median is present and pedestrian refuge islands are always present at raised medians. In this data set, only three out of 15 locations had medians (other than raised) but no pedestrian refuges. The longest recorded distance between the crosswalk and a crossing pedestrian was 200 ft, so the data set does not capture crossings with a greater distance outside of the crosswalks. The definition of “Actuation” includes only pedestrians who pressed the button (actuated). Pedestrians who did not actuate but crossed when the device was actively controlling traffic were considered to not have actuated.
Some relevant variables (e.g., time between arrivals, number of pedestrians in queue) were not observed and recorded directly but calculated using other available variables. For example, we defined an indicator variable for vague behavior (from the drivers’ standpoint) because we observed some pedestrians who waited a long time without conveying through body language their intent to cross. After considering a few alternative ways to flag these cases systematically in the data stream, we defined them as follows: a crossing with at least six observed vehicles where 60% of the drivers had an insufficient stopping sight distance. This definition might have captured events other than waits where pedestrians did not clearly signal to the drivers their intention to cross, but it did capture the cases of interest we spot-checked when assessing this rule.
Table 1 shows that on average, nearly one vehicle yielded and two did not yield at each crossing. This table also shows statistics for vehicles that were classified as yielding and non-yielding. We classified vehicles as non-yielding if they either: a) crossed the stop bar when the PHB was in the solid red phase; or b) arrived at the stop bar more than 4 s after the RRFB activation—that is, a vehicle traveling at 35 mph should take 4.9 s to cover the corresponding stopping sight distance of 250 ft, given standard assumptions from the American Association of State Highway and Transportation Officials’ calculation ( 19 ).
It is also notable from the binary variables in Table 1 that most crossings occurred during daytime (91%), and 50% were at locations with medians while 28% were at locations with pedestrian refuges present. Most crossings had a sidewalk at the origin point (88%) or the destination point (94%). Most crossings were recorded within the crosswalk, as indicated by the variable crossing out of the crosswalk (7%), and 66% of the pedestrians actuated the TCD before crossing. Only 11% of the involved pedestrians were classified as behaving vaguely.
Next, Table 2 shows actuation and yielding rates aggregated by device and actuation status. These calculations excluded the 262 crossings that were out of the crosswalk. Yielding rates were computed on a smaller subsample of crossings (reported in parentheses) because it is only possible when there is at least one vehicle with a sufficient stopping sight distance.
Actuation and Yielding Rates by Device and Actuation Status
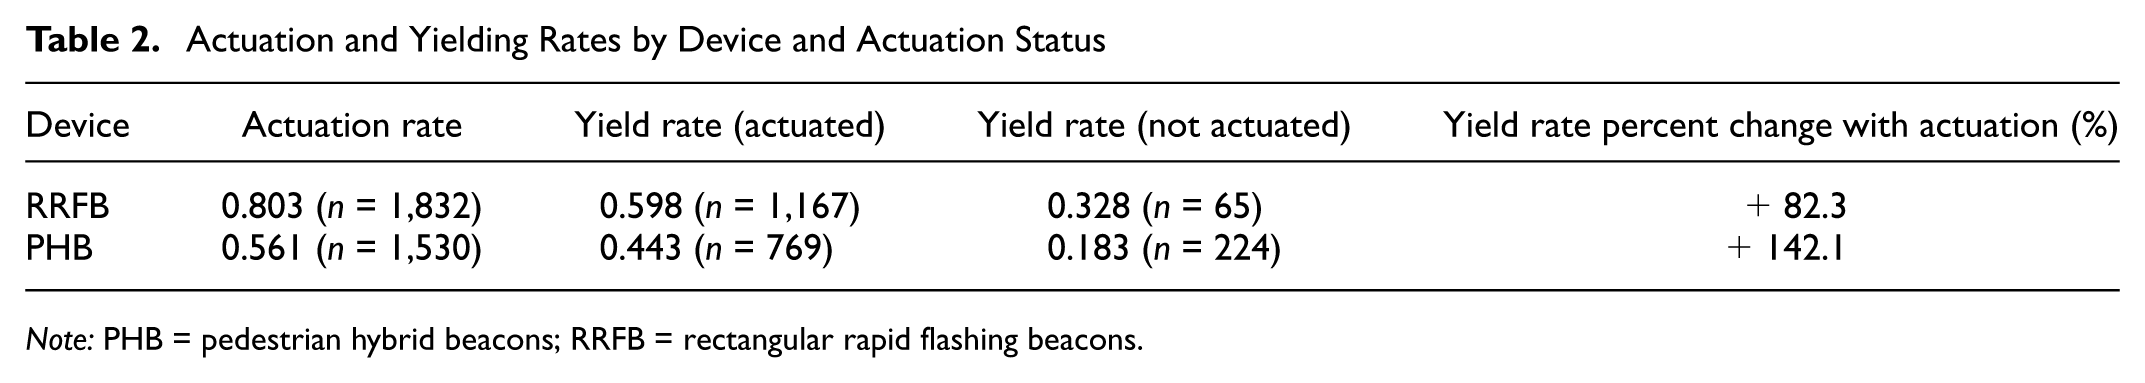
Note: PHB = pedestrian hybrid beacons; RRFB = rectangular rapid flashing beacons.
Table 2 shows a disparity in actuation and yielding rates. On average, RRFBs were actuated more often and drivers yielded more often at sites with those devices. Additionally, this table shows higher yielding rates for both devices when actuated compared with when not actuated. The last column shows the percentage increase in yielding for crossings with actuation compared with no actuation, suggesting that actuation at PHBs might have a larger positive effect in driver yielding.
Modeling Pedestrian and Motor Vehicle Observed Behaviors
We performed statistical analyses on the probability of three key variables: 1) crossing out of the crosswalk; 2) actuation; and 3) yielding. The three response variables are related to each other and can be understood as links in a chain of events: a pedestrian decides to cross within the crosswalk (they might behave erratically or not), and they might actuate the TCD or not. The last link in that chain is the decision by drivers whether to yield if they have a sufficient stopping sight distance. Figure 3 illustrates the conceptual chain of events and analysis approach as explained.
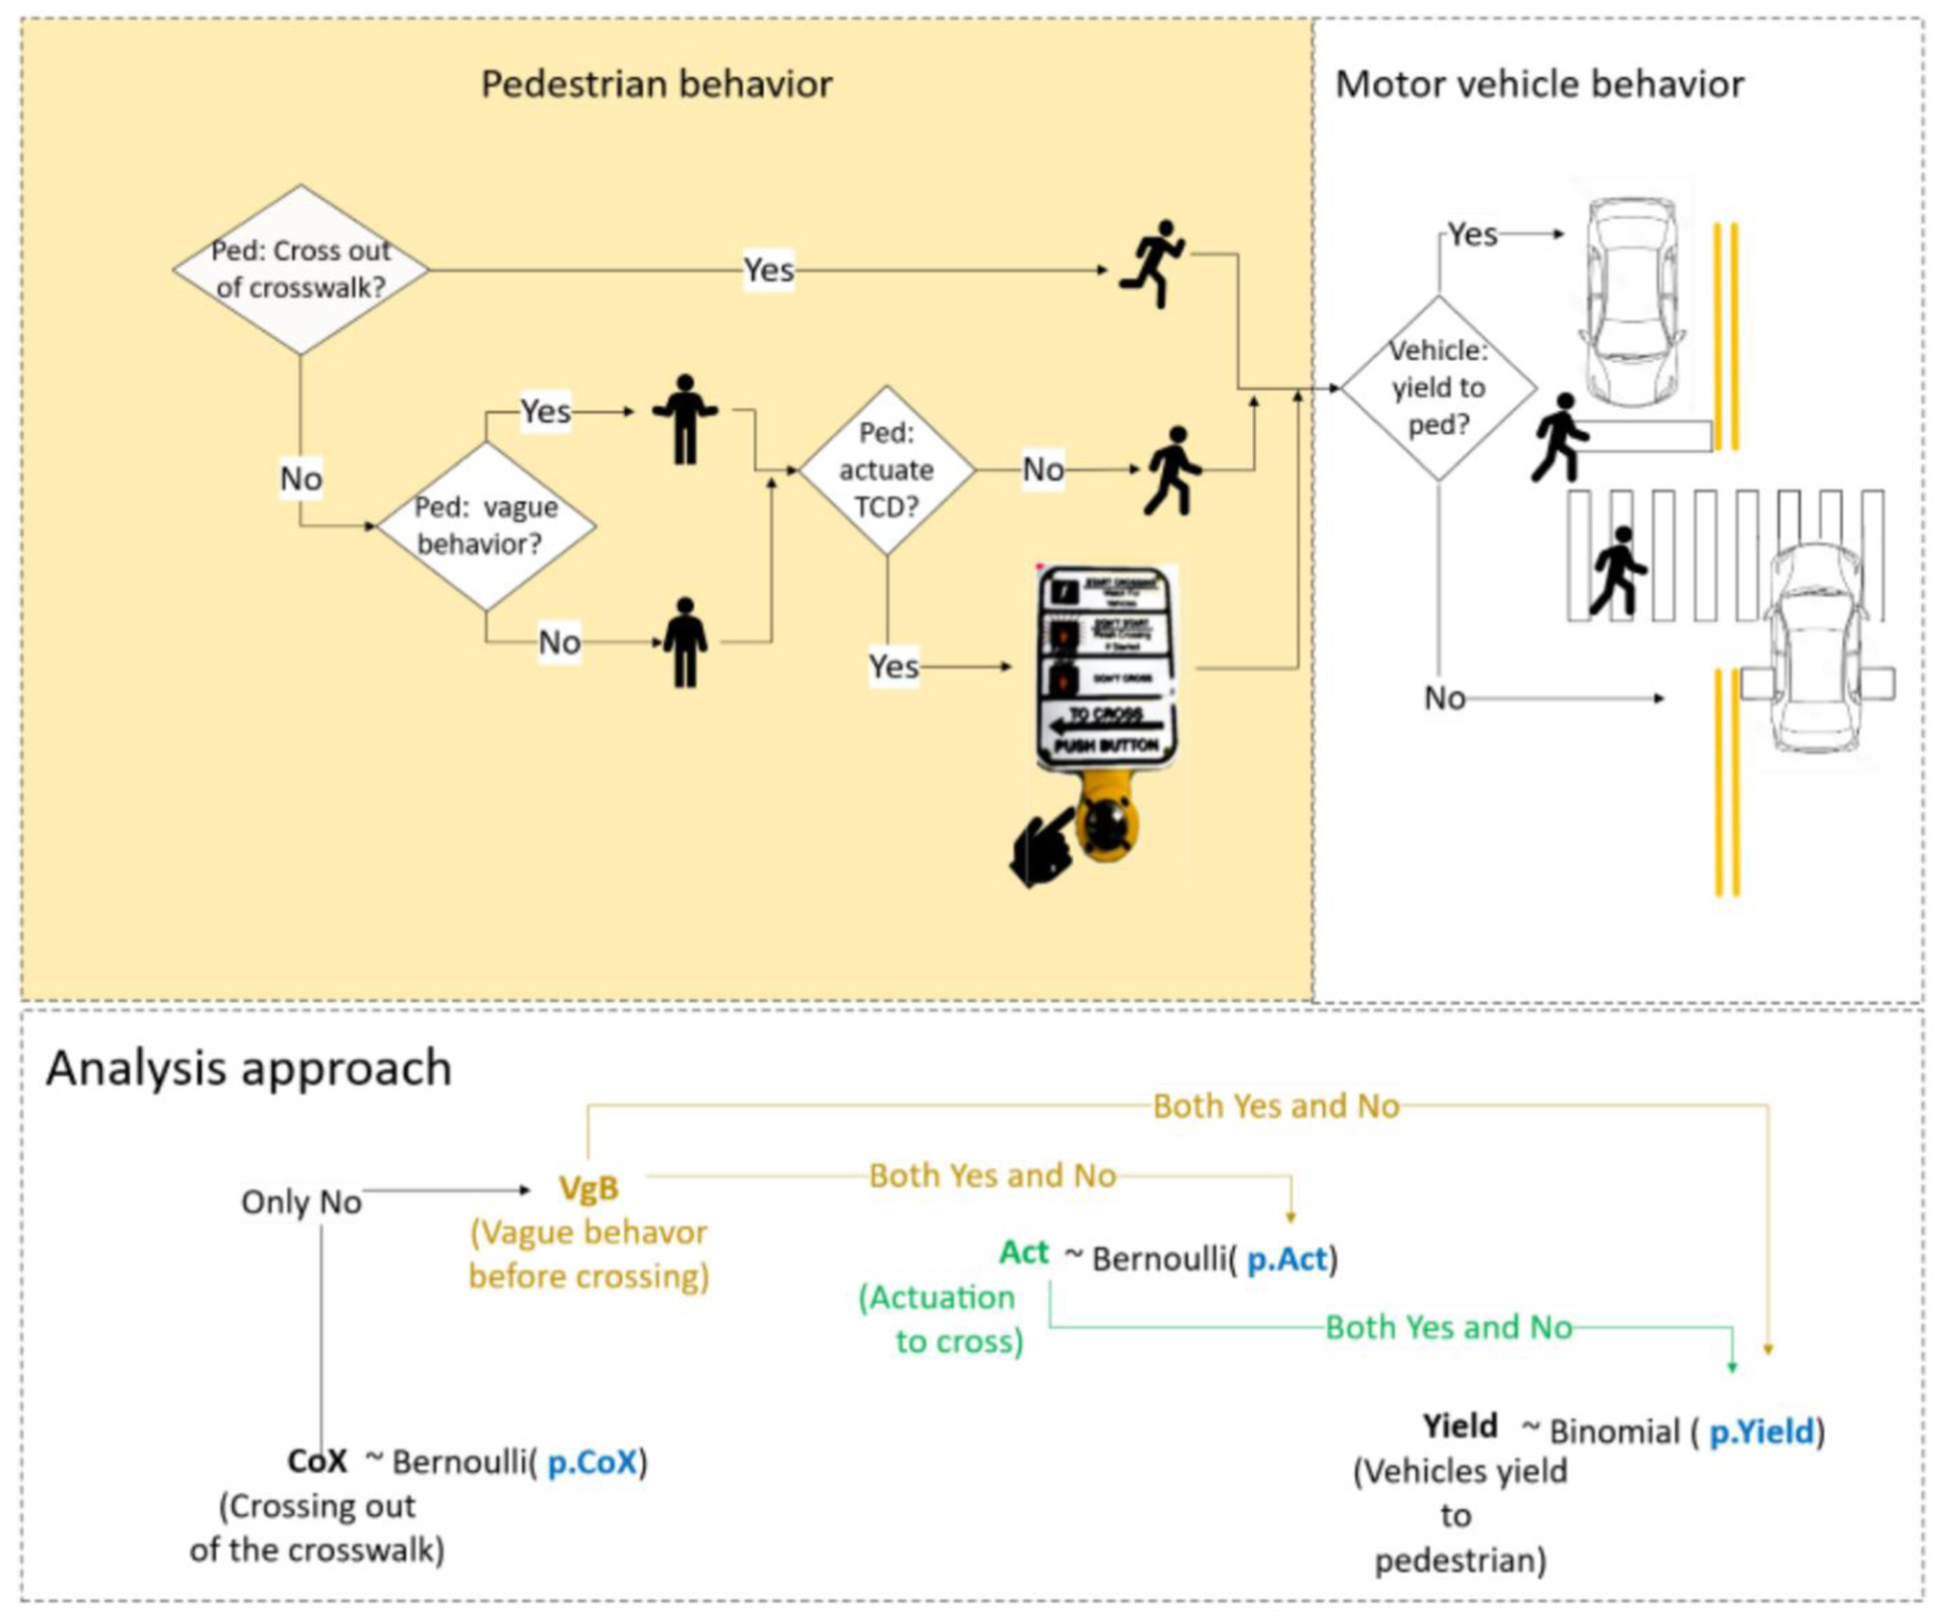
Relationship between response variables, coding, and modeling approach.
We considered the state of past decisions as explanatory factors (i.e., vague behavior as explanatory in actuation, and both of these affect driver yielding). Note that the analyses considered the actual state of past decisions (either yes or no) rather than their predicted probabilities as is the case in path analysis. Considering this distinction, we think fitting a univariate model at every stage is a valid approach because the actual outcome should implicitly reflect the factors influencing the prior decisions without the need to impose further assumptions.
Additionally, because the data structure comprises clusters of codependent subsets (i.e., 15 clusters of data, one per location), the analysis must properly account for repeated measures. Mixed-effects models can handle these situations and are robust against bias caused by imbalanced data clusters (i.e., where some clusters of data are significantly larger than others). The structure of mixed-effects models allows for both fixed and random effects ( 20 ). In this case, a random effect per every unit of data aggregation (i.e., the blocking units in the data, such as individual study locations) is included in the formulation of the model, representing an orthogonal (i.e., independent) random intercept in addition to the fixed effects estimates. As in Generalized Linear Models, a link function is specified to permit the modeling of different data distributions as appropriate. In this case, the logit function links a binary or binomial response to a linear combination of the explanatory variables. Therefore, the general formulation of the logistic mixed model is shown in Equation 1:

where
Both
All our analyses considered and accounted for variables at the individual crossing level. We note that variables for the number of pedestrians in the group and pedestrians in a queue to cross were treated separately in the pedestrian behavior analyses but aggregated in the driver-yielding analysis because drivers should perceive them jointly. All analyses were performed using the statistical software R version 4.4.0 and its packages ( 22 ) and custom code to incorporate the described conceptual framework.
Table 3 shows the analysis results. The shading bands (white or gray) in this table show logical groups of explanatory variables. For example, parameters 4 through 10 comprise the collection of ways the analyses accounted for motor-vehicle-exposure variables in the conceptual chain of events.
Mixed Effects Logistic Model Estimates
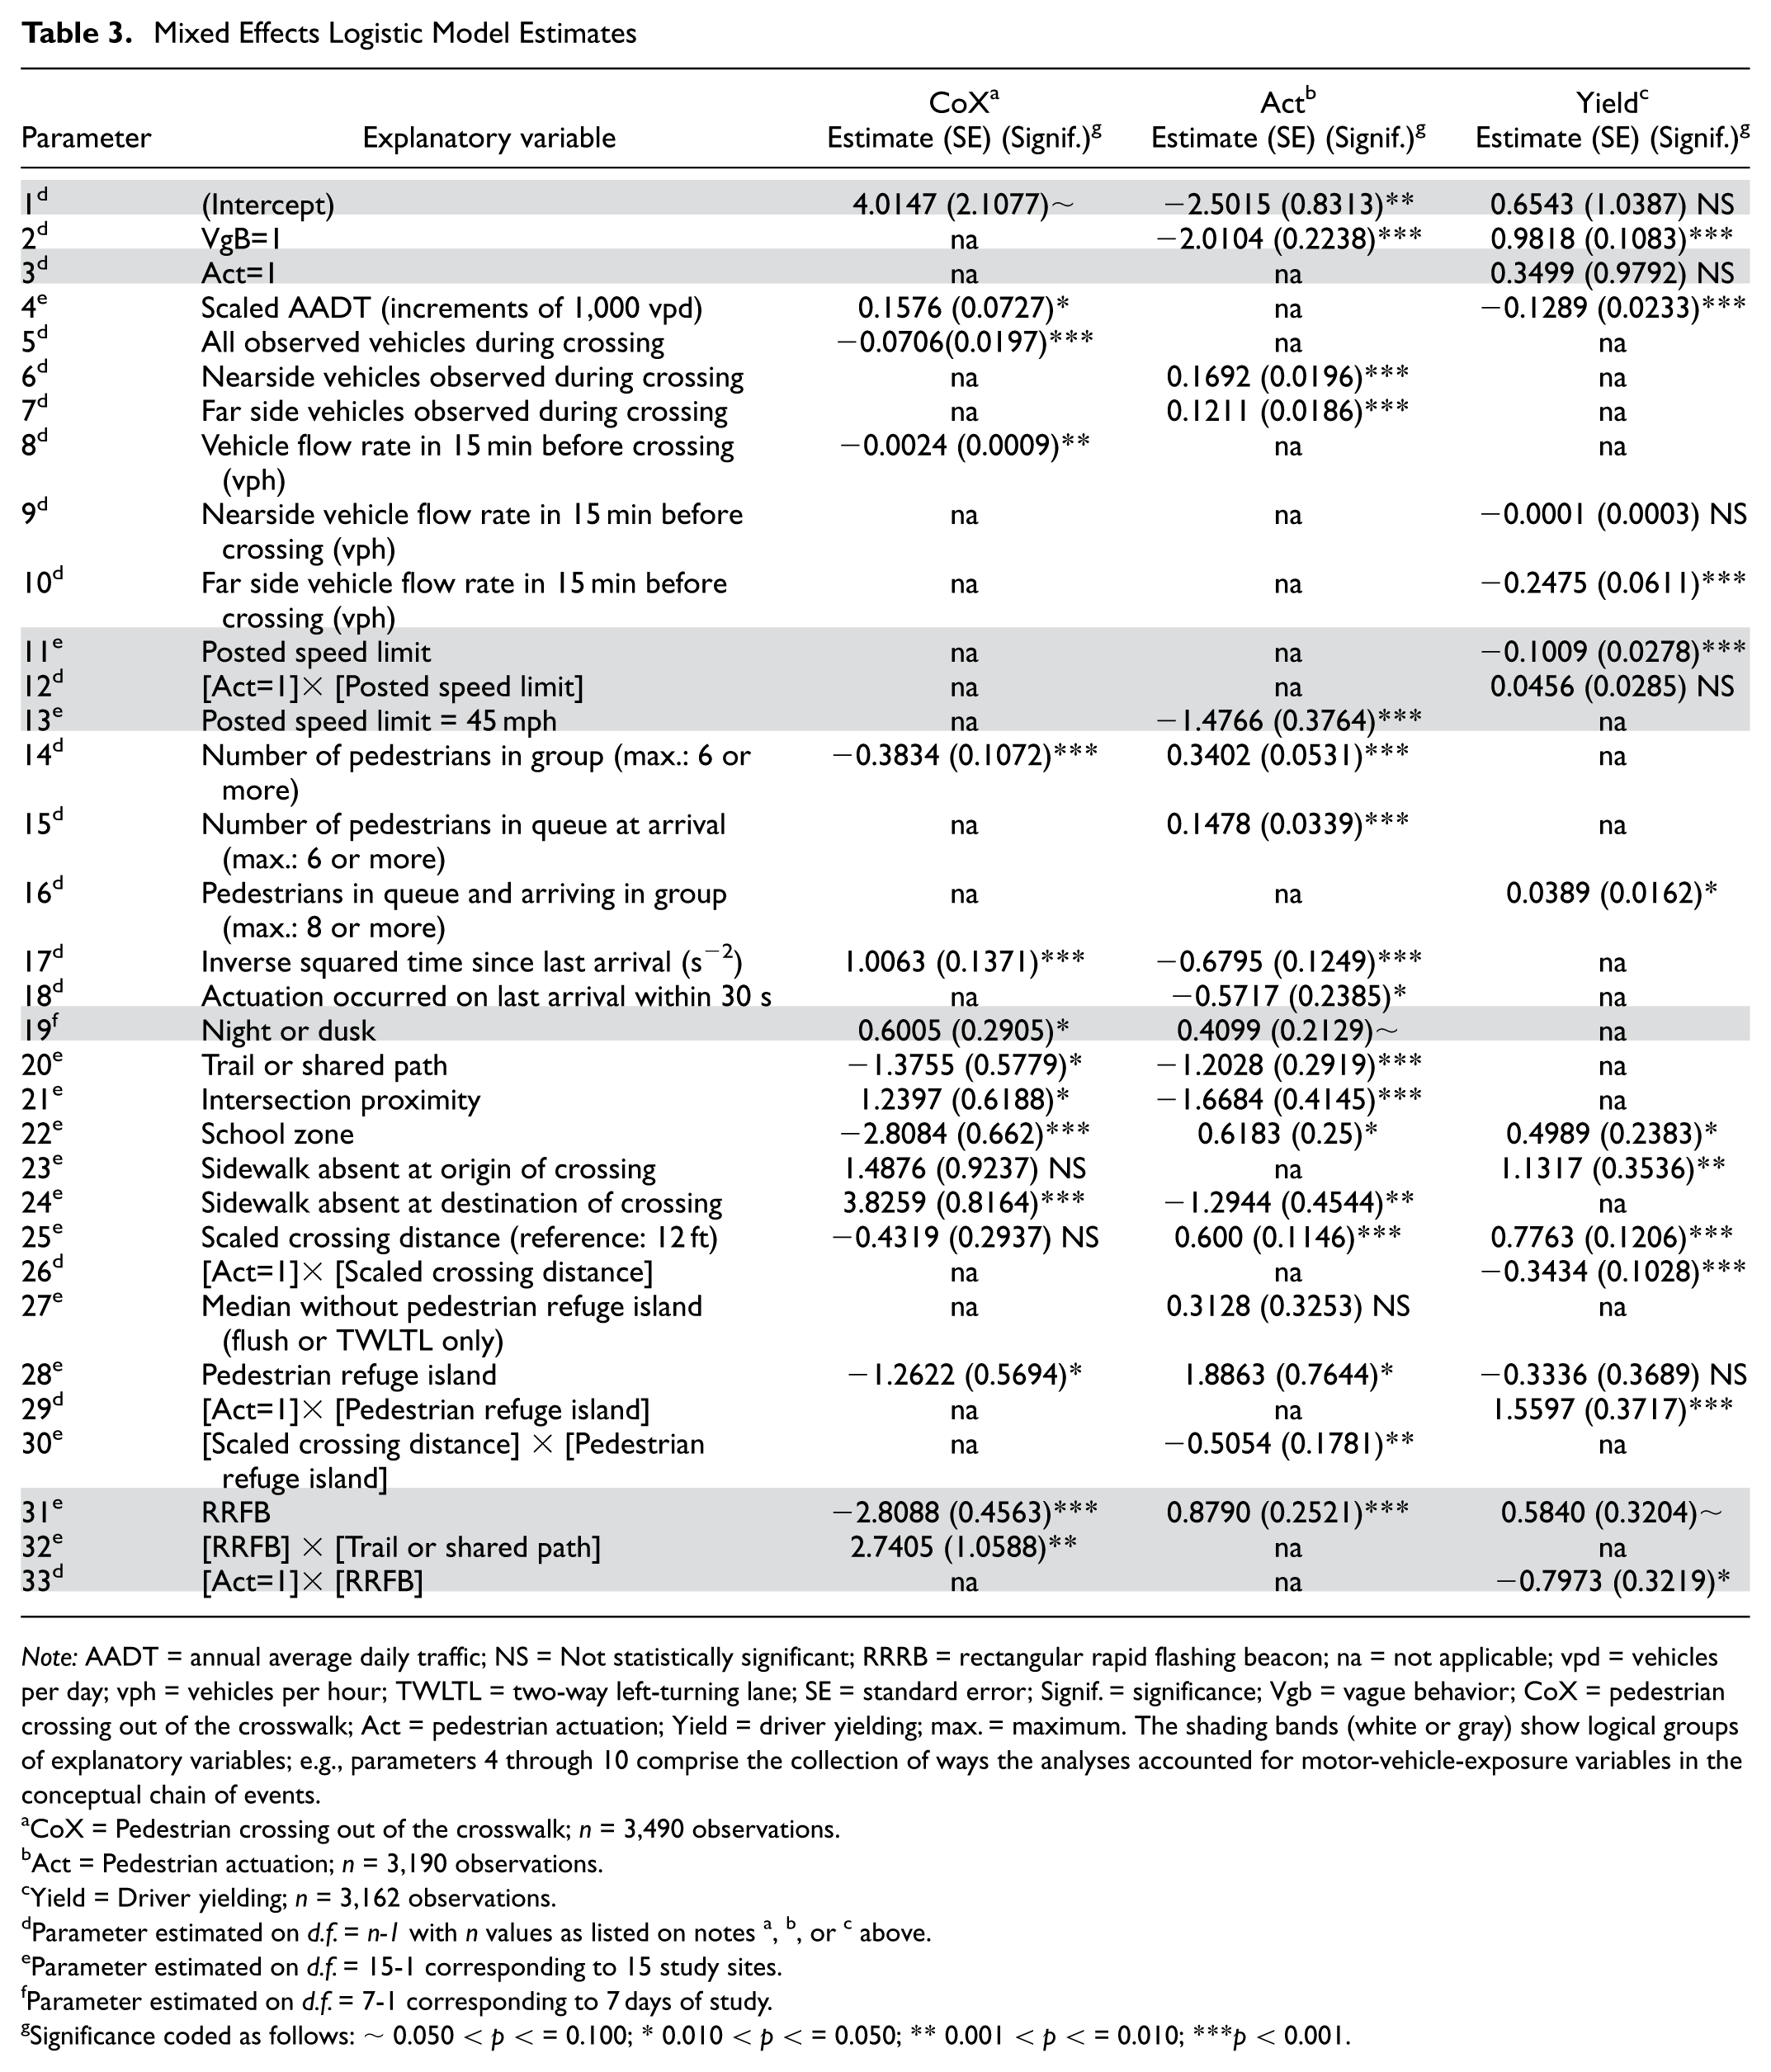
Note: AADT = annual average daily traffic; NS = Not statistically significant; RRRB = rectangular rapid flashing beacon; na = not applicable; vpd = vehicles per day; vph = vehicles per hour; TWLTL = two-way left-turning lane; SE = standard error; Signif. = significance; Vgb = vague behavior; CoX = pedestrian crossing out of the crosswalk; Act = pedestrian actuation; Yield = driver yielding; max. = maximum. The shading bands (white or gray) show logical groups of explanatory variables; e.g., parameters 4 through 10 comprise the collection of ways the analyses accounted for motor-vehicle-exposure variables in the conceptual chain of events.
CoX = Pedestrian crossing out of the crosswalk; n = 3,490 observations.
Act = Pedestrian actuation; n = 3,190 observations.
Yield = Driver yielding; n = 3,162 observations.
Parameter estimated on d.f. = n-1 with n values as listed on notes a, b, or c above.
Parameter estimated on d.f. = 15-1 corresponding to 15 study sites.
Parameter estimated on d.f. = 7-1 corresponding to 7 days of study.
Significance coded as follows: ∼ 0.050 < p < = 0.100; * 0.010 < p < = 0.050; ** 0.001 < p < = 0.010; ***p < 0.001.
With regard to parameter 2 in the case of the actuation analysis (fourth column in Table 3), we found statistical evidence of a reduced actuation odds ratio (Act OR) when pedestrians behaved vaguely at the crosswalk (exp[−2.0104] = 0.134 Act OR) but increased yielding odds ratio (exp[0.9818] = 2.669 Yield OR). For parameter 3 we will discuss the implications of this variable and others interacting with it in more detail later in the paper.
For parameters 4 through 10, the statistical evidence in the third column of Table 3 indicates that pedestrians crossing out of the crosswalk (CoX) are more likely at locations with higher AADTs (parameter 4) but during periods with fewer vehicles during the crossing (parameter 5) and after 15-min periods with lower vehicle flow rates (parameter 8). For parameter 4, the fifth column indicates that yielding odds tended to decrease with increasing traffic as denoted by the AADT. As shown in the fourth column, the odds of actuation increased at crossings with more nearside and far side vehicles present (parameters 6 and 7). In contrast, parameter 10 indicates that drivers were less likely to yield to pedestrians in periods followed by higher vehicle flow rates on the far side of the crossing (i.e., this estimate is negative and statistically significant).
With regard to posted speed limits, yielding odds tended to drop with increasing speed limits (a negative and statistically significant parameter 11 estimate), but that effect is mitigated at crossings involving actuation (adding parameter 12 to parameter 11). Parameter 13 indicates lower actuation odds at locations with a posted 45-mph speed limit compared with sites with either a posted 25-mph or 35-mph speed limit.
Although we can offer similar interpretations for parameters 14 through 18, we will only ascertain that pedestrian behavior and driver yielding varied with the number of pedestrians in the group, the number of pedestrians already in a queue to cross, and the time since the last pedestrian arrival.
In accordance with parameter 19, the odds of crossing out of the crosswalk and actuation increased at dusk and at night (1.823 CoX OR and 1.507 Act OR, respectively). This is an interesting mix of safer and riskier behaviors; the risky behavior seemingly shifts for some pedestrians from not actuating to actuating but for others, it shifts from crossing in the crosswalk to crossing outside the crosswalk.
Findings from parameter 20 indicate that, all things being equal, the odds of crossing out of the crosswalk and actuation were lower at trails or shared paths. The two estimated effects of crossings near intersections indicated undesired behaviors: crossing out of the crosswalk was more likely at these locations (3.455 CoX OR), while actuation was less likely (0.189 Actuation OR), per parameter 21. In contrast, all estimates for parameter 22 (i.e., school zone) suggest desired behaviors by both user types: a very large and significant drop in the odds of crossing out of the crosswalk (0.060 CoX OR), a large and significant increase in actuation odds (1.856 Act OR), and a large and significant increase in driver-yielding odds (1.647 Yield OR).
Impacts of Actionable Variables
We paid special attention to the explanatory variables related to physical features of the sites and TCD types (parameters 23 through 33) because they could suggest actionable strategies to improve pedestrian behavior and driver compliance in current and future locations.
Parameters 23 and 24 indicate one such factor: the absence of sidewalks on one side of the crossing—a condition present at two out of the 15 study locations. This condition was found statistically significant related to worse pedestrian behavior, while driver yielding was found to compensate for that behavior. The odds of CoX and Yield both increased when a sidewalk was absent on one side of the crossing (4.426 CoX OR and 3.101 Yield OR when a sidewalk was absent on the nearside; 45.876 CoX OR when absent on the far side). Additionally, pedestrians were also less likely to actuate when the crossing lacked a sidewalk on the far side (0.274 Act OR).
In relation to the odds of crossing out of the crosswalk, parameter 25 indicates decreased odds at wider crossings (0.649 CoX OR per each additional 12 ft of crossing), while parameter 28 indicates that the presence of pedestrian refuge islands was associated with decreased odds of crossing out of the crosswalk (0.283 CoX OR).
Interestingly, CoX odds were found to be significantly higher at non-trail or shared path locations having a PHB compared with an RRFB (1/exp[−2.8088] = 16.590 CoX OR for PHB). No such differences by device type were observed at trail or share path locations (1/exp[−2.8088+2.7405] = 1.071 CoX OR for PHB).
We found the odds of actuation were higher at locations with RRFBs (2.409 Act OR, per parameter 31) compared with PHBs. In contrast, our analysis found no statistically significant differences between devices with regard to yielding odds when inactive, in accordance with parameter 31 (1.793 Yield OR for inactive RRFB compared with PHB with a 0.068 p value).
Calculating and interpreting marginal effects from the rest of parameter 25 through 30 estimates is not straightforward because the effects are more intertwined (i.e., interacting variables). We present the marginal effects derived from these parameters in the following subsections to ease the presentation, interpretation, and discussion of the results.
Actuation Odds by Cross Section
Figure 4 shows the joint effects on pedestrian actuation odds at some combinations of cross-sectional elements of interest. For these scenarios, each lane or median is assumed to be 12-ft long. Varying this assumption should result in mild, likely inconsequential shifts of the estimates shown in Figure 4.
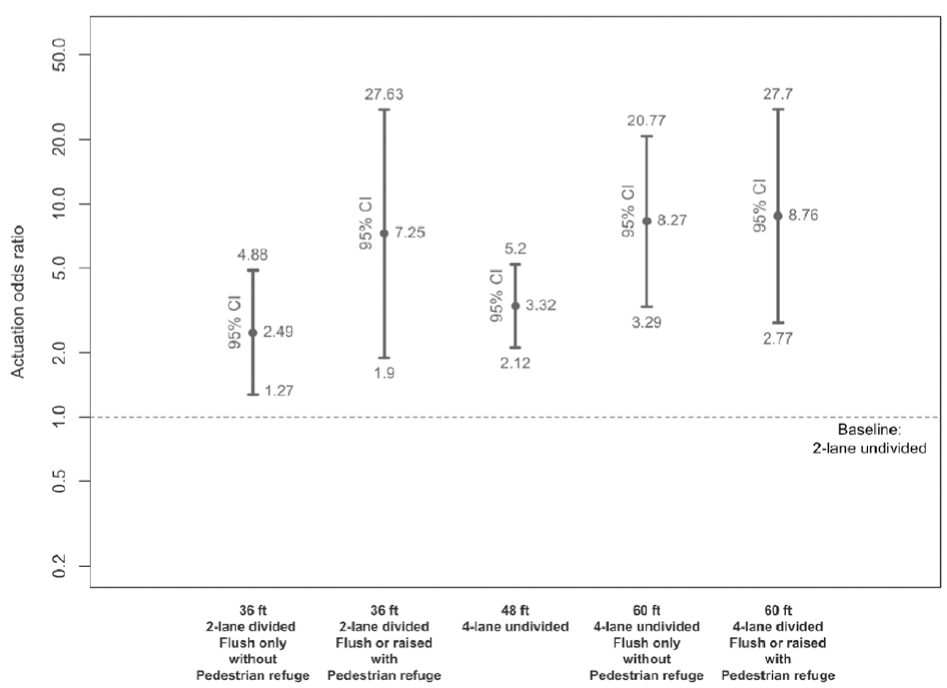
Actuation odds ratios for select cross-section scenarios.
Results indicate statistically significant increased odds of actuation (at the 95% confidence level) for all scenarios (i.e., higher odds of actuation compared with two-lane undivided roads) meaning that wider crossings are associated with increased odds of actuation, with a slight increase in actuation odds when a pedestrian refuge is present.
Driver Yielding by Device Type, Actuation, Cross Section, and Speed Limit
Figure 5 shows the marginal effects of actuation with varying two-lane cross sections, device type, and speed limits. Not surprisingly, we found that actuation was generally associated with positive and often statistically significant increases in driver-yielding odds. Two trends within the three groups in Figure 5 are: 1) PHB actuation seems generally more effective compared with RRFB actuation; and 2) Yield ORs tend to increase with actuation at increasing speed limits. The performances of two-lane undivided and two-lane divided roads are very comparable when there is no pedestrian refuge (i.e., flush or TWLTL medians only), but notably better when there is a pedestrian refuge in the median.
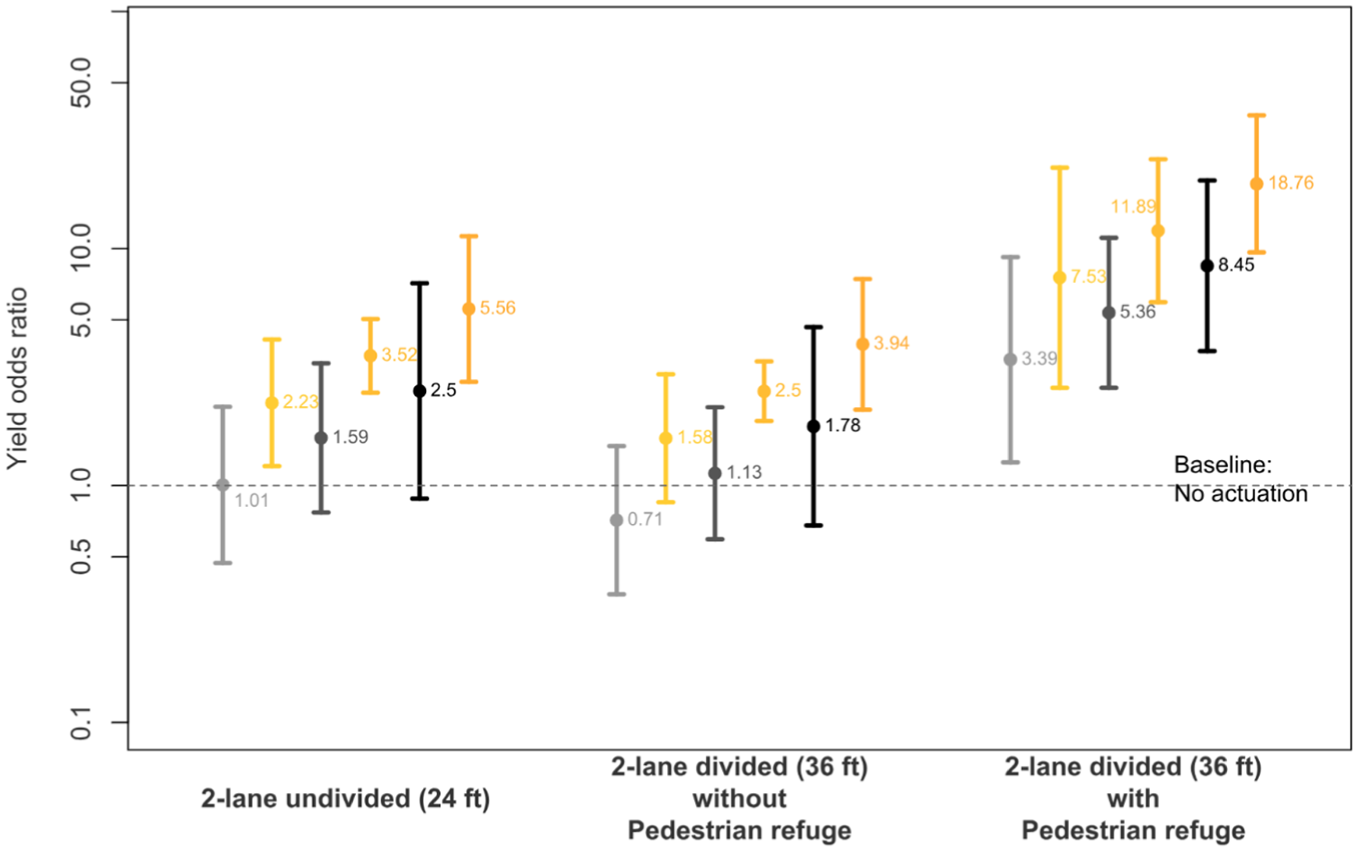
Marginal effects of actuation on driver yielding on two-lane roads.
Similar to Figure 5, Figure 6 shows the marginal effects of actuation at the corresponding four-lane scenarios. Except for a general drop in all estimates compared with Figure 5, the trends remain unchanged (i.e., higher effectiveness at PHB and higher speed limits). The estimates of RRFB actuation in this case tend to be statistically nonsignificant for the scenarios without a pedestrian refuge. For those scenarios, only three of the six estimates for PHB actuation indicate increased yielding odds.
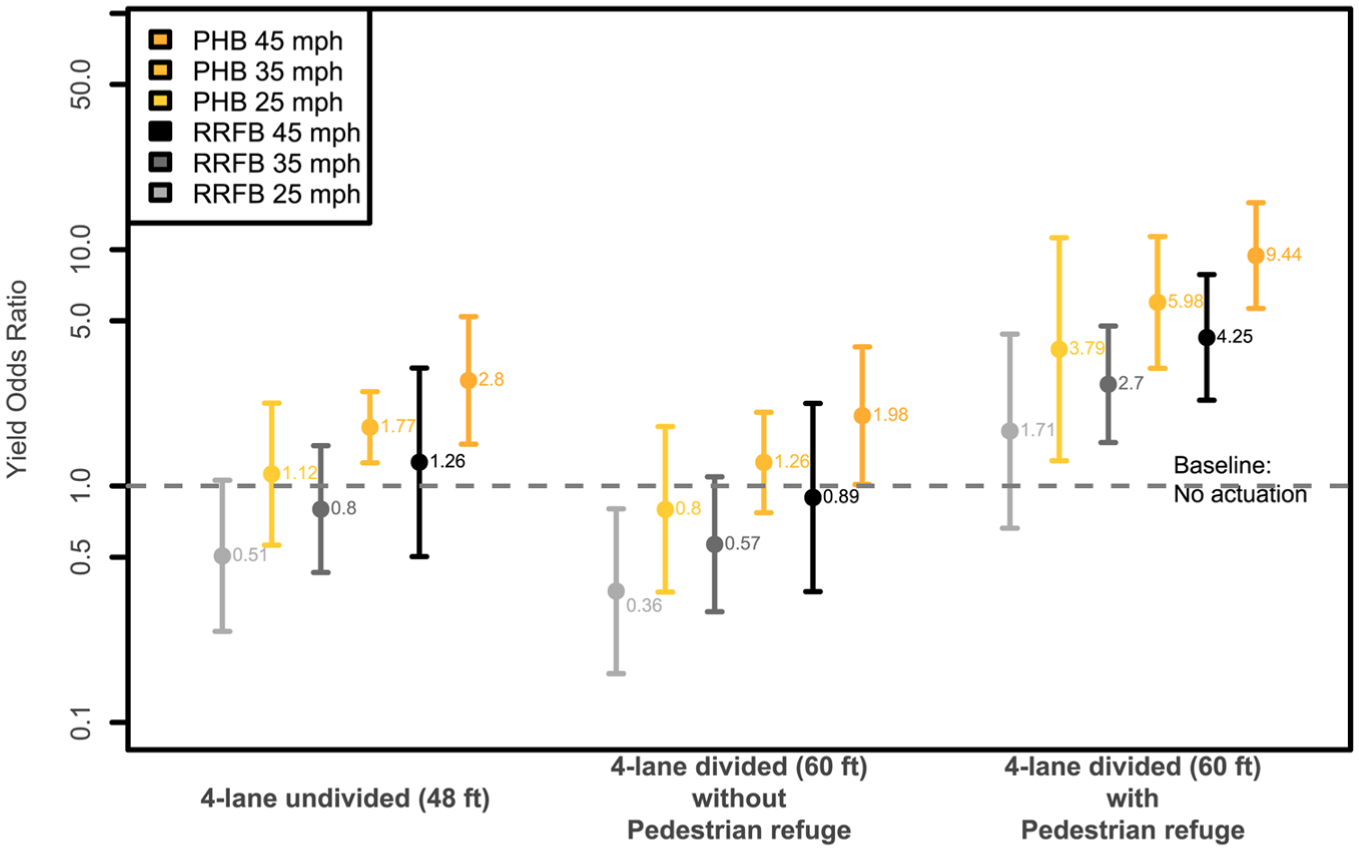
Marginal effects of actuation on driver yielding on four-lane roads.
However, stressing the importance of pedestrian refuges, all estimates indicate increased yielding odds when that feature is present. Except for RRFBs at 25 mph, all such estimates are positive and statistically significant.
Finally, we estimated the potential for improvement in yielding using a counterfactual scenario that assumes every crossing pedestrian actuates the corresponding device. We found a modest 13.2% average potential increase in yielding probability for the group of RRFB sites, compared with a notable 54.8% average potential increase in yielding probability for the group of PHB sites with all else being equal in the models.
Survey Study
We surveyed pedestrians in the vicinity of a subset of study locations to supplement the observational study.
The survey was conducted by a traffic-engineering company in North Carolina between May 28 and June 14, 2024, at five locations in Raleigh, NC. We limited the survey to adult pedestrians aged 18 years or older. The Advarra Institutional Review Board deemed it exempt from review. Because participants were intercepted after they were observed crossing the road, we were able to record three distinct groups of pedestrians: a) pedestrians who arrived at the crossing, actuated the TCD, and crossed while the TCD actively signaled to traffic; b) pedestrians who did not actuate the TCD and crossed the road while the TCD was not active; and c) pedestrians who did not actuate the TCD but crossed while the device was active.
Site Selection
Sites were selected based on the observed pedestrian volumes during the observational study keeping the covariate balance if possible. We avoided most crossings in school zones because of the age constraint for participants (i.e., adults only). The selected sites offered a good representation of device types (3 RRFBs), AADT range (3,900 to 23,000 vpd), crossing distances (24 to 73 ft), median presence (one raised, one flush), presence of a pedestrian refuge (the same two sites with medians), closeness to intersections (three sites), and trail or shared path crossings (two sites). Unfortunately, the crossing distance and device type are confounded (i.e., RRFBs paired with longer distances, PHBs paired with shorter distances). Therefore, contrasts between device types and between crossing distances from the survey data are intertwined with each other and must be interpreted carefully.
Questionnaire
The questionnaire consisted of six multiple-choice questions:
Frequency of walking
Purpose of current trip
Length of current trip
Factors influencing crossing behavior (traffic intensity, speed of cars, length of crossing, waiting time at device, specific phrasing varied by crossing group)
Factors that would increase chances of actuation (similar factors to question on crossing behavior)
Factors that would decrease chances of actuation (similar factors to question on crossing behavior)
In addition to the questions above, the interviewer coded four variables:
Age (asked)
Perceived gender (inferred)
Crossing group (A, B, or C; observed)
Crossing out of the crosswalk (observed)
Except for the question about frequency of walking, all questions offered the option “other” to capture reasons other than those provided in the questionnaire. Data were collected on tablets and mobile phones.
Demographics of Survey Responses
A total of 343 responses were obtained, as shown in Table 4, while 55 pedestrians declined to participate in the study. Table 4 shows the breakdown of recorded survey answers. Nearly two thirds (67%) of responses were from Group A, while responses from Groups B and C amounted to approximately one sixth of the total each. We performed homogeneity tests for the distributions of answers to each question comparing Group A—taken to be the reference distribution—and Groups B and C. In no case was Group C found statistically significantly different from Group A (i.e., no evidence that the distributions were different), while we found two instances where Group B was statistically different from Group A.
Survey Responses by Activation Group (n = 343)
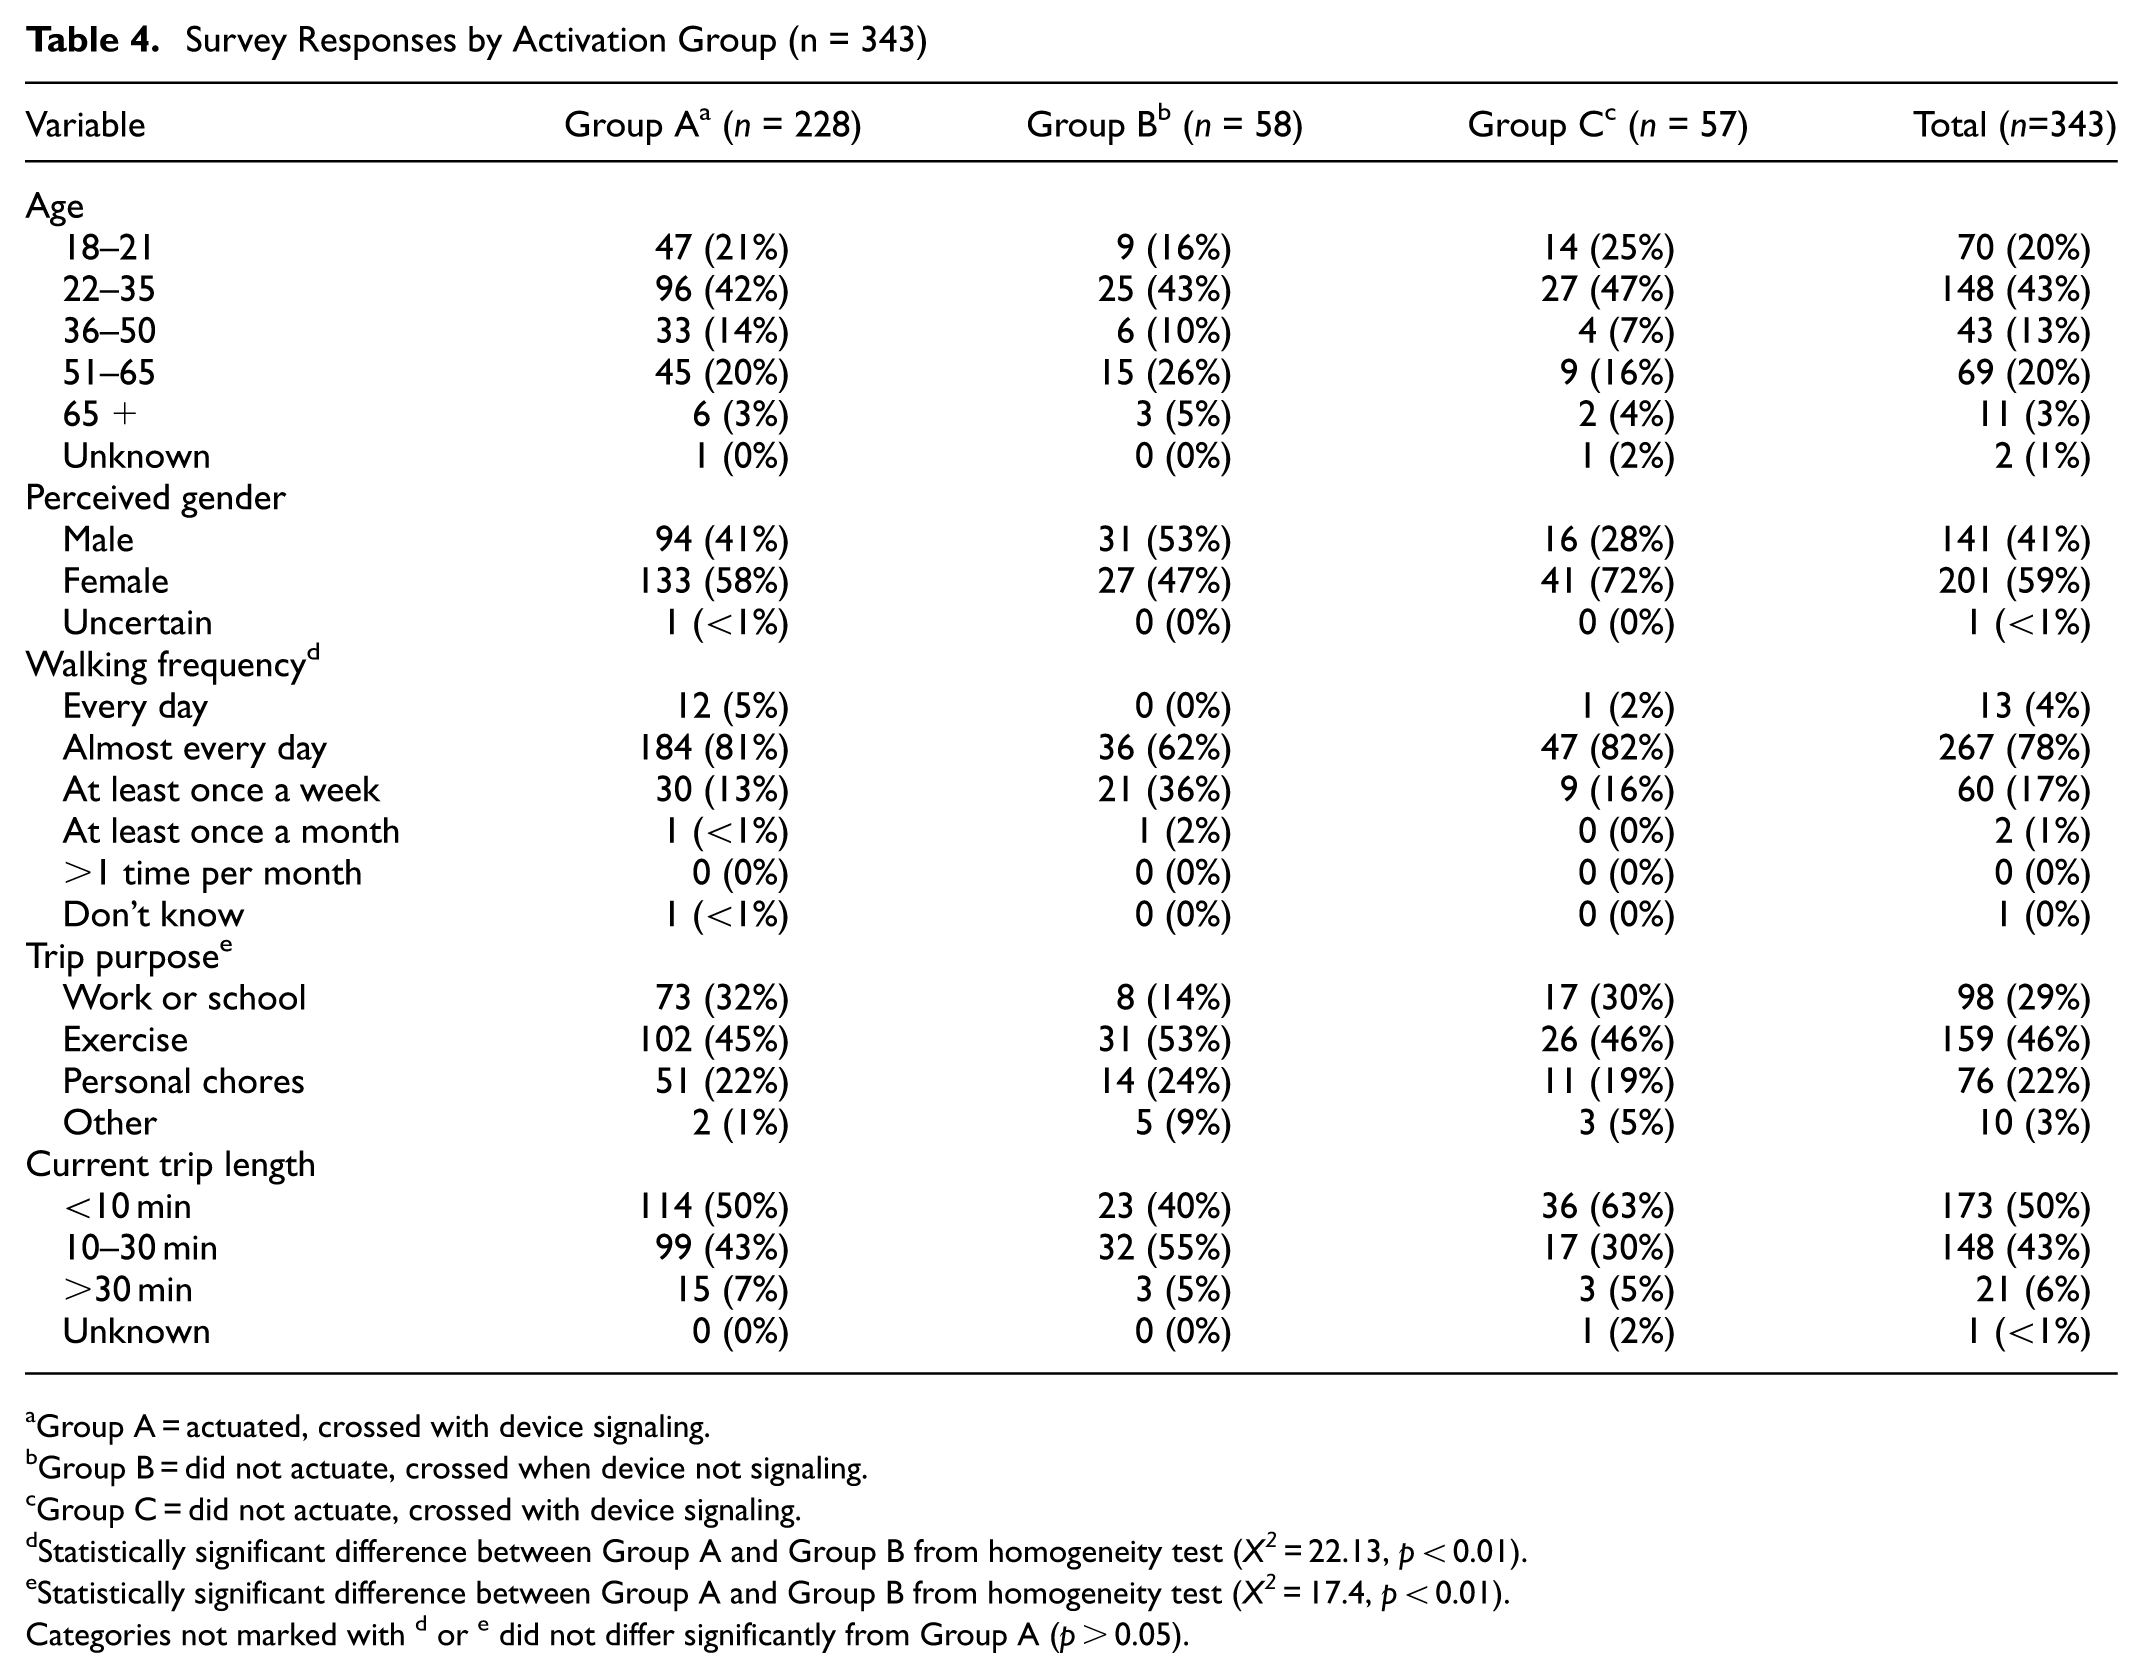
Group A = actuated, crossed with device signaling.
Group B = did not actuate, crossed when device not signaling.
Group C = did not actuate, crossed with device signaling.
Statistically significant difference between Group A and Group B from homogeneity test (X 2 = 22.13, p < 0.01).
Statistically significant difference between Group A and Group B from homogeneity test (X 2 = 17.4, p < 0.01).
Categories not marked with d or e did not differ significantly from Group A (p > 0.05).
We found that trip purpose and walking frequency differed between groups A and B, with those who crossed with no activation (Group B) being less likely than activators (Group A) to walk as a means of transportation every or most days, in turn being more likely to walk at least once a week. We also found the proportion of non-actuators (Group B) who were traveling to work or school on this trip notably smaller than for actuators (Group A), and in turn having a larger proportion of other stated trip purposes, in particular for “Other” and “Exercise.” Age, perceived gender, and trip length did not differ significantly by group.
Stated Motivations for Behavior and Influential Factors to Future Crossings
When asked to note the top three reasons for their observed mode of crossing, we found that the most common reasons pedestrians who actuated (Group A) gave for pushing the device’s button to flash its lights were heavy traffic (86%), fast cars (86%), long crossings (51%), and it’s safer to cross with the device flashing (47%).
Group B pedestrians’ most common answers to why they decided not to push the device’s button to make it flash to traffic were light or no traffic (59%) and they did not want to wait for the device (41%). No Group B respondents reported that they did not know they should press the button or did not know how it works. Nearly all Group C pedestrians (98%) reported crossing while the device was flashing because somebody else had pressed the button.
Figure 7 shows response frequencies for the most common factors Group B named that would make them more likely to push the button at a similar crosswalk device in the future. These were heavier traffic (52%), faster cars (48%), and no factor (41%).
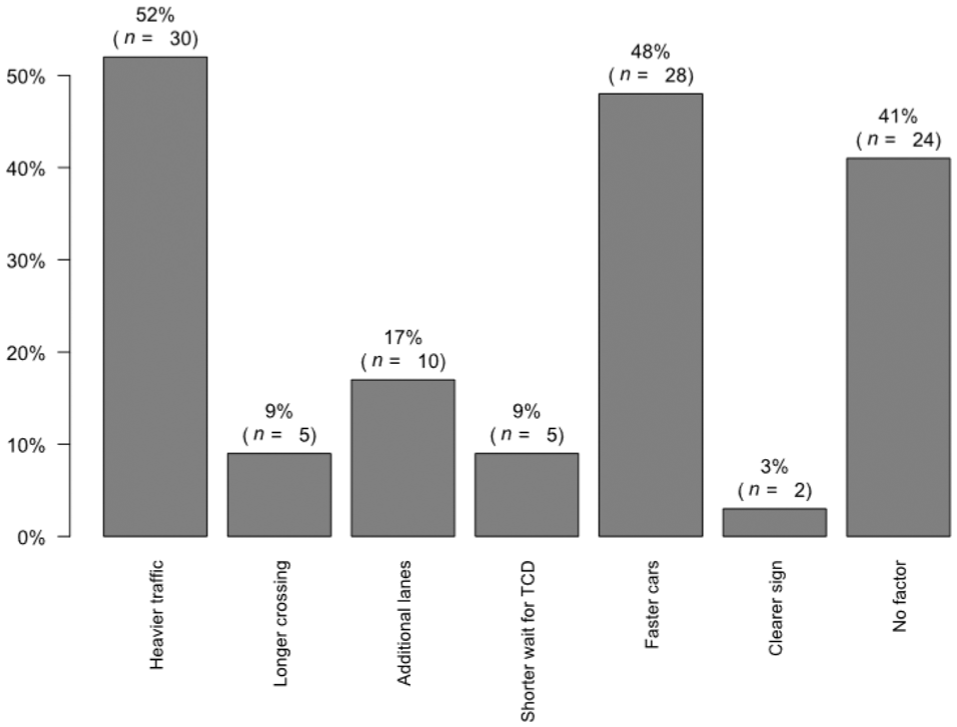
Stated factors that would increase chances of actuation in Group B (n = 58).
Figure 8 shows that for Group A, the most common factors named that would make them less likely to press the button at a similar device in the future were lighter traffic (78%), slower cars (74%), and either a shorter crossing or fewer lanes (67%).
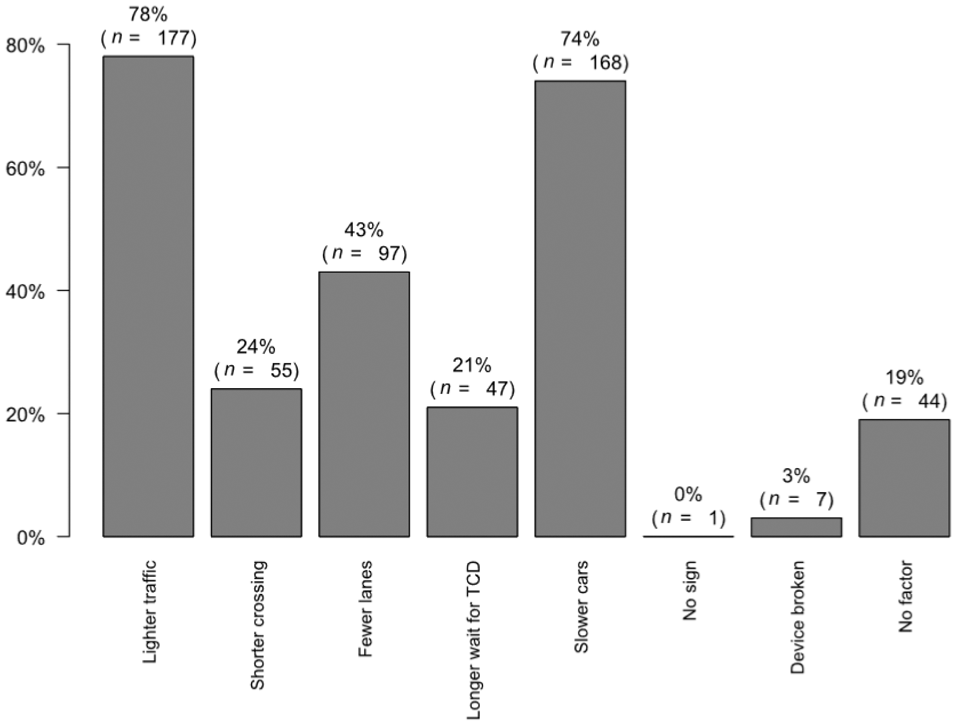
Stated factors that would reduce chances of actuation in Group A (n = 228).
In the light of the survey responses indicating that not wanting to wait for the device was a top reason for non-actuation, in the next section we reviewed waiting times from the observational study to better understand the differences in observed actuation between devices.
Analysis of Waiting Times by Device Type
Waiting time is defined as the time between pedestrian arrival to the concrete staging area by the crosswalk and the moment they begin to walk into the travel lanes to cross.
Figure 9 shows the waiting time distributions from the observational study including only pedestrians recorded as waiting for a gap in traffic to cross, as noted in the video reduction (waiting time rounded to the closest second). The waits were longer with PHB actuations (panel c), compared with RRFB actuations (panel a). Panels (b) and (d) show that both non-actuation distributions were similar.
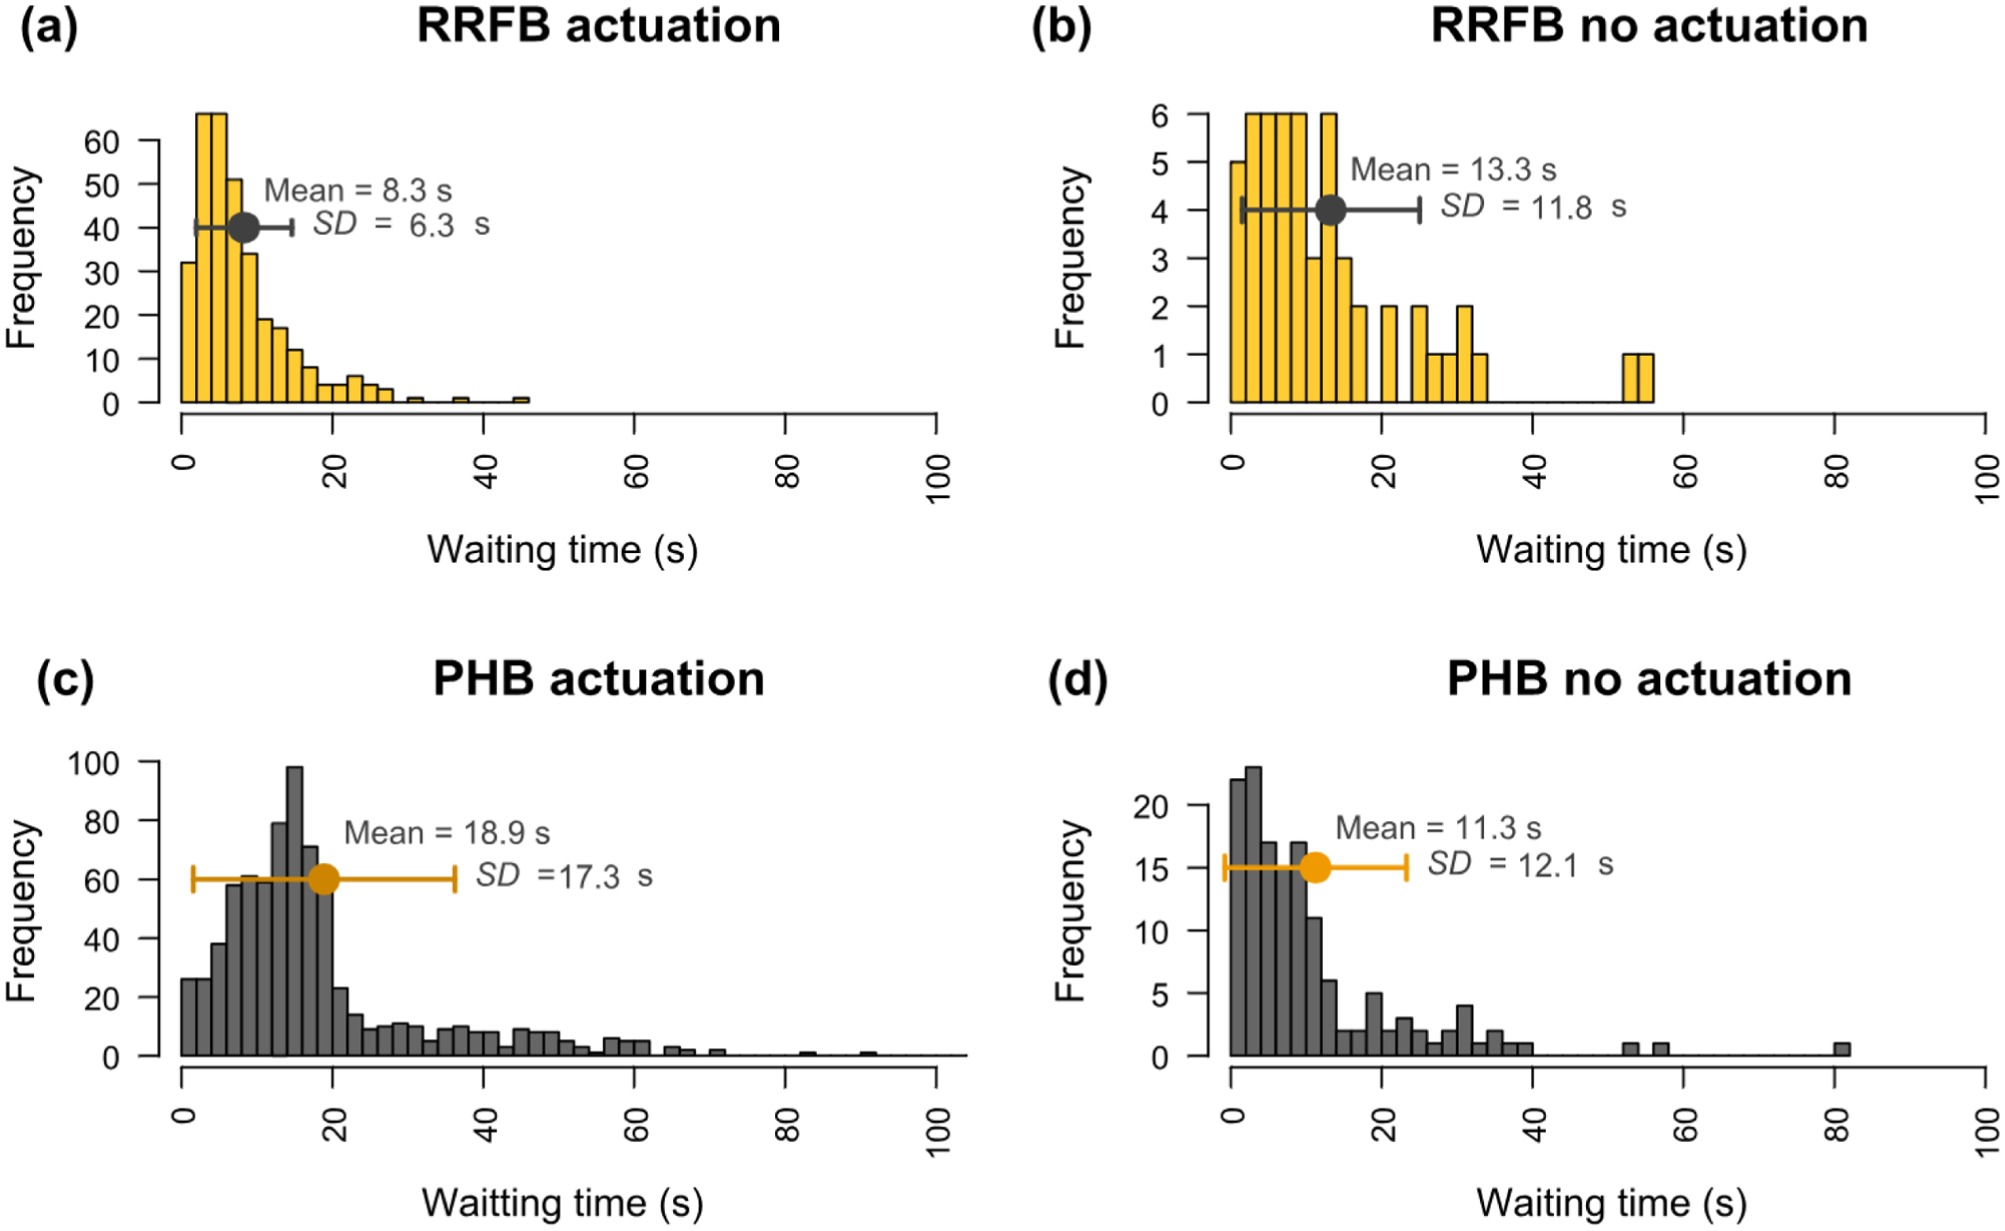
Marginal distributions for waiting times by device and actuation status.
We noted that the mean and standard deviation in panel (a) seem significantly smaller than panel (b), suggesting a reduced and more consistent waiting experience with actuated RRFBs compared with non-actuation, whereas the opposite is true for PHBs: longer and less reliable waits when actuated compared with not actuated, in accordance with panels (c) and (d).
We fitted a lognormal mixed-effects model on the median waiting time to check if these differences might be better explained by influential factors other than the device types. We found that the differences by device and actuation status persist, having statistically significant coefficients while controlling for random variations between blocks of aggregation (i.e., random effects including location, direction of travel, time of day, and day of week), number of pedestrians already in a queue, speed limit, and number of vehicles observed during the crossing. This model indicates that median waiting time was 52.0% shorter for an actuated RRFB compared with an actuated PHB under the same crossing conditions.
We noted in the survey that 41 out of 170 Group A respondents at RRFB sites (24.1%) reported being significantly less likely to actuate the device if the wait for activation were longer, compared with six out of 58 (10.3%) at PHB sites, X 2 = 4.207, df = 1, p = 0.0403. Perhaps this reflects that RRFB users assume (correctly) that they will experience a short, acceptable waiting time when actuating RRFBs compared with PHB users who might (correctly) assume longer perhaps unacceptable waiting times.
If PHB users have the expectation of longer waits when actuating these devices, it should not be surprising that a larger percentage of Group B pedestrians surveyed at PHB sites (19 out of 42 responses, 45.2%) reported not having actuated the device because they did not want to wait, compared with five out of 16 (31.3%) pedestrians at RRFB sites. This trend would suggest longer waits at PHBs might be steering more pedestrians not to actuate and crossing without the aid of these devices. However, this difference in proportions was not statistically significant (X 2 = 0.0447, df = 1, p = 0.504).
Conclusions and Recommendations
RRFBs and PHBs are effective countermeasures to increase yielding to pedestrians, but to optimally influence driver behavior pedestrians need to actuate them. This research examined pedestrian and driver behavior around midblock crossings in Raleigh and Charlotte, NC. We collected observational and survey data from a random sample of locations representing conditions equally likely to have either RRFBs or PHBs and a survey of pedestrians from a subset of these locations. After controlling for other influential factors, the odds of pedestrians actuating RRFBs were greater than the odds of actuating PHBs, but estimated yielding rates were greater at PHBs. We estimate that increasing actuation to 100% would raise the probability of drivers yielding by 13.2% at RRFBs and by 54.8% at PHBs when holding other conditions equal.
Key Findings
One of the main findings from our research is that pedestrians’ inclination to actuate either device is sensitive to their perception of friction or hazard at their intended crossing. Surveyed pedestrians who crossed after actuating reported that “heavy traffic,”“fast cars,” and “long crossing” were their main reasons for having actuated. Non-actuators reported similar answers when asked what factors would make them more likely to be actuators in the future. Additionally, the observational study documented behaviors consistent with these types for factors being associated with increased rates of actuation (higher odds of actuation at wider crossings, when more vehicles are present, and at night).
The results from our deeper examination of waiting times provide insights worth discussing. We found statistically significantly longer waiting times after actuation at PHBs compared with RRFBs. This extended wait at PHBs probably explains—to a large extent—why fewer pedestrians were observed actuating these devices. However, longer waiting times at PHBs should not be a surprise. A typical PHB cycle requires an initial flashing phase to alert drivers they will need to stop soon before signaling a mandatory stop to drivers. This flashing period is preceded in some cases by an additional period of wait for pedestrians to allow coordination with nearby signals to preserve traffic progression. In contrast, RRFBs entail no additional wait, starting to flash warning lights to upcoming vehicles immediately after activation. Future research should investigate systematic ways to reduce or keep the waiting times low at sites with PHBs. In our estimation, these devices have the larger potential to improve their yielding rates if pedestrians who are currently disinclined to actuate the devices could be encouraged to actuate more often.
Our observational study results clearly show a duality of behaviors around the two types of devices studied: on the one hand, drivers are more inclined to yield at actuated PHBs; on the other hand, pedestrians are less likely to actuate those devices. Each of these features is consistent with past findings by Fitzpatrick et al. ( 10 ) and Kutela and Teng ( 17 ), respectively. However, a caveat for our findings is that the studied locations represent conditions where cross sections and vehicle volumes are such that RRFBs are equally likely to be deployed. This is an important distinction to make because North Carolina DOT—similar to other agencies—outlines different criteria to select which of the two devices to deploy ( 23 ). Figure 1 reflects the outcome of the different criteria in the statewide distributions: PHBs are reserved for locations with larger cross sections, heavier traffic, and higher pedestrian volumes. Considering all these points, we are careful not to recommend one device over the other in a general sense, as AADT and crossing-distance ranges at the PHBs in our study do not cover the statewide range of the application of those devices. We note that in light of our results, it makes sense to reserve PHBs for more challenging crossing conditions. Pedestrians at those types of location should perceive an increased crossing friction and should thus be more motivated to actuate the devices and tolerate longer waiting times, according to responses to our survey.
Recommendations
From our survey, we did not find any non-actuators indicating not knowing how the devices work. Therefore, education about the devices should not be a high priority in efforts aiming to increase actuation rates.
We recommend further research into modifying the time plans for PHBs (even considering passive pedestrian detection), given our finding that these devices are underused and present the most potential for safety improvement. Future work should explore alternatives and find ways to avoid extending waiting times unnecessarily, especially in situations where coordination with adjacent signals is an important factor to consider.
In relation to other actionable factors by transportation agencies—geometry interventions and considerations for new deployments—we offer additional insights that might improve actuation and yielding rates. First, we notice that pedestrian crossings near intersections tended to engage in undesired behaviors (i.e., more crossing out of the crosswalk and fewer actuations). This observation suggests that PHBs and RRFBs should preferably be deployed at midblock locations, keeping some distance from intersections. Another recommendation for future deployments is the preferred consideration of RRFBs over PHBs at trails or shared path crossings where the traffic and crossing distance allow. This policy would result in increased actuation rates according to our examination of counterfactuals, all else being equal.
One potential intervention we identify from this work is the construction of sidewalks at both sides of locations having or planning to have pedestrian crossings with active TCDs. We found higher chances of unwanted pedestrian behaviors (i.e., more instances of crossing out of the crosswalk and lower chances of actuation) at locations lacking a sidewalk on one side of the crossing.
Recommending the construction of pedestrian refuges at locations with sufficient space for that purpose is probably the intervention with most potential we identified from this work. We found significantly improved performance both by pedestrians (slightly higher actuation odds and lower odds of crossing out of the crosswalk) and drivers (significantly higher yielding odds) regardless of the TCD type present at locations with this geometric element. This is consistent with Zeeger et al. who found this geometric element beneficial by itself ( 4 ).
Limitations
Although we consider our analyses comprehensive and our sample sizes robust in relation to the number of observed pedestrians (over 3,000 for the observational study, and over 300 for the survey), we would like to acknowledge the small number of sites represented (15 sites) as the main limitation of this study. Future research based on a larger sample should confirm some of the insights we present that were supported by a small number of study sites. For example, only two study sites had a sidewalk absent on one side of the crossing, only two were posted at 25 mph, and only three were posted at 45 mph.
Footnotes
Acknowledgements
Special thanks to Carrie L. Simpson and Daniel L. Carter from North Carolina DOT for their help on identifying the primary research question, feedback during planning for the field data collection, and suggestions on the draft manuscript. Thanks to the following colleagues at the Insurance Institute for Highway Safety (IIHS): Ian Reagan for his help and feedback in the survey planning stages; Amber Woods for helping supplemental data collection; and Eric Teoh for his helpful manuscript editing suggestions. Thanks to David Harkey from IIHS and Shawn Troy from North Carolina DOT for their feedback at key milestones in the project.
Author Contributions
The authors confirm contribution to the paper as follows: study conception and design: Raul Avelar and Jessica Cicchino; data collection: Raul Avelar; analysis: Raul Avelar; analysis and interpretation of results: Raul Avelar and Jessica Cicchino; draft manuscript preparation: Raul Avelar and Jessica Cicchino. All authors reviewed the results and approved the final version of the manuscript.
Declaration of Conflicting Interests
The authors declared the following potential conflicts of interest with respect to the research, authorship, and/or publication of this article: Raul Avelar is a member of Transportation Research Record’s Editorial Board.
Funding
The authors disclosed receipt of the following financial support for the research, authorship, and/or publication of this article: The Insurance Institute for Highway Safety (IIHS) funded this research.