
Abstract
Signalized intersections are recognized as traffic bottlenecks that increase vehicle stops, leading to frequent acceleration events on urban roads and potentially elevating overall fuel consumption when red signals are encountered. With advances in emerging technologies, connected autonomous vehicles (CAVs) can be optimally controlled to improve energy efficiency while accounting for future traffic constraints. In mixed traffic environments, a controlled CAV can directly influence the energy efficiency of following human-driven vehicles (HVs) because of car-following behavior. This paper considers the CAV and its following HV simultaneously in the design of energy-efficient vehicle control strategies. By leveraging traffic prediction results, the speed trajectory and powertrain operation of a connected autonomous electric vehicle (CAEV) is co-optimized, explicitly accounting for multiple HVs behind it. Simulation results show that the total energy savings of a vehicle platoon increased from 7.47% to 10.05% as the number of HVs considered in the optimization rises from zero to five. Furthermore, the effect of multiple CAEVs on platoon-level energy efficiency is comprehensively analyzed, with improvements from 8.1% to 15.2% when multiple HVs follow each CAEV.
Keywords
Introduction
The transportation sector is the leading source of greenhouse gas (GHG) emissions in the US, contributing 28% of the total in 2022 ( 1 ), with the majority of these emissions stemming from carbon dioxide (CO2) released during the combustion of fossil fuels in vehicles such as cars, trucks, and ships ( 2 ). Of note, over 90% of the fuel consumed in the transportation sector is petroleum-based, primarily gasoline and diesel. Given the significant environmental and health effects of CO2 and other GHG emissions, enhancing energy efficiency in this sector has become a critical and urgent priority to mitigate their effects. One practical and cost-effective strategy to improve energy efficiency in the transportation sector is eco-driving ( 3 ). In mixed traffic flows, where vehicles with different fuel types, including gasoline-powered vehicles, coexist, eco-driving can play a critical role in reducing fossil fuel consumption and associated carbon emissions (4–6). Adopting eco-driving practices offers multiple advantages. First, it directly reduces fuel consumption, leading to significant energy savings for individual drivers. Second, it lowers CO2 and other GHG emissions, helping to mitigate climate change. Both benefits contribute positively to the environment.
With the help of vehicle-to-vehicle (V2V) and vehicle-to-infrastructure (V2I) communications, individual vehicles can be coordinated to achieve greater energy efficiency. Numerous studies have investigated the optimization of connected autonomous vehicle (CAV) trajectories on freeways and arterial roads (7–9). Compared with freeways, urban roads are more complex because of the higher density of signalized intersections and the relatively limited spatial coverage of each intersection. Some research has explored how connected vehicle (CV) applications can assist drivers in navigating signalized intersections by providing fuel-efficient trajectory guidance. For example, the literature ( 10 , 11 ) presents a speed-planning routine that relies on signal timing data to align vehicle arrivals with green phases at consecutive intersections. The approach aims to curb frequent acceleration and braking cycles, as well as complete stops, to lower fuel use. However, simply constraining acceleration or deceleration is not enough to ensure minimal energy consumption. To more effectively optimize CAV trajectories based on actual fuel usage, several studies have developed eco-driving strategies for a single CAV operating in mixed traffic urban environments. For instance, in the literature ( 12 ), an eco-trajectory planning approach was proposed that uses dynamic programming to generate a long-range reference speed profile for the CAV to follow. However, the reference trajectory is generated without considering the surrounding traffic. Similarly, some studies ( 13 , 14 ) focus exclusively on minimizing idling time and smoothing acceleration and deceleration, without accounting for the influence of surrounding vehicles. To explicitly consider the surrounding traffic while minimizing fuel consumption, a novel optimal strategy that adjusts both vehicle speed and gear position was developed ( 15 ), accounting for energy consumption at the vehicle and powertrain levels. By leveraging traffic predictions based on the Payne–Whitham (PW) model, this approach demonstrated an energy consumption reduction of over 10% in numerical simulations.
Accurate short-term prediction of preceding traffic provides essential input for optimal longitudinal control, enabling improvements in traffic throughput and reductions in energy consumption via speed adjustments in the target CAV, a strategy commonly referred to as eco-driving (16–19). Energy savings in the performed experiments varied from 6% ( 20 ) and 9% ( 21 ), up to over 20% reductions considering Signal Phase and Timing (SPaT) messages ( 13 , 22 ). These studies often presented an objective function to minimize energy consumption subject to physical and traffic constraints. Among the available control strategies, model predictive control (MPC) ( 23 ) has been successfully applied to eco-driving. For example, an MPC-based optimal control approach was presented ( 24 ) for crossing signalized intersections, in which the upper-level estimates the arrival time of the target CAV, and the lower optimization level determines the optimal speed and acceleration within the prediction horizon. Similarly, a three-layer hierarchical optimization problem for a CAV to follow the calculated desired speed was developed ( 25 ).
Many previous studies on minimizing energy usage for a single or multiple CAVs are subject to various assumptions and rely on the information of the entire traffic flow. For instance, one study proposes an eco-driving controller for a CAV based on predictive control, assuming the preceding vehicle maintains a constant speed ( 26 ). Another study uses signal phase data to develop a speed control method, reducing braking and idling at red lights ( 27 ). A tree search method has also been developed to determine the optimal speed for CAVs at signal-free intersections ( 28 ). In fully connected traffic scenarios, some studies aim to minimize energy consumption and travel time for each CAV while optimizing overall performance for the entire vehicle group ( 29 ). Another study focuses on minimizing energy usage and battery wear for connected autonomous electric vehicles (CAEVs) at signalized intersections, considering their effect on human-driven vehicles (HVs) ( 30 ). In addition, an energy-efficient control strategy is proposed for mixed vehicle groups, assuming HVs follow the speeds advised by CAVs, without specifically addressing the interaction between a CAV and its following HVs ( 31 , 32 ).
The effect of a single eco-driving CAV on its following vehicles has been examined in the literature (33–35), particularly near intersections. Similarly, it was suggested that these eco-driving strategies can also reduce energy consumption for HVs traveling behind a CAV ( 16 ). A previous study ( 36 ) investigated the energy effects of CAVs on the following HVs; however, the potential energy benefits were limited because the dynamics of the HVs were not fully incorporated into the optimization framework. Some studies have considered HV behavior in the control design of autonomous vehicles (37–39). For instance, HVs in a mixed platoon by predicting their behavior using a physics-augmented system were examined ( 38 ). In a related effort ( 37 ), an adaptive longitudinal speed control strategy for autonomous vehicles (AVs) was proposed, which models the behavior of following vehicles using the intelligent driver model (IDM) and solves the energy optimization problem via reinforcement learning. Although these studies accounted for HV behavior when controlling AVs, they did not leverage vehicle connectivity or SPaT messages. Moreover, they did not incorporate vehicle powertrain dynamics into the optimization problem. Therefore, a systematic approach that co-optimizes CAV speed trajectories and powertrain operations while accounting for their influence on following HVs remains largely unexplored.
HVs can obtain energy savings when following a CAV with effective eco-driving controls; previous studies have not fully considered the dynamics of HVs behind the CAV when devising optimal driving strategies. This could limit energy savings for vehicles in traffic flow. In contrast, this paper develops an interaction-aware optimal control strategy for a CAV that accounts for its effects on the following HVs, as discussed in the literature ( 34 , 40 ). CAEVs are focused on to jointly optimize vehicle speed and powertrain performance, considering the rapid advancement of transportation electrification ( 41 ). This approach can result in greater energy savings for HVs following a CAV being optimally controlled. Compared with relevant mixed traffic CAV control studies (e.g., [ 42 ]), this paper differs in several key aspects. First, rather than considering only a single HV following a CAV, this formulation models multiple successive HVs, enabling a more comprehensive evaluation of energy effects along the platoon. Second, this method employs a physics-based powertrain energy model rather than relying on surrogate terms (e.g., squared acceleration), allowing for a more realistic assessment of energy consumption. Third, the HV behavior in this paper is modeled using the IDM, which provides a more validated and realistic representation of human driving than the simpler analytical models used in previous work. This paper contributes to the literature in the following aspects.
Following previous work ( 36 ), where the dynamics of HVs behind the target CAEV were not explicitly considered, this paper introduces an interaction-aware optimal control strategy for the CAEV. It aims to minimize the CAEV’s energy consumption and that of multiple HVs trailing behind it. Leveraging the traffic prediction framework established in a previous study ( 43 ), this control strategy is designed using an MPC approach, enabling efficient computation and resulting in increased energy savings for HVs following the CAEV.
To assess the robustness and effectiveness of the proposed approach, a series of complex traffic scenarios is considered, involving different car-following behaviors and a range of CV penetration rates.
The effect of multiple CAEVs is examined on the total energy benefits of a vehicle platoon when considering the energy consumption of multiple HVs behind each CAEV. The total energy savings of the platoon rise from 8.1% to 15.2% when more CAEVs are part of the traffic flow.
The remainder of this paper is structured as follows. In the next section, a general control framework for co-optimizing vehicle speed and powertrain operation using traffic prediction is presented. This is followed by the development of an interaction-aware optimal eco-driving control algorithm that accounts for energy savings for the target CAEV and the following HVs. Then, various traffic scenarios are examined to comprehensively evaluate the proposed approach. Finally, this paper concludes with a discussion of its limitations and potential directions for future research.
Control Framework
This section presents an integrated control framework that combines traffic prediction with the co-optimization of vehicle speed and powertrain in real time to maximize the energy benefits for a target CAEV, as shown in Figure 1. In mixed traffic, the target CAEV receives speed and position data for other connected vehicles (CVs) via V2V communication. In addition, equipped with perception sensors, it can gather this information from its immediately preceding vehicle. SPaT information from intersections is accessed via V2I communication. For this paper, the communication range for V2V and V2I is set to 500 m ( 44 ), while the perception range is 100 m ( 44 ). The prediction horizon, defined for distance, indicates the road segment ahead of the preceding vehicle considered for traffic prediction. Given that vehicles typically travel 300–500 m within 10–15 s, the prediction horizon is chosen as 500 m, advancing with the motion of the preceding vehicle, as shown in Figure 2. This connectivity and perception allow the target CAEV to partially measure traffic states such as speed and density using a modified PW model discretized as follows ( 36 ). Equations 1a and 1b describe how the density and speed of each road cell evolve over time:
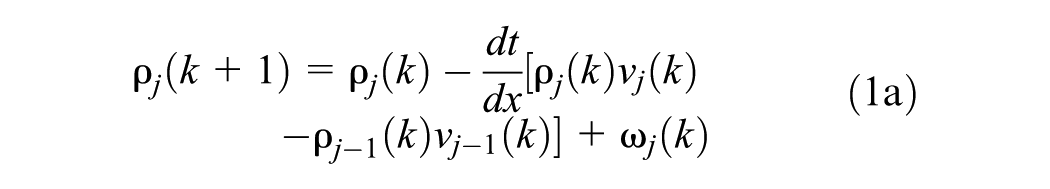
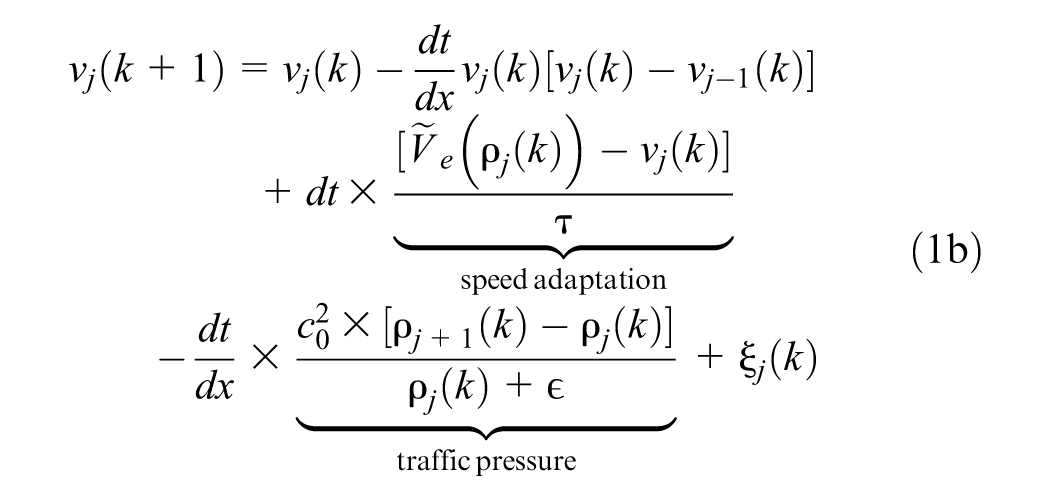
where k is the discrete time step, dt denotes the duration of each time step, dx represents the length of a cell, ϵ represents a small positive constant introduced to prevent division by zero and is set to

where
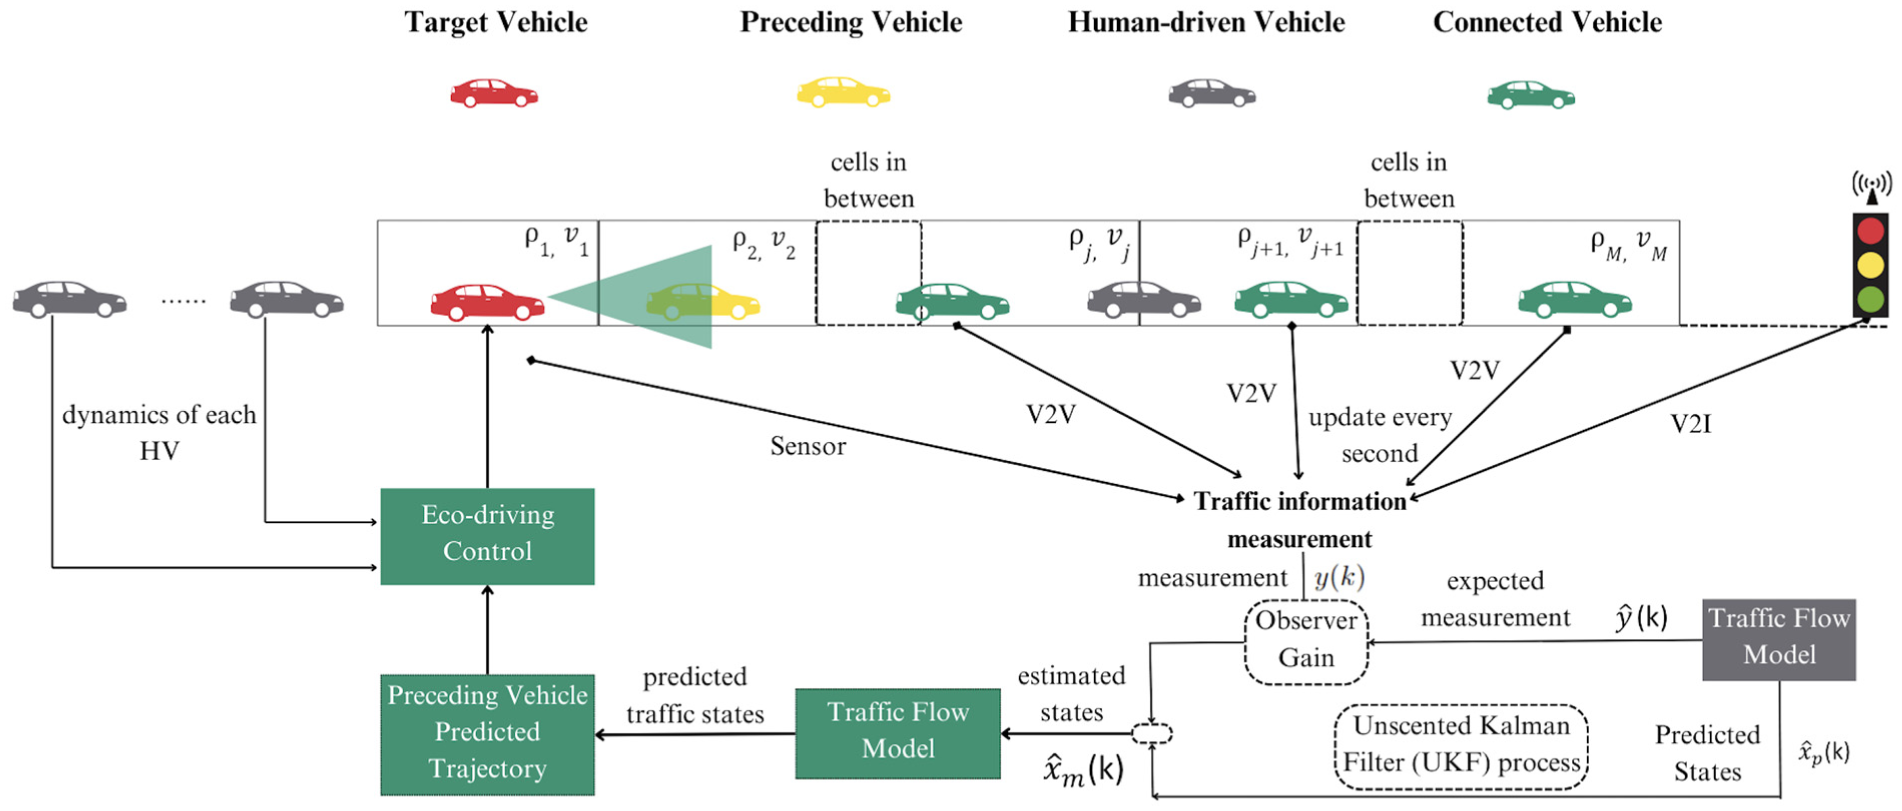
Eco-driving control framework involves information broadcast, UKF, traffic prediction, and control.
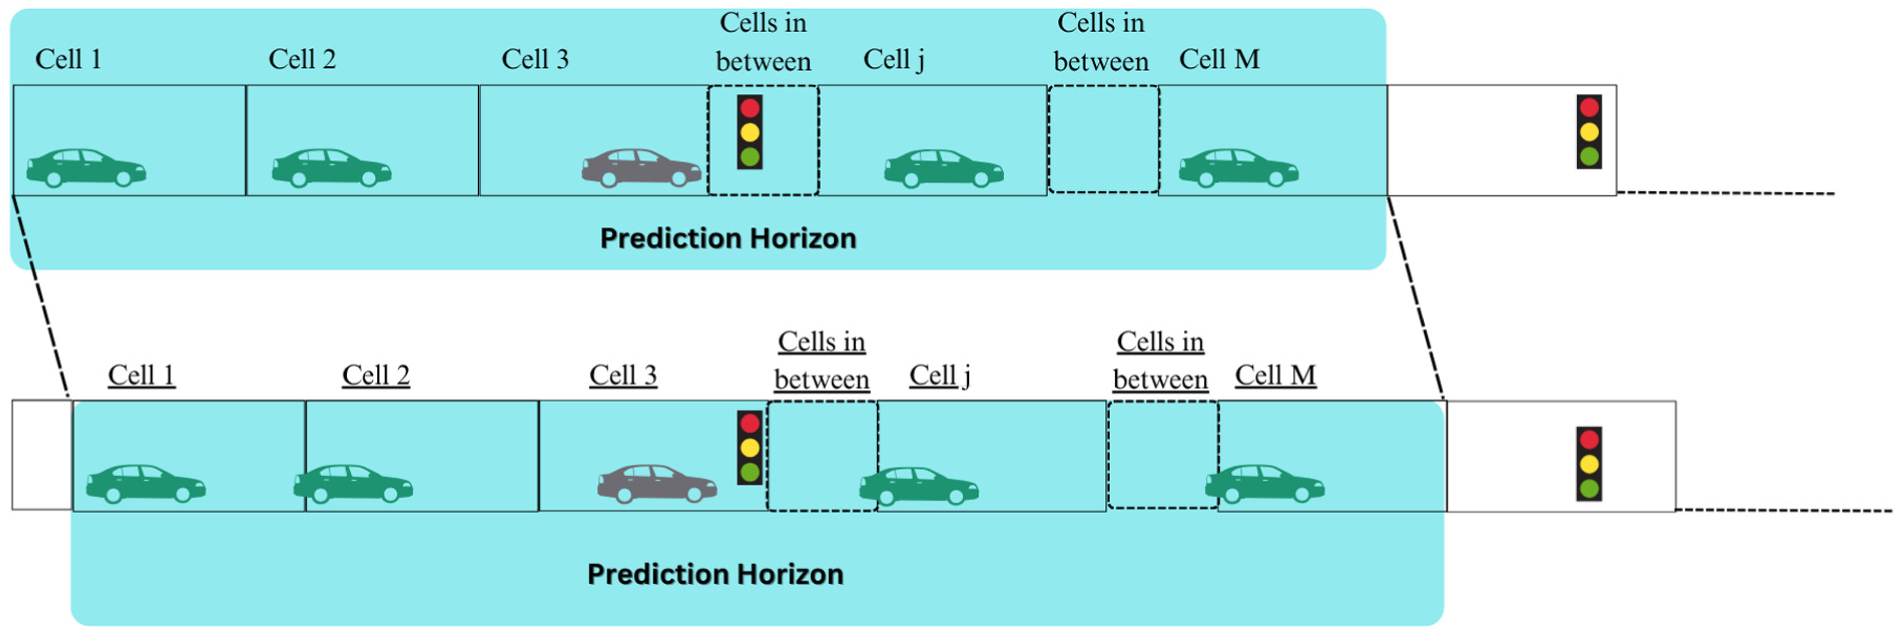
A moving prediction horizon.
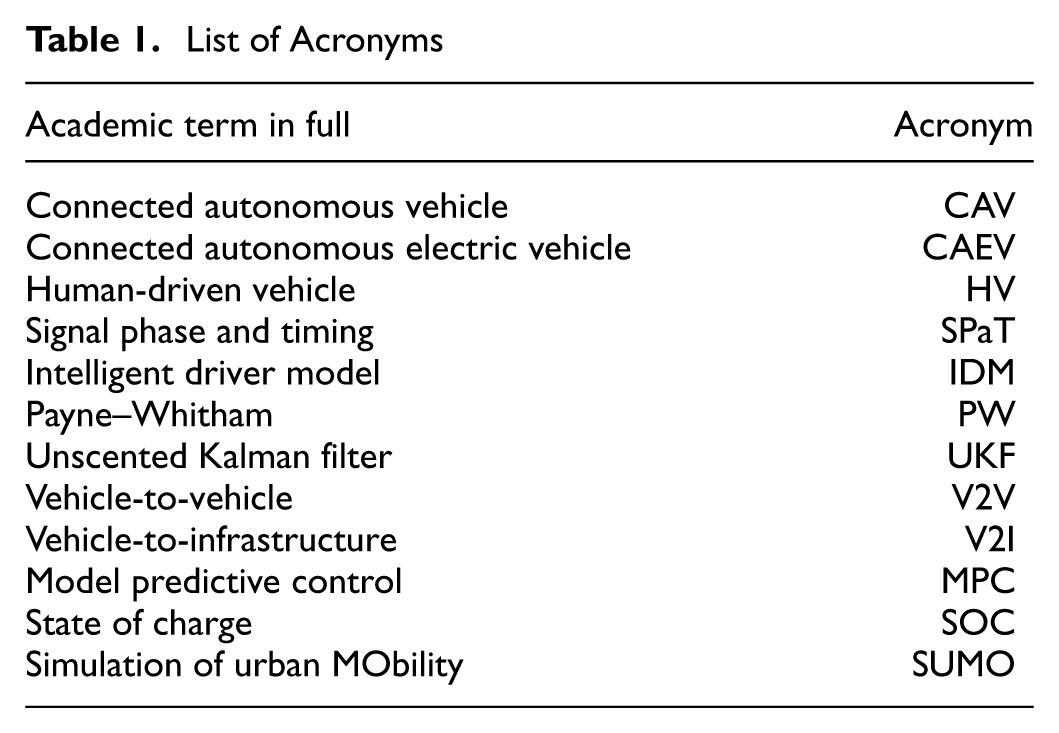
After the full traffic states have been estimated, the traffic flow model is propagated forward to predict future traffic conditions. Therefore, the future trajectory of the vehicle ahead of the target CAEV is obtained and used as input to the co-optimization algorithm to establish traffic constraints. More details of the traffic prediction can be found in the literature ( 36 , 45 ). After predicting future traffic conditions and establishing car-following constraints, the speed and powertrain operation of the target CAEV are co-optimized to enhance energy efficiency. An overview of the framework is shown in Figure 1. Given the dynamic nature of traffic flow, MPC is employed to obtain the optimal control strategy in real time, being updated continually as future traffic states become available. This paper advances previous work by developing an optimal control framework that simultaneously considers energy consumption for the target CAEV and following HVs, applicable to a range of complex traffic conditions. To help interested readers understand this, the full names of academic terms and corresponding acronyms are given in Table 1.
List of Acronyms
Co-Optimization of Vehicle Speed and Powertrain Operation
An optimal control problem that co-optimizes vehicle speed and powertrain operation is briefly outlined. The co-optimization algorithm, integrated within the MPC framework described in the previous section, operates in conjunction with a traffic prediction method. At each update, only the first second of the optimal control input is applied to the target CAEV, after which the horizon shifts, and the process repeats. This yields a co-optimization problem for the CAEV’s eco-driving controls using the traffic prediction algorithm. As previously noted, the target vehicle is a rear-wheel-drive CAEV propelled by a single alternating current (AC) induction motor. All parameter values utilized in the analysis stem from data obtained from Autonomie ( 46 ). A concise summary of the model parameter values for a CAEV is presented in Table 2.
List of Model Parameter Values of a CAEV ( 46 )
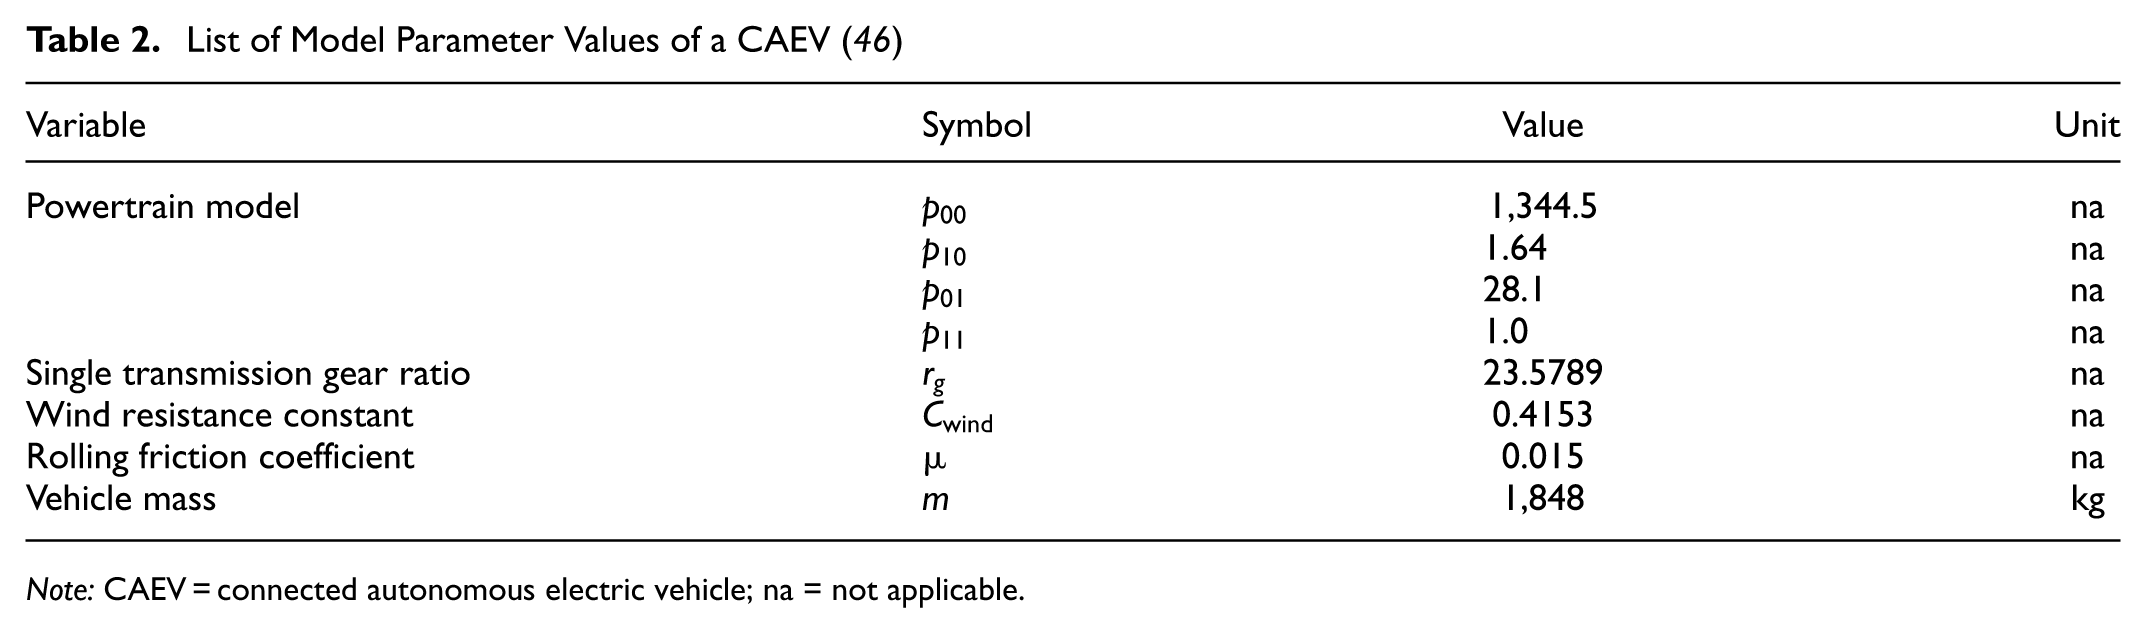
Note: CAEV = connected autonomous electric vehicle; na = not applicable.
State Equations
The state dynamics of the target CAEV are given by ( 47 ),
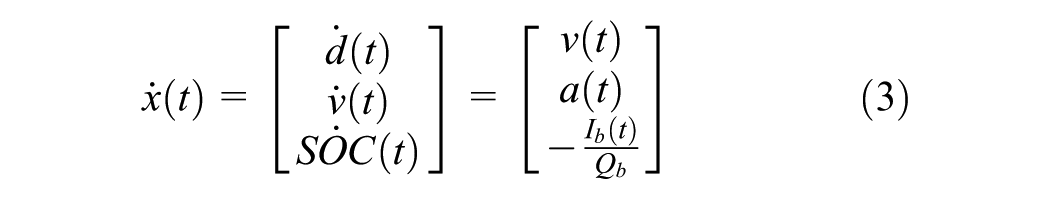
where x represents the state vector, d, v, and
Vehicle and Powertrain Models
The vehicle and powertrain model is described by ( 47 ),


where
Objective Function Considering HVs
The objective function of the minimization problem is defined as follows:
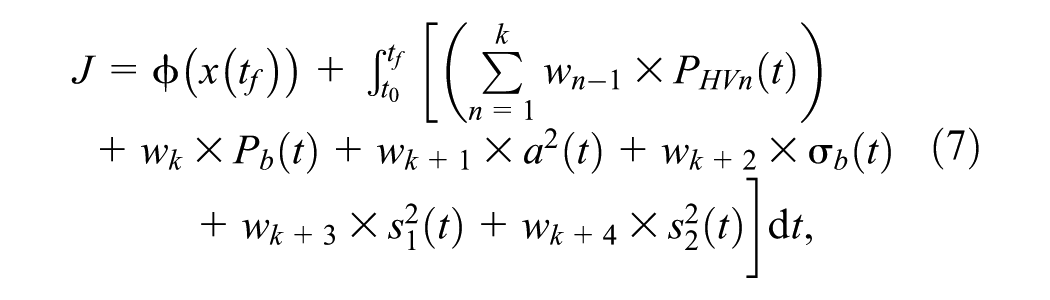
with the final cost

where
Objective Function Weighting Factors used in the MPC Formulation for the Numerical Study
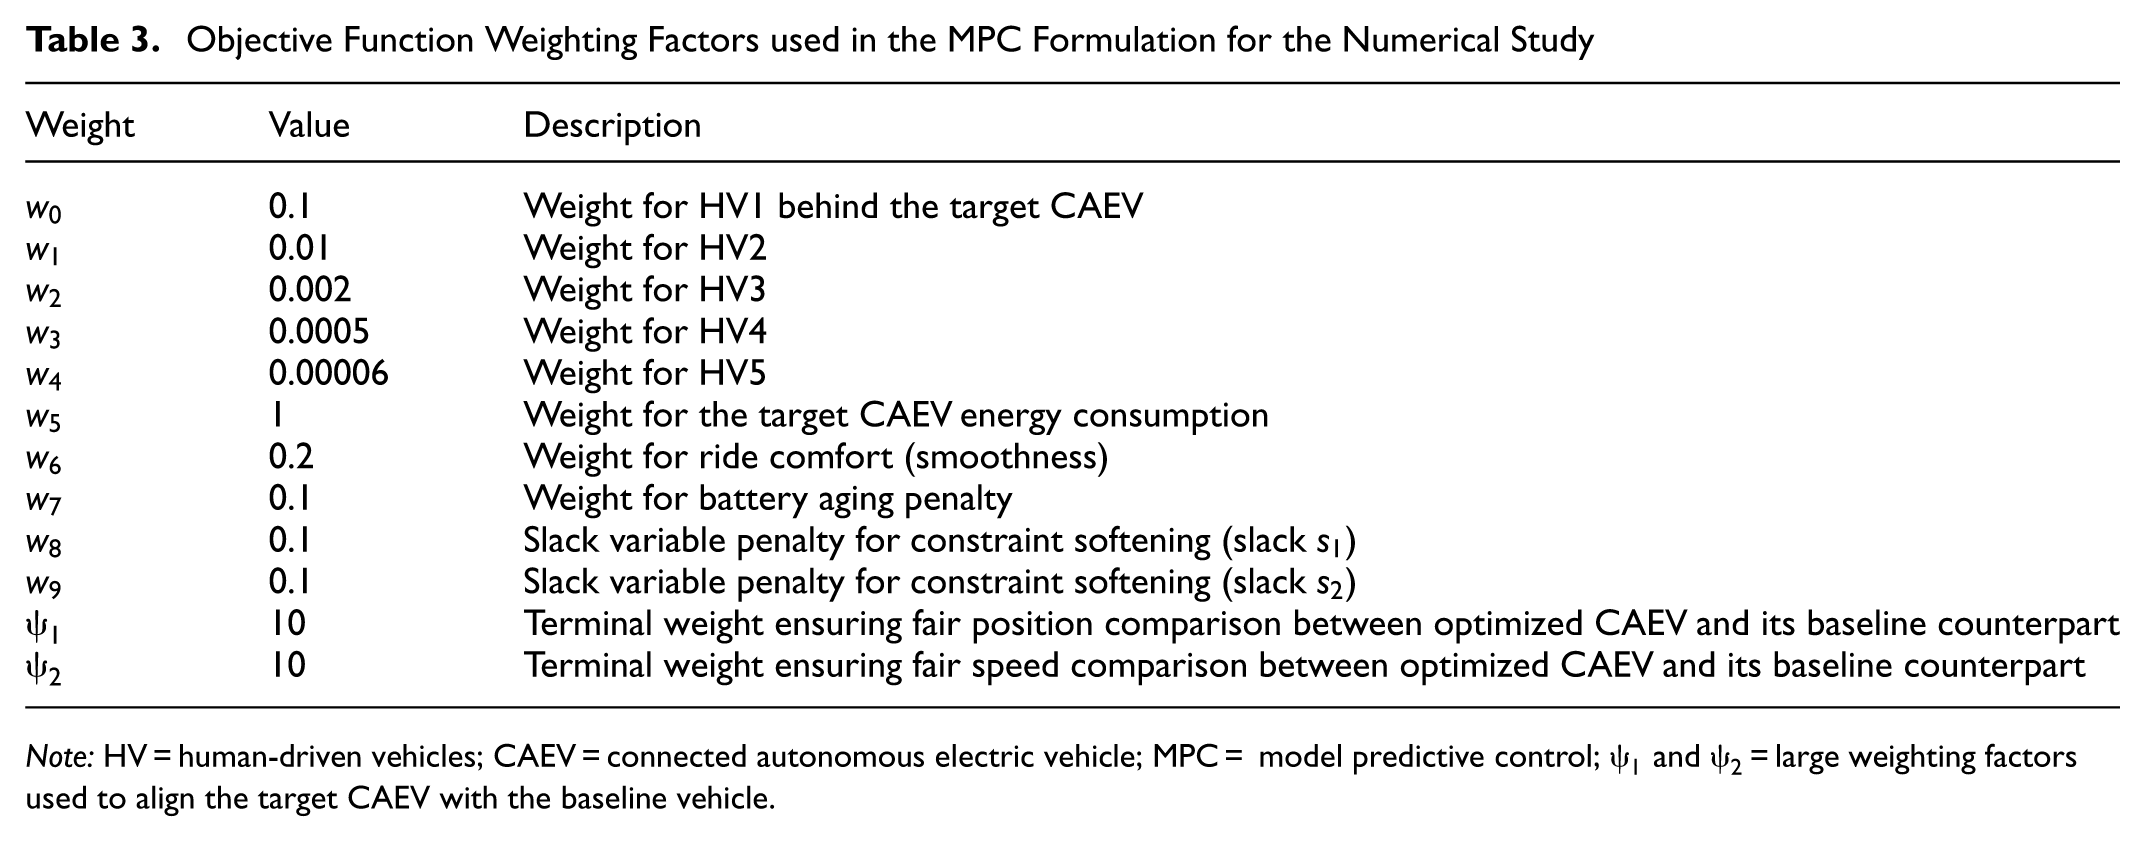
Note: HV = human-driven vehicles; CAEV = connected autonomous electric vehicle; MPC = model predictive control;
Battery Aging Model
Here,


where c represents the battery C-rate,
Battery Power Model
The following equation describes the battery output power:
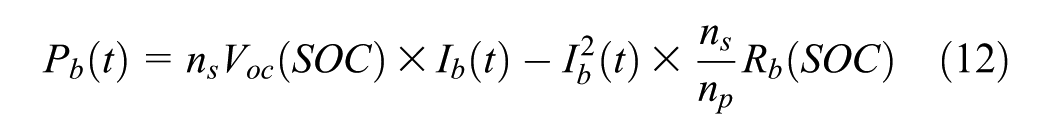
where the instantaneous battery power
The battery output power

where
where
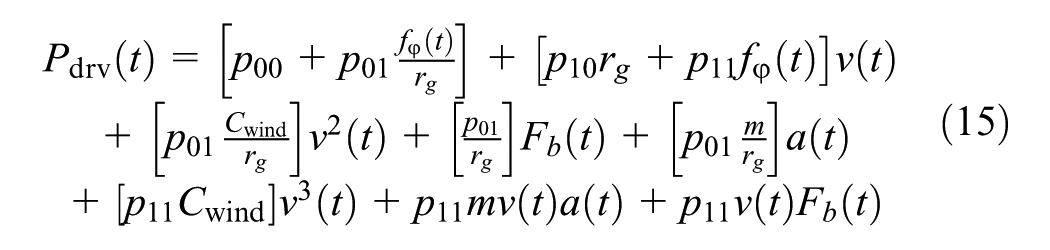
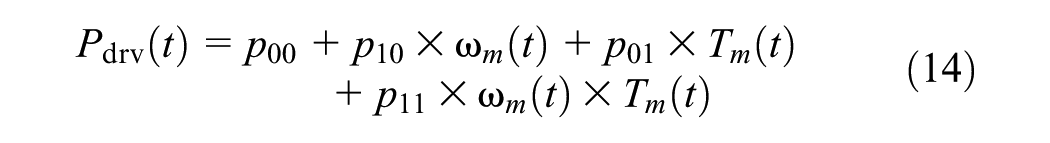
Human-Driven Vehicle Power Model
As mentioned previously, the energy savings of the target CAEV and the HVs behind in the objective function for the MPC optimization algorithm are considered. Based on Newton’s second law, the mass of the vehicle multiplied by its acceleration equals the total external force, which includes the required driving force and encountered resistance. The resistance force consists of rolling resistance, grade resistance, and wind resistance. When the braking force of the vehicle is not zero, the driving force is zero because it is unreasonable to press the gas pedal and the brake at the same time. To avoid confusion with the CAEV hydraulic brake defined earlier, the HV braking force is
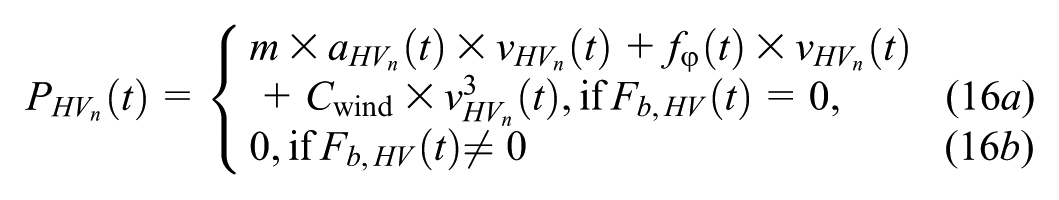
where m,
For HVs, the IDM ( 48 ) is employed as it effectively captures the car-following dynamics characteristic of human drivers (48–51). Based on the current state (location and speed) of the target CAEV, the dynamics of each HV behind it is obtained by,
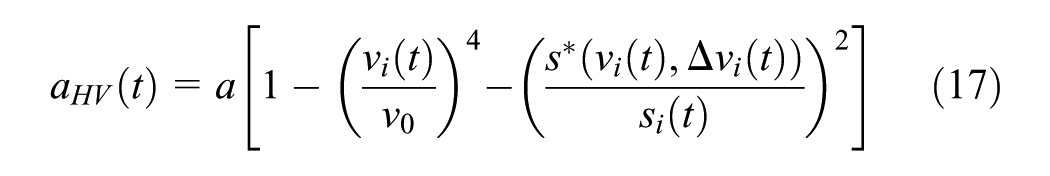
where
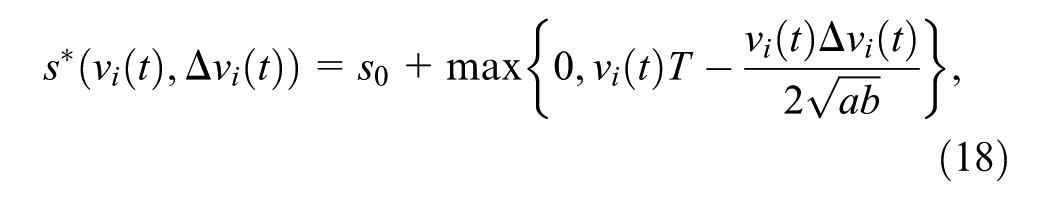
where a represents the maximum acceleration, b represents comfortable braking deceleration,
MPC Optimization Constraints
Car-Following Constraints
To ensure safety and maintain efficient traffic flow, a constraint is imposed on the following distance between the target CAEV and the preceding vehicle. In addition, prediction uncertainty is addressed by incorporating speed variance estimates from the traffic prediction framework ( 47 ).


where
Signal Timing Constraints
Because the target vehicle operates on an urban roadway with signalized intersections, it is permitted to cross the intersection only when the signal is green.

where
Physical Bounds
The target CAEV must respect the legal speed limit, tire-friction acceleration bounds, and comfort-based jerk limits.


Battery Current Constraints
Battery current is restricted by state-of-charge-dependent charge and discharge limits.

Torque Limits and Regenerative Braking Bounds
Motor torque is limited by speed-dependent minimum and maximum values.

This paper incorporates a low-speed cutoff point to account for the electric motor’s inefficiency when operating as a generator at low speeds. Specifically,

In addition, the maximum regenerative torque satisfies ( 53 ),

where
Initial Conditions
At each update step, the initial location and speed of the CAEV are known.


Final Conditions
The final location and speed of the target CAEV are constrained to be near the predicted final location and speed of the vehicle directly ahead.


Single CAEV and Multiple CAEV Cases
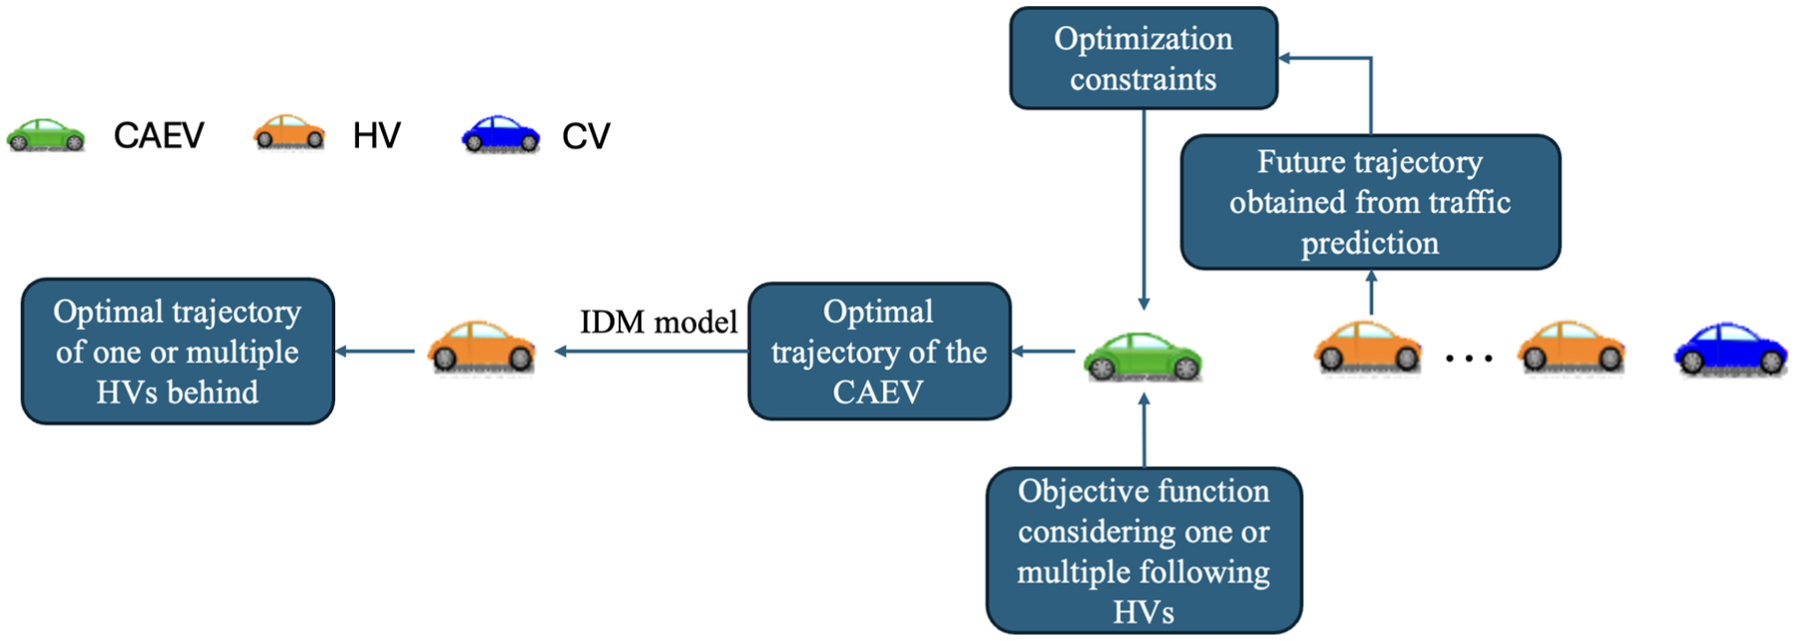
The proposed co-optimization framework applies to single-CAEV and multiple-CAEV scenarios. In the single-CAEV case, one CAEV exists within the vehicle platoon. This CAEV computes its optimal trajectory by considering the behavior of the following HVs using a predefined objective function and a set of system constraints. The HVs are not directly optimized; their behavior is modeled using car-following dynamics based on the IDM, as shown in Figure 3. This modeling approach enables the CAEV to anticipate and incorporate the responses of following HVs without requiring direct control over them. The overall procedure is shown in Figure 4, which outlines a three-step process where the CAEV computes its optimal trajectory while accounting for the behavior of the following HVs.
Control and optimization mechanism for the single CAEV case.
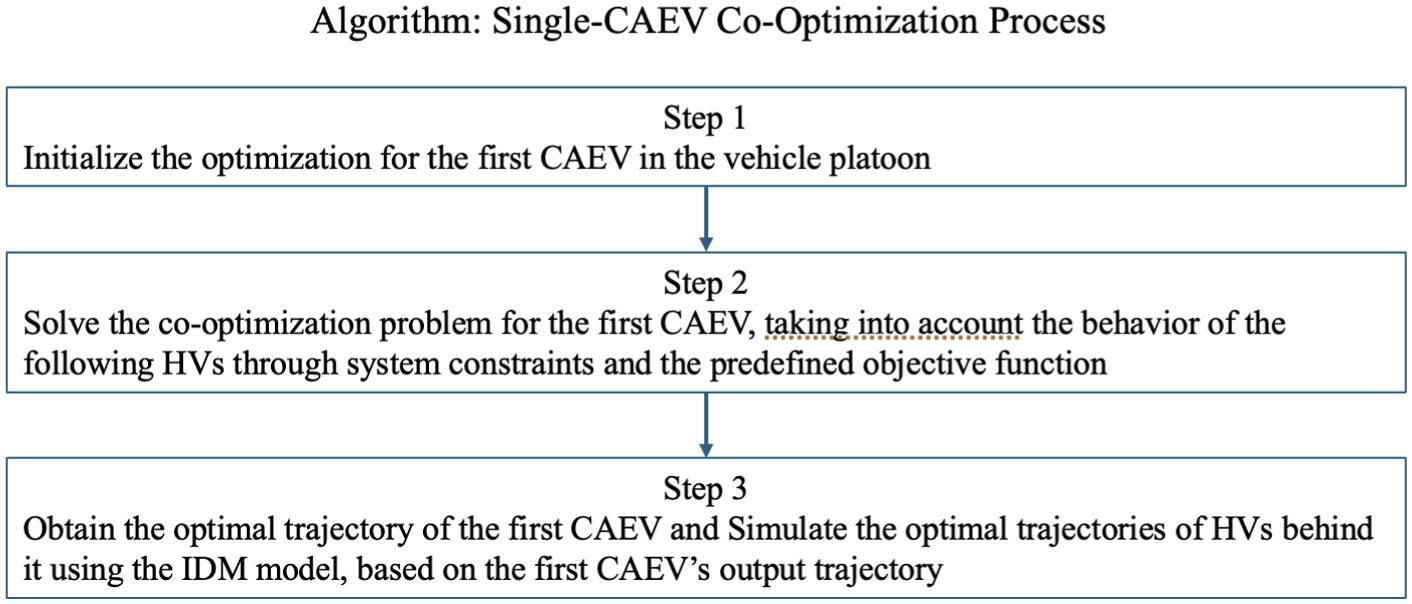
Co-optimization process for a single CAEV considering the behavior of following HVs.
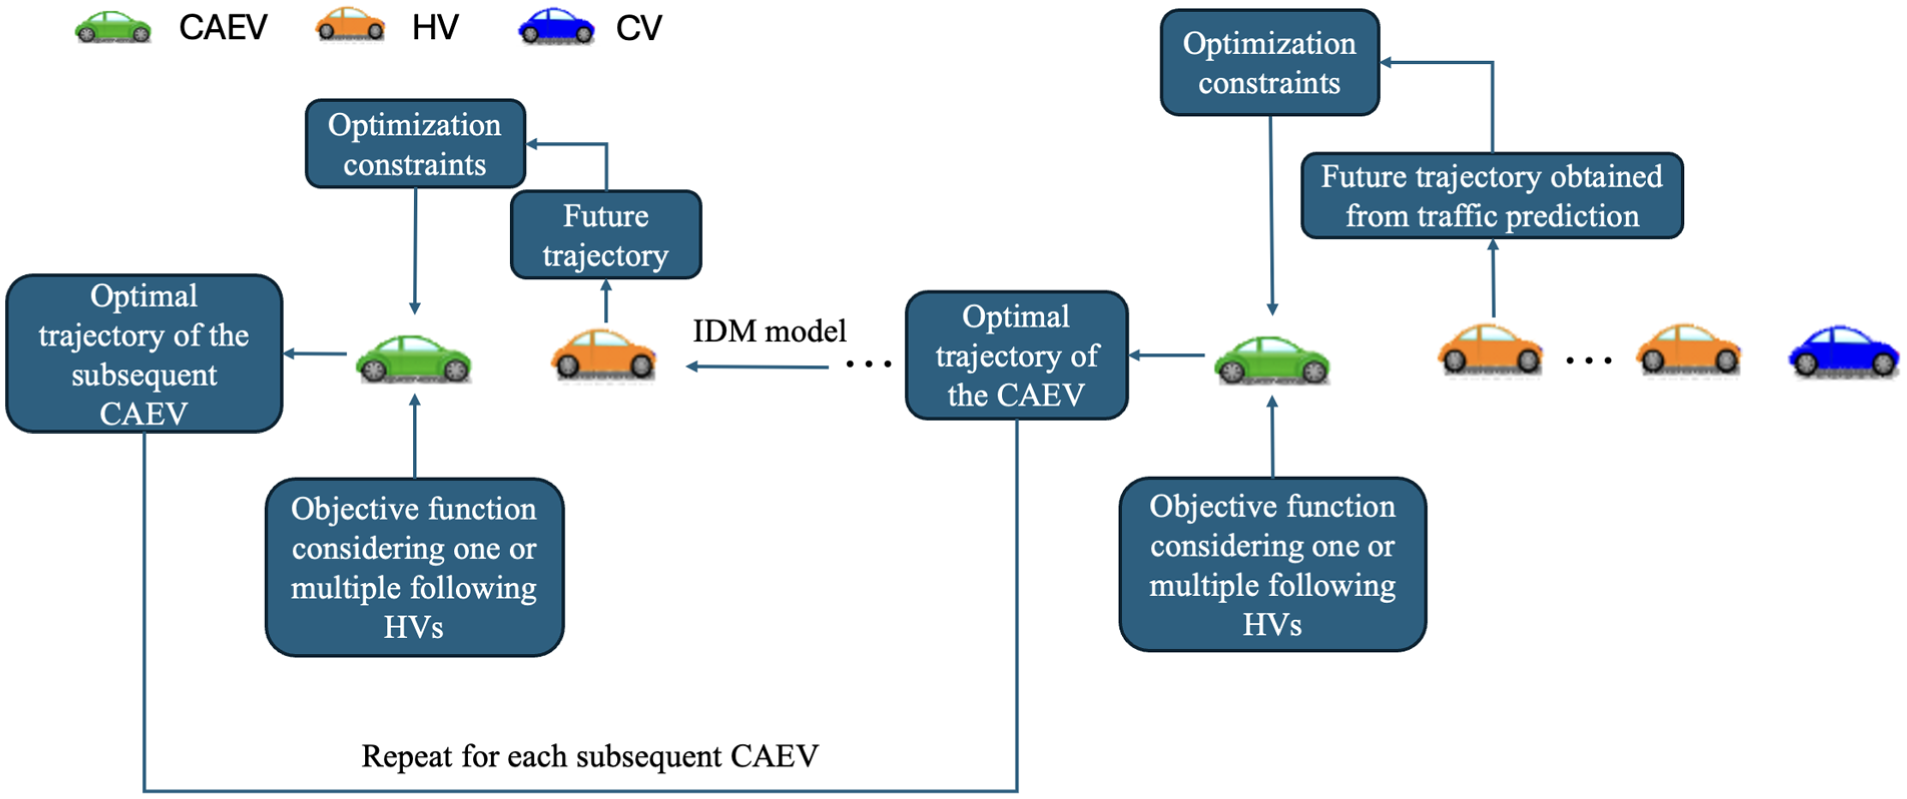
In the multiple-CAEV case, the optimization process becomes sequential and collaborative. Each CAEV determines its optimal trajectory by minimizing its cost function while considering the predicted behavior of the HVs behind it, again modeled using the IDM. These predicted HV trajectories serve as dynamic constraints for the subsequent CAEV, enabling coordinated planning throughout the platoon. This process is applied recursively: each CAEV utilizes the output trajectories of its immediate predecessors to solve its co-optimization problem, as shown in Figure 5. The overall structure, shown in Figure 6, ensures that each CAEV makes informed decisions based on local interactions, while maintaining consistency and cooperation across the vehicle string.
Control and optimization mechanism for the multiple CAEVs case.
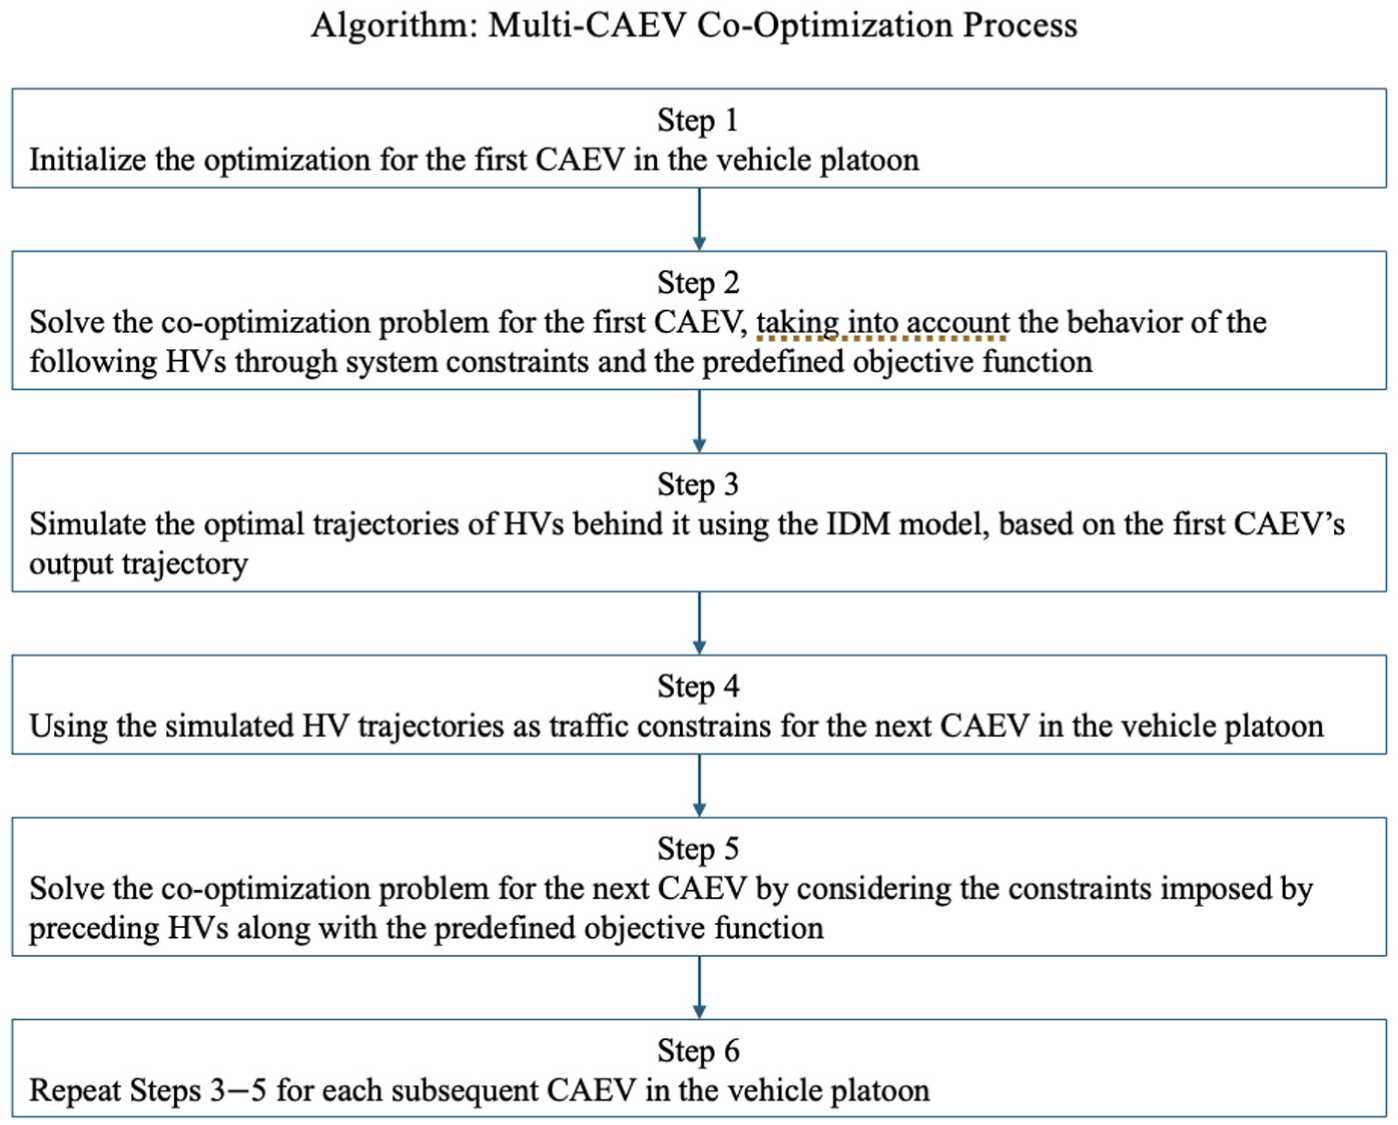
Co-optimization process for multiple CAEVs considering the behavior of following HVs.
Numerical Solution of the Optimization Problem
The optimization problem encompasses several variables, including: (1) state
Numerical Results
In this section, numerical simulations are presented to validate the proposed approach under diverse traffic scenarios generated using the Simulation of Urban MObility (SUMO), a widely used microscopic traffic simulator in transportation. In this paper, the traffic environment in front of the target CAEV is generated by SUMO, while the behaviors of the HVs behind the target CAEV are modeled using the IDM. Within these simulation environments, several parameters are assumed to be known (
15
,
35
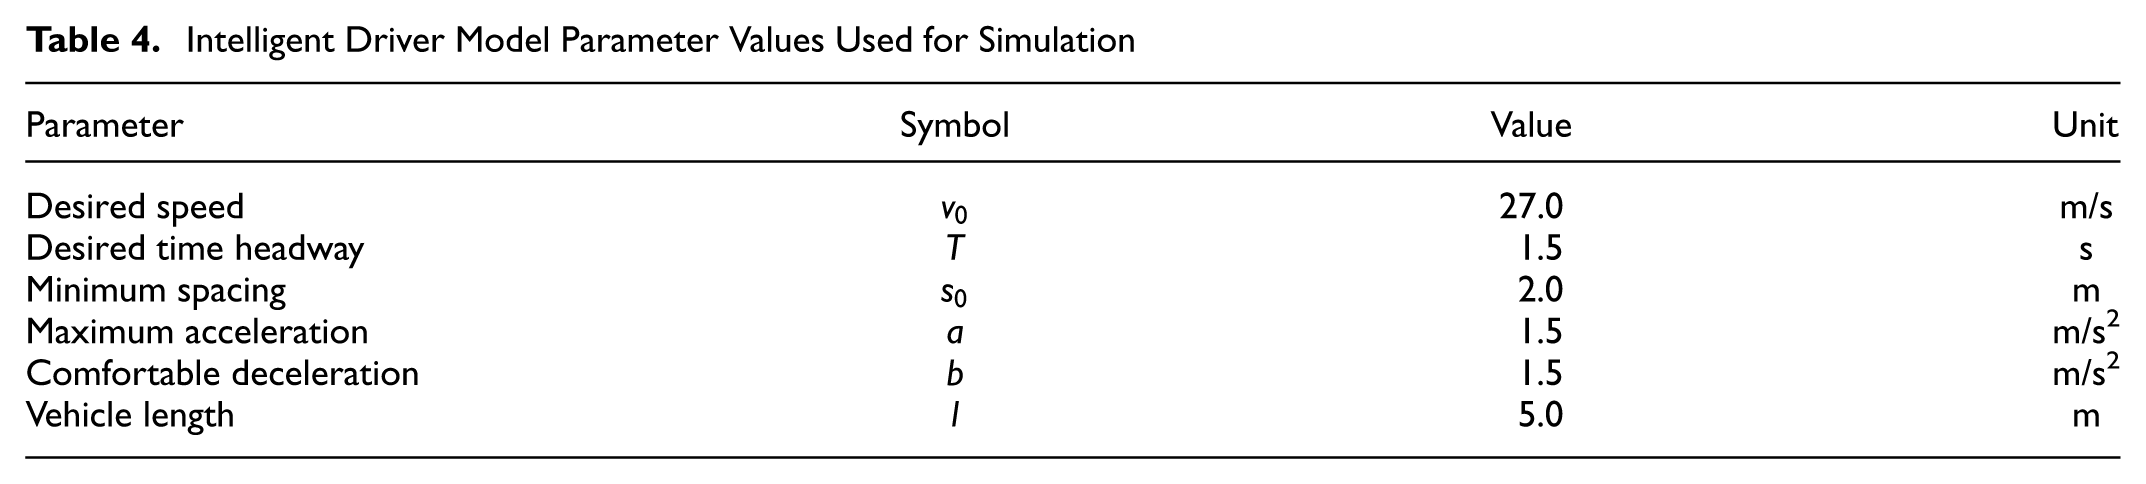
). The PW model parameter ϵ is a fixed positive constant to prevent division by zero, as discussed in the Control Framework section. The vehicle model parameters of the target CAEV and the IDM parameters for the following HVs are also assumed to be known, as listed in Tables 2, 4, and 5. In contrast, the PW model parameters
Intelligent Driver Model Parameter Values Used for Simulation
In the following three subsections, energy savings for one HV behind the target CAEV are considered using two different control strategies: one considers the energy consumption of the HV in the MPC objective function, while the other does not. All reported HV energy results throughout this paper consistently follow the same definition: positive mechanical driving power at the wheels, with braking power treated as zero. None of the results interprets HV energy as fuel consumption or includes powertrain losses. Different driving scenarios are analyzed in this comparison. In addition, randomly generated simulations are used to statistically evaluate the performance of the proposed method under various connectivity penetration rates. In the second subsection, the total energy benefits of vehicle platoons are investigated by considering the energy consumption of the target CAEV and multiple HVs behind it in the optimization algorithm. The overall trend in energy benefits is examined when accounting for the energy consumption of more HVs in the MPC objective function. In the third subsection, the effect of multiple CAEVs on the total energy benefits of a long vehicle platoon is investigated when considering the energy consumption of multiple HVs behind each CAEV. With the coordination of multiple CAEVs, the improvement in the energy benefits of the traffic platoon is evaluated through different cases.
Optimal Control Approach Considering the Target CAEV and the HV Immediately Behind
To assess the effectiveness of the optimal control strategy, the energy savings variations for both the target CAEV and a single HV following it are analyzed. The target CAEV follows the 11-vehicle platoon with 40% penetration rate of connectivity. The 11-vehicle platoon ahead of the target CAV is chosen for its convenience in demonstrating different penetration rates of CVs. Equipped with perception sensors, the target CAV can detect the location and speed of the immediate preceding vehicle within its range. In addition, it can receive such information from CVs among the remaining 10 preceding vehicles, depending on the CV penetration rate. The effectiveness of showing energy benefits is enhanced by selecting a moderate connectivity penetration rate, such as 40%. A single HV follows the target CAEV, traversing two intersections, as shown in Figure 7. Three car-following strategies are examined. In the first strategy, considered the baseline, the target CAEV uses the IDM model to follow the 11-vehicle platoon, with the HV behind using the IDM model as well. In the second strategy, referred to as “target CAEV optimization only,” the target CAEV optimally follows the 11-vehicle platoon using an eco-driving controller, focusing solely on its own optimization. Meanwhile, the HV follows the optimal target CAEV passively, based on the IDM model. In the third strategy, termed “target CAEV and HV optimization,” the target CAEV, considering the energy consumption of itself and the HV, optimally follows the 11-vehicle platoon. The HV, following the target CAEV, operates proactively and energy-efficiently. All parameters related to the IDM model in these strategies are outlined in Table 4, with minor adjustments compared with those detailed in the literature ( 56 ).
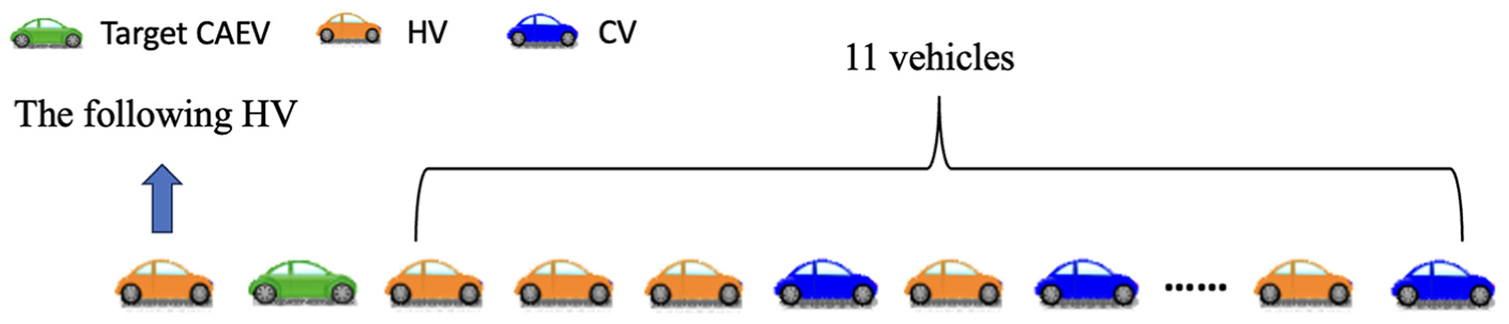
One HV behind the target CAEV following an 11-vehicle platoon.
Energy Consumption Considering Two Intersections
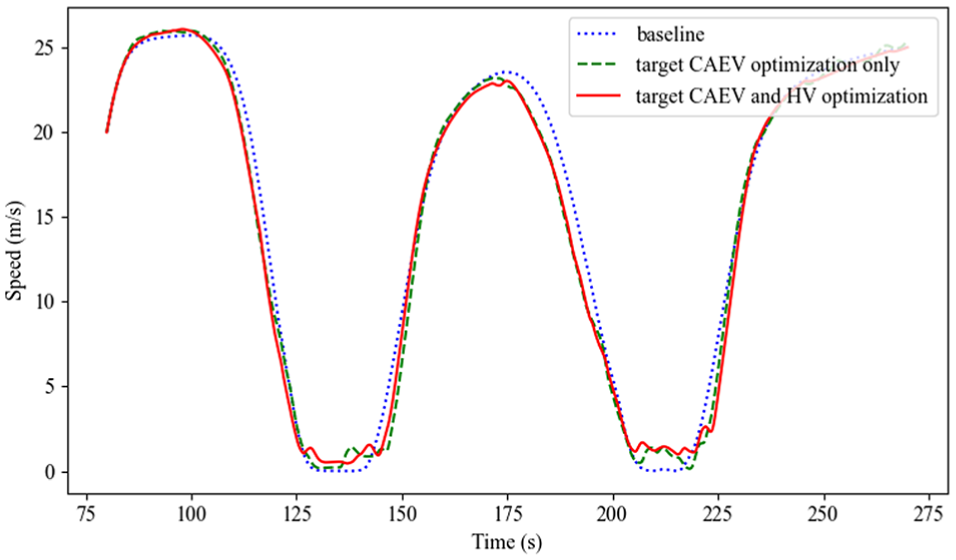
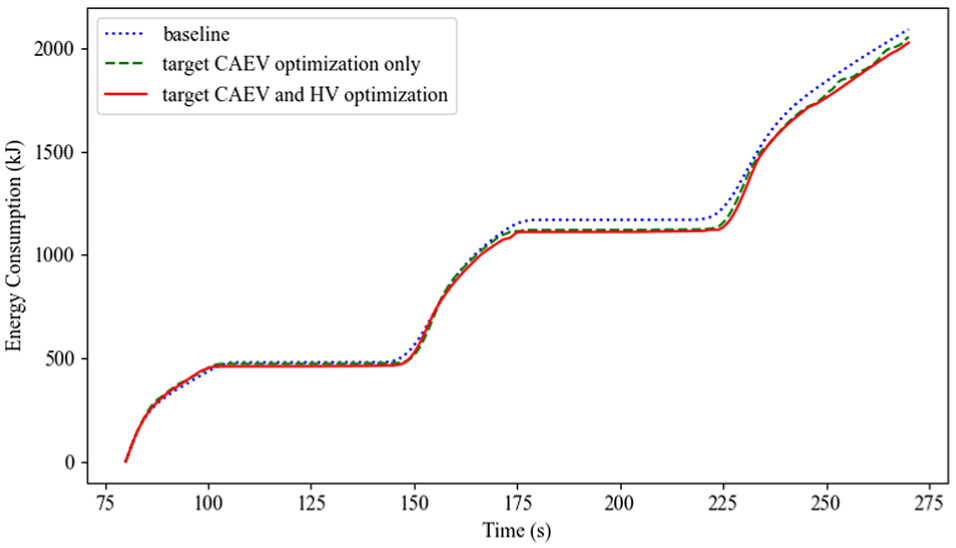
To demonstrate the effectiveness of the proposed approach, the energy savings for the HV following the target CAEV are evaluated under general driving conditions, where the HV follows the target CAEV through two intersections. The target CAEV follows an 11-vehicle platoon with a 40% connectivity penetration rate. The initial spacing between the target CAEV and the following HV is 15 m. With the proposed control approach, Figure 8 shows that the HV starts to decelerate earlier compared with the second car-following strategy when approaching these two intersections. When approaching the intersections, the HV reduces braking more and avoids the idling waste compared with the second car-following strategy. During acceleration, the HV accelerates more smoothly when leaving the intersections. To prevent the unnecessary dissipation of kinetic energy, the total deceleration is minimized. Therefore, the HV accelerates less once the signals turn green, saving energy, as shown in Figure 9. Compared with the baseline, the HV achieves 1.04% energy benefits passively using the second car-following strategy. With the proposed control strategy that considers the CAEV and HV, the HV behind the CAEV achieves a 3.36% energy benefit proactively, outperforming the second car-following strategy. The target CAEV typically sacrifices some energy efficiency to improve the energy benefits of the following HV when both the target CAEV and HV are optimized. When optimizing the target CAEV only, the energy efficiency of the target CAEV can achieve a 17.96% improvement compared with the baseline. With a consideration of both the target CAEV and the HV behind it, the target CAEV achieves a 16.7% improvement compared with the baseline. The results show that the HV can obtain greater energy benefits using the proposed control strategy without sacrificing too much energy efficiency of the target CAEV.
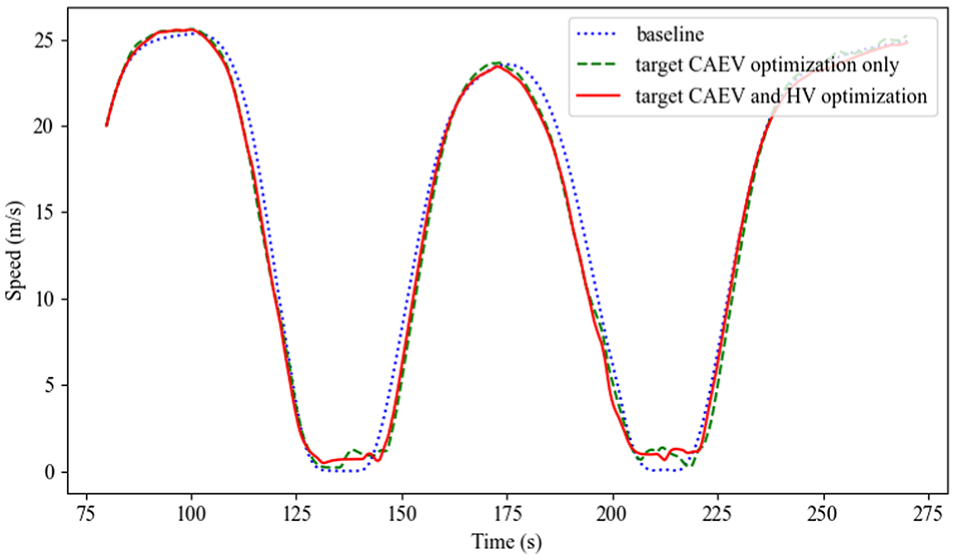
Comparison of the HV’s speed trajectory using three different car-following strategies crossing two consecutive intersections. The three different car-following strategies are baseline, target CAEV optimization only, and target CAEV and HV optimization, respectively.
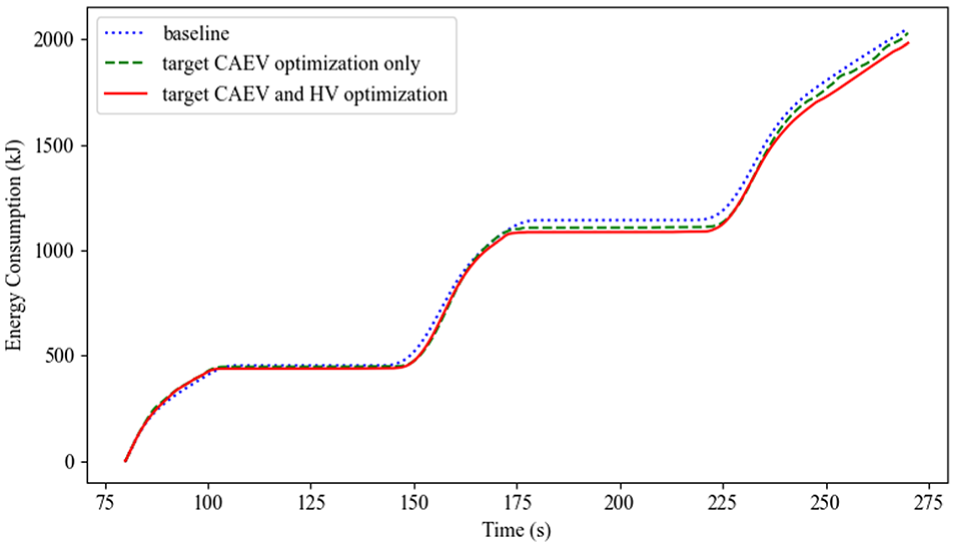
Comparison of the HV’s energy consumption using three different car-following strategies crossing two consecutive intersections. The three different car-following strategies are baseline, target CAEV optimization only, and target CAEV and HV optimization, respectively.
Energy Benefits of HVs with Different Driving Styles
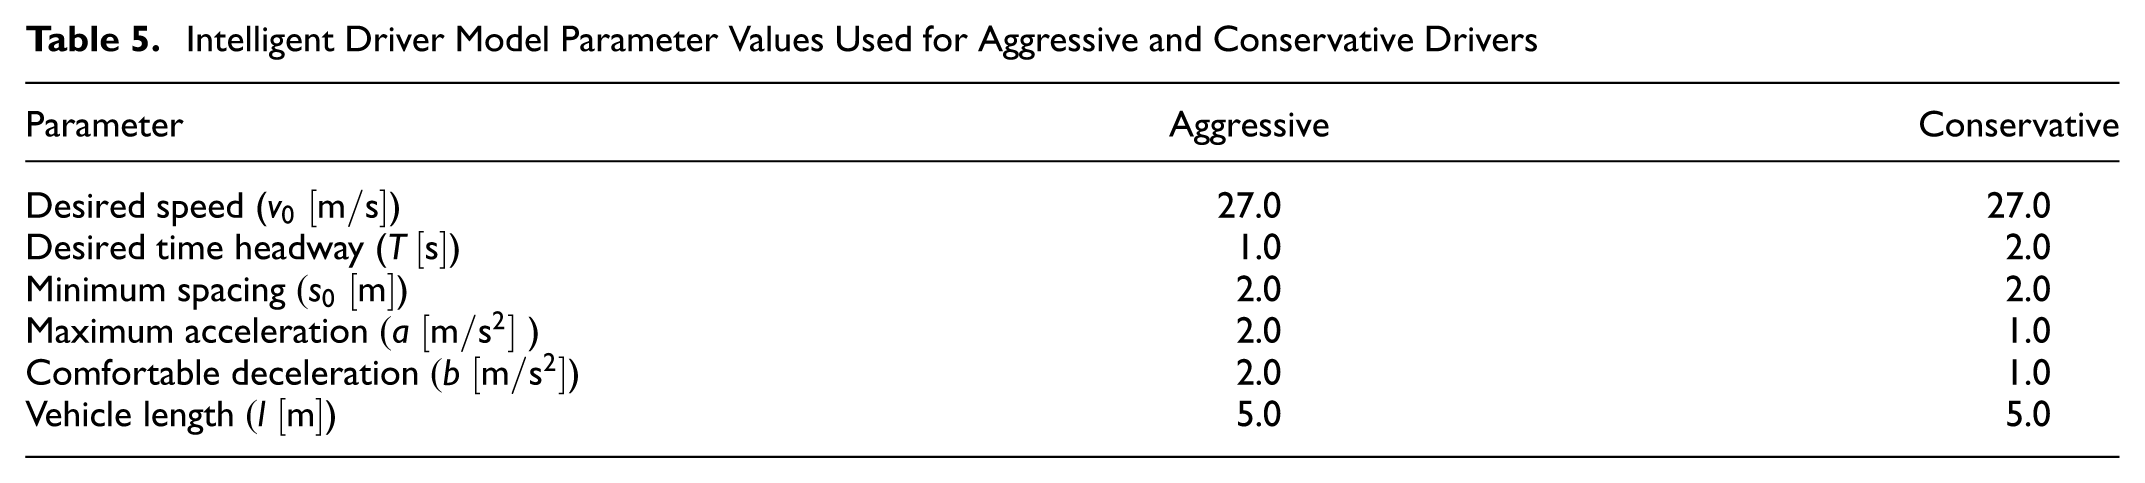
Previously, the HV followed the target CAEV using the IDM with the same set of parameters given in Table 4, which represent typical driving behavior. However, in practice, a small number of human drivers may exhibit more aggressive or conservative driving behaviors. Aggressive drivers are likely to accelerate or decelerate more rapidly; however, conservative drivers tend to accelerate or decelerate more gradually. To examine the performance and robustness of the developed approach, comprehensive experiments were conducted across different driving styles. In all simulations, both aggressive and conservative HVs follow the target CAEV crossing two consecutive intersections. The target CAEV follows the 11-vehicle platoon with 40% penetration rate of connectivity. Here, the energy benefits of the following HV are focused on. Two different sets of the IDM parameters for aggressive and conservative drivers are given in Table 5, with slight modifications of those used in the literature (36, 49, 50, 56). The IDM parameters used for the HVs behind the target CAEV are not arbitrarily selected; rather, they are taken from those previous studies in which the IDM has been carefully calibrated and validated to represent different real-world driving styles (conservative, regular, and aggressive drivers). These calibrated parameter sets have been widely adopted in the literature to realistically capture human car-following behavior and provide a reliable basis for evaluating interactions between CAEVs and HVs in simulation studies.
Intelligent Driver Model Parameter Values Used for Aggressive and Conservative Drivers
As mentioned previously, a small number of human drivers may exhibit either aggressive or conservative driving behaviors. Therefore, two primary scenarios (Case A and Case B) are examined. In Case A, the following HV is driven by aggressive drivers, while in Case B, it is operated by conservative drivers. As shown in Figure 10, the following HV exhibits greater deceleration in the baseline scenario when approaching intersections, potentially leading to increased energy consumption. Compared with the baseline, the HV can receive 1.7% energy benefit passively using the control approach, considering target CAEV optimization only. Utilizing the eco-driving controller, considering HV energy consumption proactively, the following HV can plan ahead to decelerate earlier without stopping or idling while crossing intersections. Therefore, Figure 11 shows that the following HV consumes less energy compared with the second car-following strategy, which achieves a 3.1% energy benefit proactively compared with the baseline.
Comparison of the HV’s speed trajectory using three different car-following strategies in Case A. The three different car-following strategies are baseline, target CAEV optimization only, and target CAEV and HV optimization, respectively.
Comparison of the HV’s energy consumption using three different car-following strategies in Case A. The three different car-following strategies are baseline, target CAEV optimization only, and target CAEV and HV optimization, respectively.
As shown in Figure 12, the following HV is driven by a conservative driver. The HV decelerates earlier compared with the HV driven by an aggressive driver. However, in the baseline, the target CAEV is unable to plan optimal maneuvers without the future trajectory of the preceding vehicle, which is obtained via traffic prediction. Therefore, the HV must come to a complete stop at both intersections when following the target CAEV. With optimization applied only to the target CAEV, the HV can passively achieve a 1.6% energy benefit by following the target CAEV’s optimal trajectory. To maximize the energy benefit of the HV following the target CAEV, the energy consumption of the HV must be considered. By applying the proposed optimal control approach, which accounts for the energy consumption of both the target CAEV and the following HV, the HV can achieve a 3.74% energy benefit. This represents better performance compared with both the baseline and the second car-following strategy, as shown in Figure 13. Furthermore, the sensitivity analysis in Figure 14 shows that the proposed controller remains robust to moderate variations in
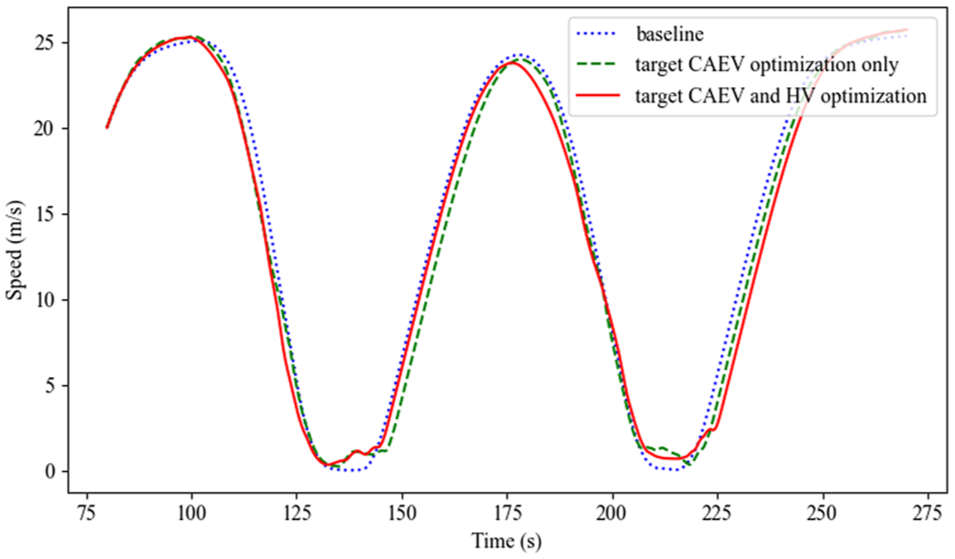
Comparison of the HV’s speed trajectory using three different car-following strategies in Case B. The three car-following strategies are baseline, target CAEV optimization only, and target CAEV and HV optimization.
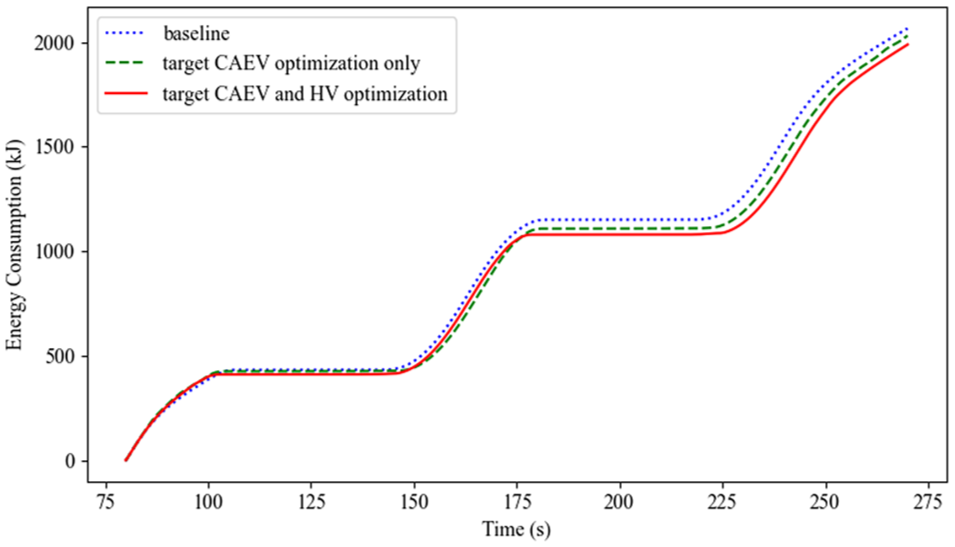
Comparison of the HV’s energy consumption using three different car-following strategies in Case B. The three car-following strategies are baseline, target CAEV optimization only, and target CAEV and HV optimization.
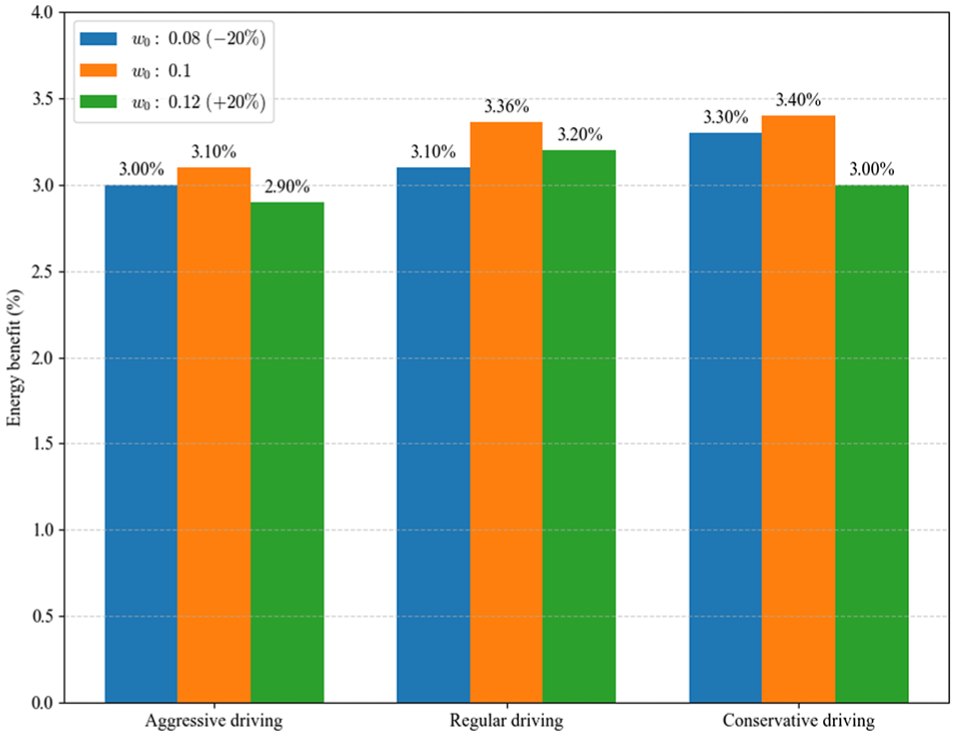
Sensitivity of the HV energy benefits to the objective weight
Statistical Results
To statistically demonstrate the performance of the proposed optimization strategy under different market penetration rates of CVs, comprehensive experiments were conducted using randomly generated simulated traffic scenarios. In the simulation, the target CAEV follows the 11-vehicle platoon and crosses two intersections, where the first 10 vehicles in the platoon can be either CVs or non-CVs. One HV follows the target CAEV.
The simulation results on the energy benefits of the following HV under various CV penetration rates (from 20% to 100%) are shown in Figure 15. For each penetration level, all possible CV/non-CV configurations in a 10-vehicle platoon were evaluated, resulting in N runs per penetration rate (20%:
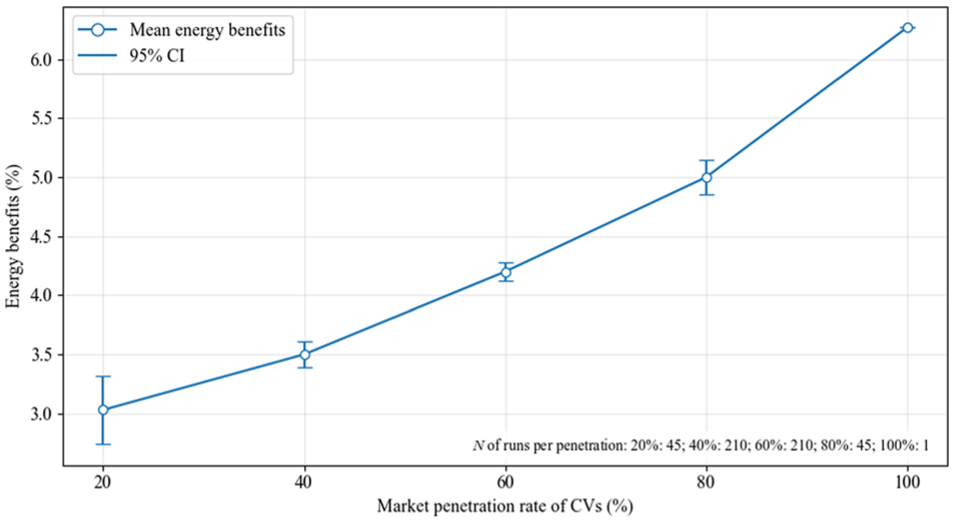
Energy benefits of the following HV under different market penetration rates of connected vehicles (CVs). Error bars indicate the 95% confidence interval (CI).
Optimal Control Approach Considering the Target CAEV and Multiple HVs Behind
In this section, the variations in the energy benefits for both the target CAEV and multiple HVs behind are investigated in a different traffic scenario. Compared with the previous subsection, the total energy benefits of vehicle platoons are focused on instead of only one single HV and target CAEV by utilizing the proposed optimization, considering the energy consumption of the target CAEV and multiple HVs behind. The target CAEV follows the 11-vehicle platoon with 40% penetration rate of connectivity. There are six HVs following the target CAEV to cross two intersections, as shown in Figure 16. The initial spacing between the target CAEV and the HV immediately behind it is the same as before, which is 15 m. The initial spacing among the HVs is 25 m. By considering the energy consumption of more HVs in the MPC objective function, the total energy benefits of the seven-vehicle platoon, including the target vehicle and the following HVs, increase because more HVs behind are operated in an optimal and proactive fashion.
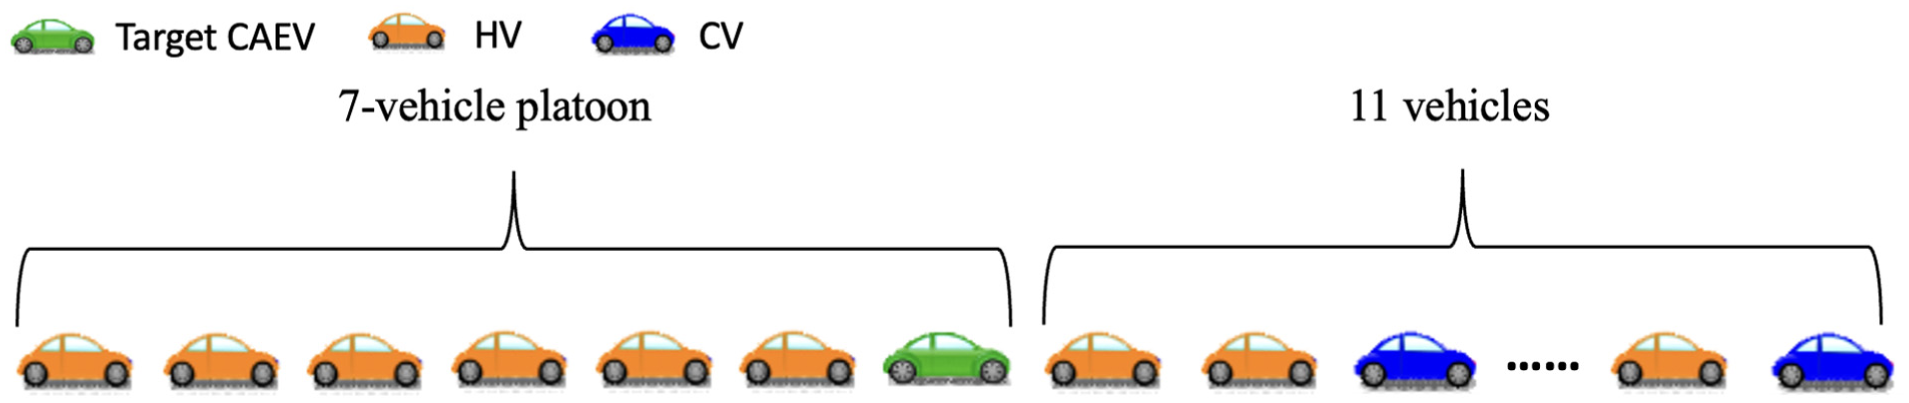
Six HVs behind the target CAEV following an 11-vehicle platoon.
However, there is a balance between increased energy benefits and increased average computation time for each MPC optimization cycle. The optimal controller needs to be implemented in real time, meaning that each MPC optimization cycle should be completed within 1 s. In this traffic scenario, as shown in Figure 17, the total energy benefits of the seven-vehicle platoon increase from 7.47% to 10.05% when the number of following HVs considered in the optimization algorithm increases from zero to five. However, the benefits plateau when the number of HVs increases from four to five. As shown in Figure 18, the average computation time per MPC cycle increases from 0.45 to 0.98 s with more HVs included in the optimization. When all six HVs are considered, the average computation time rises to nearly 2 s, while the marginal improvement in total energy benefits diminishes. These results suggest that while including more HVs in the optimization generally enhances the energy savings of the vehicle platoon, it also leads to increased computational cost. Therefore, to ensure real time feasibility, a trade-off must be made between computational complexity and the achievable energy benefits.
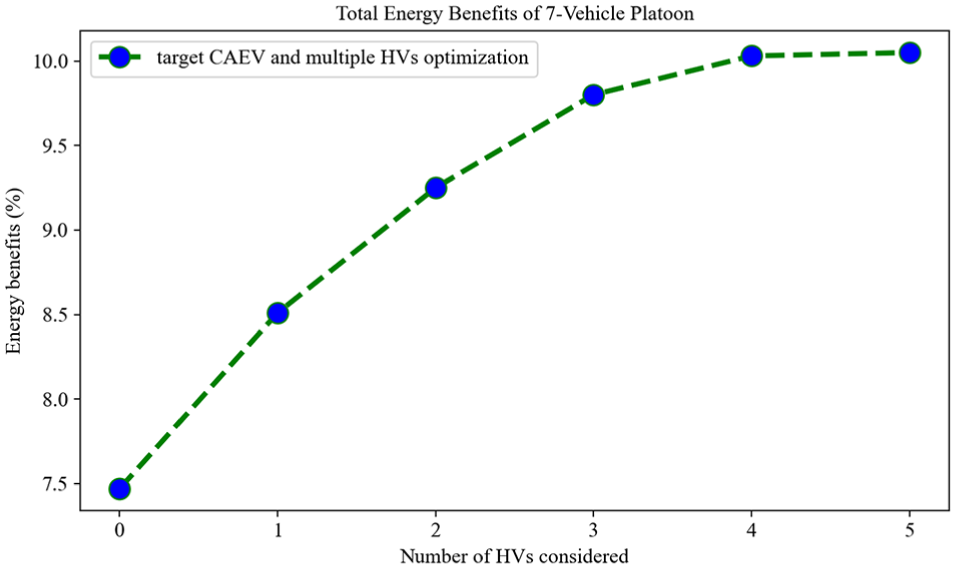
Total energy benefits of the seven-vehicle platoon when considering different numbers of HVs behind.
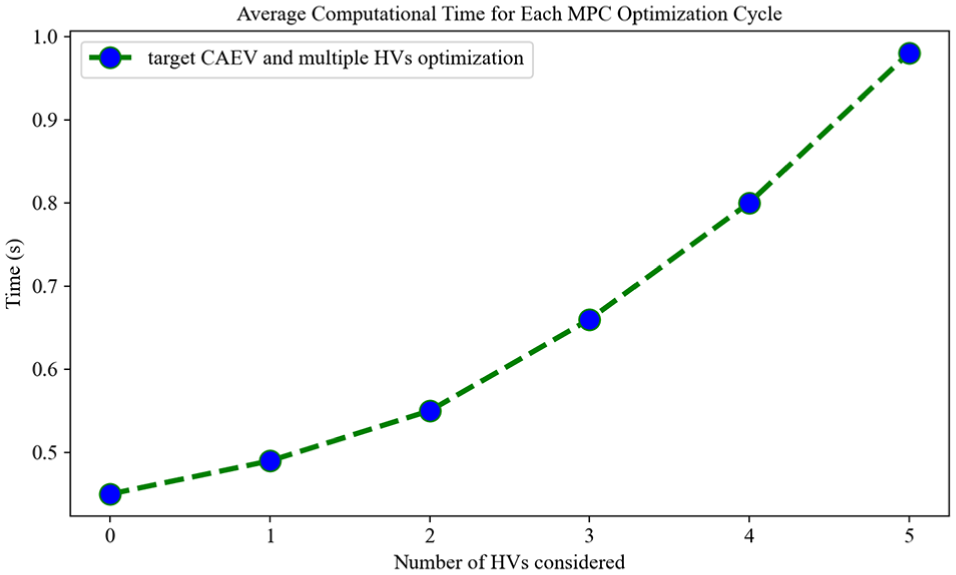
Average computation time for each MPC optimization cycle when considering different numbers of HVs behind.
Optimal Control Approach of Multiple CAEVs Considering Multiple HVs Behind
In the previous subsection, the total energy benefits of the vehicle platoon increased only marginally as the number of HVs considered in the optimization rose from four to five. This suggests that a single CAEV can provide limited energy benefits to a long vehicle platoon. In real-world traffic, multiple CAVs are likely to appear within longer platoons. This section examines various scenarios to investigate the potential energy savings for a traffic platoon with multiple CAEVs.
A 12-vehicle platoon, consisting of multiple CAEVs and HVs, follows an 11-vehicle platoon, as shown in Figure 19. For simplicity, it is assumed that all CAVs in the 12-vehicle platoon are CAEVs, and the number of HVs behind each CAEV is known. In Cases 1, 2, and 3, how different numbers of CAEVs within the platoon affect energy benefits is examined. The trajectories of the 12-vehicle platoon without accounting for HVs behind are shown in Figure 20. As more CAEVs are introduced, vehicle trajectories become smoother. Each CAEV leverages the optimal trajectory of the preceding CAEV: the second CAEV benefits from the first, and the third benefits from the second. This chain of information sharing enables each CAEV to further improve its energy efficiency and trajectory smoothness as it approaches intersections.
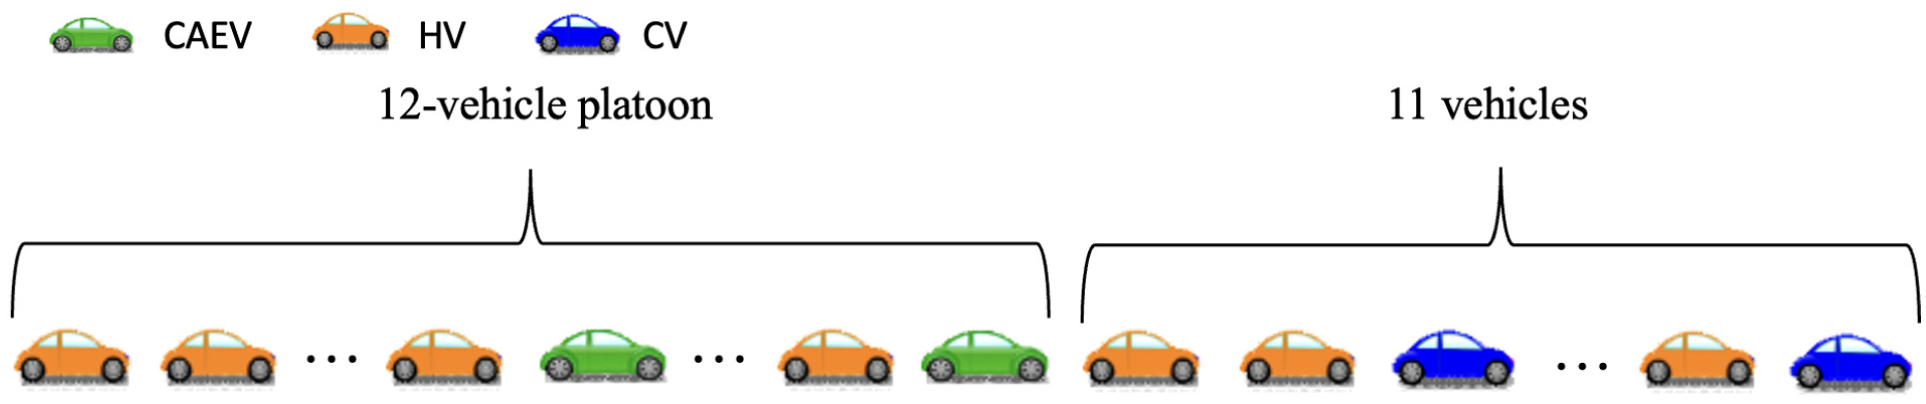
A 12-vehicle platoon, including multiple CAEVs and HVs, follows an 11-vehicle platoon.
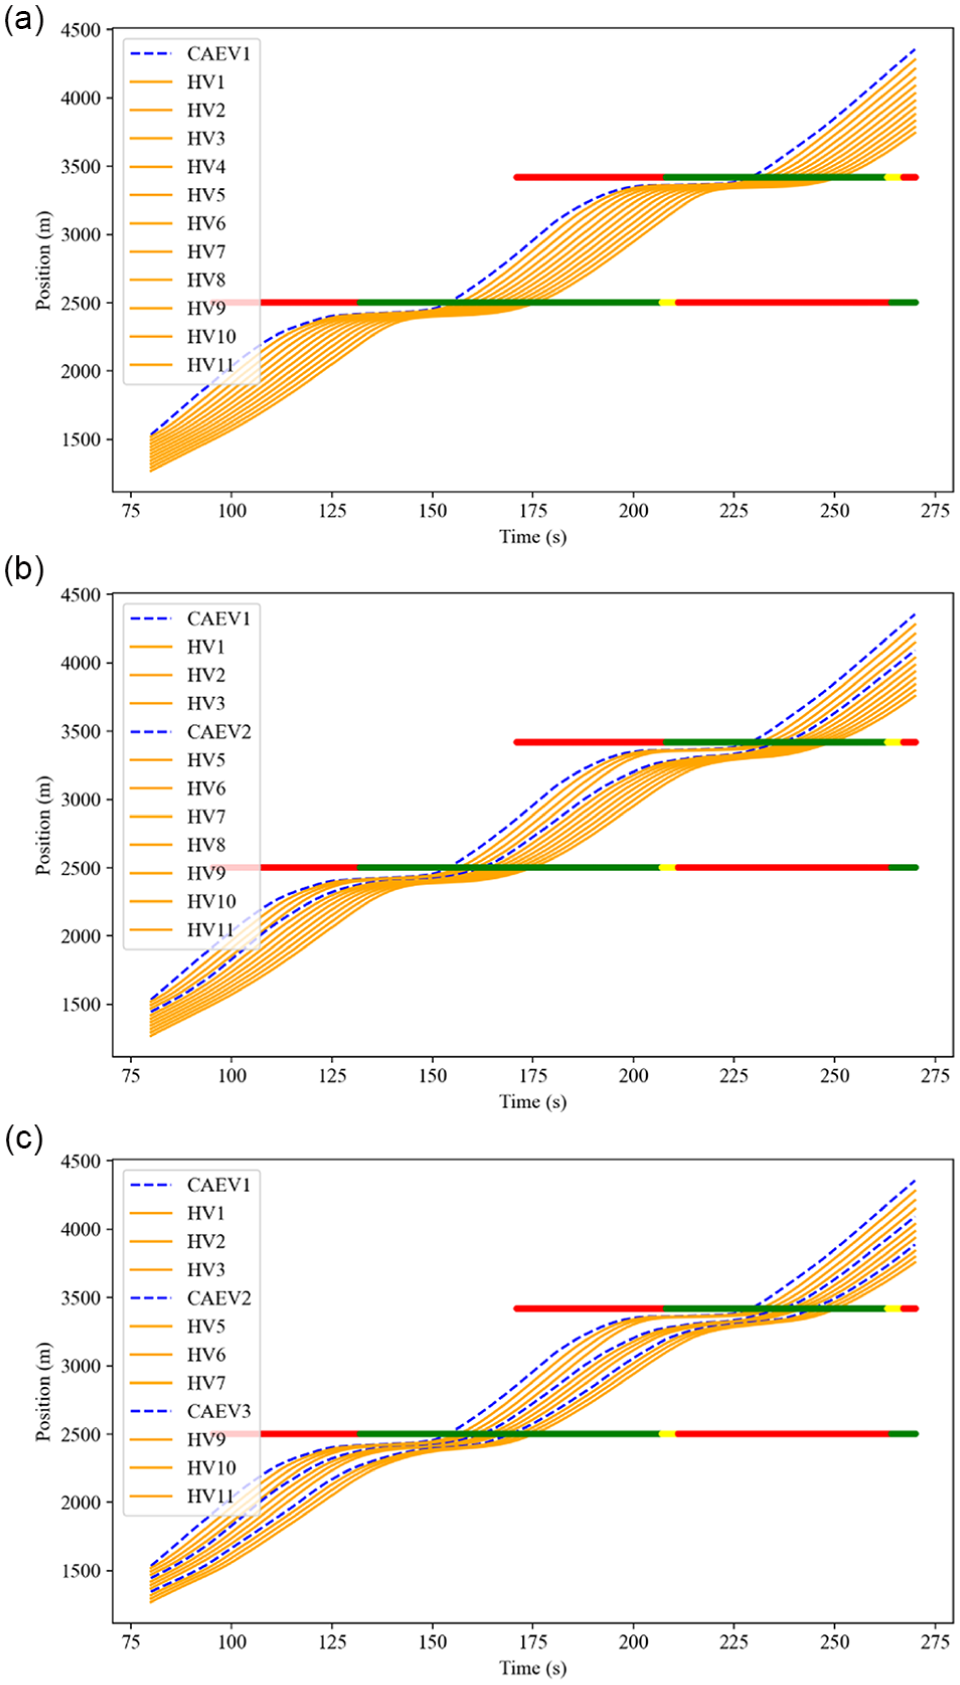
Trajectory of the 12-vehicle platoon without considering HVs behind: (a) Case 1: one CAEV; (b) Case 2: two CAEVs; and (c) Case 3: three CAEVs.
In addition, the HVs behind each CAEV passively benefit from following the optimized CAEV trajectories. As given in Table 6, the energy benefits achieved by the 12-vehicle platoon increased from 6.36% to 13.86% as more CAEVs were introduced. In contrast, Cases 4, 5, and 6 consider both the CAEVs and their following HVs in the optimization process. As shown in Figure 21, this results in even smoother trajectories across the entire platoon, as all vehicles, CAEVs and HVs, operate proactively and optimally when approaching intersections. When the energy consumption of HVs is also considered, the total energy benefits of the 12-vehicle platoon increase from 8.1% to 15.2% with the inclusion of additional CAEVs, as summarized in Table 6.
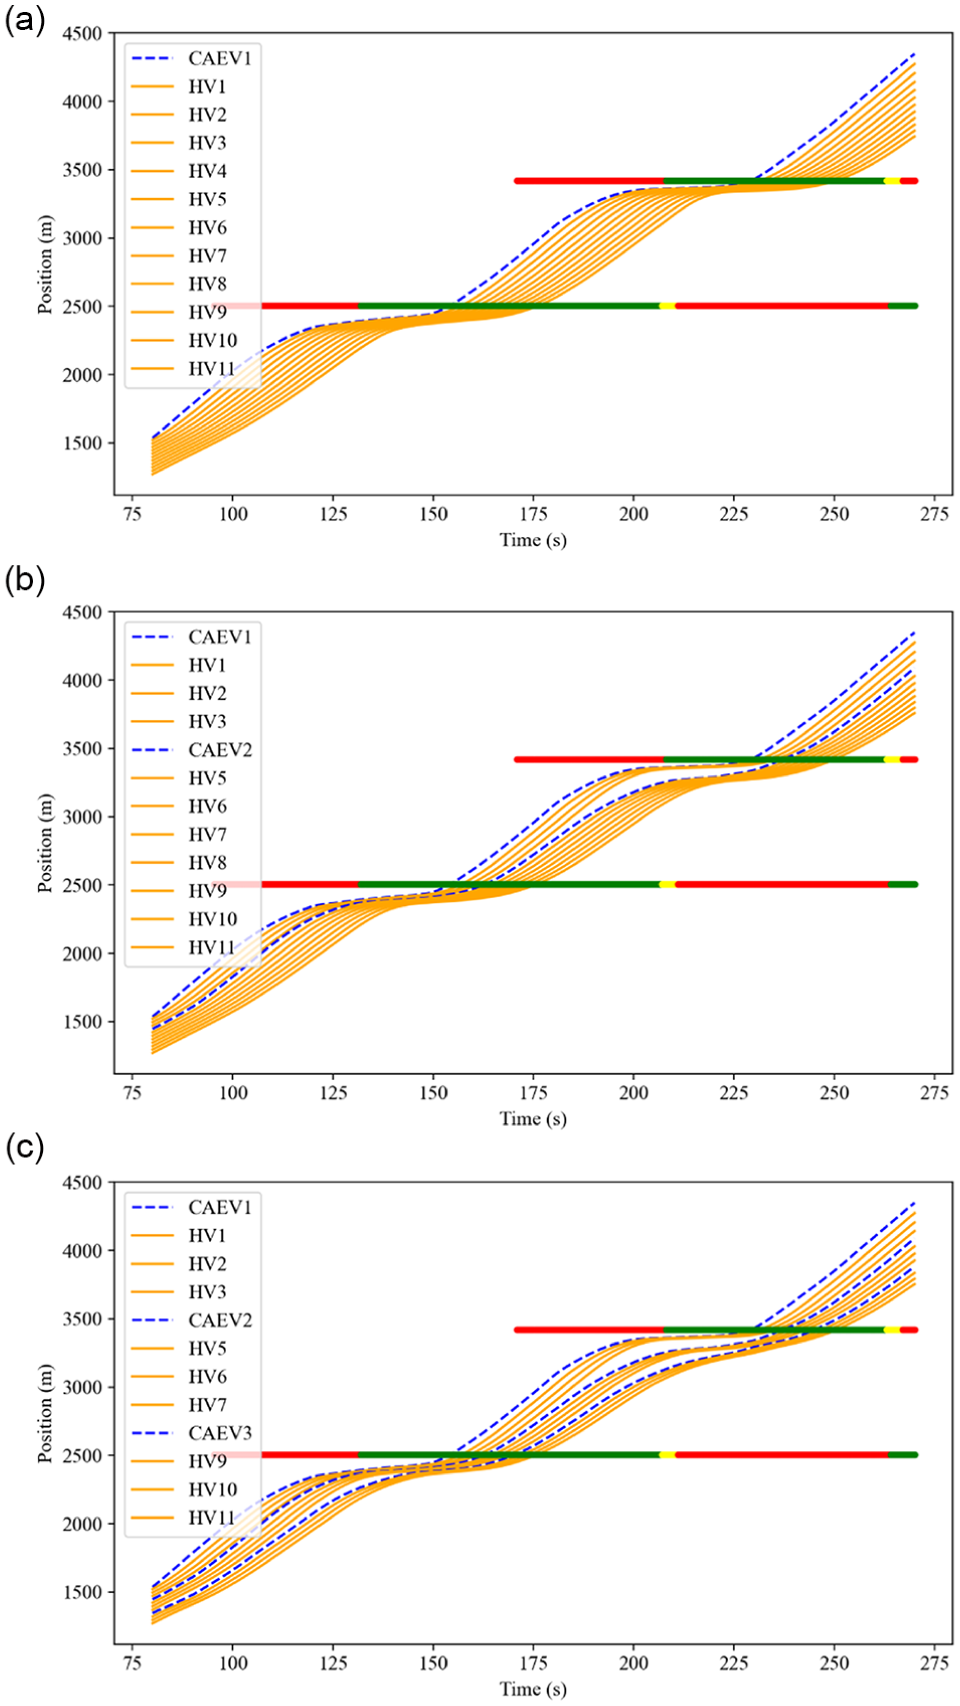
Trajectory of the 12-vehicle platoon considering HVs behind. The energy consumption of the HVs behind each CAEV is considered, potentially leading to greater effects on the energy benefits of the platoon: (a) Case 4: one CAEV; (b) Case 5: two CAEVs; and (c) Case 6: three CAEVs.
Total Energy Benefits Achieved by the Platoon From Case 1 to Case 6
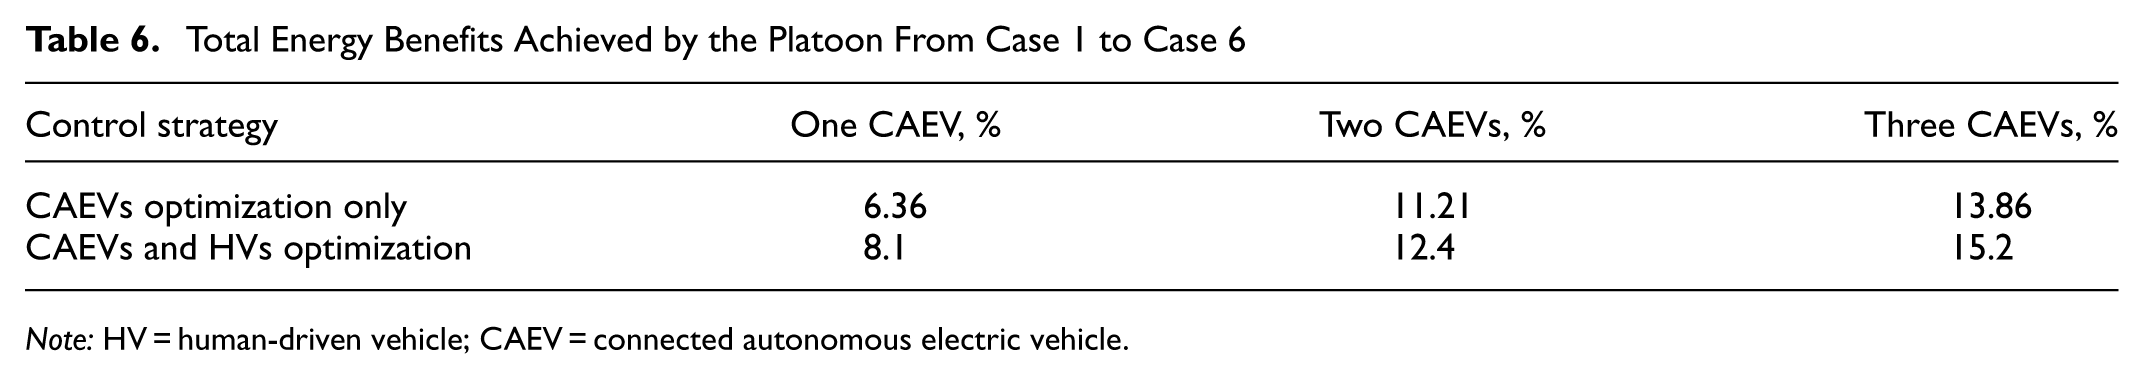
Note: HV = human-driven vehicle; CAEV = connected autonomous electric vehicle.
Conclusion
This paper presents a comprehensive control framework that integrates real time traffic prediction with vehicle co-optimization, focusing on both target CAEVs and multiple following HVs. By leveraging predicted traffic information, an extended co-optimization strategy is developed to reduce energy consumption for target vehicles and their following HVs. The framework accounts for constraints related to vehicle dynamics, powertrain dynamics, and battery characteristics, aiming to solve the eco-driving control problem for any CAEV while considering its influence on surrounding HVs.
To evaluate the proposed control strategy, two primary simulation scenarios are conducted. In the first scenario, the optimization focuses on a target CAEV and a single following HV. Extensive traffic scenarios generated using SUMO are employed to demonstrate the robustness of the control strategy under varying car-following behaviors. The results show that the following HV achieves approximately 3.1%–3.74% energy savings. In addition, randomly generated traffic conditions reveal that higher CV penetration rates upstream of the target CAEV yield increased energy benefits for the HV, from 3.03% to 6.27%.
In the second scenario, the optimization strategy is extended to include multiple following HVs. A seven-vehicle platoon composed of a target CAEV and six HVs is analyzed under different configurations. The results indicate energy savings from 7.47% to 10.05% as the number of HVs included in the optimization increases from zero to five. Further analysis is conducted on a 12-vehicle platoon consisting of multiple CAEVs and HVs. When HVs behind each CAEV are explicitly considered, the total energy benefits increase from 8.1% to 15.2% as more CAEVs are introduced.
For future work, several important extensions will be investigated. First, deploying the proposed control framework in real-world traffic environments will require robust sensing and communication capabilities, such as vehicle-type detection via cameras, SPaT messages from roadside units (RSUs), and V2V/V2I communication, which are increasingly available in modern connected corridors. Successful deployment must also address parameter uncertainty, sensor noise, and communication delays. Field experiments will be conducted to evaluate the practicality and robustness of the proposed framework under realistic operating conditions. Second, although this framework follows established modeling practices to ensure meaningful comparison with existing studies, incorporating human driving models trained from naturalistic driving data offers a more persuasive and realistic representation of the HVs behind the target CAEV. Such data-driven models can better capture the diversity of human driving behaviors and improve the fidelity of simulation results. This extension will be considered in our future work. Third, information availability for rear vehicles may vary in practice despite advances in rear-facing sensing and V2V/V2I communication. To enhance robustness, the prediction framework will be extended to model the behavior of the HVs behind the target CAEV, enabling fully bidirectional (front and rear) traffic prediction within a unified structure. In addition, the framework can seamlessly integrate estimation modules (e.g., UKF-based state estimation) if rear-vehicle data becomes partially unavailable, without requiring any major modification to the core MPC formulation. Furthermore, a wider range of scenario variations, such as randomized initial spacing, larger traffic compositions, and non-fixed or actuated signal timing, will be explored to further strengthen the generality of the findings.
Footnotes
Author Contributions
The authors confirm contribution to the paper as follows: study conception and design: J. Guo, S. Wang, S. He, M. Zamanpour, Z. Sun; data collection: J. Guo; analysis and interpretation of results: J. Guo, S. Wang; draft manuscript preparation: J. Guo, S. Wang. All authors reviewed the results and approved the final version of the manuscript.
Declaration of Conflicting Interests
The authors declared no potential conflicts of interest with respect to the research, authorship, and/or publication of this article.
Funding
The authors disclosed receipt of the following financial support for the research, authorship, and/or publication of this article: This research was supported financially by the Minnesota Department of Transportation under Grant 3013-11135-00105684.