
Abstract
Metro service disruptions occur frequently in large cities, making emergency bus bridging services essential for maintaining network functionality and reducing passenger delays. With the rapid electrification of urban bus fleets, traditional bus bridging strategies face new challenges related to electric bus state-of-charge (SOC) limits and charging availability, which are often ignored in existing models. This study develops a mixed-fleet optimization framework for emergency bus bridging services that jointly considers diesel buses and electric buses (EBs). Two models are formulated: a standard feeder model (SFM) providing all-stop services, and a combined feeder model (CFM) that supplements standard feeders with limited-stop direct services to serve high-demand origin–destination (OD) pairs. Both models explicitly incorporate EB SOC constraints, charging requirements, and coordinated fleet deployment. A case study based on the December 2023 rear-end collision on the Beijing Subway Changping Line demonstrates that both models can generate feasible emergency response plans under realistic operational and charging constraints. Compared with the SFM, the CFM reduces total system cost from RMB 76,802.99 to 76,752.93. This improvement is driven by a reduction of RMB 322.98 in passenger delay cost, which outweighs an increase of RMB 272.93 in operator cost. Sensitivity analyses are further conducted to evaluate model performance under varying demand patterns, disruption durations, direct-service capacities, and charger availabilities. Results indicate that the CFM performs best under concentrated demand, long-distance trips, and moderate disruption durations, highlighting its effectiveness in reducing passenger delays for high-impact OD flows.
Introduction
Urban rail transit (URT), particularly metro systems, is a critical part of urban mobility because of its high capacity, energy efficiency, and reliability. However, metro service disruptions have become more frequent, caused by infrastructure issues such as rail wear or power failures, operational malfunctions such as signal, door, or train faults, and emergencies such as falling objects, passenger falls, or crowd crushes ( 1 , 2 ). The rear-end collision on Beijing Metro’s Changping Line in December 2023 halted operations for about 24 hours, resulting in significant passenger delays and highlighting the service weaknesses in current contingency plans ( 3 ). Beyond immediate delays and safety risks, frequent disruptions erode public trust in URT services and may lead to long-term ridership declines ( 4 , 5 ). These impacts emphasize the urgent need for effective, flexible, and passenger-oriented emergency response strategies.
When metro services are disrupted, emergency bus bridging is a common and immediate solution. It deploys buses to replace affected metro segments, reducing passenger delays and maintaining network functionality. Over time, many studies have focused on improving bus bridging services, primarily by optimizing fleet allocation, route design, and scheduling. However, most studies assume that all replacement buses are diesel-powered and that they can be dispatched without fuel constraints, implicitly assuming they are always fully fueled and do not need refueling during operations. With the ongoing transition toward sustainable transportation, many cities are integrating electric buses (EBs) into their fleets, which frequently require charging.
EBs provide important environmental benefits, including lower emissions and reduced noise, thereby contributing to cleaner urban air and supporting cities’ carbon-neutrality goals. Nevertheless, EBs also face significant operational constraints. Their operating range is more limited than that of DBs, which necessitates more frequent recharging. In addition, charging durations are nonnegligible and may disrupt service continuity if not properly managed. EBs also depend heavily on available charging infrastructure, which creates additional difficulties in emergency scenarios requiring rapid deployment, flexible route adjustment, and frequent vehicle rotation. Traditional emergency scheduling and dispatching models that neglect these constraints cannot adequately capture the actual performance of electrified bus fleets during disruptions. In particular, the interaction between vehicle range limits, charging demand, and service availability has rarely been explicitly incorporated into emergency bus bridging models.
To address this gap, this study develops a mixed-fleet optimization framework for emergency bus bridging services under metro disruptions. The framework explicitly integrates diesel buses (DBs) and EBs and consists of two service models: the standard feeder model (SFM), which provides standard all-stop feeder services, and the combined feeder model (CFM), which supplements the standard feeder structure with targeted direct services along high-impact corridors. Importantly, the proposed framework is intended as a planning and early response decision-support tool, rather than a real-time dispatching or vehicle-level control system. This study makes the following three contributions:
(1) We develop a mixed-fleet emergency bus bridging optimization framework that explicitly captures EB state-of-charge (SOC) constraints, charging requirements, and the coordinated deployment of DBs and EBs. This enables a more realistic representation of electrified fleet operations during metro disruptions.
(2) We propose the CFM, which extends the standard feeder structure by introducing direct services for selected high-demand origin–destination (OD) corridors. This design helps bypass service bottlenecks, reduce passenger accumulation, and improve evacuation efficiency under disruption conditions.
(3) Through a real-world case study and a set of sensitivity analyses, we examine how demand patterns, disruption duration, charger capacity, and direct-service capacity affect total system cost and passenger delay, and we derive planning-level insights for configuring service structures and charging resources.
This paper proceeds as follows: review of the relevant research on bus bridging services and bus fleet electrification; formulating the mixed EB–DB response problem; presentation of the feeder model; applying the models to Beijing’s Changping Line and conducting an empirical study on the December 2023 disruption; reporting the sensitivity study results; and a conclusion of the research and suggestions for future directions on emergency response.
Literature Review
Bus bridging service has long been recognized as a fundamental measure for mitigating the impacts of metro service disruptions ( 6 – 8 ). Such services typically involve deploying a dedicated bus fleet to transport passengers between closed metro stations and nearby transfer or assembly points, such as operational stations or regular bus stops, thereby temporarily replacing disrupted rail services along the affected segment ( 9 , 10 ). Most studies focus on key operational aspects, including route design, fleet allocation, and demand-responsive scheduling.
Recent research has evolved in two main directions. The first focuses on system-level efficiency, aiming to minimize evacuation time, travel costs, and fleet mileage through various optimization frameworks. For example, Dikas and Minis propose an optimization approach to balance these factors, which Liang et al. refine to better accommodate different disruption scenarios ( 9 , 11 ). Zhao et al. ( 12 ) and Chen et al. ( 13 ) introduce joint routing–scheduling/timetabling approaches that further improve system efficiency. The second direction adopts a passenger-oriented perspective, focusing on reducing travel delays, waiting times, and unmet demand. Studies by Wang et al. ( 14 ), Jin et al. ( 15 ), and Adnan et al. ( 16 ) fall into this category. Recognizing the trade-offs between these two objectives, scholars have proposed multiobjective and multistage optimization models. Zhang and Lo ( 17 , 18 ) incorporate uncertainty in system recovery time to optimize the deployment of substitute services. Together, these studies provide an important foundation for balancing operational efficiency and passenger service quality in bus bridging design.
Despite these advances, key challenges remain: demand uncertainty, intermodal coordination, and response-time sensitivity. To address demand uncertainty, Luo and Xu ( 10 ) propose a two-stage stochastic model that captures random passenger demand and fleet availability to reduce unmet demand and operating costs. Similarly, Chen et al. ( 19 ) consider stochastic bus travel times and jointly optimize passenger guidance and expand bridging services, achieving notable cost savings. Advances in intermodal coordination are seen in Ke and Verma’s ( 20 ) rail–truck risk management framework, which integrates optimization and regression analysis for cross-modal resource reallocation—a method applicable to rail–bus operations. For response-time sensitivity, Yap and Cats ( 21 ) apply supervised learning to predict disruption frequency and delay impacts, improving time-critical emergency response planning.
However, most models assume a homogeneous DB fleet that is always available and unconstrained by energy limits. This assumption is increasingly inconsistent with the ongoing electrification of urban bus fleets. EBs provide a low-emission alternative to diesel fleets, but their limited operating range, variable energy consumption, and substantial charging requirements also cause significant operational difficulties, particularly in time-critical or adaptive scenarios ( 22 , 23 ). Recent studies have addressed these issues in routine operations. Behnia et al. ( 24 ) explore optimal charging infrastructure placement and energy efficient depot assignments, while Zheng et al. ( 25 ) propose a self-adaptive charging framework for dynamic vehicle-depot allocation. Chung and Chiou ( 23 ) analyze the cost-service trade-offs in mixed EB–DB fleets, and Abdelaty et al. ( 26 ) demonstrate that charger outages can significantly reduce network capacity, highlighting the importance of resilient infrastructure. Although these studies account for EB-related constraints in routine operations, they do not directly address metro disruption response or emergency bus bridging service design.
The EB deployment for emergency management is a relatively new research area. Zhang and Zhang ( 27 ) propose a multitrip EB routing model for short-notice evacuations, considering SOC limits and passenger equity. Yan et al. ( 28 ) introduce a mixed-fleet strategy for urban flash floods, while Li et al. ( 29 ) optimize predisaster evacuations under charger-capacity constraints. Tang et al. ( 30 ) show that mobile charging stations can reduce queuing delays during large-scale evacuations. However, most emergency management models address charging coordination at an aggregate level and do not adapt it to metro disruption and rail-replacement bus bridging scenarios. Babaei and Wong ( 31 ) advocate for scheduling frameworks that incorporate real-time SOC monitoring, charger availability, and vehicle resilience into emergency operations.
These findings underscore the need to integrate emergency bus bridging research with the practical constraints of electrified bus fleets. In particular, there remains a lack of modeling frameworks that jointly consider mixed diesel–electric fleet deployment, charging constraints, and feeder service design in metro disruption scenarios. To address this research gap, this study develops an optimization model that incorporates key EB characteristics, such as limited operating range, long recharging times, and charger-capacity constraints, into the planning and scheduling of metro replacement services. By aligning emergency response strategies with the technical limits of electrified bus fleets, the model offers a sustainable, resilient, and feasible solution for designing bus bridging services under metro disruptions.
Emergency Bus Feeder Service Design
System Framework
Metro disruptions require rapid and robust response strategies to prevent cascading impacts on the urban transport system. When metro services are suspended, trains terminate at the nearest operational stations, and passengers within the disrupted segment must rely on surface transport. In practice, transit agencies respond by deploying emergency bus bridging services to restore basic connectivity and evacuate stranded passengers.
In this study, the emergency bus bridging problem is formulated as a planning and early response decision problem, rather than a real-time vehicle dispatching or control problem. The objective is to support transit agencies in determining the appropriate service structure and allocating a mixed diesel–electric fleet under a predefined disruption horizon. The overall framework, illustrated in Figure 1, integrates network information, fleet characteristics, and passenger demand to generate implementable emergency response plans.
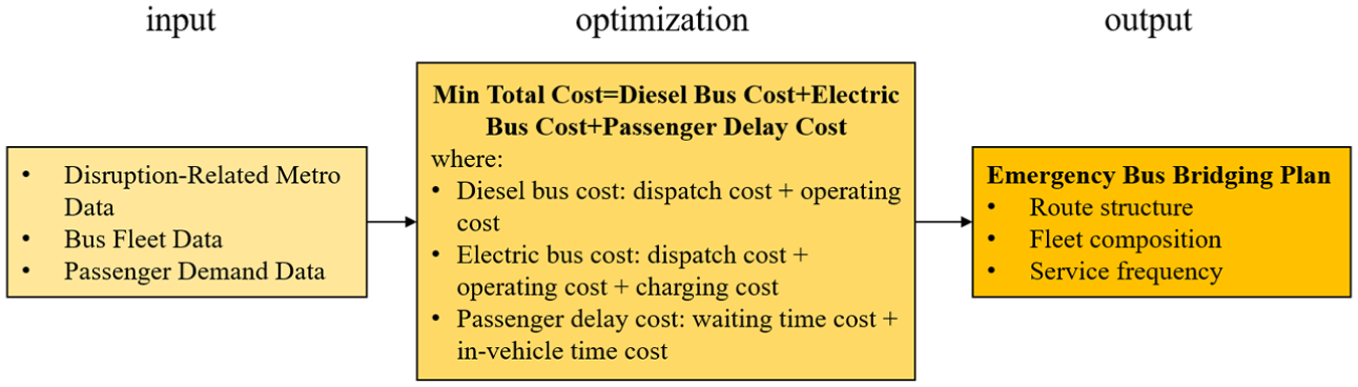
System framework of the proposed emergency bus bridging optimization model.
As shown in Figure 1, the framework requires three categories of input data: (1) disruption-related metro data, including the disrupted segment and adjacent operational stations; (2) bus fleet data, including depot locations, vehicle capacities, and charging characteristics; and (3) passenger demand data, including accumulated demand and OD distribution within the disrupted corridor. Based on these inputs, the framework evaluates alternative feeder service structures and fleet deployment strategies.
Within the optimization module, the objective is to minimize total system cost, including DB operating cost, EB operating and charging cost, and passenger delay cost. The output is an emergency bus bridging plan specifying route structure, fleet composition, and service frequency, subject to operational and resource constraints. The specific feeder service structures considered in this study are introduced in the following subsection.
Hybrid Route Design with Fleet Heterogeneity
From an operational perspective, two types of emergency bus bridging strategies are commonly observed in practice. The first is a standard all-stop feeder service, in which buses serve all stations within the disrupted segment to ensure full spatial coverage and operational simplicity. The second is a combined feeder strategy, in which limited-stop or direct services are selectively introduced to relieve passenger congestion at major hubs and accommodate time-sensitive passenger demand.
These two strategies are represented in this study by the SFM and the CFM, respectively. The SFM corresponds to the baseline emergency response practice widely adopted by transit agencies, emphasizing rapid deployment and robust coverage. The CFM retains the standard feeder service while supplementing it with direct services, reflecting operational measures such as limited-stop shuttles or point-to-point evacuation services.
Fleet heterogeneity is explicitly considered in both strategies. In general, larger capacity vehicles are better suited to standard feeder services because they can accommodate spatially dispersed demand and provide broad corridor coverage. By contrast, more flexible vehicles, including EBs in practical operations, may be deployed on direct services to improve service responsiveness and operational flexibility. This arrangement allows transit agencies to balance service coverage, capacity provision, and operational efficiency under disruption conditions.
Figures 2–4 illustrate the standard feeder structure, the direct feeder structure, and the combined feeder structure. Although the physical routes are shown for clarity, the selection of service structure and fleet allocation is determined endogenously in the optimization model. In particular, the CFM allows direct services to be introduced only when they generate sufficient passenger time savings relative to the standard feeder service.

Standard feeder mode and route.
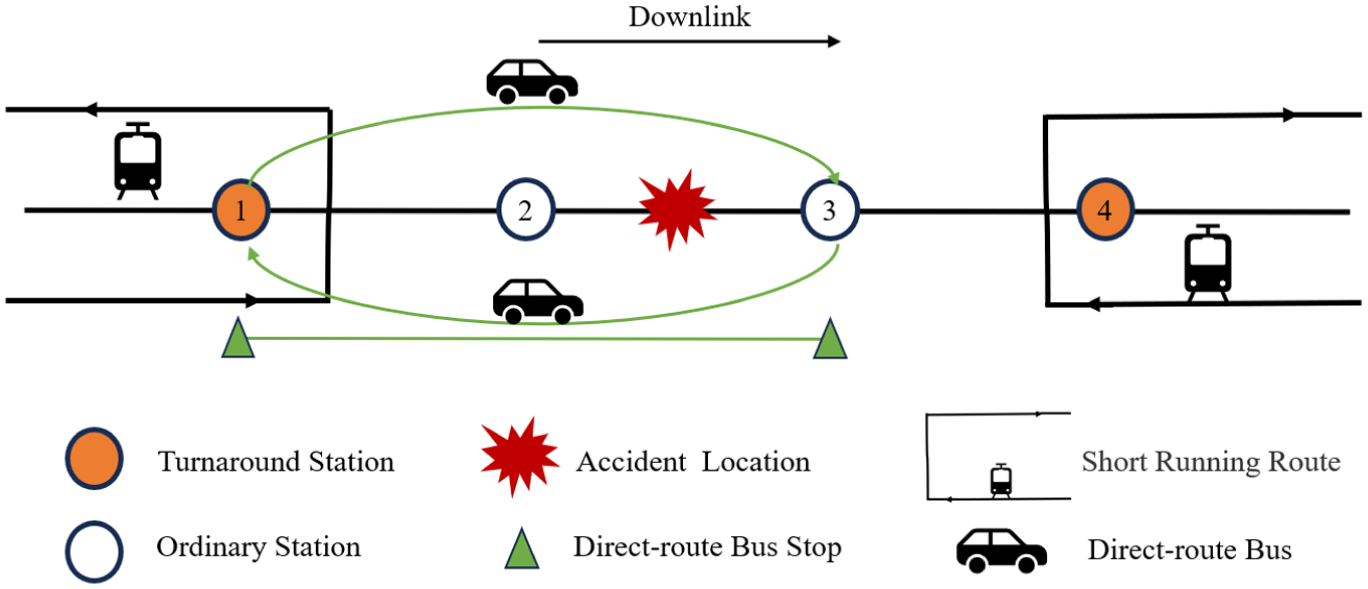
Direct feeder mode and route.
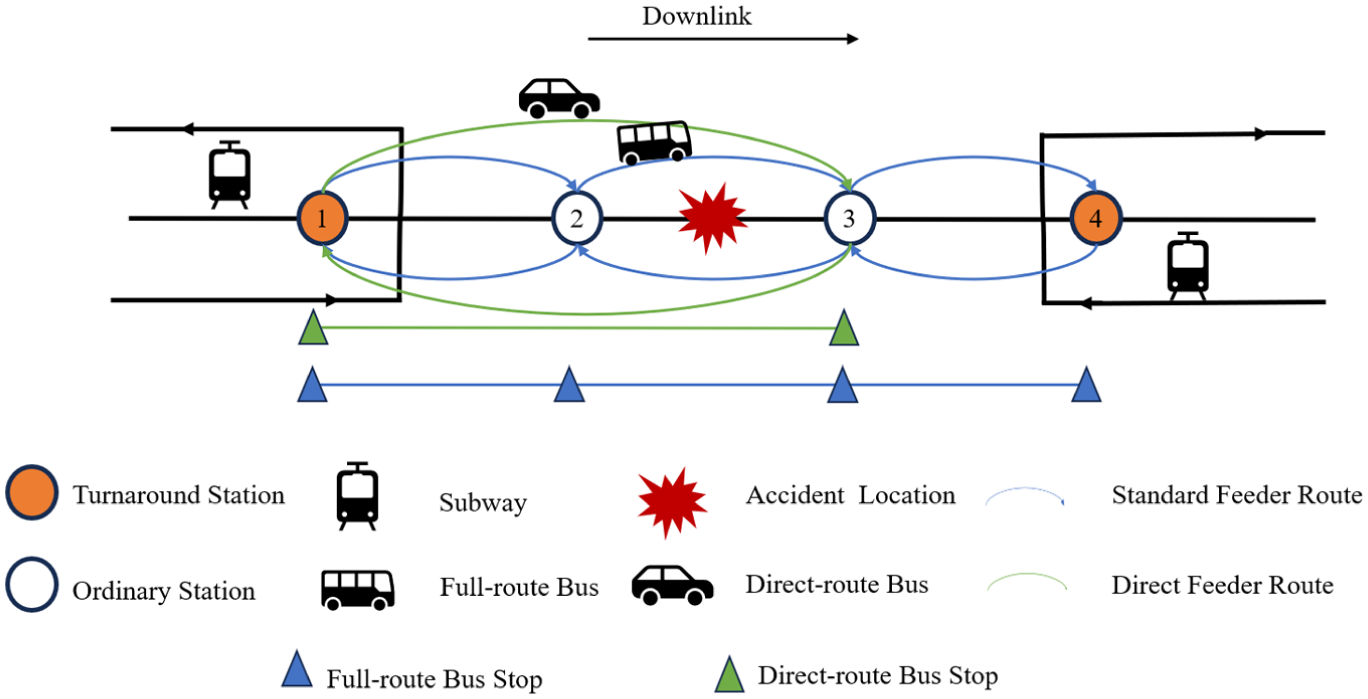
Combined feeder mode and route.
Model Formulation
This study develops an optimization framework for emergency bus bridging services under metro disruptions, with the objective of minimizing total system cost. The total system cost explicitly includes bus operating costs and passenger delay costs, thereby capturing both operator efficiency and passenger service performance. Within this framework, the emergency bus bridging problem is formulated to jointly determine fleet deployment, fleet composition, and feeder service structure, subject to operational and resource constraints. The formulation is intended for planning and early response decision making under a predefined disruption horizon, rather than real-time vehicle-level dispatching.
Problem Definition and Notation
This subsection defines the disrupted transit system, passenger demand, and service modes used in the model. The disrupted rail segment is assumed to include

The shortest road travel distances between stations are given by the distance matrix

where
Passenger demand during the emergency period is described by an OD demand matrix

where

which represents the total number of passengers that must be served by the bus bridging system.
To represent different service structures in a unified manner, a set of feeder service modes is defined as

where
All symbols, parameters, and decision variables used in the model are summarized in Table 1.
Notation of Sets, Parameters, and Variables
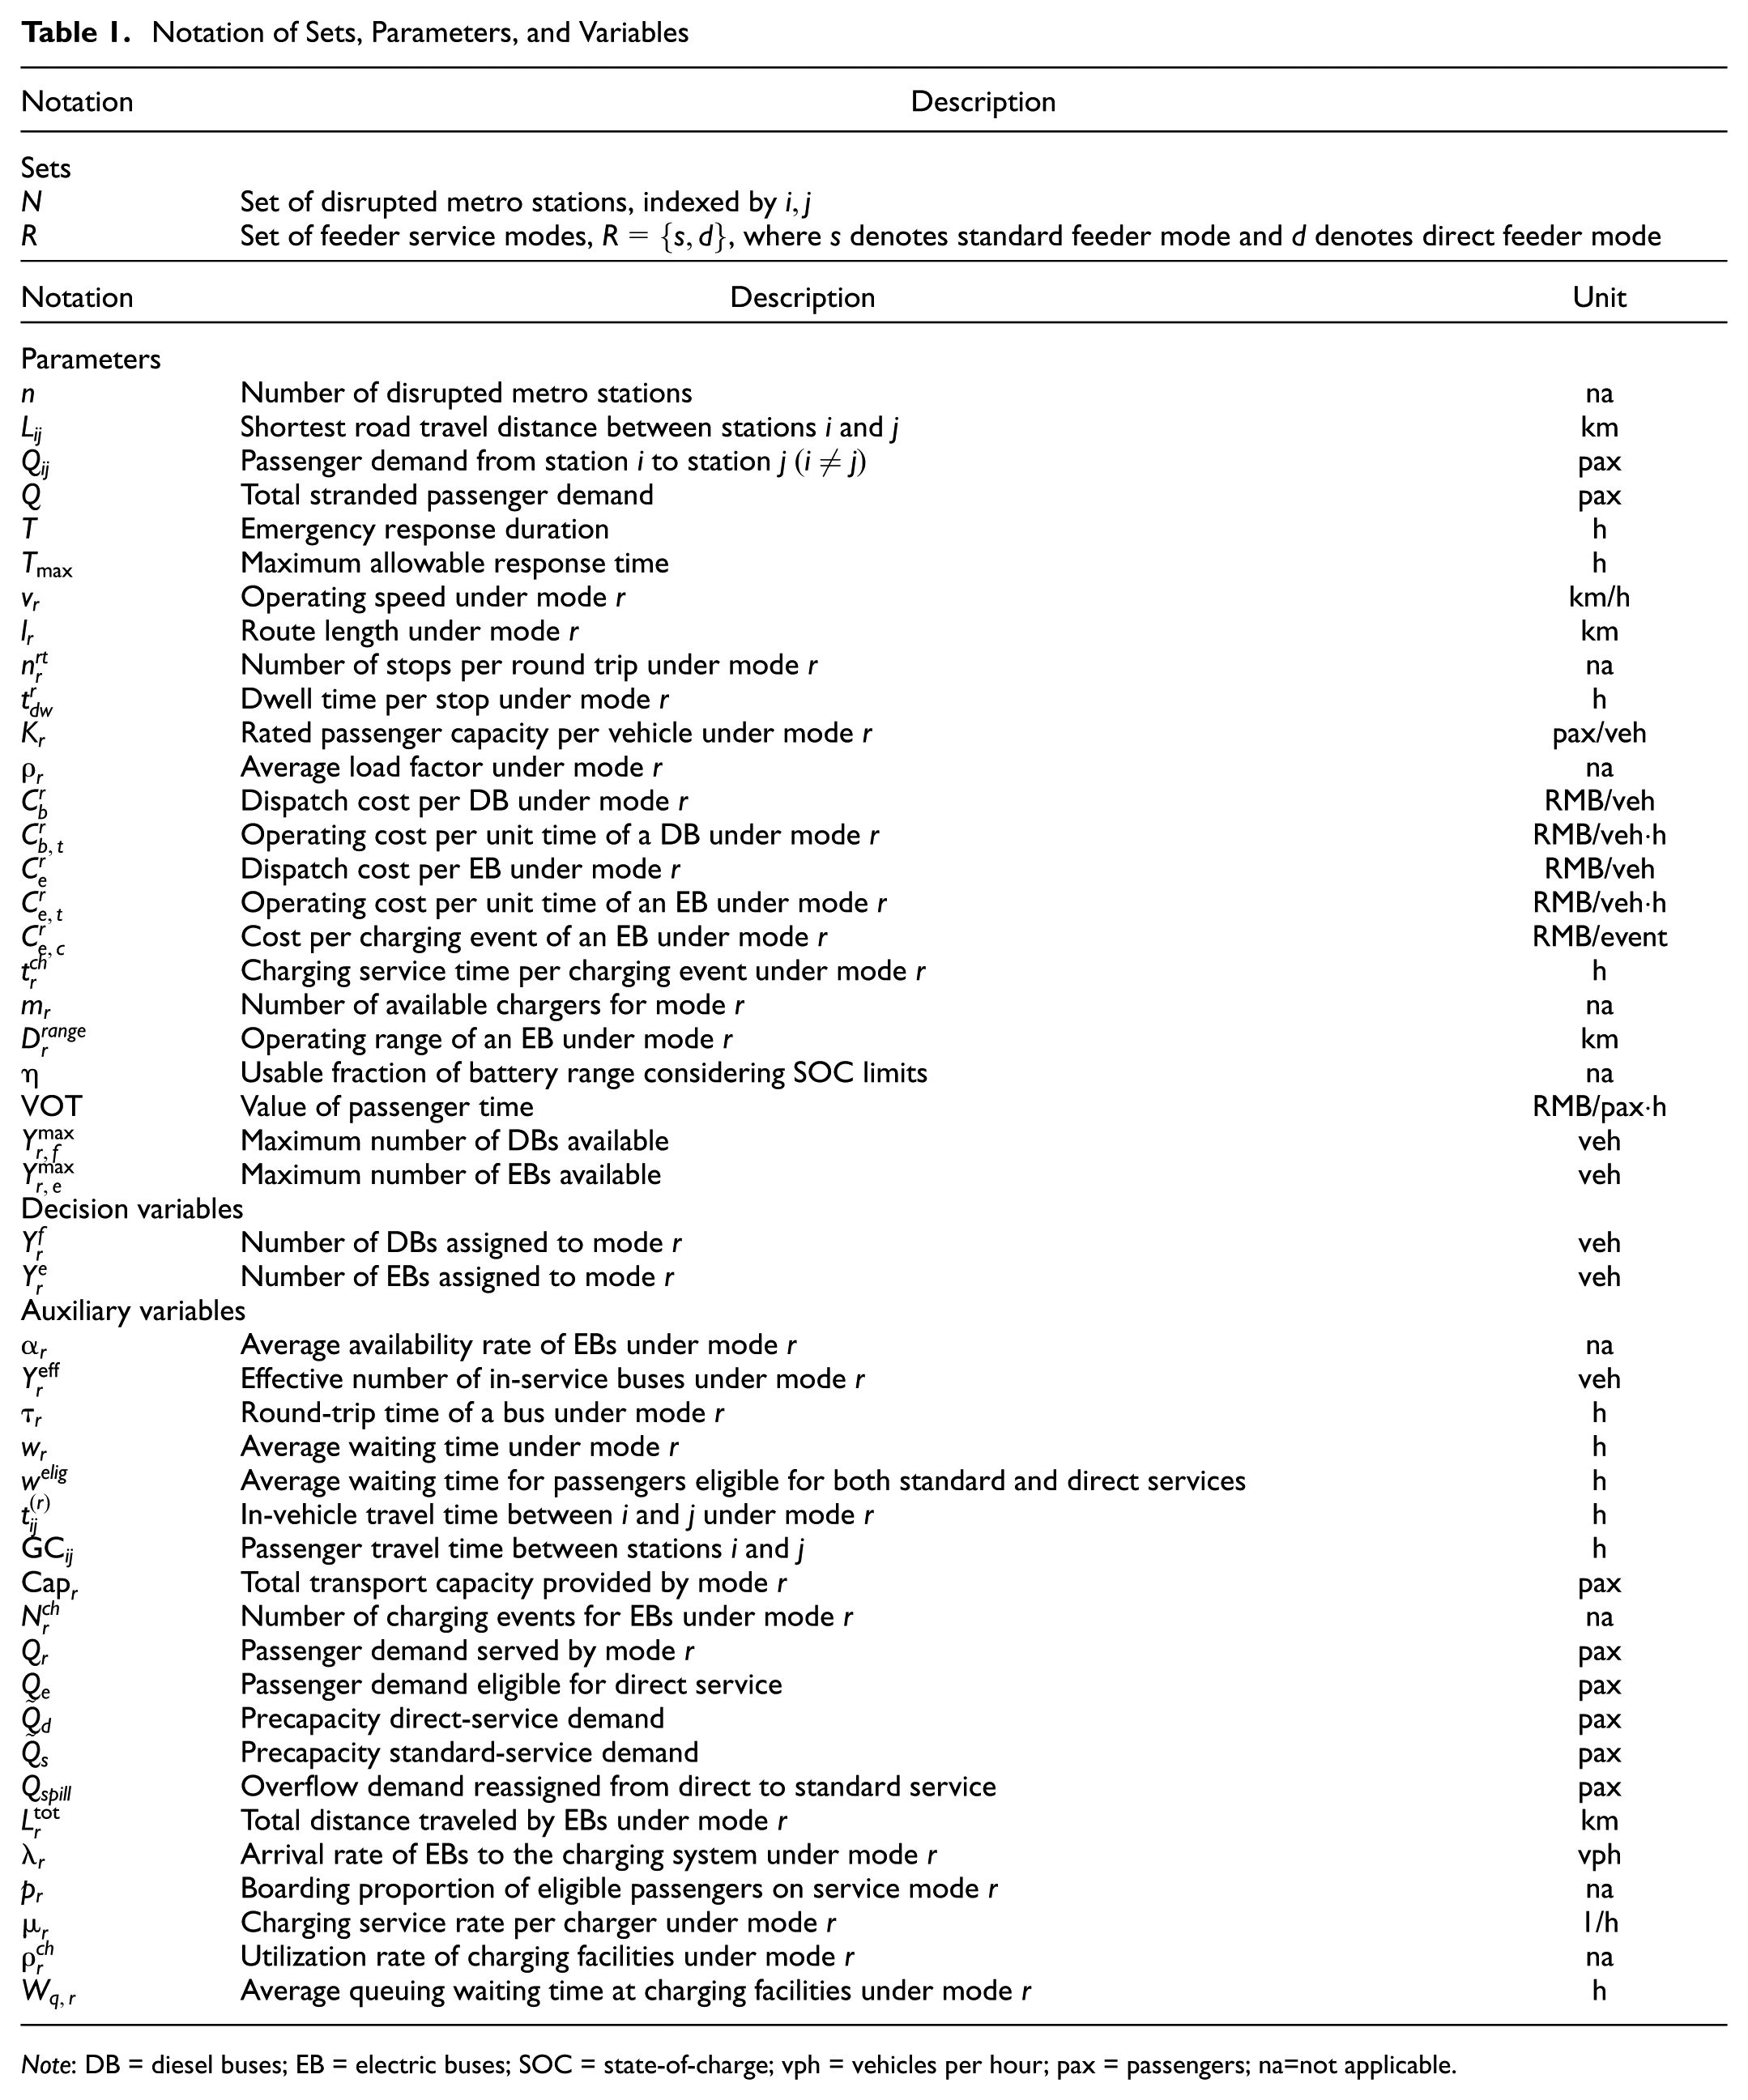
Note: DB = diesel buses; EB = electric buses; SOC = state-of-charge; vph = vehicles per hour; pax = passengers; na=not applicable.
This study formulates the problem at the planning and early response level for a predefined disruption horizon
Objective Function
The objective of the proposed model is to minimize the total system cost incurred during emergency bus bridging operations:

where
Cost Modeling
The operating cost of DBs consists of dispatching costs and time-dependent operating costs:

where
The cost associated with EBs includes dispatching costs, operating costs adjusted by vehicle availability, and charging-related costs:

where
Passenger delay cost is accumulated over all OD pairs and defined as

where VOT is the monetary value of passenger time. The term

with
Operation and Charging Capacity Modeling
Within the emergency response horizon
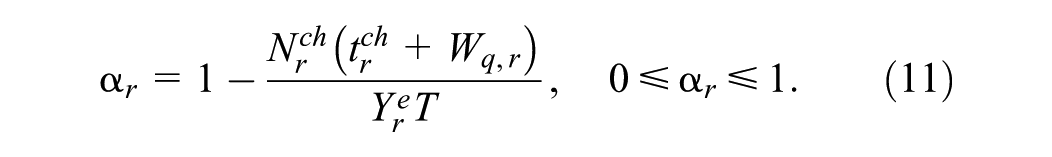
This expression quantifies the fraction of time that EBs can be actively used for passenger service. When no EBs are assigned to mode
Under disruption conditions, multiple EBs may arrive at charging facilities within a short period, leading to congestion and queuing. The charging subsystem is approximated as a GI/G/m queueing system to capture charging congestion and waiting under disruption conditions. The arrival rate is

The service rate of a single charger is

and the utilization rate of the charging system is

Using the Allen–Cunneen approximation ( 32 ), the average queuing waiting time is estimated as

where
DBs are assumed to be fully available throughout the response period, whereas EBs are adjusted by their availability rate. It is important to note that EBs are not assumed to charge after each trip. The effective number of in-service buses under mode

where
For each mode, the round-trip time of a single bus is given by

where
Accordingly, the average passenger waiting time for each service mode is approximated as

under the assumption of evenly spaced vehicle arrivals.
Passenger Time Modeling
Passenger delay is a key indicator of service performance in emergency bus bridging systems. Under disruption conditions, passengers are highly sensitive to both waiting time and in-vehicle travel time, and different service structures may therefore lead to substantially different travel experiences. This issue is particularly important in the CFM, where certain OD pairs may be served by both the standard feeder service and a direct feeder service.
In the CFM, candidate direct services are not specified ex ante. Instead, all feasible OD pairs within the disrupted corridor are treated as potential candidates, and the direct-service OD pair is selected endogenously according to passenger time-saving potential and eligible demand. This design ensures that direct services are introduced only on corridors where they can generate the greatest system-level benefit under emergency conditions.
Accordingly, passenger time is modeled by jointly considering in-vehicle travel time and waiting time under a common-lines boarding rule. Under this rule, passengers who can use both the standard and the direct feeder services do not select a specific service in advance; rather, they board the first arriving vehicle among the available services. Therefore, their expected waiting time is determined by the combined arrival frequency of the two services, and the demand split between them is determined by their relative arrival frequencies, as detailed in the following.
For any OD pair

where

Under the direct feeder mode, intermediate stops are neglected, and the in-vehicle travel time is

where
In the CFM, two types of passengers are distinguished. Passengers who can only use the standard feeder service experience an average waiting time of

where
Among all OD pairs, the pair that yields the maximum in-vehicle travel time savings is selected for direct service:


The corresponding demand eligible for direct service is

For eligible passengers, a common-lines (first-arrival) assumption is adopted. That is, passengers do not choose a specific service in advance but instead board the first arriving vehicle from the standard and direct feeder services.
Let

which denotes the arrival rates of the standard or direct feeder service, respectively. The corresponding waiting time for eligible passengers is

Under this assumption, the boarding proportion of eligible passengers assigned to each service is proportional to its arrival frequency:


Accordingly, the precapacity demand allocation is


When the demand for direct services exceeds the available capacity


The overflow demand is reassigned to the standard feeder service. Eligible passengers boarding under the common-lines rule experience the pooled waiting time
Capacity and Feasibility Constraints
Based on the passenger demand distribution derived in the section “Passenger Time Modeling,” this section defines the capacity and feasibility constraints governing emergency bus bridging operations.
Under mode

where
In the SFM, all passengers are served by the standard route, and the total demand must not exceed its capacity:

In the CFM, passenger demand is distributed according to the common-lines assignment described in the section “Passenger Time Modeling,” and the following constraints must be satisfied:


together with the overall demand conservation condition

Finally, vehicle deployment is constrained by the total available fleet size. Let


In addition, the emergency bus bridging operation must be completed within a predefined maximum response time:

Solution Procedure
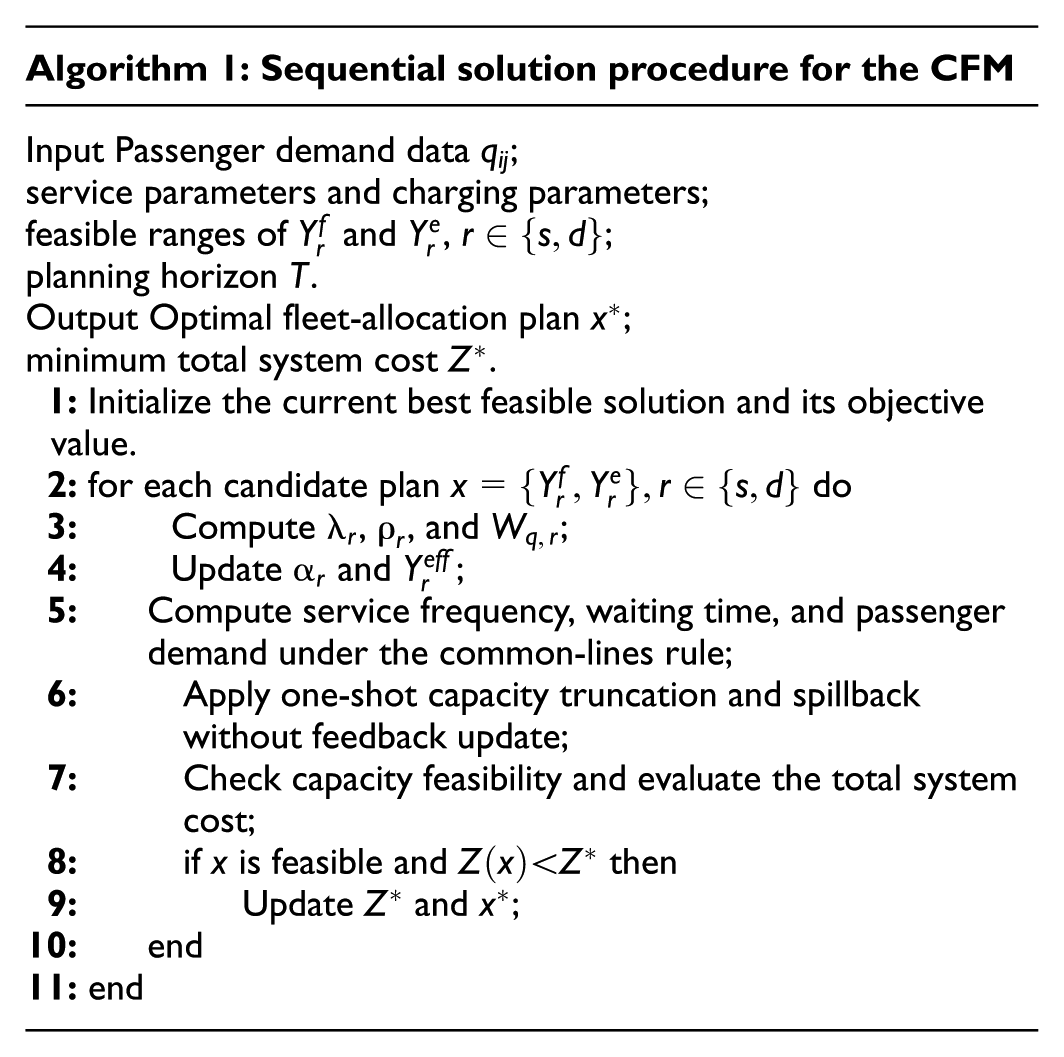
Because the CFM involves charging–availability coupling, queueing-based charging delays, effective-fleet updating, and passenger demand reallocation, it is no longer solved as a single integrated linear optimization program. Instead, a genetic-algorithm-based sequential evaluation procedure is adopted.
For each candidate fleet-allocation plan generated by the genetic algorithm, the charging subsystem is first evaluated to compute the charging arrival rate, charger utilization rate, and average charging queueing delay. These outputs are then used to update the EB availability factor, which is treated as an endogenous quantity within the solution process. Based on the updated EB availability factor, the effective fleet size under each service mode is obtained.
The model then computes service frequency and passenger waiting time, after which passenger demand is allocated according to the common-lines rule. Under this rule, passengers eligible for both standard and direct feeder services board the first arriving vehicle, and the demand split is determined by the relative arrival frequencies of the two services.
If the resulting direct-service demand exceeds the available direct-service capacity, a one-shot spillback adjustment is applied. Specifically, the served direct demand is truncated at the available capacity, and the overflow demand is reassigned once to the standard feeder service. This step is treated as a sequential postprocessing adjustment and does not trigger any iterative feedback update of waiting times, service frequencies, or assignment proportions within the same candidate solution.
Finally, the total system cost is evaluated for each feasible candidate plan. The model is implemented in Python, and the genetic algorithm searches the feasible fleet-allocation space. The best feasible solution with the minimum total system cost is retained as the final result. The detailed steps are presented in Algorithm 1.
Case Study
This section presents a case study based on the “12–14” rear-end collision on the Changping Line of the Beijing Metro to illustrate the applicability of the proposed models for planning emergency bus bridging services. On December 14, 2023, at 18:52, a collision between two trains occurred between Xi’erqi Station and Life Science Park Station, leading to a complete suspension of service along the affected segment. The incident caused direct economic losses of approximately RMB 9.508 million and resulted in severe passenger delays. Figure 5 illustrates the affected segment of the Changping Line.
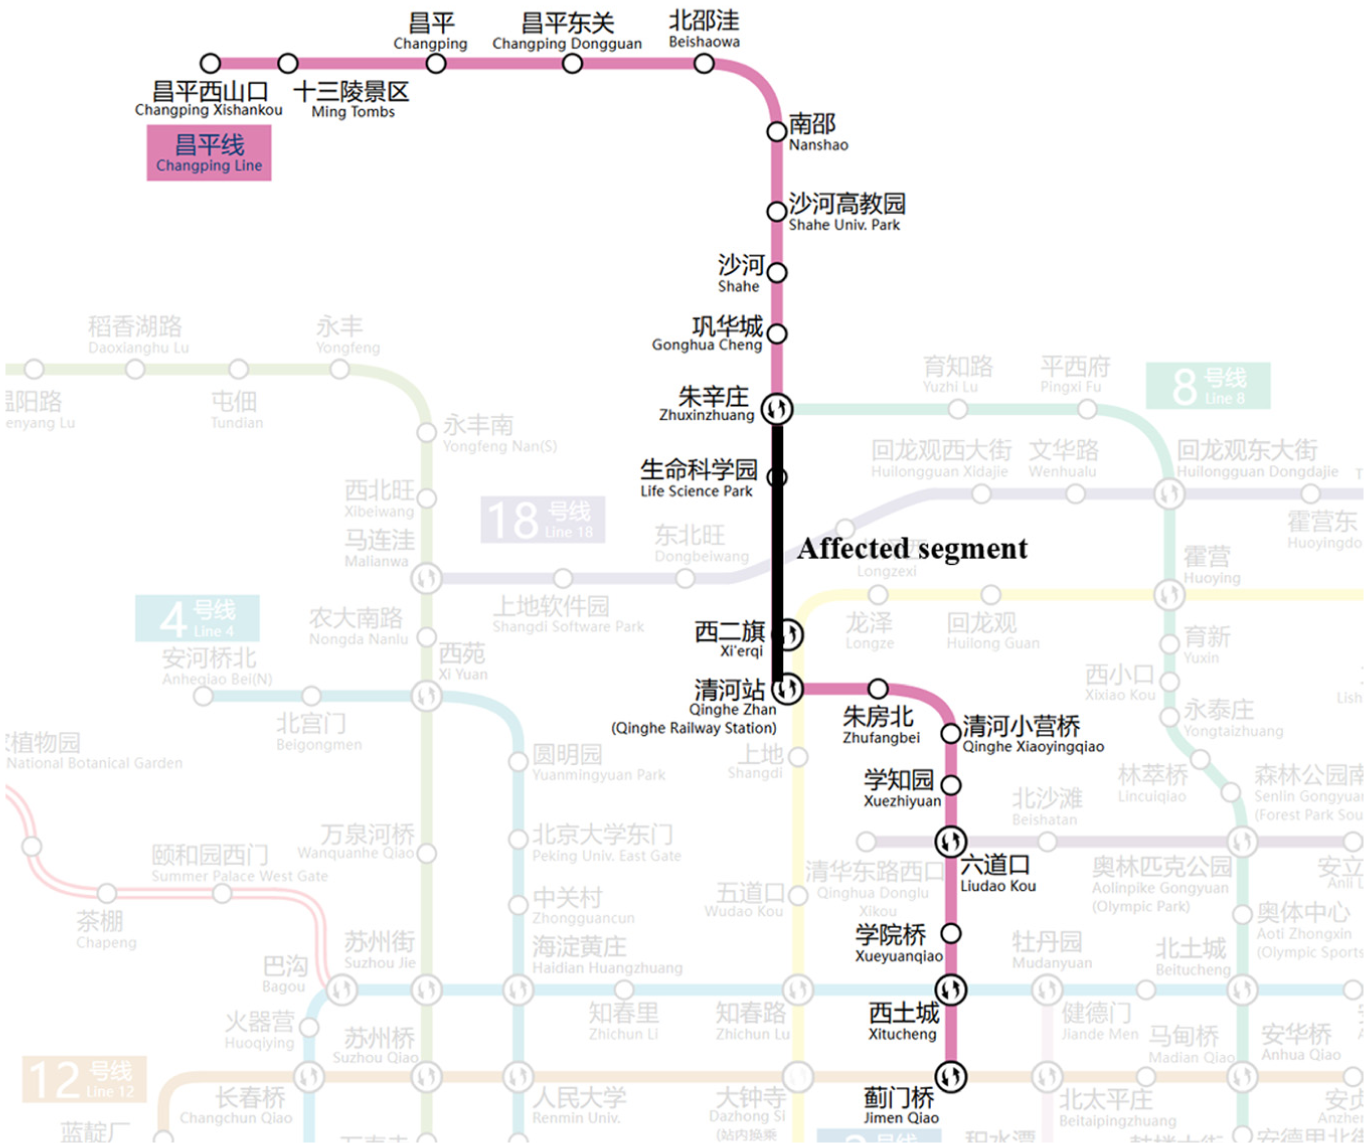
Affected segment of the Changping Line of the Beijing Metro.
The case study is designed to support planning and early response decisions rather than to reconstruct real-time vehicle-level operations. All inputs, including passenger demand and network characteristics, are derived from historical records and are assumed to be available to transit agencies for scenario-based emergency preparedness.
Field surveys were conducted to identify bus depots capable of supporting emergency operations near the disrupted corridor. Candidate depots were required to (1) provide sufficient standby fleet capacity and (2) allow rapid access to the disrupted segment. Based on these criteria, six depots—Xiyuhe, Shahe, Zhuxinzhuang, Baigezhuang, Pingxiwangfu, and Huoying—were identified as candidate depots. It is assumed that these depots can jointly supply up to 40 buses for standard feeder services and 20 buses for direct services. For the case study, DBs and EBs are assumed to each account for 50% of the available fleet.
For modeling purposes, the disrupted segment is defined as the corridor between Qinghe Station and Zhuxinzhuang Station, as shown in Figure 6. This corridor defines the spatial scope of the emergency bus bridging services considered in this study. The four stations within this segment—Qinghe, Xi’erqi, Life Science Park, and Zhuxinzhuang—constitute the set of stations directly affected by the service suspension. Passengers whose origins or destinations lie outside this segment are assumed to continue their trips using unaffected metro services or regular bus routes and are therefore excluded from the emergency bus bridging demand.
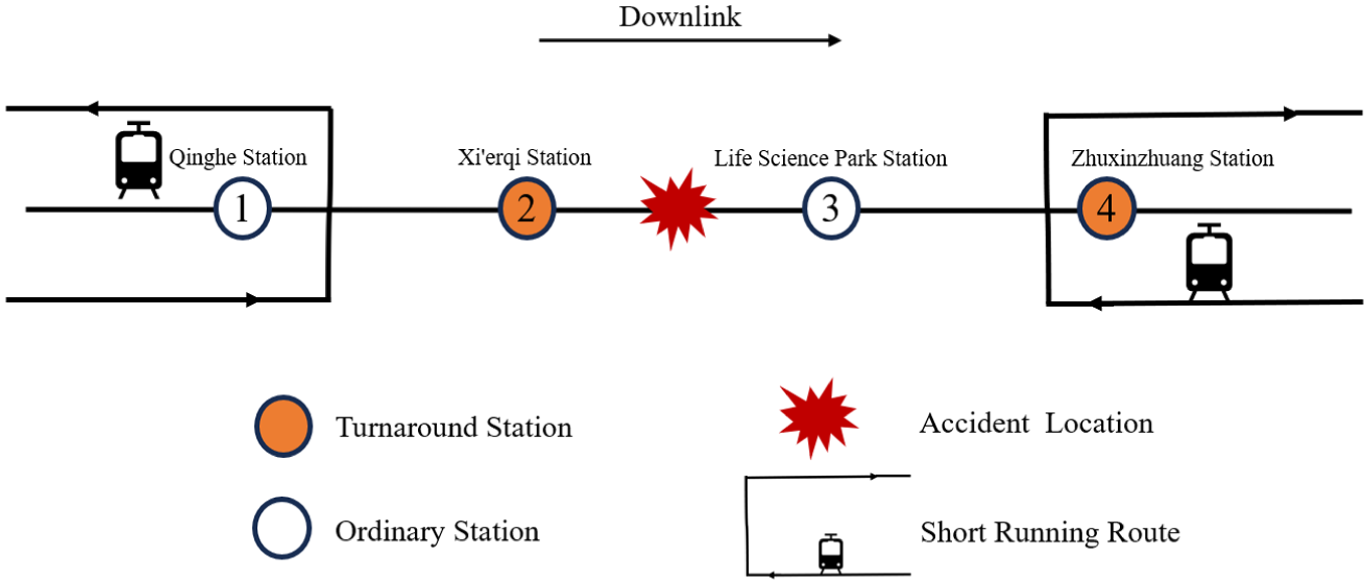
Disruption zone in the Beijing Metro Changping Line incident.
Passenger OD patterns for the emergency period are inferred from historical automated fair collection data provided by Beijing Subway. The data indicate that the majority of stranded passengers during the incident either originated from or were destined for the four stations within the disrupted segment, making them the dominant OD set for emergency bus bridging operations. Restricting the OD matrix to this corridor ensures consistency with the physical extent of the disruption while focusing on the most operationally relevant passenger flows.
Model parameters are calibrated based on local economic conditions and prevailing emergency response practices in Beijing, as summarized in Table 2. The value of passenger time is set to RMB 50/pax/h. Average operating speeds are set to 25 km/h for standard feeder services and 30 km/h for direct services, reflecting differences in stopping patterns and operating environments. Buses are categorized into four types based on service role and energy source. For standard routes, both DBs and EBs are assigned a dispatch cost of RMB 200/veh, a capacity of 80 pax/veh, and a platform dwell time of 1/40 h. DBs incur an operating cost of RMB 200/vehicles per hour [vph], while EBs incur a charging cost of RMB 30 per charging session, with charging time captured through availability constraints. For direct routes, buses are assigned a dispatch cost of RMB 150/veh, a capacity of 60 pax/veh, and a platform dwell time of 1/60 h. Operating costs are RMB 120/vph for DBs, and charging costs are RMB 18 per session for EBs. The emergency response duration is set to 4 hours, consistent with the observed incident.
Parameter Calibration in the Case Study
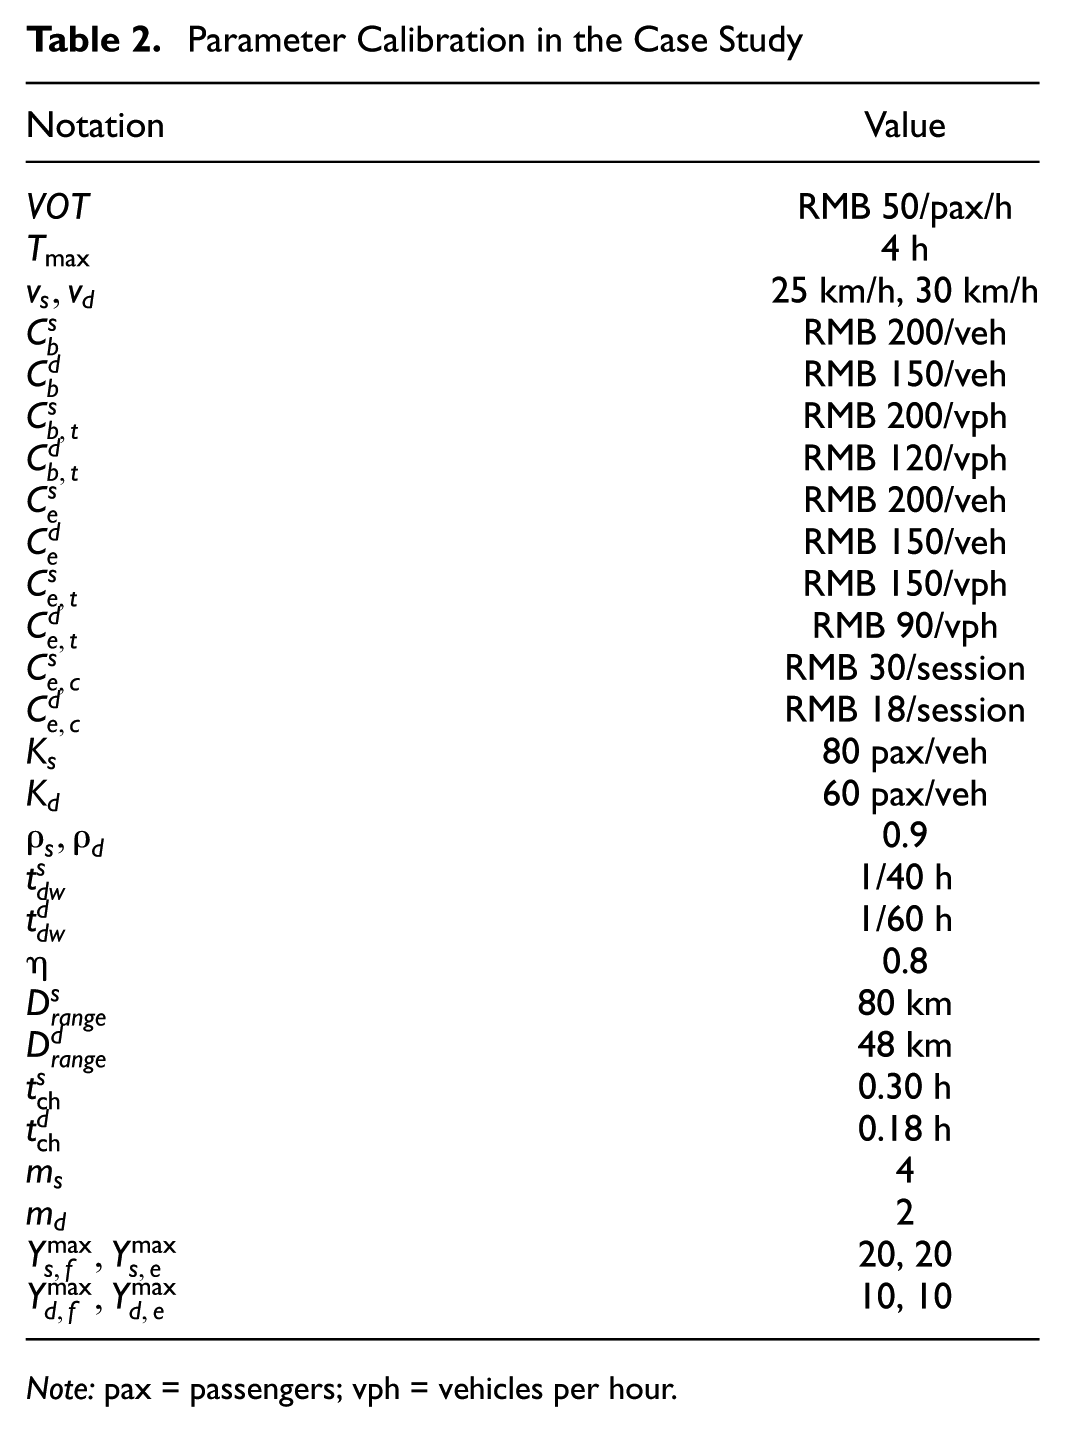
Note: pax = passengers; vph = vehicles per hour.
Applying the models yields both a standard scheme and a combined scheme. The results are obtained by evaluating candidate fleet-allocation plans using the sequential procedure described in Section 4.7.
For the standard scheme, the route starting station is determined by passenger demand at each station, depot availability, and deadhead distance from depots to stations. Zhuxinzhuang Station is selected as the starting point, and the standard route is a round trip between Zhuxinzhuang Station and Qinghe Station via Life Science Park Station and Xi’erqi Station.
Applying the SFM under the sequential evaluation framework determines the dispatched fleet for the standard route. The optimal SFM solution dispatches 1 DB and 15 EBs to the standard route, yielding a total system cost of RMB 76,802.99. In this scheme, 16 buses are assigned to the standard feeder service, and charging requirements are enforced through the charging–availability constraints, ensuring feasibility under the charging capacity limits.
For the combined scheme, the standard route remains unchanged, and a direct route is introduced to serve the OD pair with the largest in-vehicle travel time saving, consistent with the selection rule defined in the section “Solution Procedure,” namely Qinghe Station and Zhuxinzhuang Station. Applying the CFM under the sequential evaluation framework yields an allocation of 0 DBs and 16 EBs on the standard route, together with 0 DB and 1 EB on the direct route, resulting in a total system cost of RMB 76,752.92. Compared with the standard scheme, the combined scheme reduces the total system cost by RMB 50.06 by introducing a direct service for the most time-sensitive OD pair while maintaining feasibility under fleet and charging constraints.
Table 3 compares the performance of the two schemes. Passenger delay costs decrease from RMB 64,081.68 under the SFM to RMB 63,758.69 under the CFM, while total operator costs increase marginally from RMB 12,721.31 to 12,994.23. As a result, the net system-level savings are primarily driven by reductions in passenger delay costs. These results indicate that the advantage of the CFM lies in its ability to endogenously identify and prioritize high-impact OD pairs for direct services, rather than relying on ad hoc route design.
Comparisons of Results in the Two Schemes
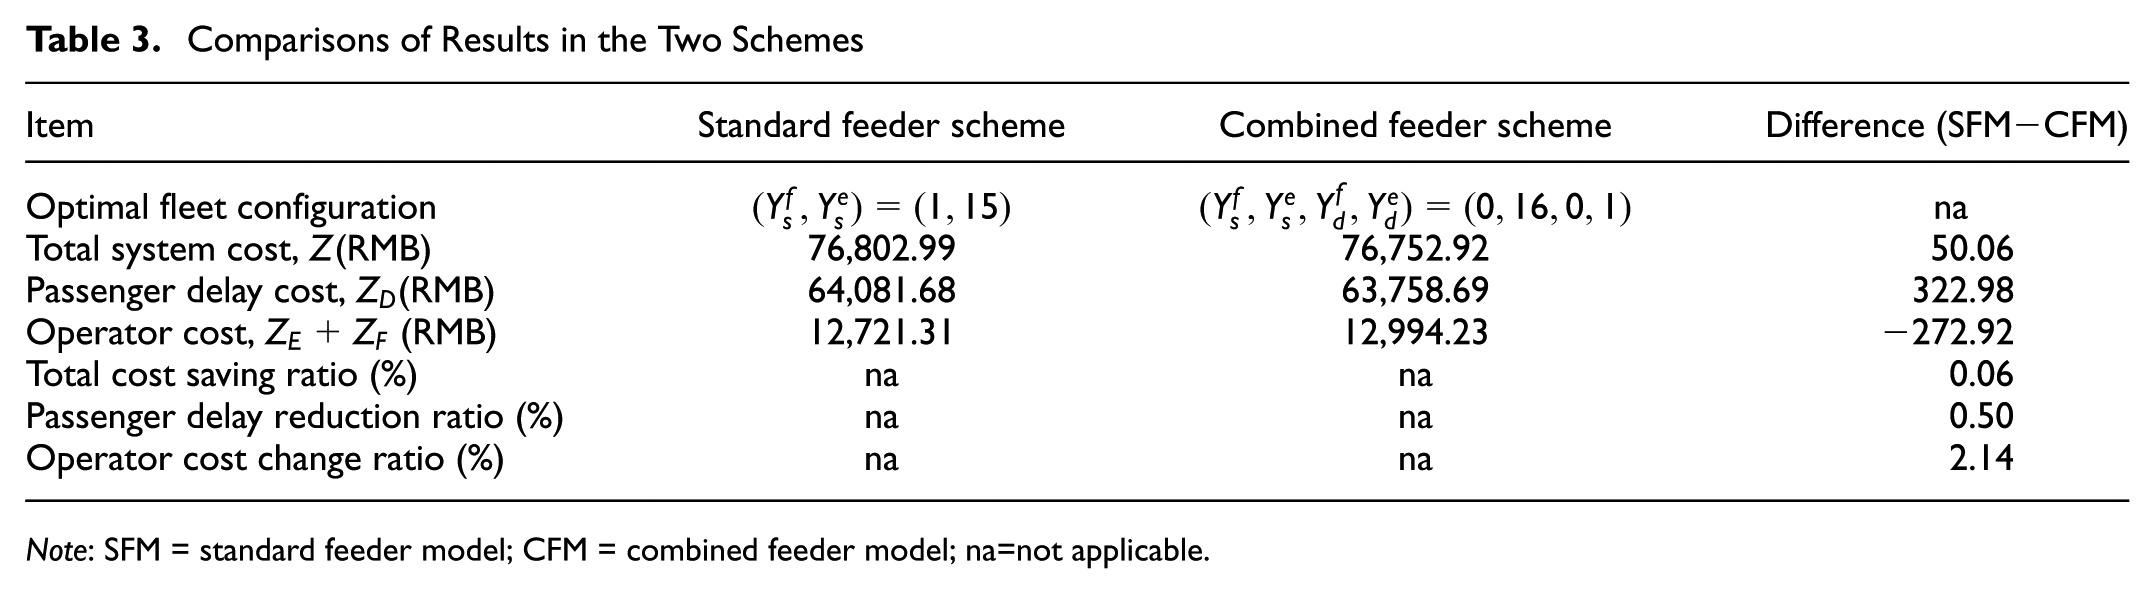
Note: SFM = standard feeder model; CFM = combined feeder model; na=not applicable.
Sensitivity Analysis
Research Purpose and Experimental Design
The case study shows that CFM reduces total system cost relative to SFM. However, this result depends on a specific OD structure and operating environment. A sensitivity analysis is therefore conducted to test robustness and external validity. All cost parameters, cruising speeds, and charging-queue assumptions remain fixed. Only demand patterns and key operational conditions vary. This design isolates when and why CFM outperforms SFM. The primary metric is the total system cost saving of CFM relative to SFM:

where indicates that CFM performs better.
To identify the origin of improvements, savings are decomposed into operator and passenger components:


where
The passenger contribution ratio is defined as

and
In the CFM, direct-service demand may exceed available capacity, in which case the unserved demand is reassigned to the standard feeder service. For diagnostic purposes in the sensitivity analysis, a binary indicator
To cover representative demand variations observed in emergency operations, five demand patterns are constructed based on the case study. These patterns are not intended to reproduce detailed real-world demand forecasts but instead provide prototypical abstractions of common OD spatial structures encountered during disruptions. Specifically, the five patterns correspond to: (1) a baseline demand structure, (2) relatively uniform and dispersed demand, (3) demand dominated by long-distance trips, (4) localized demand surges, and (5) strongly directional (asymmetric) demand.
The baseline pattern reflects a typical disruption under regular commuting conditions. The uniform pattern represents scenarios with dispersed demand and no dominant OD pairs. The long-distance pattern emphasizes increased cross-station or cross-district travel. The surge pattern captures concentrated evacuation demand around key stations or corridors over a short time period. The directional pattern corresponds to peak-period or one-sided evacuation scenarios. These patterns allow the role of direct services in improving travel times for critical OD pairs to be examined from multiple dimensions.
For each demand pattern, different operating conditions are further combined, including the disruption duration
Results and Discussion
Across all 90 experimental scenarios, the cost-saving indicator
As presented in Table 4, the magnitude of cost savings varies significantly across demand patterns. The largest improvements are observed in the Surge and Far-distance scenarios, with mean cost savings of RMB 657.29 and RMB 283.51, respectively. These scenarios are characterized by highly concentrated or long-distance demand structures, under which direct services can effectively reduce in-vehicle travel time for a large share of passengers. Moderate improvements are observed in the Directional and Base scenarios, while the Uniform scenario yields only marginal gains (RMB 3.30), indicating that when demand is evenly distributed, the advantage of introducing direct services is limited.
Overall Performance Comparison across Demand Patterns
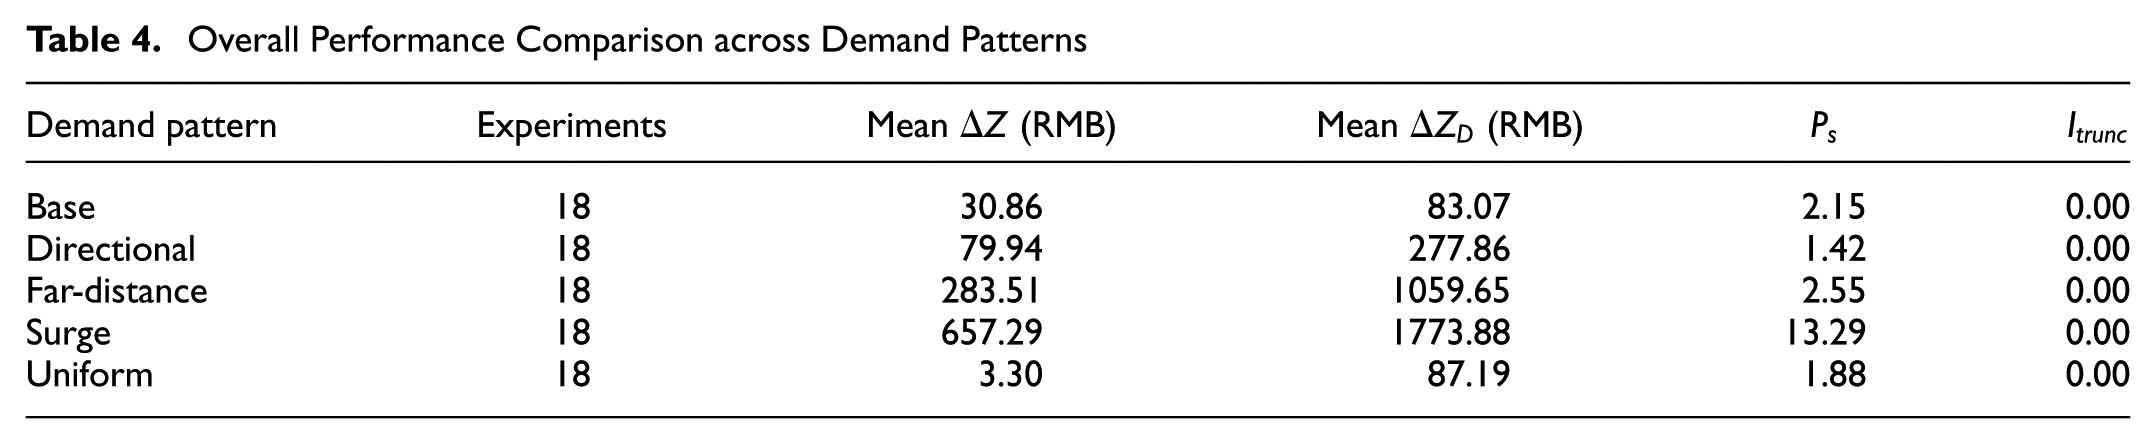
Overall, these results suggest that the effectiveness of the CFM is highly dependent on the spatial distribution of passenger demand. In particular, demand concentration and trip length play a critical role in determining the extent to which direct services can generate system-level benefits.
Further decomposition results are illustrated in Figure 7. The passenger contribution share
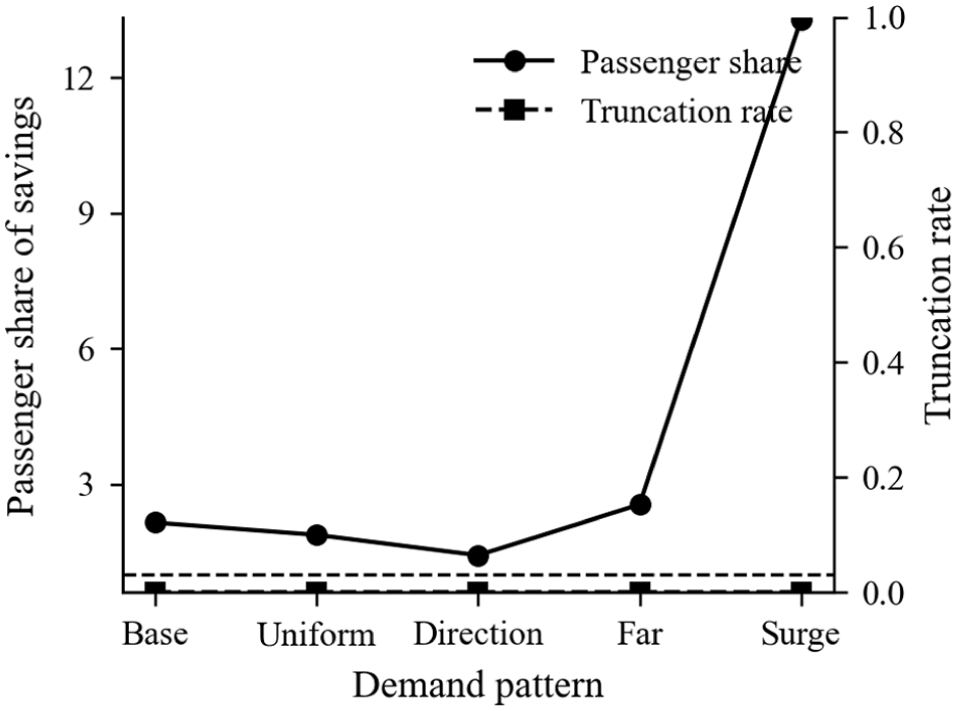
Passenger contribution share and truncation rate under different demand patterns.
The mean cost saving
Mean total system cost savings as a function of
The configuration of direct-service capacity plays an important role in determining the effectiveness of the CFM. As shown in Figure 9, the mean cost saving
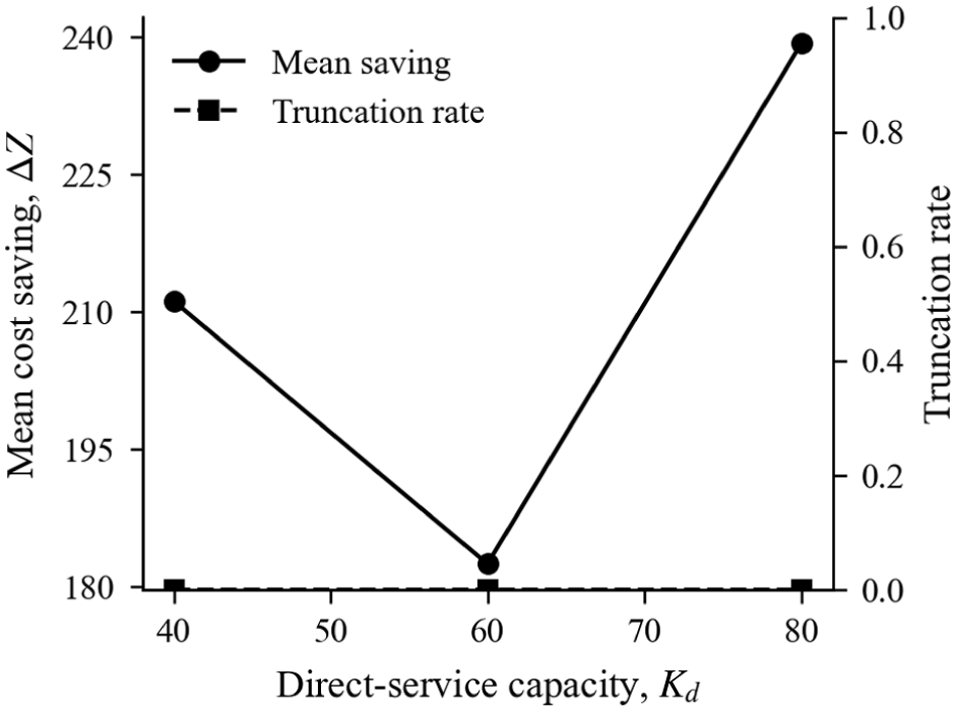
Mean total system cost savings and truncation rate under different
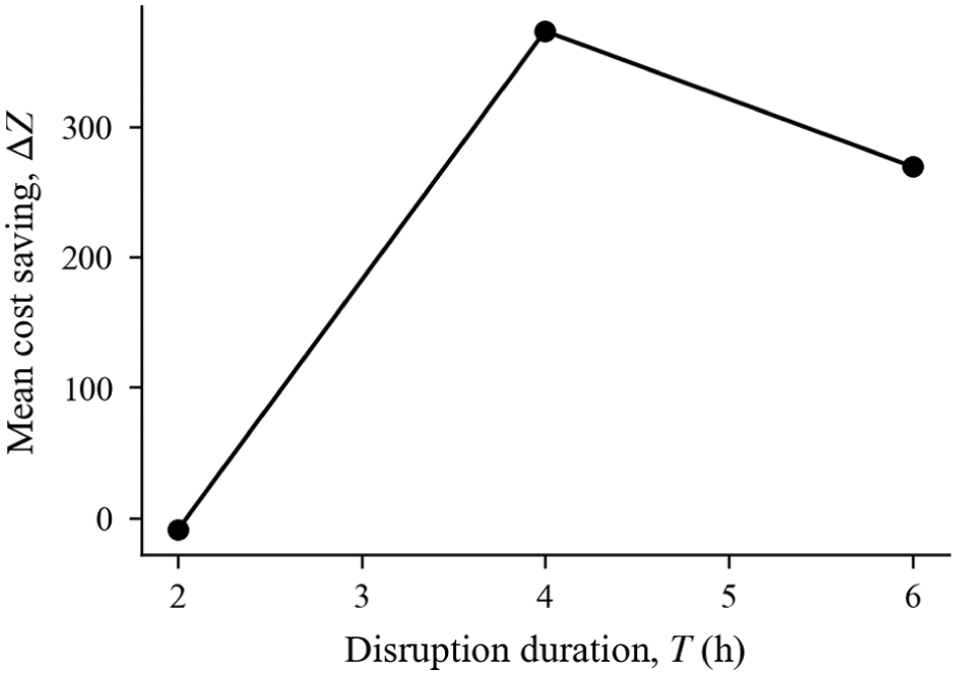
Figure 10 further illustrates the interaction between disruption duration
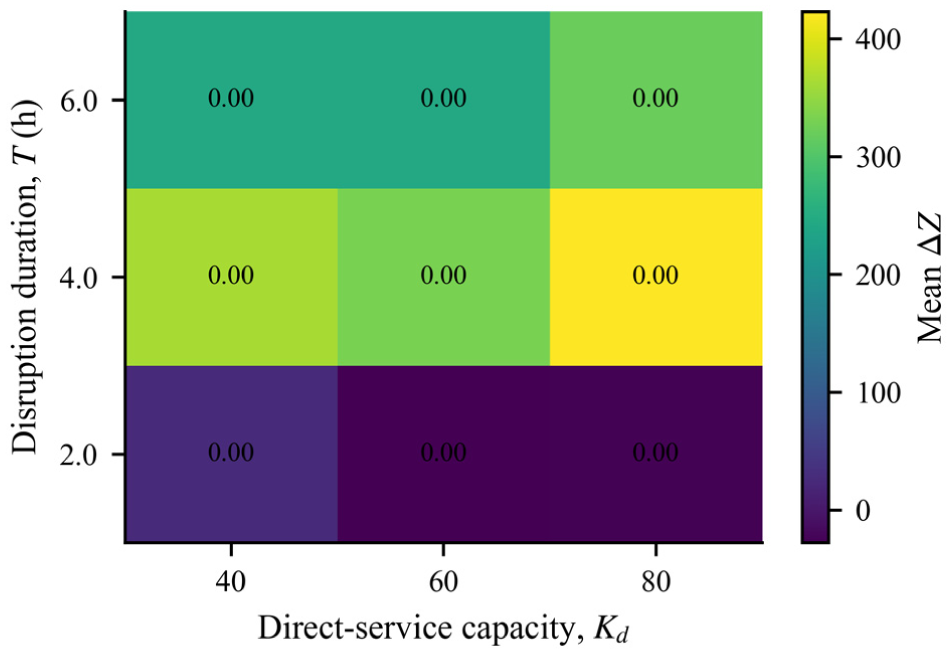
Interaction effects of
Finally, the availability of charging facilities for the standard route also affects the relative performance of the CFM. As shown in Table 5, increasing the number of chargers from
Sensitivity of Charging Facility Availability on Cost Savings
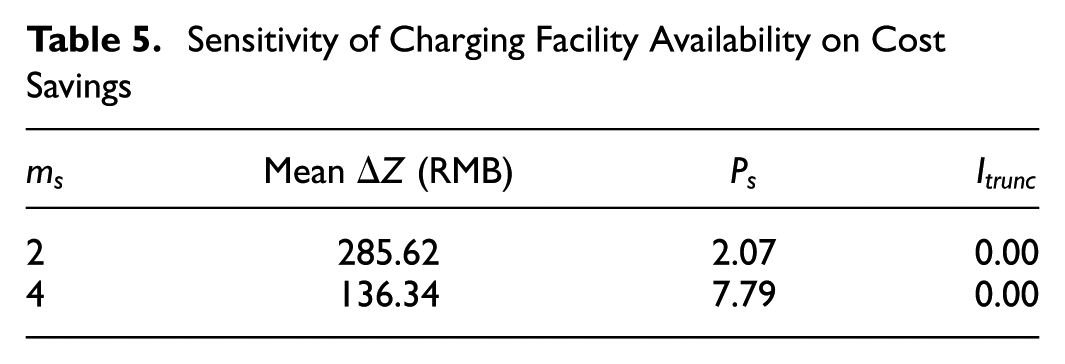
The sensitivity experiments reveal that the performance of the CFM is governed by the interplay between disruption duration, demand structure, and service capacity. In general, the benefits of direct services are primarily driven by their ability to reduce passenger travel time, particularly under conditions of concentrated demand or long-distance trips. These effects are most pronounced at intermediate disruption durations, where both capacity constraints and time-saving opportunities are jointly significant. As the disruption duration increases, the standard feeder service becomes more effective in absorbing demand through repeated service cycles, leading to diminishing marginal benefits of direct services. Similarly, improvements in baseline service capability—such as increased charging availability—reduce the relative advantage of introducing direct routes. The impact of direct-service capacity is more nuanced, with its effectiveness depending on the interaction with disruption duration rather than following a monotonic pattern. Across all scenarios, capacity truncation remains negligible, indicating that the observed performance differences are primarily driven by demand distribution and service configuration rather than binding capacity constraints. These findings suggest that the value of the CFM lies in its ability to target high-impact demand structures, thereby providing practical guidance for prioritizing fleet deployment in emergency response planning.
Conclusion
This study integrates EBs into emergency bus bridging services under metro disruptions through a mixed-fleet optimization framework that captures the operational characteristics of both EBs and DBs. We propose two feeder service models: the SFM, which provides all-stop feeder service, and the CFM, which supplements the standard feeder structure with direct services to alleviate localized passenger demand surges. The main contributions of this study are threefold: (1) a mixed-fleet optimization framework for emergency bus bridging that captures EB SOC constraints, charging requirements, and queueing effects, thereby enabling feasible coordination of DBs and EBs during disruptions; (2) a CFM that augments the standard feeder structure with targeted direct services to bypass bottlenecks and reduce passenger delay; and (3) a case study and sensitivity analysis that demonstrate the robustness of the proposed approach and provide practical guidance on the deployment of direct services and charging resources in emergency operations.
The case study results show that the CFM reduces total system cost from RMB 76,802.99 to 76,752.92 relative to the SFM. This net improvement is primarily driven by passenger-side benefits: passenger delay cost decreases by RMB 322.98, while operator cost increases by RMB 272.92. Extensive sensitivity analysis further shows that the advantage of the CFM is strongest under concentrated or long-distance demand and at intermediate disruption durations. By contrast, its relative benefit becomes smaller when demand is spatially diffuse, when the standard feeder service can absorb demand more effectively, or when charging availability for the standard feeder service is higher.
These findings indicate that targeted direct services can serve as a cost-effective supplement to standard emergency bus bridging operations. For transit agencies, this suggests that flexible fleet deployment should be prioritized for high-impact corridors during metro disruptions.
Future research should develop rolling-horizon charging and dispatch strategies, incorporate multienergy supply considerations, and explore more advanced optimization methods to improve system adaptability under extreme demand conditions, thereby further supporting the electrification of emergency transit services.
Footnotes
Author Contributions
The authors confirm contribution to this paper as follows: study conception and design: Sida Luo, Hong Ji; data collection: Shuyang Zhang, Chunfu Shao; analysis and interpretation of results: Sida Luo, Hong Ji, Shuyang Zhang; draft manuscript preparation: Hong Ji, Jinglu Niu. All authors reviewed the results and approved the final version of the manuscript.
Declaration of Conflicting Interests
The authors declared no potential conflicts of interest with respect to the research, authorship, and/or publication of this article.
Funding
The authors disclosed receipt of the following financial support for the research, authorship, and/or publication of this article: The research is supported by the National Natural Science Foundation of China (No. 72101017 and No. 72001162), and the Key Research and Development Program of Hubei Province (No. 2023BAB076).
Data Accessibility Statement
The data that support the findings of this study are available from the corresponding author on reasonable request.