
Abstract
Metropolitan areas are nowadays facing rapid growth and technological transformation, thereby creating complex challenges concerning the adoption of sustainable passenger and freight mobility technologies. Current evaluation frameworks typically address attributes of urban transport separately, focusing narrowly on specific modes, technologies, or sustainability dimensions. This study establishes the Sustainable Mobility Readiness Index (SMRI), an innovative and comprehensive framework that is designed to evaluate the preparedness of metropolitan areas concerning the adoption of sustainable, inclusive, and innovation-driven mobility systems. The SMRI integrates six key dimensions (transport supply, transport demand, innovation, policy, finance, and environment and energy) captured through 64 indicators, while also emphasizing the dual importance of passenger and freight transport readiness. Further, it applies a structured, multistage methodology incorporating expert-informed weighting, normalized scoring, and sensitivity analysis to assess 26 global metropolitan areas. Therefore, the SMRI addresses notable gaps in current literature by showcasing a geographically adaptable, interdisciplinary, and data-driven benchmarking tool. Results indicate a significant variance in readiness levels across cities and underline opportunities for peer learning and targeted investment. In addition, the study portrays a typology of metropolitan areas (mature, emerging, and developing) based on context-specific characteristics and performance patterns. While the SMRI offers a robust basis for evidence-based policymaking, it also acknowledges data limitations and identifies opportunities for future development of new mobility technologies, including spatial analysis and the incorporation of equity and accessibility metrics. As metropolitan mobility systems continue to evolve, the SMRI provides a timely contribution to the planning and policy analysis of sustainable transport transitions worldwide.
Keywords
Introduction
Metropolitan areas around the world are facing unprecedented growth and transformation, thereby reshaping mobility ecosystems ( 1 ). Unlike urban areas characterized by dense city cores, metropolitan areas have diverse geographies such as city centers, suburban areas (lower-density residential areas surrounding the urban core), and peri-urban zones (transitional areas located between suburban environments and rural territories). While integrated transport networks benefit city centers more, outer zones typically experience fragmented services, limited accessibility, and longer commute times, including freight and logistics. Rapid urbanization poses mobility challenges, requiring strategic planning and innovative solutions tailored to the spatial and functional diversity of metropolitan areas ( 2 ). The capability that metropolitan areas have in relation to providing efficient, sustainable, and equitable passenger and freight transport systems is critical to achieve their economic vitality, social wellbeing, and environmental health ( 3 ). The dynamic nature of mobility, encompassing emerging passenger and freight services, necessitates a holistic and interdisciplinary framework to evaluate how metropolitan areas adapt to rapid technological revolutions in transport. This paper presents the Sustainable Mobility Readiness Index (SMRI), a novel framework to evaluate and benchmark how prepared metropolitan areas are to meet the growing and diverse demands of sustainable mobility systems. Unlike existing indices, SMRI integrates both passenger and freight mobility, capturing a full range of readiness including infrastructure, services, innovation, energy, and environmental dimensions.
Traditional transport planning focused primarily on infrastructure development and traffic management ( 4 ). Nevertheless, because of the urban growth and transformation, nowadays, mobility involves diverse transport modes, emerging technologies, and changing user behaviors ( 5 ). Moreover, the integration of new mobility services such as micromobility and ride-sharing services ( 6 , 7 ), the rise of connected and autonomous vehicles (CAVs) ( 8 ), and the growing emphasis on sustainability require cities to adopt a more comprehensive perspective ( 9 ). This paper discusses that a robust, easy-to-use, and easy-to-understand index is essential to assess and compare metropolitan areas’ readiness. Further, the SMRI provides a valuable tool for policymakers, urban and transport planners and researchers to evaluate the strengths and weaknesses of different metropolitan areas, thereby identifying best practices and what works best, while also monitoring their progress dynamically over time. In addition, by adopting this approach, it can ensure that the SMRI can support evidence-based decision-making by understanding the nexus between transport, technology, and urban planning to support sustainable transport strategies.
The concept of sustainable passenger mobility and logistics has evolved significantly over the past few decades ( 10 ) and some aspects of it were implemented in the cities in the form of sustainable urban mobility plans (SUMPs) ( 11 ) and sustainable urban logistics plans (SULPs) ( 12 , 13 ). Early studies focused on environmental sustainability, particularly reducing greenhouse gas emissions and transport-related air pollution ( 14 ). Nevertheless, comprehending sustainable mobility has been widened with the goal of embracing the economic and social dimensions as well ( 15 ). Recent studies on sustainable urban mobility identify the value of balancing the dimensions of environmental protection with economic development and social equity ( 16 ). Particularly, ensuring that every member of the society has access to affordable and reliable transport means, which highlights the effective use of resources, thereby achieving economic growth with the effective movement of people and goods.
Innovation also plays a key role in shaping sustainable urban mobility and logistics. The advent of technology, such as the development of electric vehicles and bikes, CAVs, shared mobility services and intelligent transport systems ( 17 , 5 ), can revolutionize today’s transport by improving the efficiency, safety, and sustainability of urban transport. Studies highlight the significance of technological readiness, data openness, and the adoption of new mobility solutions in enhancing urban transport systems ( 18 ). Mobility as a Service (MaaS) constitutes a transformative paradigm that integrates different transport modes and mobility services within a user-centric system ( 19 ). The shift toward user-centric systems can integrate diverse services into single platforms or apps ( 20 ). Several indices and frameworks have emerged in recent years to assess cities’ readiness for mobility transitions. However, many of them vary significantly in relation to scope, thematic focus, and methodological depth:
Mobility Maturity Index (MMI) is designed to evaluate the readiness of cities for implementing MaaS solutions, focusing on five key dimensions: transport operators’ data sharing, citizen willingness, policy and regulation, ICT infrastructure, and transport services availability ( 18 ).
Urban Mobility Readiness Index (2024 Edition) provides a global benchmarking tool for assessing the mobility readiness of 84 cities. It is structured around five pillars: infrastructure, innovation, system efficiency, market attractiveness, and social impact ( 21 ).
Mobility Readiness Index—KPMG (Mobility 2030 Series) evaluates urban areas’ preparedness for MaaS across five domains: shared mobility, micromobility, electric mobility, public transport, and digital penetration ( 22 ).
Global Mobility Index (GMI)—MIT Senseable City Lab uses large-scale digital trace data, such as mobile phone and GPS signals, to analyze spatial-temporal travel patterns and mobility flows within urban environments ( 23 ).
Urban Mobility Innovation Index (UMii) assesses cities’ capacity to foster innovation through dimensions such as governance, funding mechanisms, partnerships, and enabling environments ( 24 ).
Global Urban Mobility Indicators (GUMI) benchmarks public transport performance across 46 cities using 27 indicators related to affordability, accessibility, automation, and sustainability ( 25 ).
Sustainable Cities Mobility Index assesses urban mobility across 23 indicators grouped under three pillars—people, planet, and profit—to evaluate inclusivity, environmental impact, and economic sustainability ( 26 ).
Mobility as a Service Inclusion Index (MaaSINI) evaluates the inclusivity of MaaS systems, examining their accessibility across various user groups and proposing policy recommendations to address digital, physical, and financial barriers ( 27 ).
While these frameworks offer important insights, they also reveal critical limitations that highlight the need for further development in the field. Many existing indices are thematically narrow, focusing predominantly on single dimensions of mobility. For instance, the MMI focuses solely on MaaS readiness and was applied only to London and Birmingham. Similarly, the GMI emphasizes descriptive analytics based on behavioral mobility data, but does not include a structured evaluation of governance, infrastructure, or sustainability systems. The UMii centers on institutional innovation capacity but omits performance-based metrics related to service integration or environmental outcomes. In addition, the GUMI dataset, while comprehensive in benchmarking, does not offer a composite index or multidimensional readiness assessment. The MaaSINI provides valuable emphasis on inclusivity, but it is limited to MaaS-specific systems and does not assess broader mobility readiness.
Even broader frameworks, such as the Urban Mobility Readiness Index and the Sustainable Cities Mobility Index, omit key layers of contemporary urban mobility, such as MaaS integration, freight logistics, and platform-based service ecosystems. Moreover, very few indices holistically incorporate all three pillars of sustainability—environmental, economic, and social. The economic and social dimensions, particularly affordability, accessibility, and equity, are often underrepresented. Finally, current frameworks tend to lag in their ability to capture technological evolution and anticipate the integration of emerging trends such as CAVs, shared electric mobility, and real-time mobility platforms.
Considering these gaps, the SMRI seeks to offer a more comprehensive, interdisciplinary, and adaptable framework. It integrates multiple layers of mobility readiness—including MaaS, logistics, micromobility, public transport, and innovation ecosystems—while maintaining a balance across sustainability’s environmental, economic, and social pillars. The SMRI also considers a city’s institutional capacity to absorb and adapt to emerging technologies, while also capturing the environmental, economic, and social dimensions of sustainable mobility. The objectives of the paper are to: a) validate the theoretical and methodological development of the SMRI, b) discuss its key indicators, and c) demonstrate its application in evaluating urban mobility readiness in global cities, supporting knowledge transfer to other areas.
Methods
The Index Framework
The SMRI was constructed following a structured, multistep and peer-reviewed methodology adapted from established index-building approaches (Figure 1). Drawing from the MaaS Maturity Index proposed by Kamargianni and Goulding ( 18 ), the SMRI evaluates metropolitan areas’ preparedness for sustainable and innovative mobility.
Methodological framework of sustainable mobility readiness index.
The methodology used to construct the SMRI consists of 12 steps (Figure 1) that are grouped into six phases (each phase is represented by a different colour in Figure 1) and are detailed in the following sections.
Define the Concept
The first step involves defining the concept that the SMRI aims to measure. Sustainable mobility is a multidimensional and evolving construct that reflects a metropolitan area’s capacity to transition toward environmentally, socially, and economically responsible transport systems. It encompasses not only travel behavior and infrastructure, but also governance, technology, and resource management. Based on established research and best practices, six core aspects are considered central to this concept:
Modal Availability and Integration. A sustainable urban mobility system requires diverse, accessible, and integrated transport options. This includes not only public transport and active modes, but also shared services, MaaS, and urban logistics solutions. These modes must be spatially and socially inclusive to reduce private vehicle dependency and increase system resilience ( 28 ).
Digital Readiness and Innovation Capacity. Digital infrastructure and data systems are foundational for enabling real-time services, platform integration, and intelligent mobility management. Technological readiness underpins the deployment of smart mobility solutions, supports behavioral change, and facilitates sustainable operations ( 18 ).
Society’s Travel Behavior and Demand Characteristics. Sustainable mobility is not only about the supply of infrastructure but also about user engagement and demand-side choices. Modal split, car ownership, road safety, and affordability all reflect how individuals interact with the system. Understanding these patterns is essential to designing policies that promote behavioral transitions ( 29 ).
Policy and Planning Frameworks. The governance of urban mobility—through strategic planning, regulation, and participatory processes—plays a central role in steering sustainable outcomes. Tools such as SUMPs and SULPs align transport objectives with spatial planning and stakeholder inclusion ( 30 ).
Financial Sustainability. The ability to fund, maintain, and expand sustainable mobility services is fundamental. This includes not only public investment and subsidization, but also the creation of institutional mechanisms that enable long-term financial planning and private sector engagement ( 31 ).
Energy and Environmental Transitions. Sustainable mobility systems must reduce their carbon footprint and environmental impact. This includes a shift toward cleaner fuels, electrification, energy efficiency, and climate resilience. Transport-related emissions and renewable energy integration serve as key indicators of environmental readiness ( 17 ).
Design of the Framework
The second step in the construction of the SMRI involves the design of a theoretical framework that defines the key dimensions of sustainable mobility and organizes them into logical and analytically coherent groups. This framework serves as a conceptual blueprint, ensuring that the indicators selected in the following step are both meaningful and aligned with the multidimensional nature of urban sustainable mobility.
Drawing on composite indicator construction methodologies ( 32 ), relevant policy frameworks ( 30 ), and academic literature ( 33 ), six core dimensions were identified:
Transport Supply refers to the availability, accessibility, and coverage of public transport and multimodal infrastructure.
Transport Demand encompasses mobility behaviors, usage patterns, and modal choices of urban residents.
Innovation captures the extent to which cities integrate digital technologies, data systems, and emerging mobility solutions such as MaaS.
Policies reflect the presence and scope of strategic planning documents, regulatory mechanisms, and institutional governance structures.
Finance assesses the adequacy and orientation of funding for sustainable mobility initiatives, including public investment and financial incentives.
Environment and Energy addresses environmental sustainability and clean energy integration within urban mobility systems.
Each of these dimensions is further disaggregated into thematic groups to facilitate a structured approach to indicator selection. For instance, Transport Supply includes the groups “Modes Availability, Coverage & Usage” and “Infrastructure,”Innovation is composed of “Data,”“Technologies,” and “Connectivity,” and Finance consists of “Subsidization” and “Investment.” These groupings serve as intermediate layers between the broad dimensions and the specific indicators introduced in the next step.
Indicator Development
Selection of Indicators
The third step involves selecting measurable indicators to operationalize the theoretical framework. These indicators are assigned to thematic groups within the six dimensions of the SMRI, enabling a multidimensional evaluation of sustainable urban mobility. The aim is to capture both qualitative and quantitative characteristics of mobility systems across metropolitan areas in a structured and comparable manner.
The indicator selection process followed a structured and iterative approach, drawing from a range of sources to ensure both scientific robustness and practical relevance. This included an extensive review of academic literature and applied research on sustainable mobility metrics ( 33 , 34 ), as well as international guidelines and composite indicator frameworks ( 30 , 31 ). Furthermore, the process was informed by consultations with experts from academia, transport authorities, and mobility consulting teams, including urban mobility researchers, transport planners, and data practitioners. Their expertise in sustainable mobility planning, transport innovation, and mobility data systems helped ensure that the selected indicators reflect both theoretical robustness and real-world applicability. Experts from industry, including mobility consulting teams from PricewaterhouseCoopers (PwC), also contributed to the consultation process by providing practical insights from applied mobility projects and metropolitan transport analyses. In addition, PwC supported the development of the research through project collaboration and funding contributions. Table 1 summarizes the professional background and areas of expertise of the consulted experts.
Profile of Experts Consulted for Indicator Selection
Note: MaaS = Mobility as a Service; SUMP = sustainable urban mobility plan; PwC = PricewaterhouseCoopers.
A set of criteria was applied to guide the inclusion of indicators. First, relevance was critical—each indicator had to meaningfully reflect a distinct aspect of the dimension it represents. Second, data availability with priority given to indicators with consistent metropolitan-level data across multiple geographic contexts. Importantly, indicators were also chosen with practical implementation in mind—the aim was to develop a framework that could be calculated with reasonable effort and without requiring extensive new data collection or high-resource inputs. Third, comparability was considered essential, with indicators selected based on the use of standardized definitions and methodologies to ensure consistency across metropolitan areas.
In total, 64 indicators were selected and distributed across the six dimensions and their respective thematic groups. A complete overview of these indicators, along with their corresponding thematic groups, descriptions and units of measurement are presented in Table 2.
Sustainable Mobility Readiness Index Dimensions, Groups, and Key Indicators with Noted Importance
Note: MaaS = Mobility as a Service; SUMP = sustainable urban mobility plan; EV = electric vehicle; CAV = connected and autonomous vehicles; SULP = sustainable urban logistics plans; API = application program interface.
Data Strategy
Data Collection
Following the definition of indicators, the next step involves gathering the corresponding data through a structured and methodologically sound collection process. The SMRI was applied to 26 metropolitan areas (Figure 2). Ensuring the quality, consistency, and comparability of data is essential for the SMRI’s reliability and applicability across diverse urban contexts.
Geographic distribution of the 26 assessed metropolitan areas in the Sustainable Mobility Readiness Index.
Data were sourced from recognized, transparent platforms such as international statistical agencies, national data portals, commercial mobility platforms, and open repositories. For European cities, primary data were collected from Eurostat and EU-level services. For international coverage, sources included the World Bank, the Organization for Economic Co-operation and Development (OECD), and the US Energy Information Administration for US cities. Traffic flow, congestion, and infrastructure data were obtained from platforms such as TomTom and OpenStreetMap, while spatial datasets, including GIS shapefiles, were retrieved from open government portals and national geospatial repositories.
In cases where standardized or open-access data were lacking, supplementary sources such as academic literature, news media, industry reports, and company websites were used selectively. For indicators requiring local-level specificity, data were obtained directly from municipal authorities or official city websites. If no open or standardized source was available for a specific indicator, PwC offices in the corresponding world regions contacted local authorities to obtain the required metropolitan-level data. When these data could not be provided, we used a proxy derived from nationally reported statistics that reflected the same conceptual dimension. Proxy use was limited and applied consistently to maintain comparability across cities.
Validation of Sources
Once data collection was completed, all sources underwent a validation process to ensure their credibility and relevance. Priority was given to sources from official government agencies, reputable international organizations, and recognized academic institutions, known for adhering to established statistical standards. The recency of data was also reviewed, with a preference for data within a five-year window. Older data were used only when necessary and documented for transparency, strengthening the index’s reliability and allowing meaningful comparisons across cities and time.
Data Conversion
To ensure internal consistency and enable cross-city comparability, all collected data were converted into standardized units of measurement. This step addresses variations in how different metropolitan areas or countries report data and is essential for maintaining the methodological integrity of the index.
Quantitative values were harmonized according to international conventions and measurement systems. For instance, physical quantities such as distance or area were standardized into metric units, while financial values were converted into a common currency using exchange rates applicable to a consistent reference year. Where necessary, normalization factors were applied to adjust for population size, geographic extent, or other structural differences. This process followed guidance from composite indicator methodologies ( 31 ) and ensured that all indicators are expressed on a comparable scale.
Comparison among Metropolitan Areas
An initial comparative analysis was conducted to examine the distribution and range of values for each indicator across the selected metropolitan areas. This empirical step was essential for identifying the minimum and maximum values used in the scoring process and for revealing key patterns in urban mobility performance. The comparison exposed meaningful variation across metropolitan areas in areas such as public transport coverage, cycling infrastructure, modal split, policy frameworks, and environmental impact.
This step provides an empirical foundation for interpreting differences in city performance, highlights potential outliers, and supports the construction of a robust and equitable index. Understanding the full range of values also allows for the identification of regional patterns or gaps in specific dimensions of sustainable mobility, which are addressed in subsequent steps of the index development process.
Scoring and Normalization
Conversion to Likert Scale
To enable cross-indicator comparability and facilitate aggregation, all indicator values were transformed into a unified Likert-type scale ranging from 0 to 10. This scoring system standardizes diverse indicators into a common evaluative format that reflects each city’s relative performance.
The conversion process followed a data-driven min–max linear transformation approach. For each indicator, the minimum and maximum values observed across all metropolitan areas were identified, and the total range was divided into 11 equal intervals, corresponding to Likert scores from 0 (lowest performance) to 10 (highest performance). Each city was assigned a score based on the interval in which its value fell.
For positively oriented indicators—those for which higher values represent better outcomes (e.g., availability of sustainable infrastructure)— metropolitan areas with the highest values received a score of 10, and those with the lowest values received a score of 0. For negatively oriented indicators—those for which lower values represent better performance (e.g., CO2 emissions, congestion levels)—the scale was inverted so that lower values corresponded to higher scores.
This transformation enables easier comparison of metropolitan areas on a common scale but does not address variations in the distribution of values across indicators. Therefore, normalization will be performed in the subsequent step to ensure full comparability.
Normalization of Values
After converting indicator values to a 0–10 Likert scale, a final normalization step was applied to ensure all indicators are fully comparable and contribute equally to the construction of the index. While the Likert transformation standardizes the score range, it does not account for differing distributions across indicators, making normalization necessary for meaningful aggregation across thematic groups and dimensions.
The min–max normalization method was used to rescale each indicator’s values to a fixed range of [0,1], preserving the relative distances between observations while eliminating scale differences. The normalization was applied across all metropolitan areas for each individual indicator using the following formula indicated in Equation 1:

where x is the original value of the indicator (in Likert form), min(x) and max(x) represent the minimum and maximum values of the indicator across all metropolitan areas, and x′ is the normalized value, ranging from 0 (lowest observed performance) to 1 (highest observed performance).
This method ensures proportional contribution from each indicator, preventing any from disproportionately affecting the final score because of scale differences. Min–max normalization is commonly used in composite index construction for its simplicity and effectiveness ( 31 ).
Weighting and Aggregation
Weighting
Weighting is a fundamental step in the construction of the SMRI, as it determines the relative influence of each indicator on the final composite score. Recognizing that not all indicators contribute equally to assessing sustainable mobility readiness, a budget allocation (BAL) method was applied to assign differentiated weights.
To apply the BAL method, we engaged subject-matter experts from each metropolitan area included in the study, typically one to three per city. These experts represented a mix of professional backgrounds, including staff from transport authorities, academics with specialization in sustainable mobility and transport innovation, and practitioners from PwC offices worldwide with operational experience in mobility and urban transition projects. Each expert independently assigned importance values to the indicators on a continuous 0–1 scale, reflecting their assessment of the relevance of each metric to sustainability and MaaS readiness. The individual assessments were then averaged to produce consolidated weights. Indicators considered central to promoting low-carbon, equitable, and integrated mobility systems were assigned higher weights, while those reflecting complementary or context-specific aspects received proportionally lower values.
The use of expert-driven weighting allows the index to reflect not only the structure of the theoretical framework, but also normative priorities embedded in current policy and research. This method ensures that the SMRI is not a simple aggregation of available data, but a conceptually grounded and policy-relevant tool. The BAL method is widely accepted in composite indicator development for its transparency and flexibility ( 32 ) and was well suited to the dual emphasis of the SMRI.
Aggregation
The final step in the construction of the SMRI is the aggregation of the normalized and weighted indicator values. Aggregation was performed in a hierarchical manner to preserve the conceptual structure of the index and ensure that all dimensions are proportionately represented.
First, the weighted and normalized indicators within each group were aggregated to produce dimension-level scores, reflecting performance in six core areas: transport supply, transport demand, innovation, policies, finance, and environment and energy. Subsequently, the dimension scores were aggregated to calculate the overall SMRI score for each city. This two-tiered approach ensures internal consistency and transparency in how individual indicators influence the final score. Additive aggregation was used to combine values, as outlined in the OECD composite indicator methodology ( 31 ). This method ensures that strong performance in one dimension can partially offset weaker performance in another, while still highlighting differences in underlying strengths across metropolitan areas.
Index Validation
Validation and Sensitivity Analysis
Following the construction of the SMRI, a validation and sensitivity analysis was conducted to assess its robustness, reliability, and policy relevance. Figure 3 visually represents the performance of the 26 evaluated cities, mapped through an interactive web-based tool. Validation involved comparing SMRI scores with external datasets, established benchmarks, and observed urban mobility trends to ensure consistency with city-level characteristics and performance trajectories.
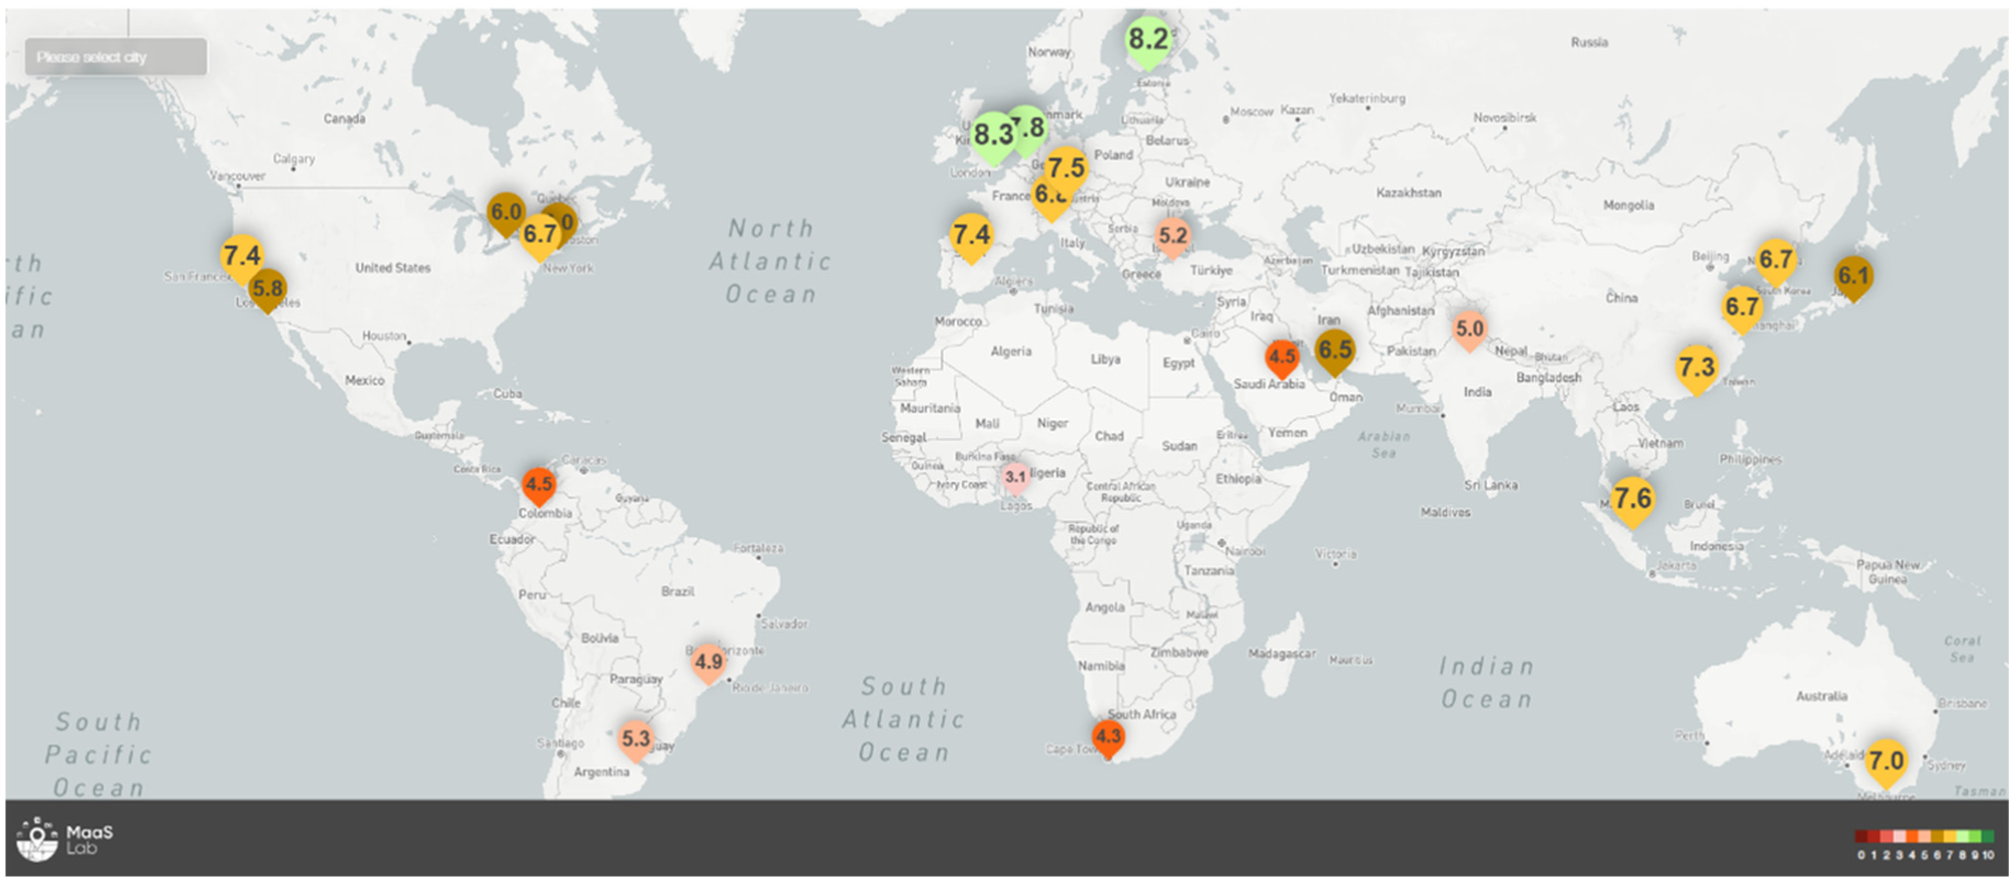
Global map of Sustainable Mobility Readiness Index scores across 26 metropolitan areas as visualized on the web-based tool.
To assess the index’s responsiveness to real-world developments, a sensitivity analysis was conducted using planned or recent interventions in selected cities. This analysis tested the impact of new policies or infrastructure expansions on the index. For example, the opening of a metro line in Riyadh was used to estimate its effect on public transport indicators, while scenarios involving multimodal public transport investments, bicycle lane expansions, low-emission zones, and the integration of emerging technologies (e.g., CAVs, electric vehicles [EVs], e-bikes, e-scooters) were also analyzed.
This scenario-based approach demonstrated the SMRI’s ability to reflect policy shifts and mobility transitions. Results confirmed that the index is sensitive to significant improvements across relevant dimensions, yet stable under minor fluctuations, reinforcing its robustness and practicality for assessing sustainable mobility readiness in both current and future policy contexts ( 38 ).
Results
Overall Results
This section presents the results of the SMRI applied to 26 global metropolitan areas. The index captures performance across six dimensions, based on a set of normalized and weighted indicators aggregated into both dimension-level and overall scores. These results offer a comparative view of metropolitan areas’ preparedness to advance sustainable, inclusive, and digitally integrated mobility systems. Figure 4 provides a detailed summary of the SMRI outcomes, displaying both overall scores and scores by dimension for each city. The results reveal substantial variation in mobility readiness across urban contexts, not only in aggregate performance but also in the distribution of strengths and weaknesses across the six dimensions.
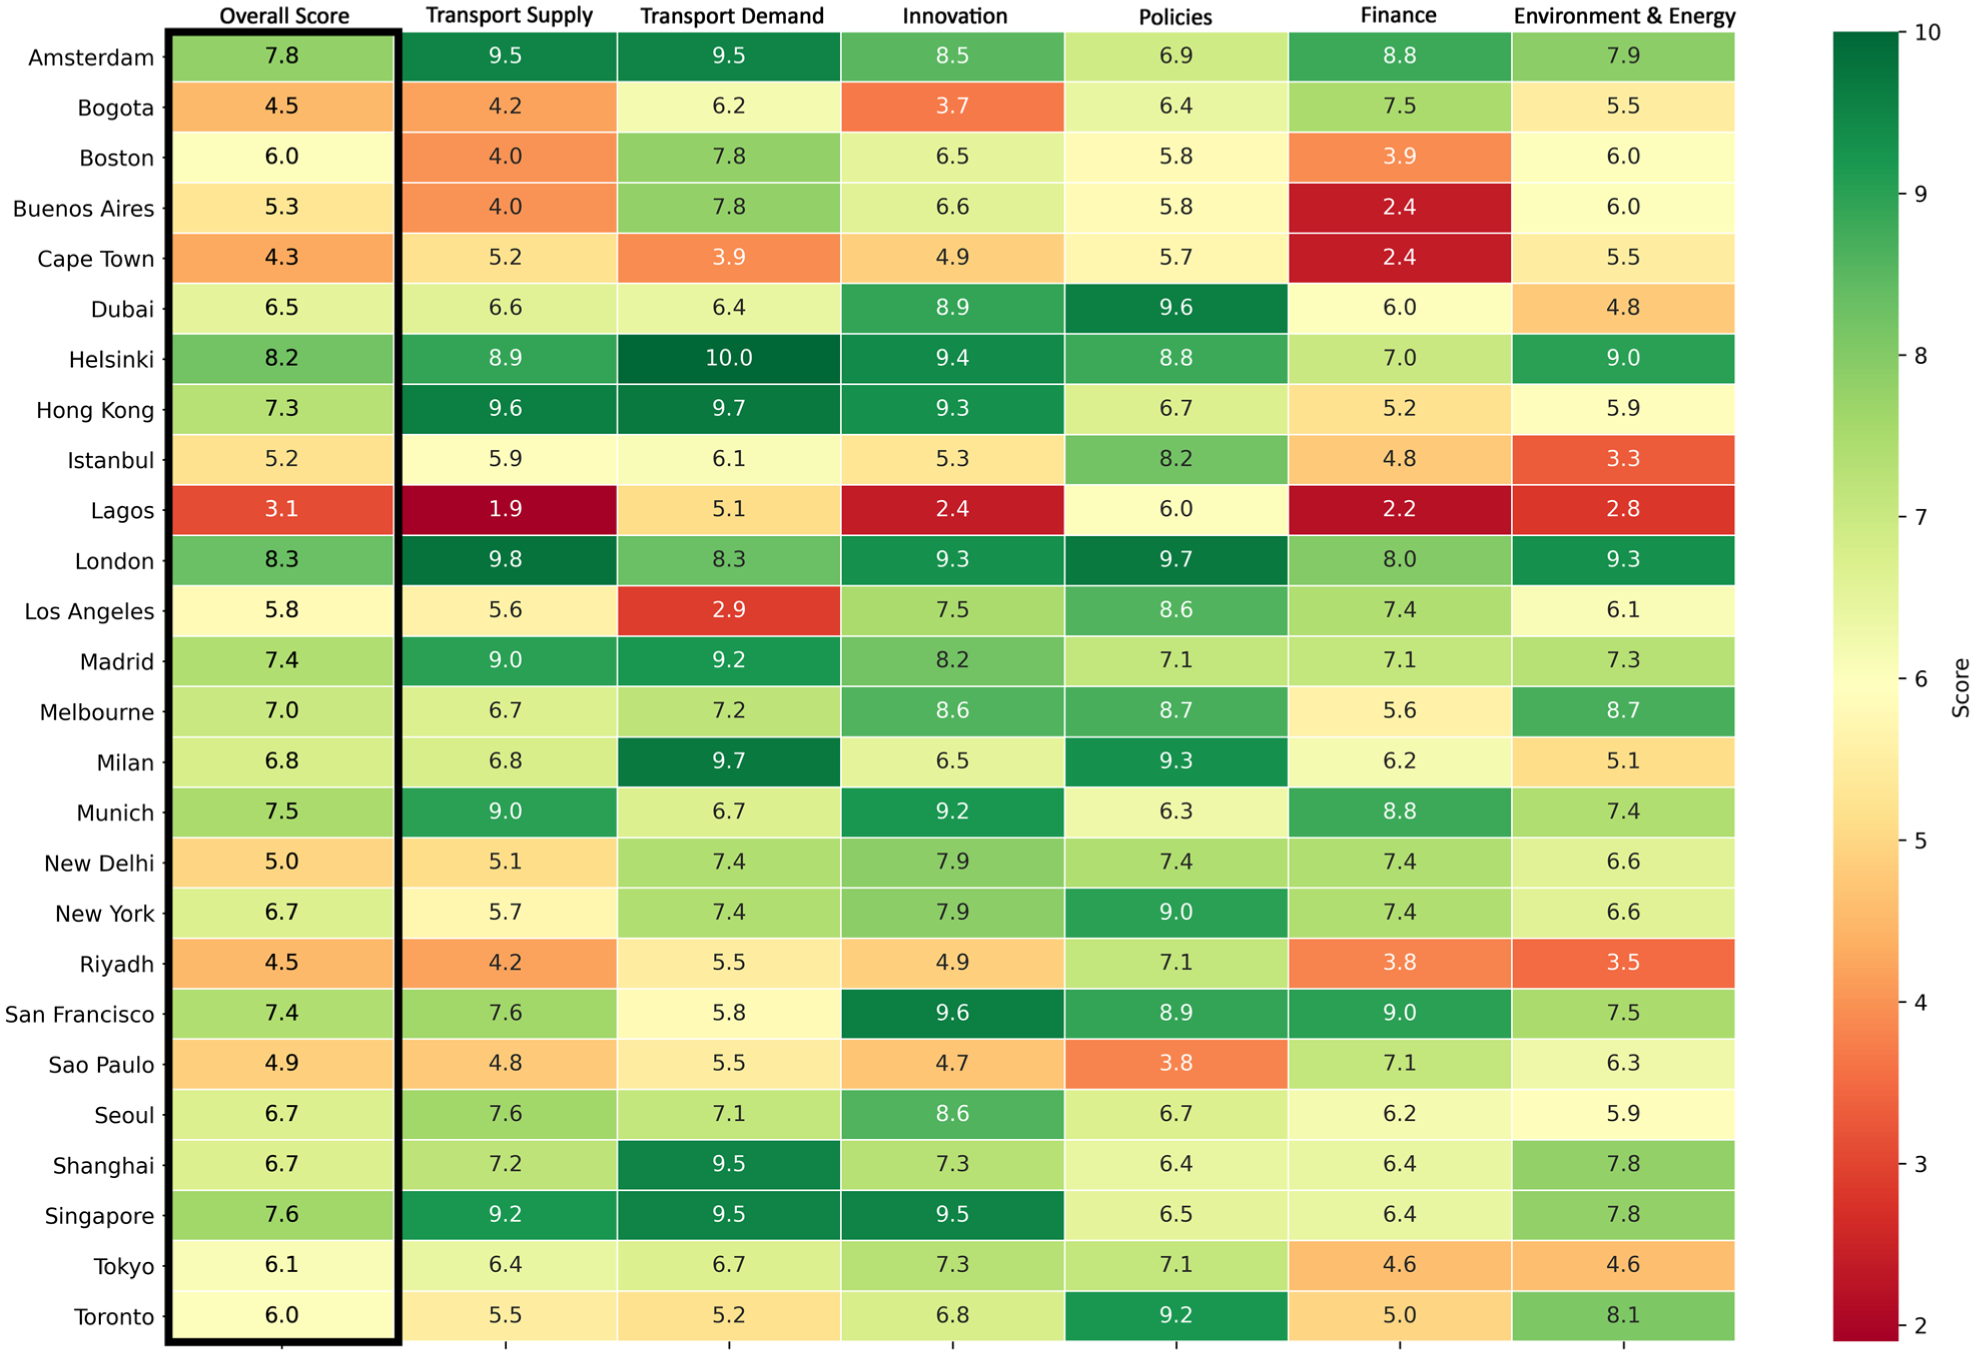
Heatmap of Sustainable Mobility Readiness Index overall and dimension scores across 26 metropolitan areas.
As an external validity check, we compared SMRI outcomes with the results of similar mobility indices, such as the Urban Mobility Readiness Index and the Arcadis Sustainable Cities Mobility Index. The general patterns align. Metropolitan areas with high SMRI scores, such as London, Helsinki, Amsterdam, Singapore, and Munich, also rank toward the top of these established benchmarks, while cities with lower SMRI values, including Bogotá, São Paulo, Buenos Aires, Cape Town, and Lagos, consistently appear in their lower tiers. Differences in exact ranks are expected because the SMRI evaluates the entire metropolitan region, including suburban and peri-urban areas, whereas many existing indices assess only the city core. This broader spatial focus, together with the inclusion of freight, environmental, and energy indicators, explains some divergence while still supporting the robustness of the SMRI’s comparative findings. These comparisons, together with the detailed scores shown in Figure 4, allow readers to directly identify both top-performing and lower-performing metropolitan areas across the SMRI dimensions. In the heatmap, darker green tones indicate higher readiness scores, while orange and red tones represent lower performance levels across the SMRI dimensions.
For example, London records the highest overall SMRI score (8.3), reflecting strong performance across multiple dimensions, including transport supply, innovation, and policy frameworks supporting sustainable mobility. Other metropolitan areas such as Helsinki (8.2) and Amsterdam (7.8) also rank among the highest-performing cities, demonstrating consistently high readiness across infrastructure provision, digital mobility services, and environmental policy frameworks.
In contrast, metropolitan areas such as Cape Town (4.3) and Lagos (3.1) record some of the lowest overall SMRI scores, indicating lower readiness across several dimensions of the framework. In the case of Lagos, particularly low scores are observed in the transport supply, innovation, and finance dimensions, reflecting limited infrastructure coverage, lower levels of technological adoption, and restricted financial support for sustainable mobility initiatives.
Results Based on Metropolitan Areas’ Archetypes
To contextualize these results, the metropolitan areas were grouped into three archetypes—mature, emerging, and developing—based on structural characteristics, such as GDP per capita, population density, city size, and public transport maturity, following the typology proposed by PwC Middle East ( 39 ). This classification supports the interpretation of SMRI scores by contextualizing performance within broader socioeconomic and infrastructural conditions that shape urban mobility systems. These archetypes refer specifically to patterns of mobility system maturity and readiness within metropolitan areas and should not be interpreted as classifications of national economic development levels.
Mature metropolitan areas represent highly developed urban contexts with historically strong investment in transport infrastructure, regulatory capacity, and innovative ecosystems. This group includes Amsterdam, Boston, London, Madrid, Melbourne, Milan, Munich, New York, San Francisco, Singapore, and Tokyo. While metropolitan areas within this group generally exhibit well-established public transport networks, multimodal integration, and policy frameworks supportive of sustainability, their SMRI scores vary depending on the relative balance between environmental performance, digital integration, and transport equity. Some metropolitan areas achieve high readiness scores because of comprehensive system maturity, while others show more moderate scores, reflecting trade-offs or sectoral imbalances.
Emerging metropolitan areas are characterized by ongoing transitions in their urban mobility systems, often driven by targeted investments in innovation, infrastructure expansion, or smart mobility initiatives. These metropolitan areas include Helsinki, Hong Kong, Seoul, Shanghai, Dubai, Toronto, and Los Angeles. Their SMRI performance spans from moderate to high, depending on the extent to which recent advancements are accompanied by broader systemic integration. While many of these metropolitan areas are advancing rapidly in areas such as data openness and shared mobility, challenges may persist in regulatory coordination, environmental planning, or user equity, resulting in variation in their overall readiness levels.
Developing metropolitan areas tend to face more significant constraints, including limited fiscal capacity, fragmented transport services, and insufficient infrastructure coverage. This group includes Istanbul, Buenos Aires, New Delhi, São Paulo, Bogotá, Riyadh, Cape Town, and Lagos. These metropolitan areas typically score lower on the SMRI because of persistent structural and institutional challenges, such as informal mobility reliance, limited digital systems, or underdeveloped public transport networks. Nevertheless, many are actively pursuing reform-oriented strategies, such as metro expansions, electric bus fleets, or improved land use integration, indicating considerable potential for future progress.
This typology enables a more nuanced and equitable interpretation of SMRI results by recognizing that readiness is not solely a reflection of outcomes, but also of contextual starting points and policy trajectories. Indicatively, one representative city from each archetype—London (mature), Shanghai (emerging), and Bogotá (developing)—is analyzed in detail to illustrate the diverse challenges and opportunities shaping sustainable urban mobility transitions across different urban contexts. Figure 5 provides an example comparison of these three metropolitan areas based on their overall and dimension-level SMRI scores, as visualized in the web-based interface.
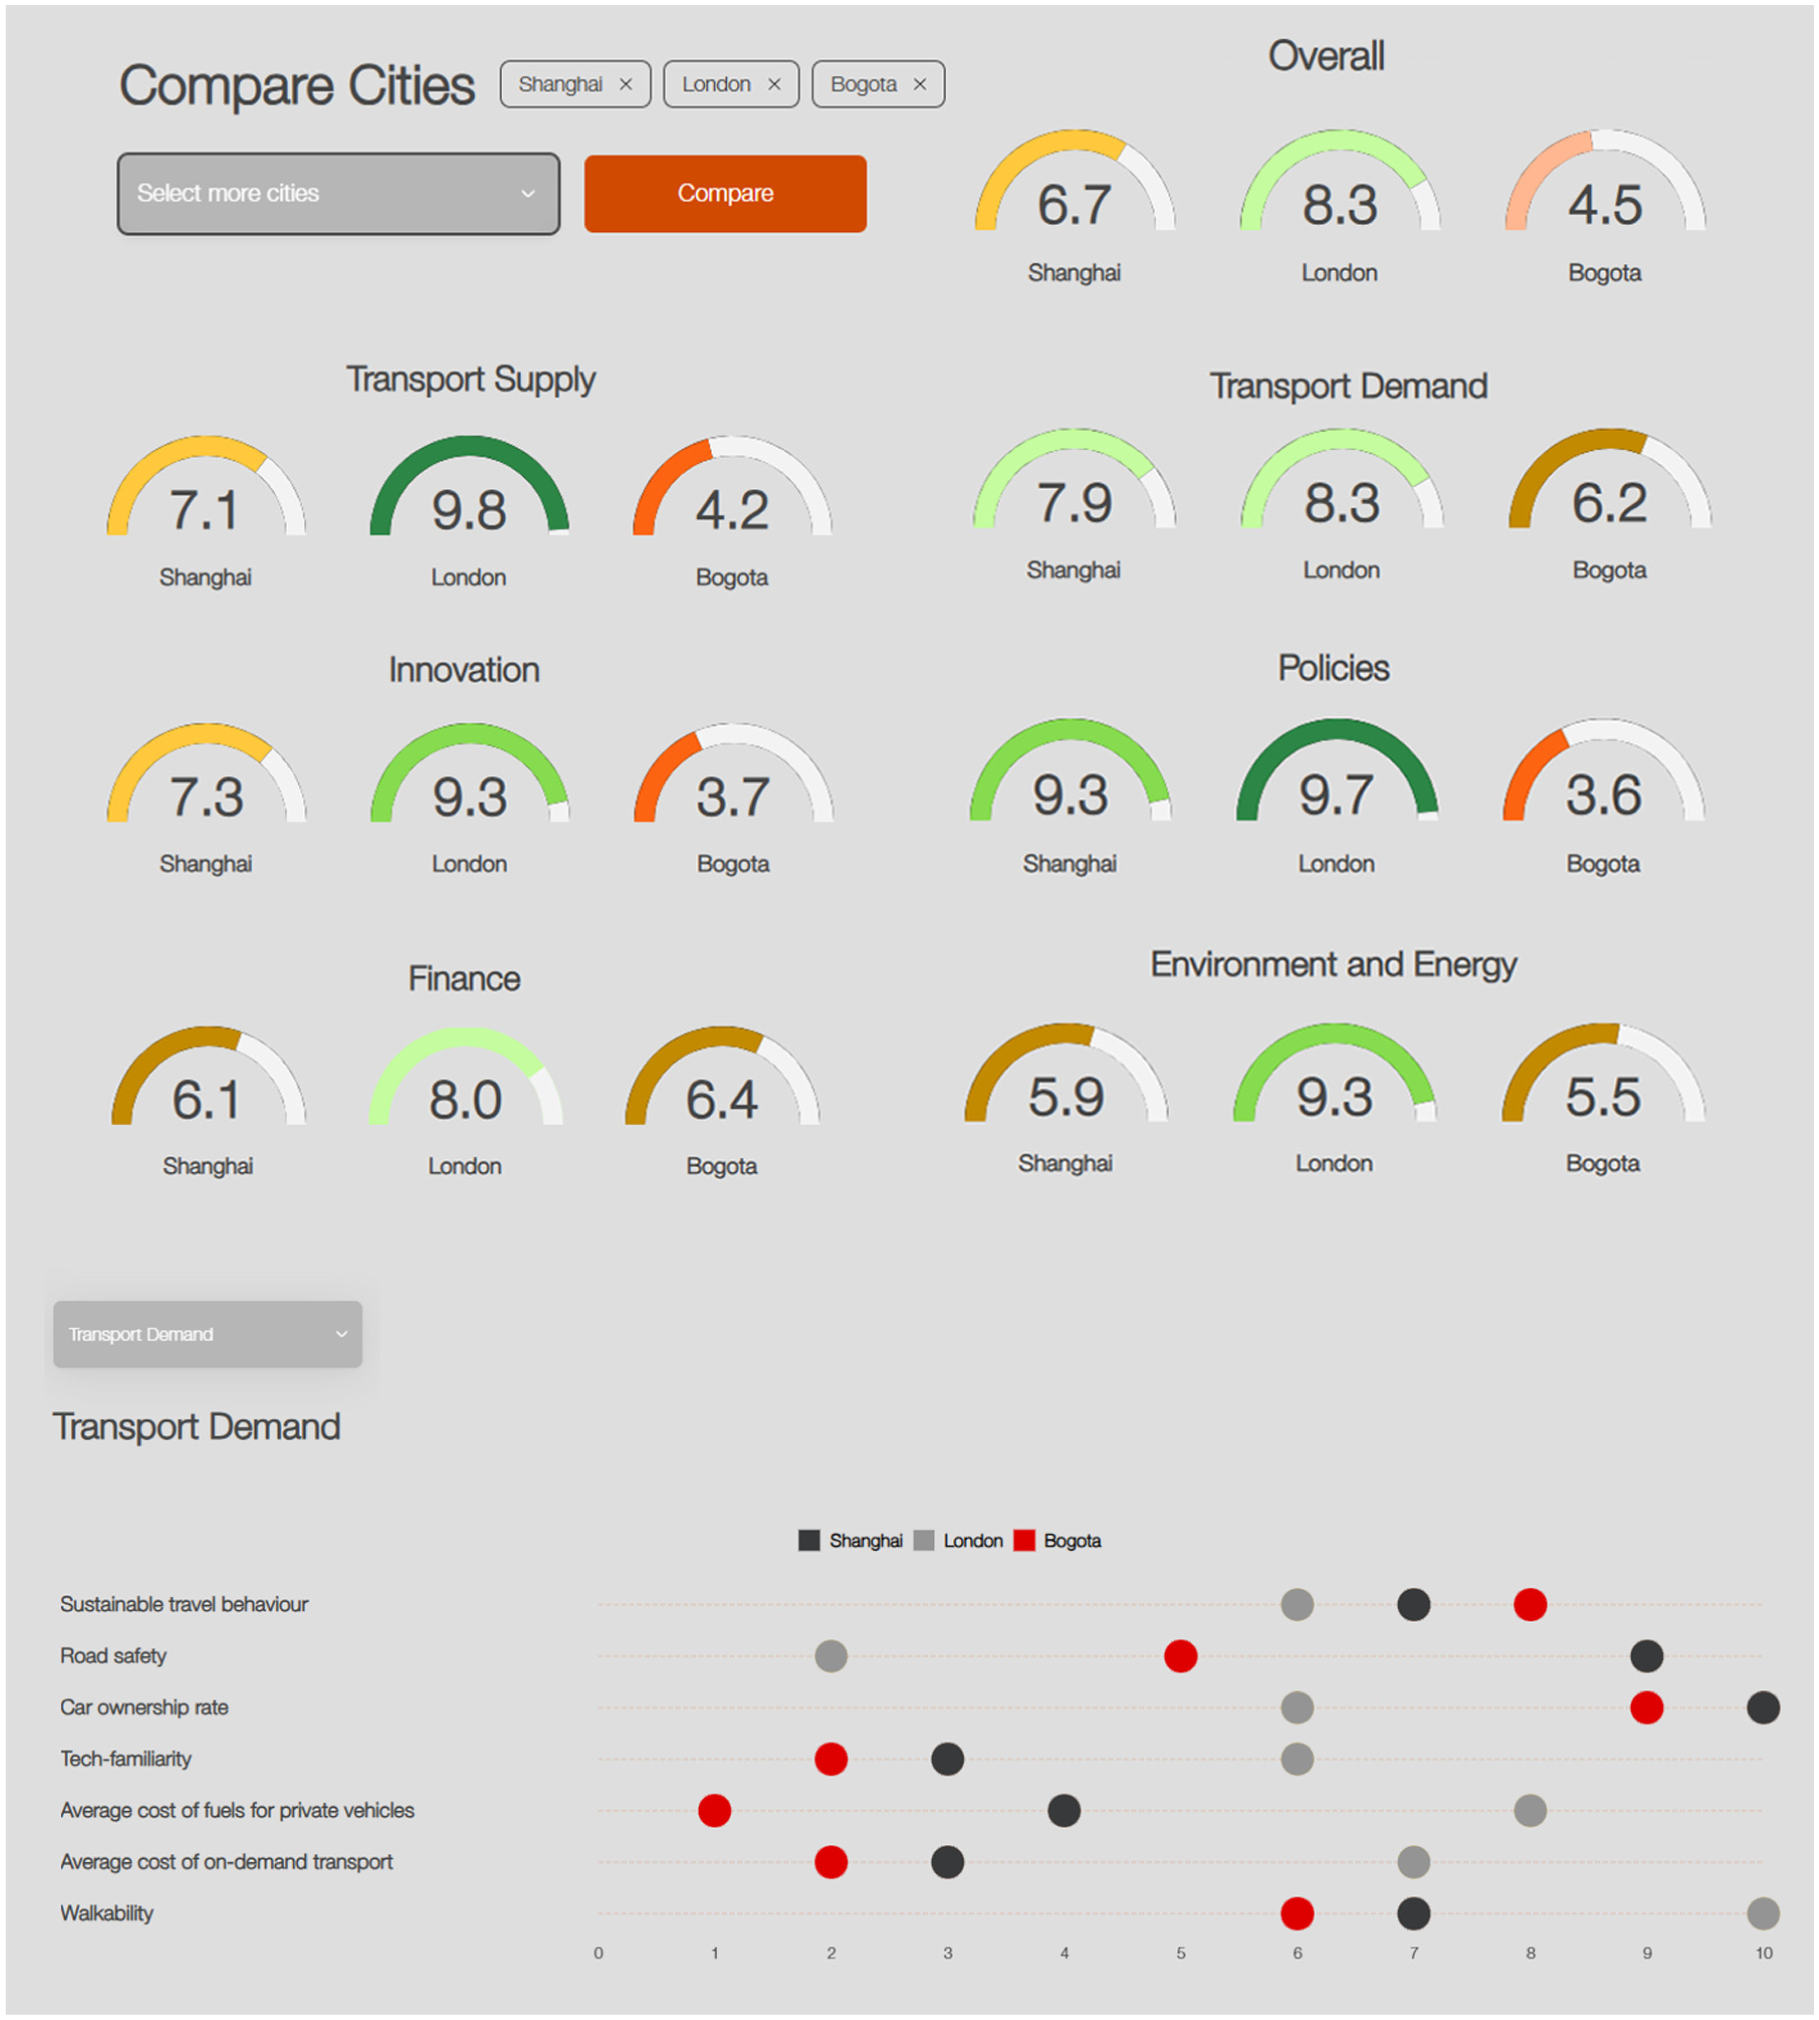
Comparison of metropolitan areas as visualized on the web-based tool.
London (Mature Archetype)
London ranks as the highest-performing city in the SMRI, with an overall score of 8.3. This reflects its longstanding commitment to sustainable urban mobility and its capacity to implement and coordinate complex, multimodal systems. The city combines strong institutional governance with substantial public investment, advanced digital infrastructure, and a regulatory environment that supports low-emission, inclusive, and innovation-driven transport. These factors place London at the forefront of both sustainability maturity and MaaS readiness.
In relation to transport supply, London offers a dense, multimodal network of public transport options, with over 19,000 bus stops, reliable subway and rail services, and a high public transport punctuality rate. Shared mobility services such as bike- and car-sharing are available, though their expansion—particularly in peripheral areas—remains an opportunity for further integration. A key feature of the city’s supply-side sustainability is the implementation of a large-scale low-emission zone, which contributes significantly to lowering urban pollution levels. On the demand side, London exhibits moderate car ownership and a high level of walkability, indicating growing support for sustainable travel behaviors. However, road safety continues to be an area of concern, particularly in relation to protecting pedestrians and cyclists from traffic-related injuries.
Innovation is a major strength. London has implemented open application program interfaces for real-time public transport data, supports extensive 4G and 5G coverage, and operates a citywide traffic management center. Infrastructure such as real-time bus arrival displays and smart ticketing enhances user experience and system responsiveness.
Policy and finance also play critical roles in London’s performance. Transport for London provides integrated oversight and planning, supported by open data policies and climate strategies. Financial incentives, including subsidized fares and grants for sustainable mobility initiatives, further strengthen inclusivity and long-term planning. Environmental outcomes are generally positive, with good air quality and growing adoption of electric vehicles. However, persistent challenges related to noise and particulate matter pollution highlight the need for continued environmental safeguards and equity-focused investments.
Shanghai (Emerging Archetype)
Shanghai exemplifies the dynamism of an emerging mobility system, earning an SMRI score of 6.7. The city demonstrates significant progress in building infrastructure, fostering innovation, and implementing modern transport policies. While its trajectory is promising, Shanghai’s urban mobility readiness remains uneven across key dimensions, with further alignment needed between technological advancement, sustainability goals, and governance structures.
Transport supply in Shanghai is notably strong. The city offers a wide range of mobility options, including one of the world’s largest bike-sharing fleets and an expansive network of electric vehicle charging stations. Public transport is highly punctual, and digital features such as onboard wi-fi and real-time information displays improve user experience. Plans to introduce congestion charging indicate policy momentum to curb traffic density and promote low-emission travel.
Despite a low rate of car ownership, demand-side indicators reveal areas for improvement. Affordable fuel prices and moderate on-demand transport costs may reduce the incentive to shift away from private vehicles. Walkability remains high and the city performs very well in road safety, reflected in the low number of traffic accidents and fatalities. Innovation is a key strength. Shanghai has made substantial investments in smart infrastructure, including widespread 5G coverage, smart traffic control, and extensive testing zones for autonomous vehicles. However, limited open access to shared mobility and transport data constrains the city’s broader MaaS potential and interoperability.
Policy development in Shanghai is robust, supported by a long-term master plan and a modern logistics strategy. Open data standards and annual public transport monitoring reinforce transparency. Still, the lack of a centralized metropolitan transport authority may hamper integrated mobility governance. Financial mechanisms lag behind the city’s technological ambitions. While EV registration is subsidized and some fare discounts exist, shared transport services receive little support. Expanding fiscal incentives could enhance both accessibility and sustainability. Shanghai’s environmental performance shows promise in EV adoption, yet air quality and renewable energy use remain critical challenges. Aligning digital innovation with stronger decarbonization efforts will be essential to translating mobility progress into long-term environmental resilience.
Bogotá (Developing Archetype)
Bogotá represents a city in transition, working to overcome structural and institutional challenges that limit its readiness for sustainable and integrated urban mobility. With an SMRI score of 4.5, Bogotá ranks among the lower-scoring metropolitan areas in the index, though several promising foundations suggest significant potential for future progress—particularly in demand-side behavior and the early adoption of sustainability-focused policies.
The city’s transport supply remains underdeveloped. While Bogotá has established a formal public transport system, coverage and service reliability require strengthening. Delays remain a persistent issue, and infrastructure investment has yet to meet growing demand. Nonetheless, notable progress has been made: the city’s extensive cycling network and over 7,500 bus stops demonstrate a clear commitment to expanding multimodal options and encouraging nonmotorized travel. Transport demand indicators present a relatively strong profile. Car ownership is low, and the city is recognized for its walkability, indicating a population largely reliant on public and active transport. However, the low cost of gasoline and gaps in smartphone access may undermine further behavioral shifts toward shared or digital mobility services. These structural conditions highlight the need for strategies that align affordability with sustainable choices.
In the area of innovation, Bogotá’s current approach is limited. While some transport data are available, broader integration of shared mobility, parking information, and real-time user services is lacking. The absence of a citywide smart mobility platform constrains the scalability of MaaS models. Further development in data sharing and platform interoperability will be essential for supporting digital transformation in transport. Policy frameworks provide a baseline for improvement. Bogotá operates under a mobility master plan and a logistics strategy, but monitoring cycles are infrequent, and critical elements—such as open data standards and climate neutrality enforcement—remain underdeveloped. A stronger institutional structure and policy updates could help coordinate efforts across agencies and service providers.
Financial support mechanisms are present but partial. Public transport is subsidized, and limited incentives exist for electric mobility. However, shared transport modes and public–private partnerships receive minimal support. Expanding financial tools could play a pivotal role in improving inclusivity and accelerating low-emission mobility. Environmental readiness remains a work in progress. Despite policy commitments, uptake of electric vehicles and renewable energy integration in transport is still nascent. Strengthening implementation mechanisms and linking environmental goals to financing and infrastructure development would be crucial for enhancing Bogotá’s long-term sustainability.
Discussion and Conclusions
The SMRI represents an innovative contribution to the evaluation of passenger and freight transport systems in metropolitan areas. The adopted multidimensional framework integrating passenger and freight transport readiness can enable decision-makers to expand the assessment of metropolitan areas beyond conventional frameworks. The index provides an interdisciplinary tool that is geographically adaptable worldwide to benchmark the preparedness of metropolitan areas toward the transition of sustainable, inclusive and technologically integrated mobility ecosystems.
The SMRI extends the state-of-the-art by advancing the field with the integration of diverse concepts from transport geography, infrastructure planning and urban innovation into a single index that is easy-to-use and easy-to-comprehend. Moreover, it brings together sectors that are commonly siloed together such as public transport, micromobility, digital platforms, and freight transport under a common evaluative framework. This structure allows cross-comparative insights into how metropolitan areas can balance sustainability, innovation, and inclusivity in sustainable transport planning, while also serving as a stepping stone for future research on emerging transport services.
In addition, the SMRI advances the state of practice by delivering a decision-support tool for policymakers, and local and regional transport authorities. It enables the decision-makers to pinpoint the strengths and weaknesses of the metropolitan areas, while also monitoring their progress dynamically and prioritizing policy interventions such as infrastructure investment, governance and digital readiness. Further, the index can highlight metropolitan areas that receive high scores across certain dimensions. Therefore, SMRI can enable peer learning and support knowledge transfer. Specifically, metropolitan areas with lower scores can receive lessons from comparable areas that have effectively developed innovative and inclusive mobility services.
Notably, the index is developed considering its geographic adaptability. In particular, the SMRI can be implemented across diverse metropolitan contexts that can allow meaningful comparison across areas. Nevertheless, this scalability is accompanied by certain limitations. Evidently, data availability, data quality, and data granularity differ across regions, especially in developing or decentralized metropolitan areas. Even though it was attempted to depend on globally recognized data sources, in a few cases, proxy indicators were needed; a practice that may influence the comparability or accuracy of the outputs.
A methodological limitation relates to the use of min–max normalization. While this approach ensures transparency and direct comparability across indicators, it is sensitive to extreme values and may mask uniformly low performance when all metropolitan areas score poorly on a given dimension. In the development of the SMRI, this effect is partly mitigated through the use of archetypes, which enable comparison within more homogeneous peer groups. Nevertheless, this limitation serves as an opportunity for further research, as future iterations of the SMRI will explore anchored normalization using external goalposts or reference panels to enhance robustness and longitudinal comparability beyond the sample-based extrema.
Looking forward, future iterations of the SMRI could boost granularity by separating metropolitan areas into different zones with homogeneous characteristics. This method could yield intrametropolitan heterogeneity in accessibility and infrastructure provision. In addition, trending topics such as transport poverty, equity and localized impacts of emerging passenger and freight transport services could be integrated into the framework, which is critical to safeguard that the index is relevant and applicable to the evolving challenges associated with the dynamic nature of sustainable transport. Lastly, as mentioned, given that new forms of passenger and freight mobility continue to reform the transport landscape, there is a growing need for evaluative frameworks, such as the SMRI index that are comprehensive but also forward-looking.
Footnotes
Acknowledgements
The authors acknowledge the support of PwC Middle East and PwC Germany for the data collection activities and the development of the metropolitan areas’ archetypes used in this study.
Author Contributions
The authors confirm contribution to the paper as follows: study conception and design: M. Kamargianni, E. Kalantzi; data collection: E. Kalantzi, T. Betsidou; analysis and interpretation of results: E. Kalantzi, C. Gkartzonikas, T. Betsidou, M. Kamargianni; draft manuscript preparation: E. Kalantzi, C. Gkartzonikas. All authors reviewed the results and approved the final version of the manuscript.
Declaration of Conflicting Interests
The authors declared no potential conflicts of interest with respect to the research, authorship, and/or publication of this article.
Funding
The authors disclosed receipt of the following financial support for the research, authorship, and/or publication of this article: This research received financial and project support from PwC Middle East and PwC Germany for the data collection activities and the development of the metropolitan areas’ archetypes used in the SMRI framework.
Data Accessibility Statement
The data used in this study were collected from publicly available sources including Eurostat, World Bank, OECD, and open mobility platforms such as TomTom and OpenStreetMap. Some data were obtained through collaboration with local authorities, experts and are not publicly available. Derived data supporting the findings of this study are available from the corresponding author on reasonable request.
The funders had no role in the analysis, interpretation of results, writing of the manuscript, or the decision to publish the study.