
Abstract
Road diets represent a cost-effective strategy for enhancing roadway safety; however, comprehensive frameworks integrating operational assessment with surrogate safety evaluation remain limited. This study develops an end-to-end microscopic simulation and machine learning framework to quantify operational and safety impacts of an urban road diet. A 0.22 mi segment of Frazier Avenue in Chattanooga, Tennessee, U.S.—recently converted from a four-lane undivided cross-section to a two-lane facility with a center left-turn lane—is modeled in SUMO using multi-month GridSmart trajectory counts, speed measurements, annual average daily traffic, and OpenStreetMap-derived geometry. A one-way analysis-of-variance-based sensitivity analysis identifies nine influential driver and vehicle parameters, which are calibrated via a genetic algorithm that minimizes speed root mean square error; validation against turning-movement counts using the Geoffrey E. Havers statistic satisfies FHWA acceptance criteria. Three 24 h scenarios are simulated (pre-diet, post-diet, and post-diet geometry with pre-diet demand), complemented by a demand sensitivity analysis up to +30% average daily trips. Corridor-wide, the road diet yields modest mobility penalties—average travel time increases by 4.3%, average speed decreases by 5.2%, and average waiting time increases by 40.7%—with more pronounced degradation westbound and intersection-specific queue growth. Surrogate safety measures at the major signalized intersection indicate substantial safety gains: total vehicle conflicts with time-to-collision (TTC) <3 s decrease by 45.7%, and critical conflicts with TTC <1 s decrease by 62.3%, with conflict hotspots markedly attenuated. Finally, an XGBoost regressor using pre-diet queue length, density, travel time, and speed predicts post-diet waiting times with R2 = 0.905, demonstrating the potential of simulation-driven predictive models to support proactive corridor management and design of future road diet projects.
Keywords
Introduction
Road diets represent an innovative transportation strategy aimed at enhancing roadway safety and multimodal mobility, particularly in contexts where financial resources are limited ( 1 ). This approach primarily involves reconfiguring roadways by reducing the number of vehicle travel lanes, commonly converting four-lane undivided highways into three-lane cross-sections that include two through lanes and a central two-way left-turn lane. The freed space from lane reductions may be repurposed to accommodate bicycle lanes, sidewalks, or on-street parking, thus promoting multimodal transportation options without significantly affecting vehicular throughput or necessitating extensive right-of-way acquisitions ( 2 ). Additionally, some road diets further reduce four-lane roads to two-lane roads by introducing landscaped median islands or restriping methods. By limiting vehicle speeds and reducing frequent lane-changing behaviors, road diets effectively calm traffic flow, subsequently decreasing the frequency and severity of vehicle collisions. Consequently, cities across the U.S. have increasingly implemented road diets as a practical measure to address both rising vehicular traffic and associated safety concerns stemming from continued urban growth and decentralization ( 3 ).
Several studies have examined various aspects of road diet implementation, including traffic and pedestrian safety, design evaluations, congestion measurement, level-of-service analyses, economic impact assessments, impacts on driving behavior, traffic design and operational analyses, environmental and livability assessments, and the application of simulations in road diet design ( 2 , 4 – 13 ). Nevertheless, comparatively few studies have focused explicitly on micro-simulation and the practical implementation of simulations, despite their considerable advantages for traffic engineers and policymakers in evaluating conditions before and after road diet interventions. Although some real-world case studies have compared conditions pre- and post-implementation, developing reliable simulation models to systematically analyze various scenarios remains a more cost-effective approach for assessing the impacts of road diet designs.
To address this research gap, this study conducted a comprehensive 24 h traffic simulation along a 0.22 mi corridor (Frazier Avenue) in Chattanooga, Tennessee, U.S., which recently underwent a road diet, converting the roadway from four lanes to two lanes. Approximately 7 months of real-world traffic data were collected post-intervention using GridSmart cameras, providing detailed information on vehicle movements and turning behaviors at three key intersections along the corridor. The key contributions of this research are as follows:
A comprehensive end-to-end pipeline for microscopic traffic simulation was developed, integrating multiple real-world data sources—including GridSmart camera trajectory data, OpenStreetMap (OSM)-based infrastructure, annual average daily traffic (AADT) volumes, and field-observed speed measurements—into a unified simulation framework. Using the microscopic traffic simulation tool SUMO, full 24 h simulations were carried out for both the pre- and post-road-diet network configurations.
A rigorous calibration and validation strategy is implemented using a genetic algorithm (GA)-based optimization framework coupled with one-way analysis of variance (ANOVA)-based sensitivity analysis. The sensitivity analysis systematically explores the SUMO parameter space to identify statistically significant parameters, while the GA minimizes the root mean square error (RMSE) between simulated and observed speeds.
Comprehensive performance metrics—including total and hourly travel time, waiting time, queue length, and average speed—were analyzed for scenarios before and after the road diet, as well as for scenarios applying pre-diet traffic demand to the post-diet network.
Surrogate safety measures (SSMs) were implemented for all simulated vehicles, enabling the identification and logging of conflicts between vehicles and other traffic participants. time-to-collision (TTC) was specifically analyzed to assess safety improvements resulting from the road diet.
A detailed spatial analysis was conducted to identify and visualize safety hotspot zones at a major intersection using TTC data.
Machine learning techniques, specifically XGBoost regression models, were employed to predict post-road-diet waiting times based on pre-road-diet traffic data, highlighting the potential of predictive modeling to assist in traffic management decision-making.
The remainder of the paper is structured as follows. First, related research is reviewed, followed by a detailed description of the calibration and validation of the microscopic simulation model, as well as the experiment scenarios and simulation methodology. Subsequently, the simulation results are presented and discussed, and the paper concludes with key insights and recommendations for future work.
Background
Improving road user safety is a primary objective of road diets and often motivates decision-makers to implement changes in roadway configurations. Lim et al. analyzed 36 road segments and 39 intersections in Virginia, reporting that converting four-lane roads into three-lane configurations with dedicated bicycle lanes significantly enhanced road safety between 2009 and 2018 ( 3 ). They observed a 38% reduction in total crashes and a 64% decrease in fatal and injury-related crashes on road segments. Similarly, intersections showed reductions of 35% in total crashes and 46% in injury crashes, although these benefits were predominantly noted at signalized intersections. These findings underscore road diets as effective safety measures for roadway enhancements. In another study conducted in Los Angeles, researchers evaluated road diets implemented on high-traffic-volume corridors surpassing the 20,000 average daily trips (ADT) threshold recommended by FHWA ( 16 ). The comparative analysis of five treated corridors against 16 untreated multilane segments revealed substantial reductions in collisions, injuries, and fatalities, ranging from 31.2% to 100%, alongside moderate speed reductions of approximately 6.7%–7.9%. That research challenges the prevailing assumption about the efficacy of road diets on higher-volume roads, demonstrating considerable safety benefits with minimal impacts on traffic flow ( 4 ).
However, results are not uniformly positive across all studies. A study by Huang et al. evaluating 12 road diet locations and 25 comparison sites in California and Washington produced mixed safety outcomes ( 2 ). While a basic before-and-after comparison indicated a 6% crash reduction at road diet sites, a more rigorous negative binomial model controlling for traffic volumes and other influencing factors found no significant overall treatment effect. Consequently, that research suggests that road diet implementations should be carefully assessed on a case-by-case basis, considering traffic flow, capacity constraints, and localized safety conditions, emphasizing the need for further targeted evaluations.
Lane width is another critical design element influencing roadway safety in road diet applications. Azin et al. investigated 320 urban arterial segments in Utah and concluded that narrower lane widths correlate with lower vehicle speeds and reduced crash risks ( 5 ). Specifically, each additional foot of lane width increased 85th percentile speeds by approximately 1.012 mph and injury crash odds by 38.3%, supporting the implementation of lane widths between 10 and 11 ft as an effective safety measure in urban areas. Further supporting the efficacy of road diets, a University of Virginia study utilized fleet vehicle telematics data to evaluate a road diet on McCormick Road ( 18 ). Despite higher traffic volumes post-implementation, the road diet resulted in a 75.5% reduction in driving infractions, highlighting telematics as a valuable tool for assessing traffic safety interventions. Road diet impacts at signalized and unsignalized intersections have also been explored. Aljamal et al. studied a non-traditional road diet on New Jersey Avenue in Washington, D.C., converting the corridor from four lanes to two lanes with full-time parking ( 11 ). Using Synchro simulation and empirical Bayes analysis across six intersections, the study found improved performance and reduced crash predictions at unsignalized intersections. However, a degradation in performance at one signalized intersection was noted, prompting recommendations for signal timing re-optimization to maximize operational benefits following road diet implementations.
Microscopic traffic simulation provides a robust, dynamic modeling environment, enabling comprehensive analysis of road user performance and safety impacts of various roadway designs, including road diets. This simulation method allows detailed examination of critical safety-influencing parameters, such as vehicle speeds and flow rates ( 20 ). Noland et al. conducted a cost-benefit analysis of a road diet on Livingston Avenue in New Brunswick, New Jersey, using VISSIM microsimulation ( 17 ). They evaluated the trade-offs between increased travel time resulting from reduced capacity and anticipated safety improvements, applying a projected 19% crash reduction common in urban arterial road diets. The findings consistently demonstrated that the safety benefits significantly outweighed associated travel time costs across various scenarios over a 20-year horizon. Microscopic simulation also facilitates evaluation of street design modifications and tactical urbanism strategies, as demonstrated by Liu et al., who developed a simulation framework for downtown San Jose ( 13 ). Their work assessed the conversion of one-way streets into two-way streets and various travel demand reduction scenarios, aiming to support active transportation and alternative street uses. Similarly, Chiu et al. employed VISSIM to evaluate the conversion of one-way streets to two-way streets in downtown San Jose, finding that current street configurations would struggle to manage projected 2040 traffic volumes, thereby highlighting the necessity of implementing aggressive travel demand management strategies alongside physical street modifications ( 19 ).
Despite extensive prior research, we have identified a significant methodological gap with regard to comprehensive, end-to-end frameworks that seamlessly integrate data collection pipelines, rigorous calibration and validation procedures, systematic scenario generation, multi-dimensional performance analysis, and sensitivity evaluation within a unified analytical architecture. Existing studies often address these components in isolation, lacking the cohesive integration necessary for holistic traffic intervention assessment. Furthermore, comparatively few investigations have conducted continuous 24 h simulations that comprehensively synthesize traffic performance metrics with surrogate safety assessments, thereby limiting the temporal scope and practical applicability of findings for decision-makers. To address these gaps, this study develops and demonstrates an integrated simulation-based evaluation framework employing the open-source microscopic traffic simulation model SUMO, calibrated and validated using multi-source real-world data including camera trajectories, speed measurements, and AADT volumes, to rigorously analyze the operational and safety effects of a road diet on the Frazier Avenue corridor. The framework encompasses systematic sensitivity analysis to evaluate corridor robustness under varying demand scenarios approaching FHWA-recommended thresholds. Additionally, a machine learning model utilizing XGBoost regression was developed to predict post-road-diet waiting times from pre-road-diet traffic parameters, demonstrating the potential for predictive analytics to support proactive traffic management decision-making.
Methodology
Figure 1 illustrates the comprehensive research framework employed in this study, outlining the systematic workflow from data collection through final analysis. The methodology encompasses five interconnected phases: 1) Data Collection Phase, which integrates multiple data sources including GridSmart camera footage, OSM infrastructure data, field-observed speed measurements, and AADT values; 2) Data Preprocessing, involving vehicle movement processing, lane aggregation with route distribution, and XML format conversion for simulation compatibility; 3) Simulation API and Model Development, utilizing SUMO network construction followed by rigorous calibration and validation procedures; 4) Traffic Scenarios implementation, examining three distinct configurations—the baseline four-lane configuration before road diet, the two-lane configuration after road diet, and a hybrid scenario applying pre-intervention demand to post-intervention geometry; and 5) Analysis and Results, comprising comparative before-after analysis of road diet effects, SSMs assessment using TTC metrics, and machine learning application through XGBoost for predicting post-intervention waiting times.
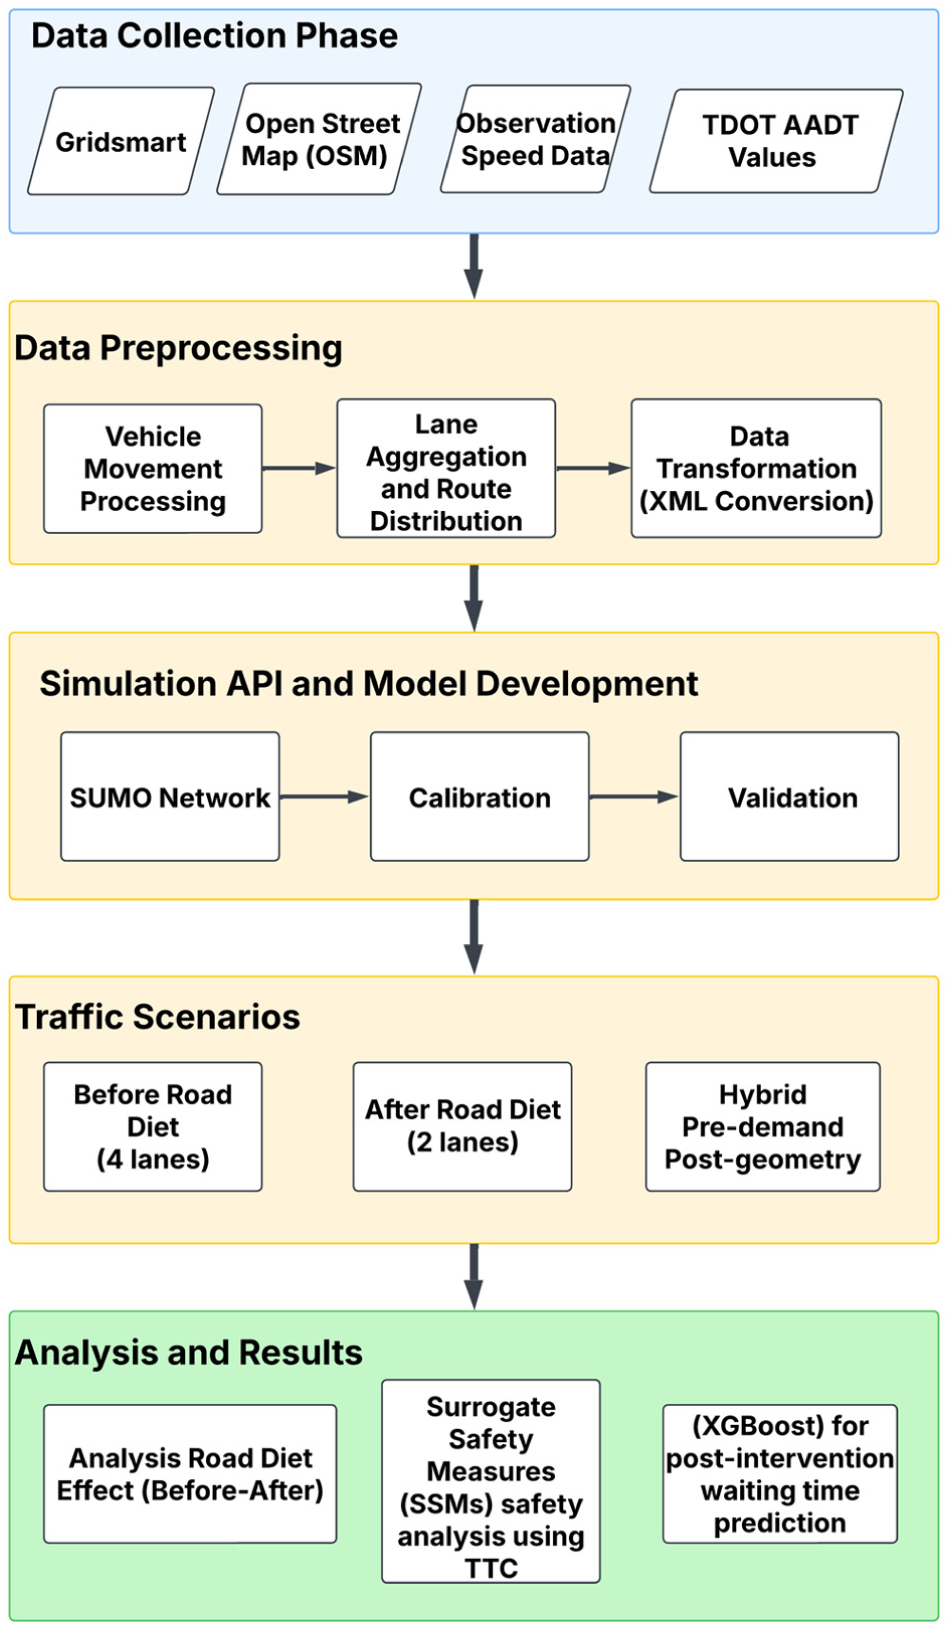
Research methodology framework for road diet impact assessment.
Network Modeling
Following a severe accident on Frazier Avenue, the City of Chattanooga undertook an assessment of the roadway lane configuration to enhance pedestrian safety. The incident involved a vehicle exceeding the posted speed limit of 35 mph, which lost control while attempting to overtake another car on the narrow four-lane road, subsequently striking pedestrians on the sidewalk. The study corridor on Frazier Avenue extends approximately 0.22 mi, beginning from the intersection at Market Street, and passing through intermediate intersections at Woodland, Forest, and Tremont Street (See Figure 2).
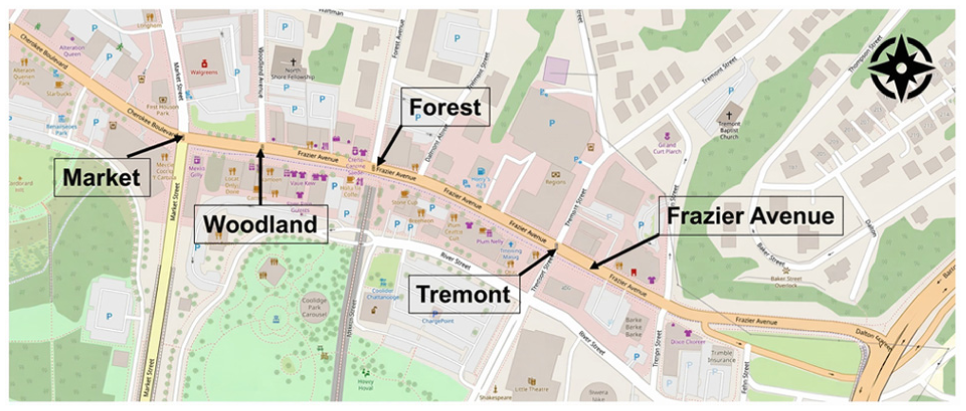
OpenStreetMap overview of the 0.22 mi Frazier Avenue study corridor showing four modeled intersections: Market Street, Woodland, Forest, and Tremont.
We employed OSM data to develop the SUMO model. Initially, the OSM map was converted using the Netconvert tool, which extracts relevant simulation data from OSM files. Additionally, Netconvert can be integrated with the OSM Web Wizard within SUMO for streamlined processing ( 15 ). Subsequent modifications were applied to junctions, edges, and turning movements within the map to accurately reflect real-world conditions. We also adjusted traffic signal timings to create actuated signals, closely approximating actual traffic behavior. Figure 3 illustrates the resulting SUMO model, highlighting the modeled intersections. Furthermore, we altered the road layout to simulate post-road-diet conditions, featuring one lane per travel direction and an additional protected left-turn lane. Although the real-world road design includes bicycle lanes and parking areas, these features were excluded from our simulation, since this study does not focus on vulnerable road users such as pedestrians and cyclists. Figure 4 provides a comparative visualization of the SUMO model network for Frazier Avenue before and after the road diet intervention.
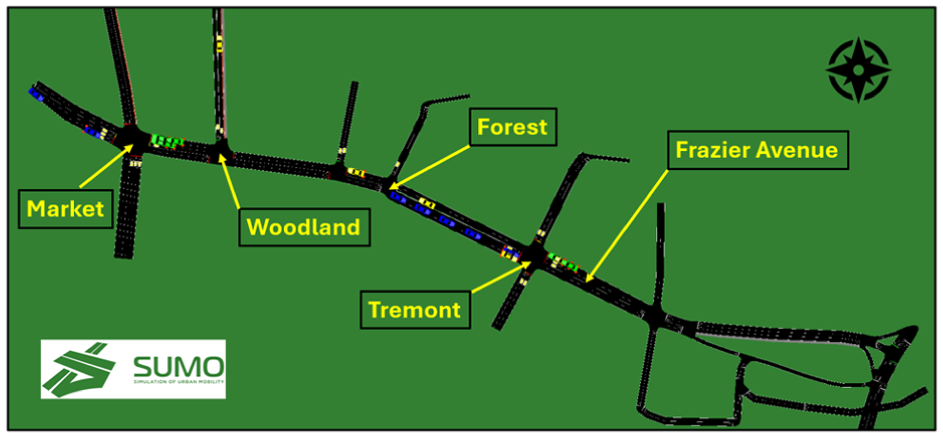
SUMO microscopic simulation network of the Frazier Avenue corridor under the pre-intervention four-lane configuration, with modeled intersections and actuated signal timing.
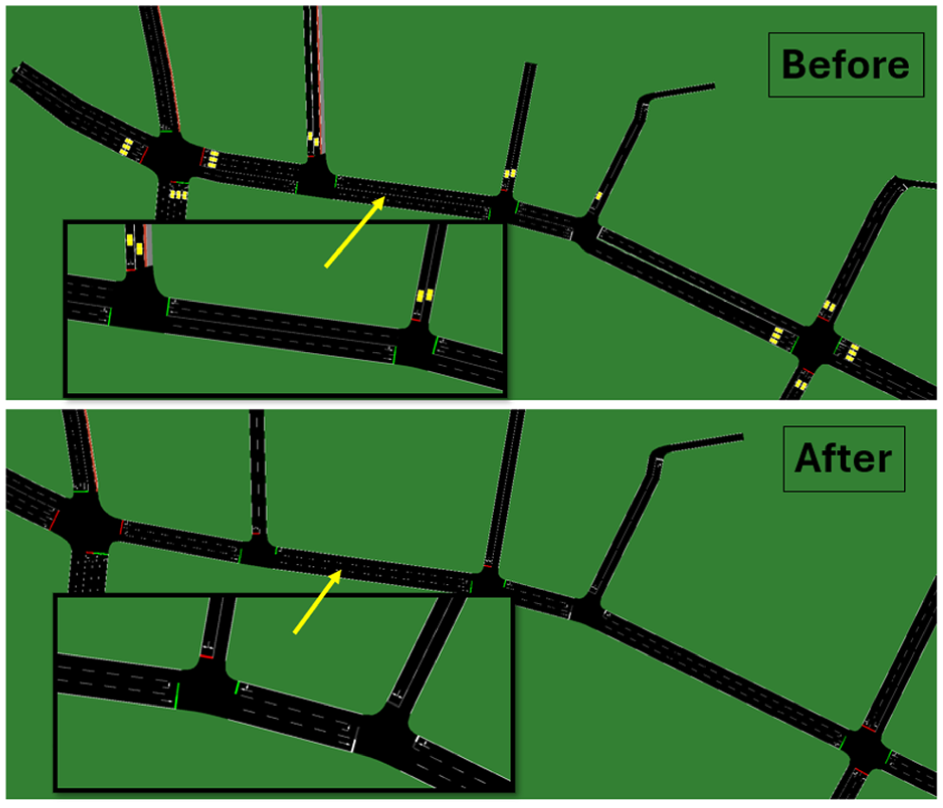
Side-by-side SUMO network representations of Frazier Avenue before (four-lane) (top) and after (two-lane with protected left-turn lane) (bottom) road diet implementation.
Input Data Collection
We obtained the movement data through Gridsmart cameras provided by the City of Chattanooga (see Figure 5), capturing vehicle counts at multiple intersections and entry points along the Frazier Avenue corridor at 5 min intervals over a continuous 24 h period. The raw dataset predominantly consisted of vehicles traversing the entire corridor from east to west and west to east, reflecting the primary traffic flows along Frazier Avenue. Additional data components represented vehicles making turning movements toward Woodland Avenue and other adjacent streets, and, conversely, vehicles entering Frazier Avenue from these connecting streets. To simulate realistic vehicle trajectories comprehensively, we combined related lane-specific entries into aggregated entry points, such as merging lanes entering Market Street from the east or west. Subsequently, these aggregated counts were proportionally allocated to distinct routes along Frazier Avenue using predefined distribution factors, effectively modeling the actual route selection behaviors observed in the field. To mimic authentic temporal traffic dispersion within each interval, vehicle departure times were randomized uniformly throughout each 5 min interval. Finally, the processed data were structured into XML format compatible with the SUMO microscopic simulation platform, enabling detailed and accurate analysis of traffic dynamics and movements on Frazier Avenue.
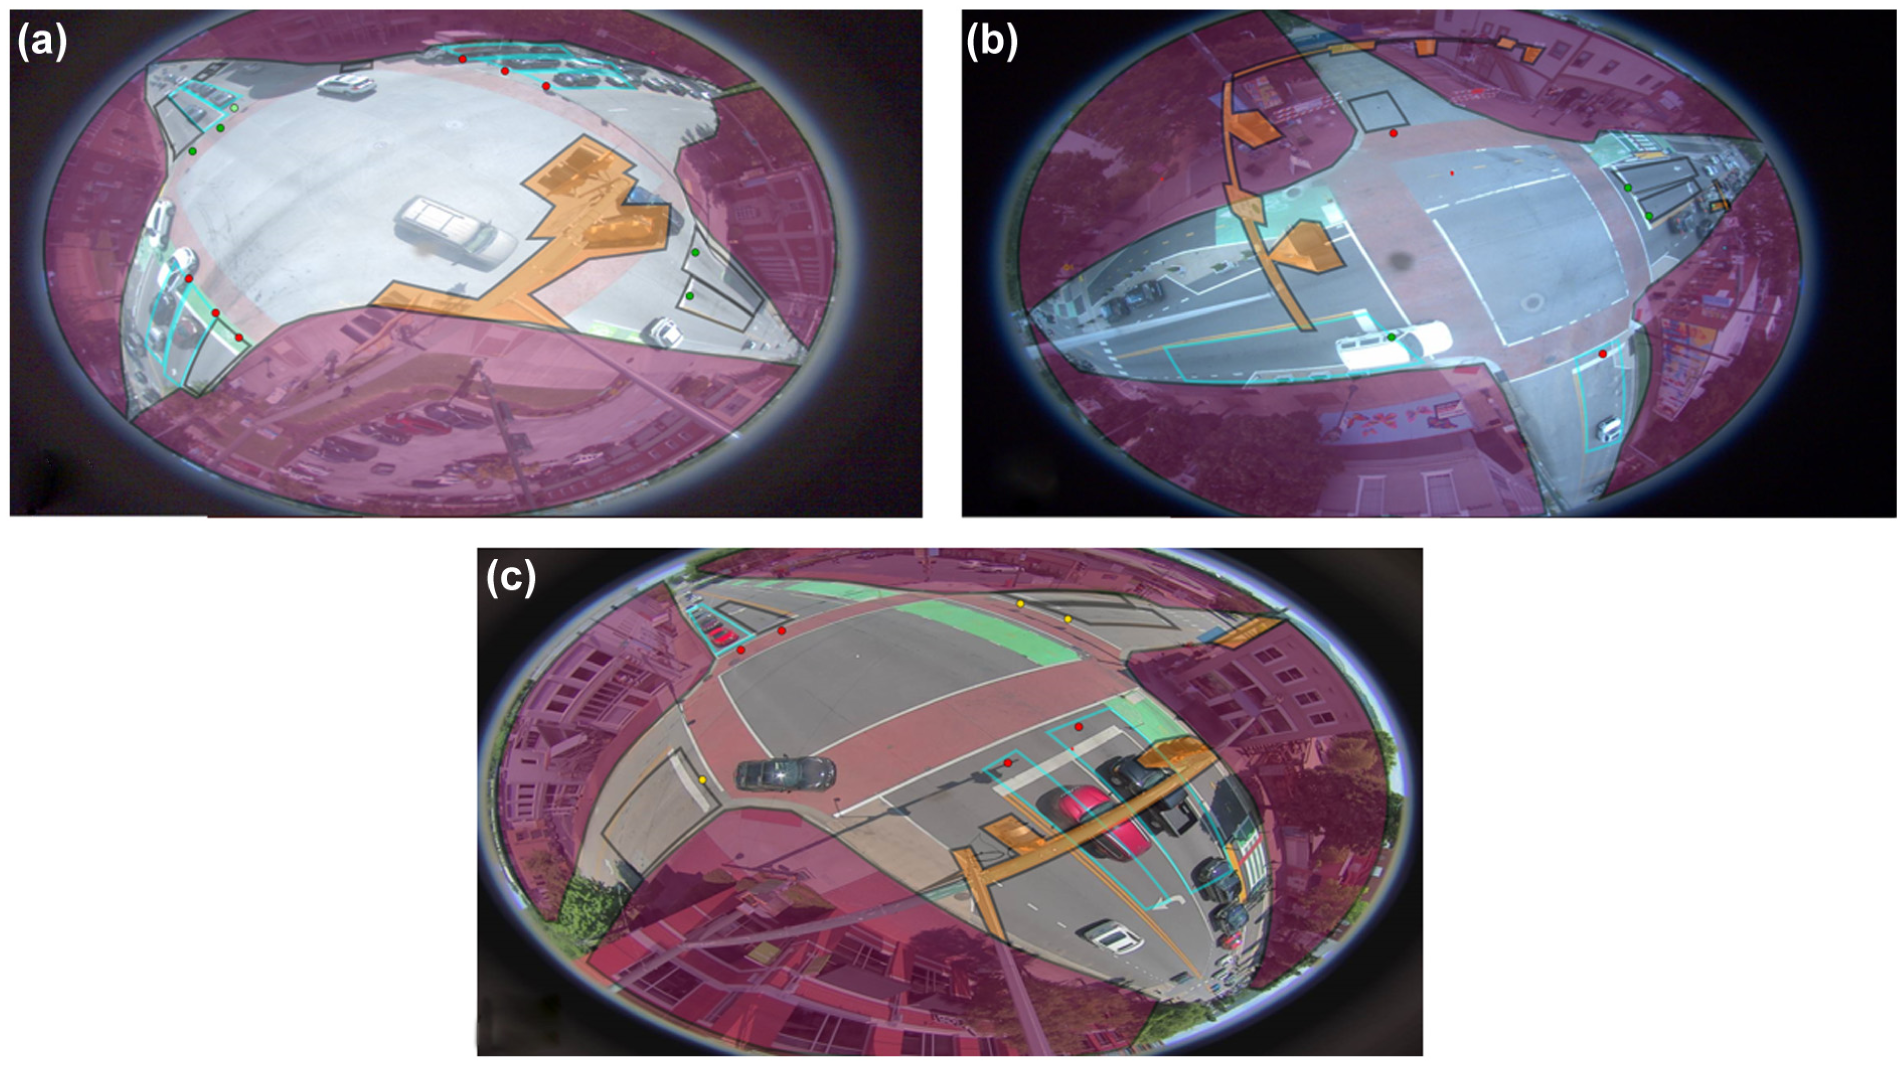
GridSmart fish-eye camera views at: (a) Market Street, (b) Forest Avenue, and (c) Tremont Street intersections, capturing 5 min vehicle counts and turning movements over continuous 24 h periods.
Traffic volume data utilized in this study were systematically collected for distinct periods preceding and following the implementation of a road diet on Frazier Avenue. Specifically, the before period encompassed April to October, 2024, while the after period extended from October, 2024, to June, 2025. To provide an in-depth assessment, monthly averages were computed separately for weekdays and weekends, yielding a comprehensive representation of the 24 h daily traffic patterns, analyzed at precise 5 min intervals. Peak demand periods were subsequently identified from these datasets, with the highest recorded traffic volume before the road diet observed in September 2024, totaling 15,547 vehicles, while the highest after diet traffic volume occurred in April 2025, reaching 15,177 vehicles. This observed reduction aligns with initial expectations, suggesting that increased travel times because of the road diet prompted commuters to opt for alternative or parallel routes, resulting in an overall decline in average daily traffic.
Figure 6 provides a detailed visualization of vehicle movements along the primary corridor of Frazier Avenue, highlighting a total corridor traversal of 9,402 vehicles, comprising 4,694 vehicles traveling from west to east and 4,708 vehicles traveling from east to west. Additionally, the figure clearly delineates peak traffic periods, with morning peak hours spanning from 6:30 to 9:00 a.m. and evening peak hours from 4:00 to 6:00 p.m. Throughout this research, traffic demand was thoroughly analyzed across a continuous 24 h interval, ensuring robust insights into traffic behavior and patterns.
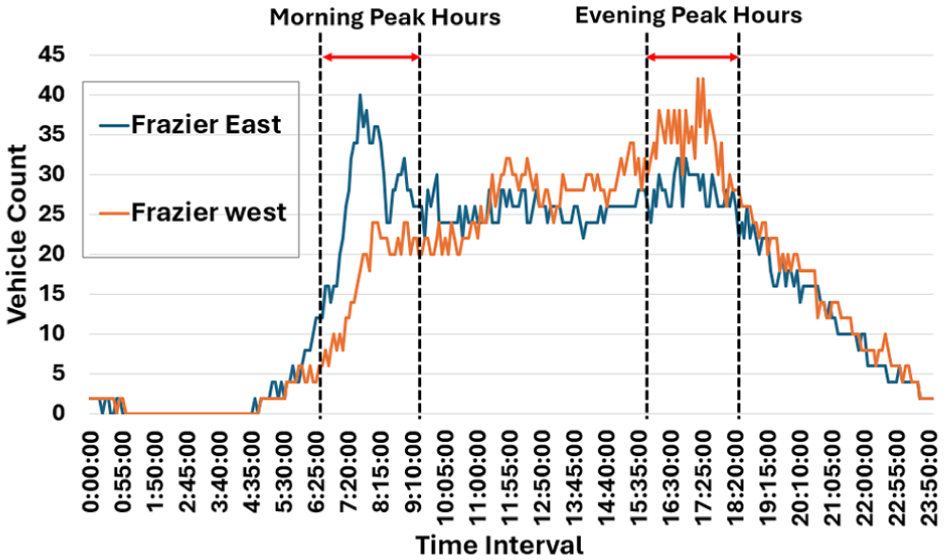
24 h directional vehicle volume profiles for eastbound and westbound flows along Frazier Avenue, illustrating morning (6:30–9:00 a.m.) and evening (4:00–6:00 p.m.) peak demand periods.
Furthermore, the daily traffic data obtained in this analysis were compared with the AADT values. The AADT values for recent years show the following trends: 14,711 vehicles in 2024, 14,817 vehicles in 2023, 15,788 vehicles in 2022, 15,172 vehicles in 2021, and 13,400 vehicles in 2020. The annual growth rates from 2020 onwards demonstrate fluctuating patterns, with 2024 showing a −1% decline, 2023 experiencing a −6% decrease, 2022 exhibiting a 4% increase, 2021 showing significant growth at 13%, and 2020 displaying a substantial −21% decline. As a result, we can use the traffic count by Gridsmart cameras which is aligned with AADT.
Calibration and Validation
Calibration
The calibration methodology employed in this study builds on established frameworks validated in previous research ( 12 , 21 , 22 ). Figure 7 illustrates the comprehensive optimization workflow implemented for model calibration. The process leverages a GA—an evolutionary computation technique that emulates biological evolutionary processes including natural selection, genetic crossover, and mutation mechanisms—to optimize complex parameter spaces.
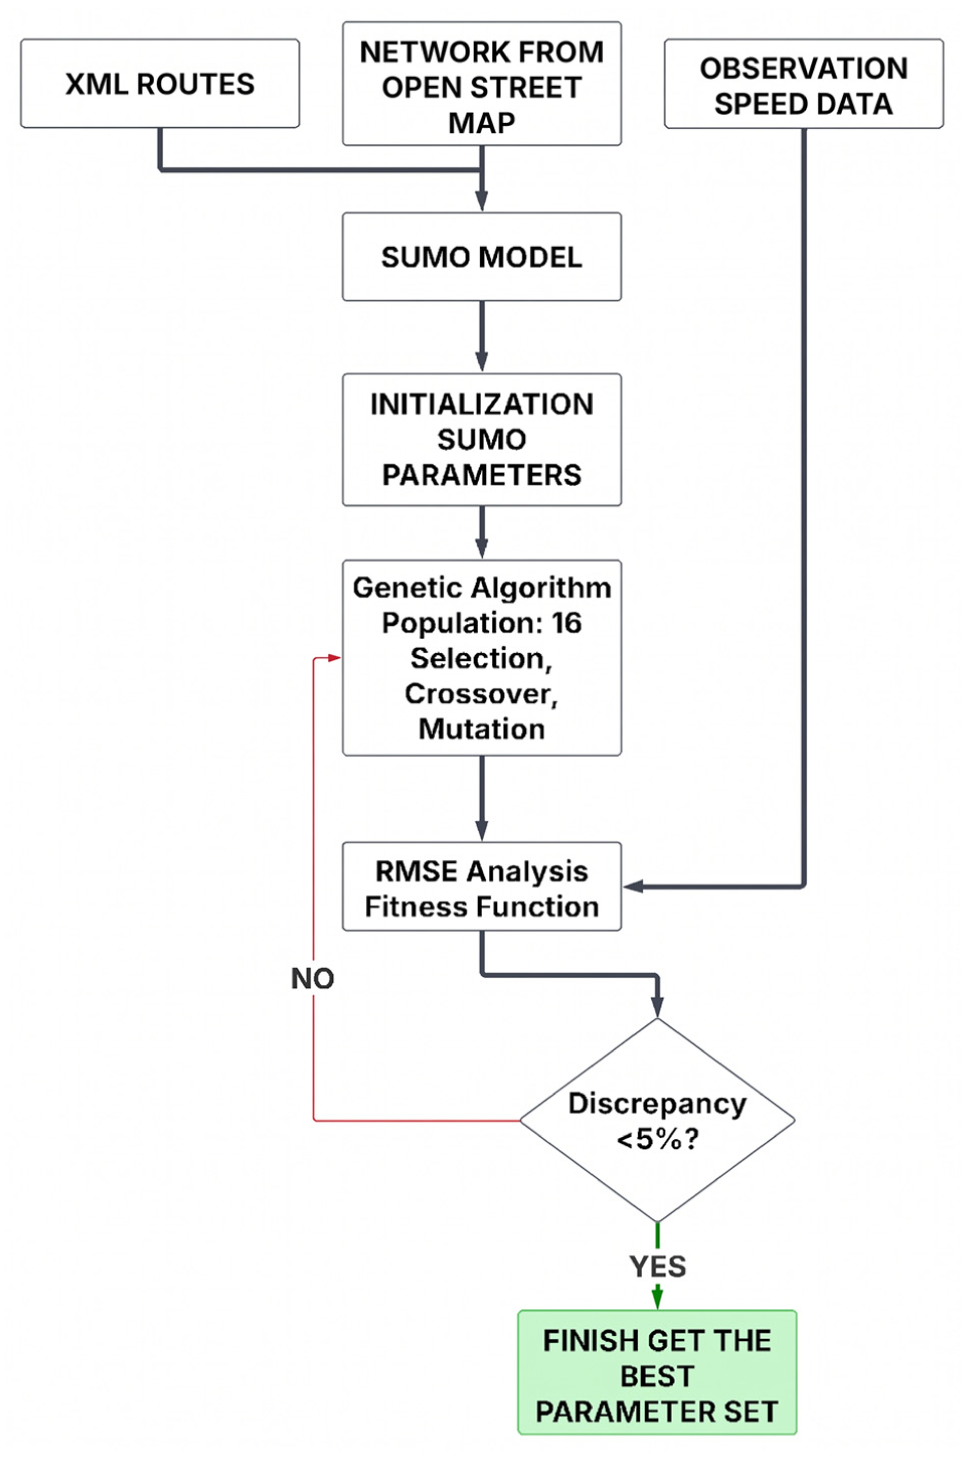
Genetic algorithm optimization workflow for SUMO model calibration, iteratively minimizing speed root mean square error (RMSE) through selection, crossover, and mutation until the discrepancy falls below 5%.
The calibration framework relies on empirical data to ensure alignment between simulated and observed traffic conditions. Two fundamental data sources underpin this process: traffic demand patterns and vehicular speed measurements. The Tennessee Department of Transportation (TDOT) provided comprehensive speed data, enabling rigorous validation of simulated travel times and velocity profiles. To ensure temporal consistency with demand patterns, speed measurements were aggregated at 5 min intervals, facilitating direct comparison between simulation outputs and field observations.
Given the availability of empirical demand and turning movement data, the calibration effort focused exclusively on identifying and optimizing critical simulation parameters, including capacity constraints, fundamental speed–flow relationships, and driver behavioral characteristics. While the SUMO-microscopic-simulation framework encompasses an extensive parameter space, not all variables exert meaningful influence on model outputs. Therefore, a systematic sensitivity analysis was conducted to identify parameters with statistically significant impacts on simulation performance. The sensitivity analysis employed a one-way ANOVA methodology to evaluate parameter influence. For this analysis, an isolated network segment was selected, and 75 sample configurations were generated for each parameter, spanning their feasible ranges from minimum to maximum values, including nominal settings. The ANOVA framework, with a significance threshold of
Model Parameters and Analysis of Variance (ANOVA) Analysis
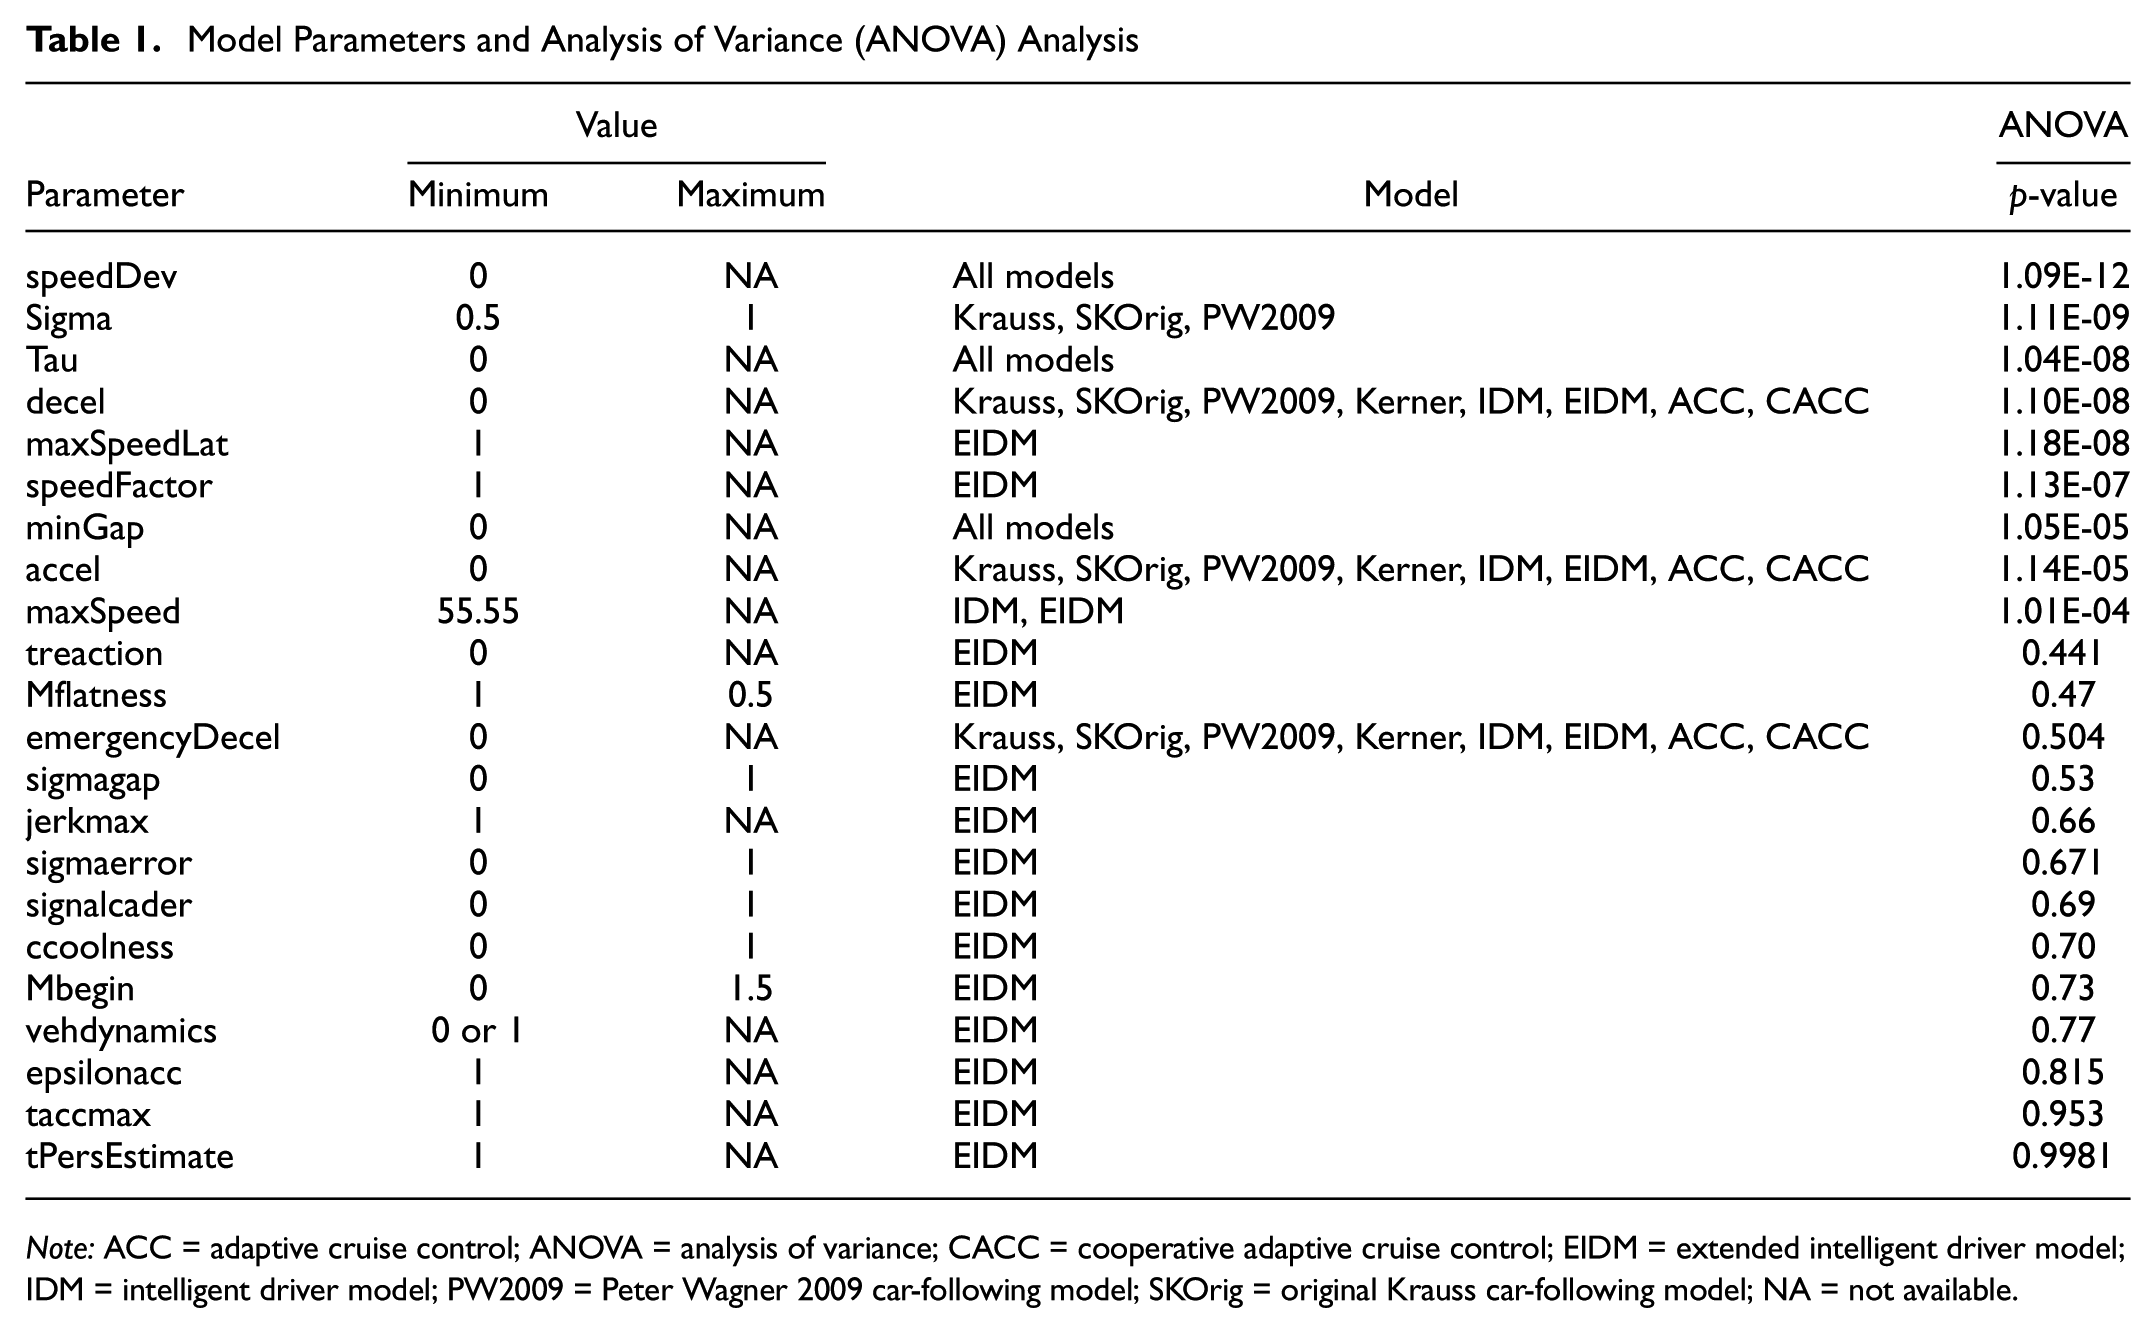
Note: ACC = adaptive cruise control; ANOVA = analysis of variance; CACC = cooperative adaptive cruise control; EIDM = extended intelligent driver model; IDM = intelligent driver model; PW2009 = Peter Wagner 2009 car-following model; SKOrig = original Krauss car-following model; NA = not available.
Following parameter identification, the optimization phase utilized the GA in conjunction with RMSE as the objective function. The GA implementation mimics natural evolutionary processes through genetic operations of inheritance, mutation, selection, and recombination, proving particularly effective for navigating high-dimensional parameter spaces while minimizing computational overhead ( 12 , 21 ). The GA architecture employs a hierarchical structure where individual binary genes (0 or 1) combine to form agents, with each agent representing a complete parameter configuration. Multiple agents constitute a generation, with the population size set to 16 agents per generation in this implementation. The evolutionary process operates through three fundamental genetic operators: 1) Selection, which probabilistically favors agents exhibiting superior fitness scores; 2) Crossover, which generates offspring by exchanging genetic material between parent agents; and 3) Mutation, which introduces stochastic variations in individual genes to maintain population diversity.
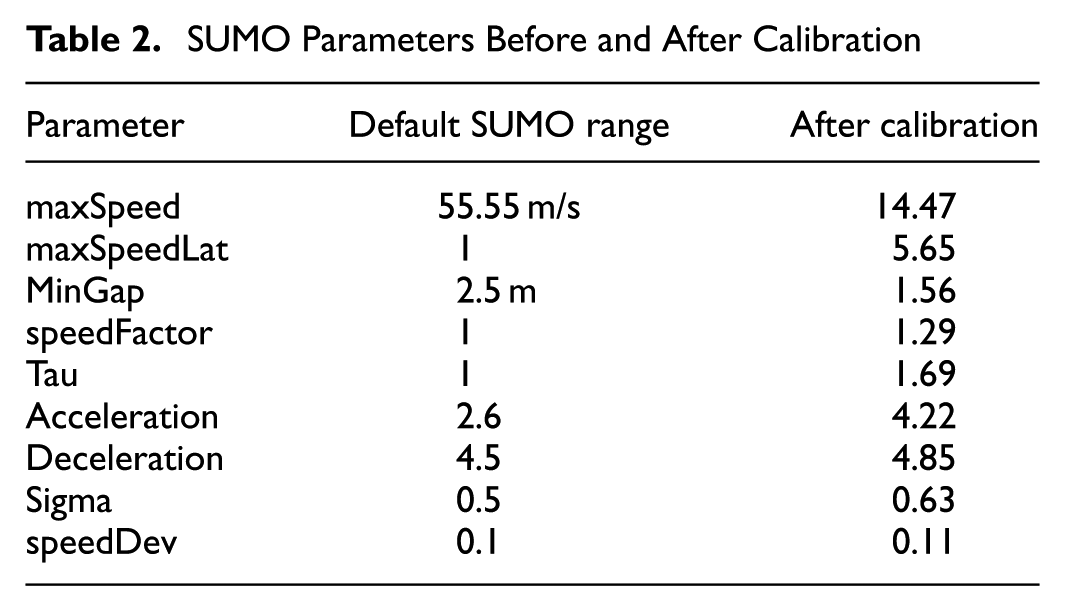
The RMSE metric between simulated and observed speeds served as the fitness function, guiding the evolutionary optimization toward parameter configurations that minimize prediction errors. Table 2 summarizes the parameter values obtained through the calibration process, contrasting them with SUMO’s default configurations.
SUMO Parameters Before and After Calibration
The calibration efficacy is demonstrated through temporal speed profile comparisons presented in Figure 8. The 24 h simulation period reveals substantial improvement in model accuracy: the pre-calibration average speed of 13.62 mph increased to 13.73 mph post-calibration, closely approximating the observed mean speed of 13.84 mph. This represents a prediction error of less than 1%, confirming the calibration procedure’s success in reproducing empirical traffic dynamics.
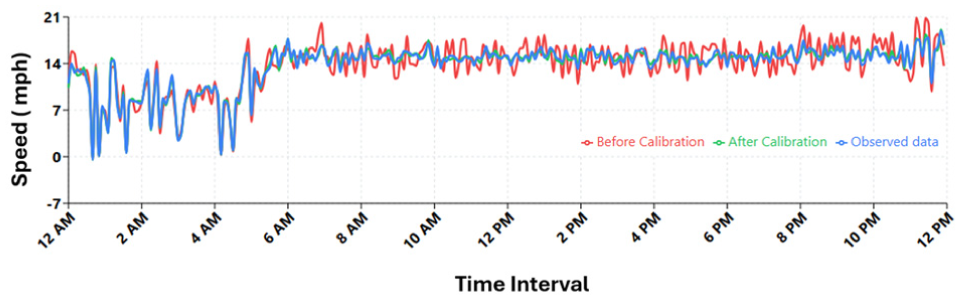
24 h corridor speed profiles comparing pre-calibration SUMO output, post-calibration SUMO output, and empirical INRIX observations, confirming sub-1% prediction error after calibration.
Validation
Model validation was performed by comparing simulated traffic volumes from SUMO with observed field data obtained from Gridsmart detectors. In the SUMO network, E1 data collection points were placed at the exact locations where Gridsmart data were available. This configuration enabled the extraction of 24 h simulated traffic volumes that are directly comparable to the empirical counts. The primary performance measure used for validation was the Geoffrey E. Havers (GEH) statistic, a widely adopted metric in traffic engineering for comparing two sets of traffic volumes ( 32 ). In this study, the GEH statistic was used to compare the field counts provided by the City of Chattanooga (via Gridsmart data) with the corresponding simulated turning movement volumes. The GEH statistic is defined as:

where
The GEH value can be interpreted to classify the level of agreement between simulated and observed volumes and to highlight potential problem locations. For base-year traffic models, a GEH value less than 5.0 is generally considered a good match, values between 5.0 and 10.0 indicate a moderate discrepancy, and values greater than 10.0 suggest a substantial mismatch ( 13 ). According to FHWA guidance, calibration is typically deemed acceptable when more than 85% of the comparisons yield GEH values below 5.0 ( 31 ).
In this study, validation focused on two critical intersections: Tremont and Market. The average GEH value at the Tremont location was 3.30, while at the Market location it was 2.29. At the Tremont intersection, approximately 89% of simulated volumes achieved GEH
Simulation Scenarios
This investigation employed a three-scenario analytical framework designed to rigorously evaluate the road diet intervention and validate the simulation methodology. Following successful calibration and validation procedures, we developed two primary SUMO network models: one representing the pre-intervention baseline conditions (four-lane configuration) and another capturing the post-intervention state (two-lane configuration with protected left-turn lanes), as illustrated in Figure 4.
Scenario 1: Before Road Diet (baseline). This scenario utilized the four-lane network configuration with actual pre-intervention traffic demand data collected from April to October, 2024. This represents the ground-truth baseline condition against which all improvements are measured.
Scenario 2: After Road Diet (post-implementation). This scenario employed the modified two-lane network configuration with actual post-intervention traffic demand data collected from October 2024 to June 2025. This represents the real-world conditions following the road diet implementation.
Scenario 3: Diet Network with Before Demand (validation). This critical validation scenario applied the pre-intervention traffic demand (from Scenario 1) to the post-intervention network geometry (from Scenario 2). This hybrid configuration serves a dual purpose. First, it isolates the geometric contribution of the road diet by holding demand conditions constant at their pre-intervention levels while altering only the network configuration. Second, it provides an internal validation of the modeling framework: because the After Road Diet and Diet Network with Before Demand scenarios share the same network geometry but differ in their demand profiles, the close agreement of their performance metrics indicates that the observed improvements are predominantly driven by the road diet infrastructure rather than by reduced demand or modeling artifacts.
Road Diet Operational Impact Assessment Using Micro Simulation
Overview and Model Validation
Figure 9 illustrates hourly variations in average speed (mph), average travel time (seconds), and average waiting time (seconds) across three scenarios: Before Road Diet, After Road Diet, and Hybrid Scenario. The results demonstrate that the Before Road Diet scenario consistently maintains higher average speeds, while speeds notably decrease under the road diet configuration. Importantly, the traffic performance measures obtained from the Diet Network with Before Demand scenario closely align with those from the After Road Diet scenario, confirming the robustness and validity of the developed SUMO simulation model. This close similarity indicates that the simulation accurately represents the road diet configuration and can reliably reflect the real-world operational conditions, supporting the conclusion that the calibrated SUMO model effectively captures the impact of road diet interventions on traffic performance.
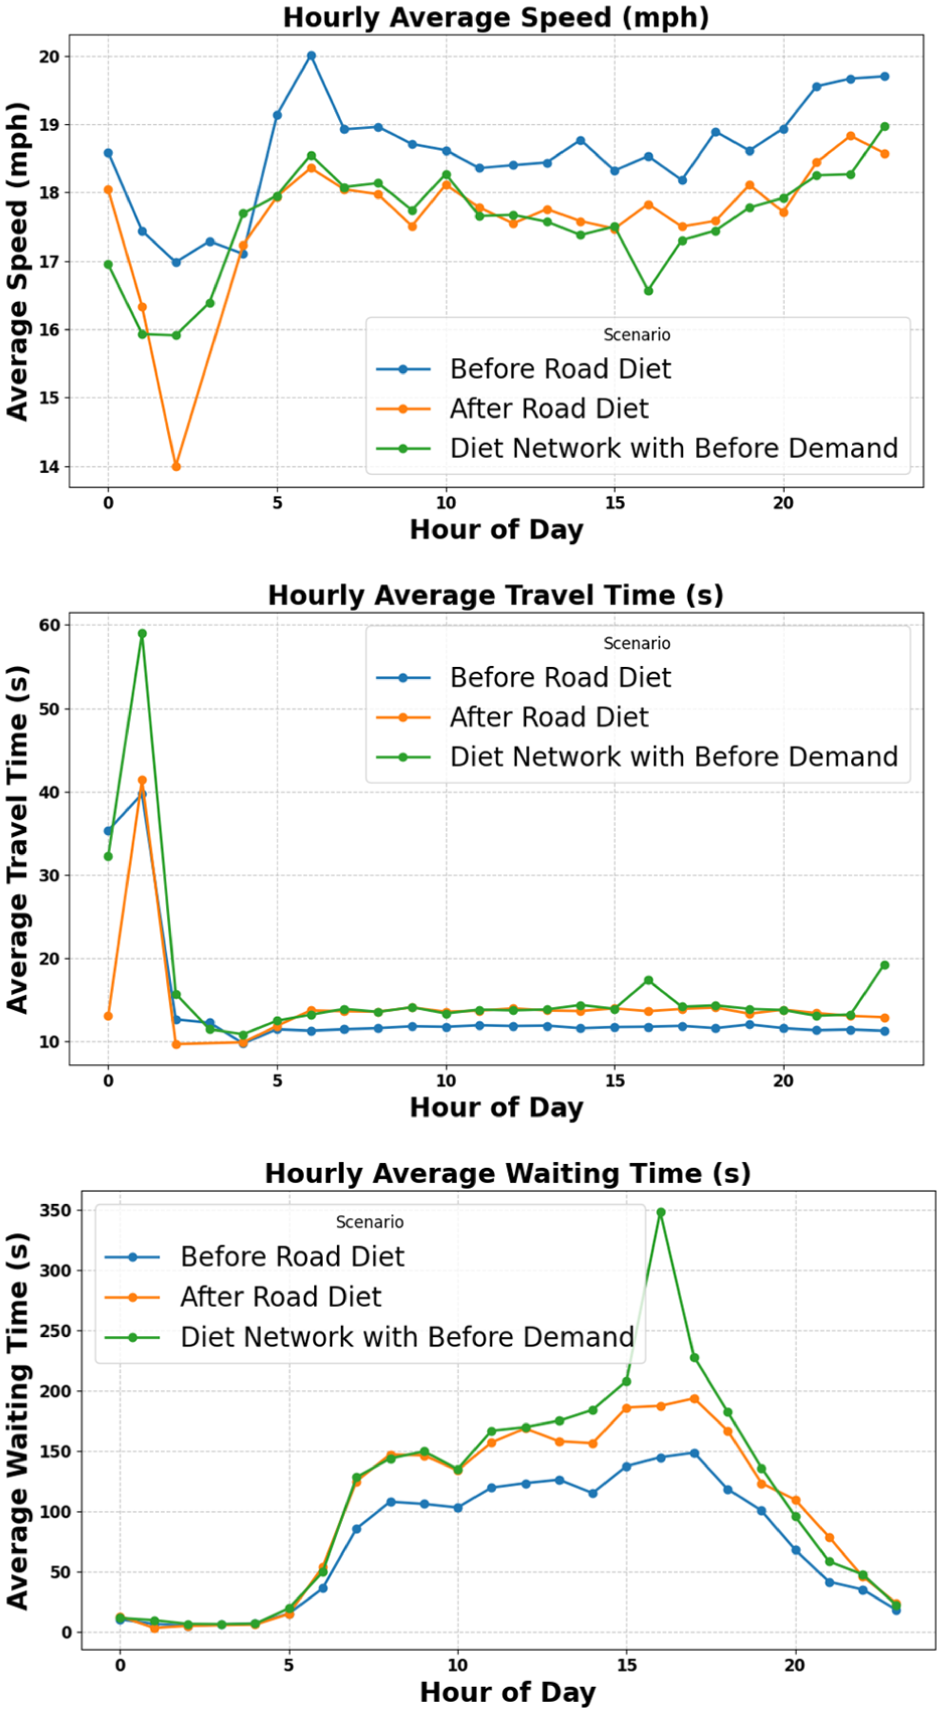
Hourly traffic performance comparison across three scenarios: hourly average speed (top), hourly average travel time (middle), and hourly average waiting time (bottom).
Corridor-Wide Performance Impact
To provide decision-makers with comprehensive traffic performance metrics for the main corridor, three analytical perspectives are presented: the overall corridor performance (Table 3), westbound directional analysis (Table 4), and eastbound directional analysis (Table 5). The corridor-wide analysis reveals moderate impacts from road diet implementation. Average travel time increased marginally from 13.36 to 13.94 s, while waiting time experienced a more substantial increase from 82.65 to 116.32 s. Lane density nearly doubled from 5.84 to 7.73 vehicles per kilometer per lane (vpkmpl), reflecting the capacity reduction from four to three lanes. Average speed decreased modestly from 19.09 to 18.10 mph, indicating maintained mobility despite geometric constraints.
Frazier Corridor overall Traffic Performance Metrics
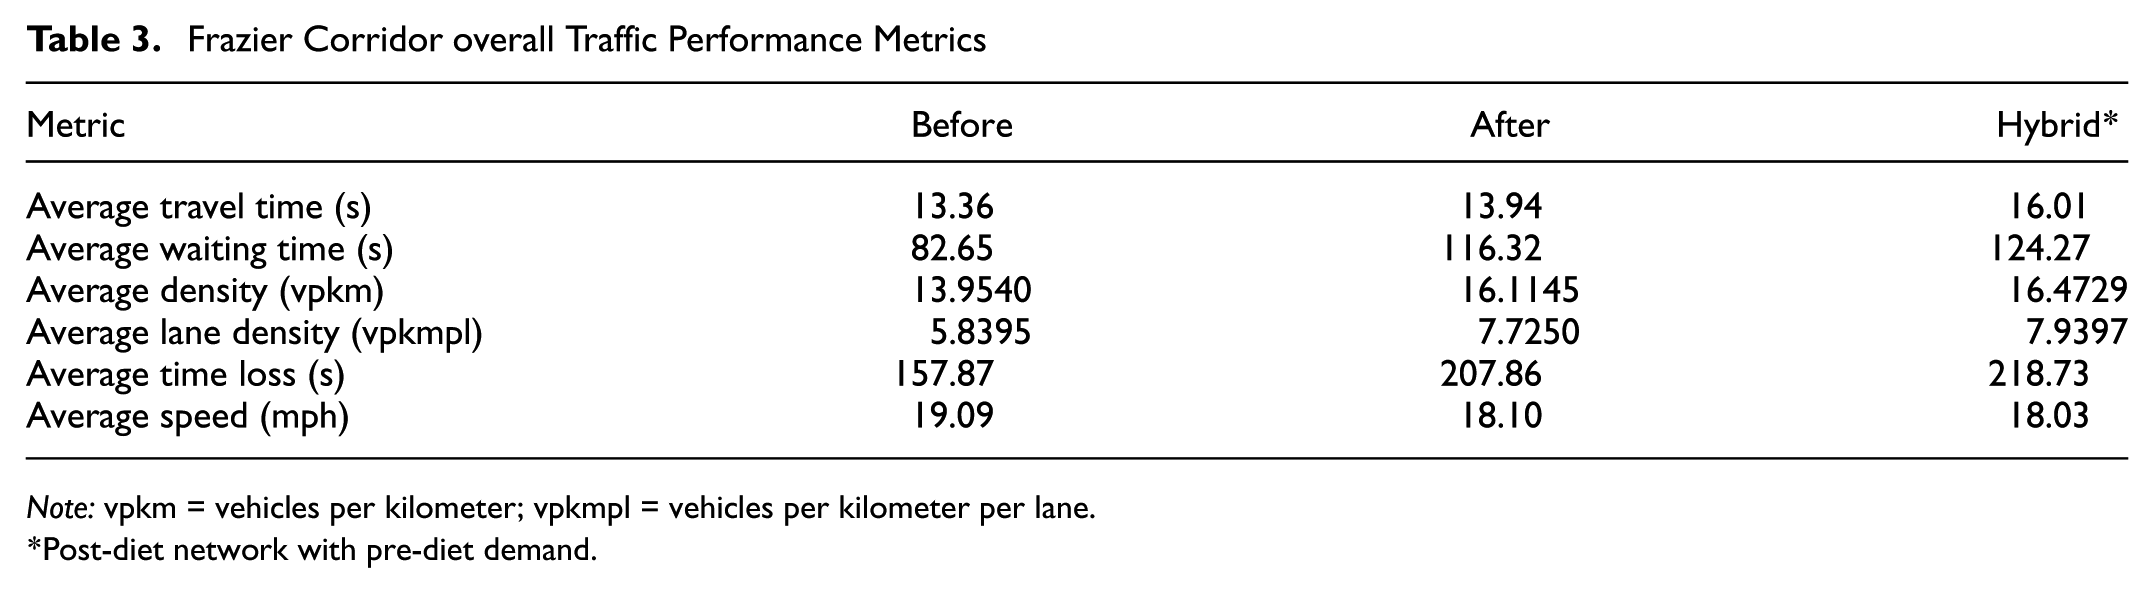
Note: vpkm = vehicles per kilometer; vpkmpl = vehicles per kilometer per lane.
*Post-diet network with pre-diet demand.
Westbound Traffic Performance Metrics
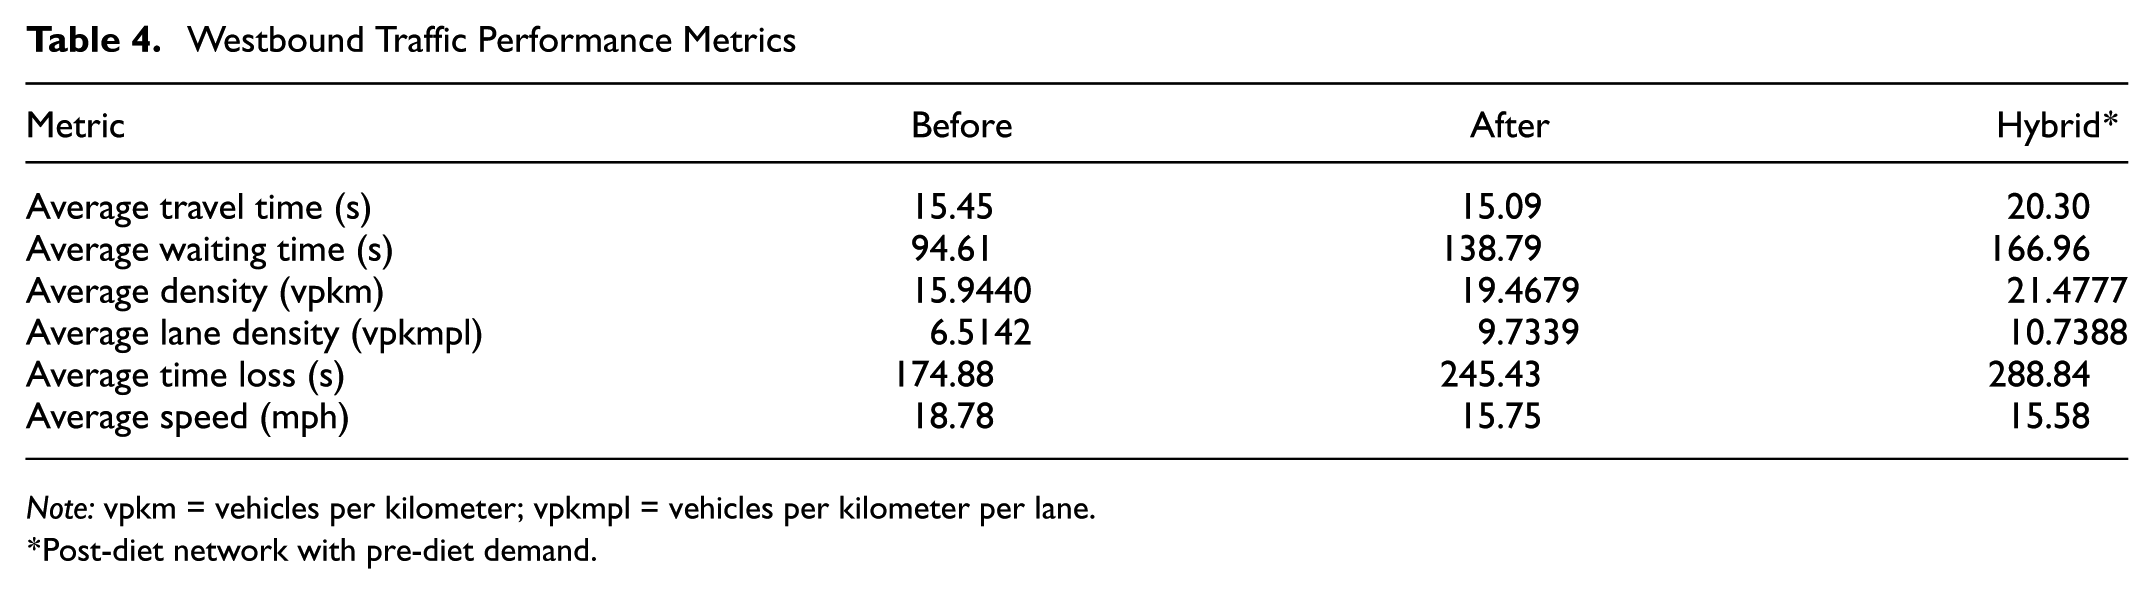
Note: vpkm = vehicles per kilometer; vpkmpl = vehicles per kilometer per lane.
*Post-diet network with pre-diet demand.
Eastbound Traffic Performance Metrics
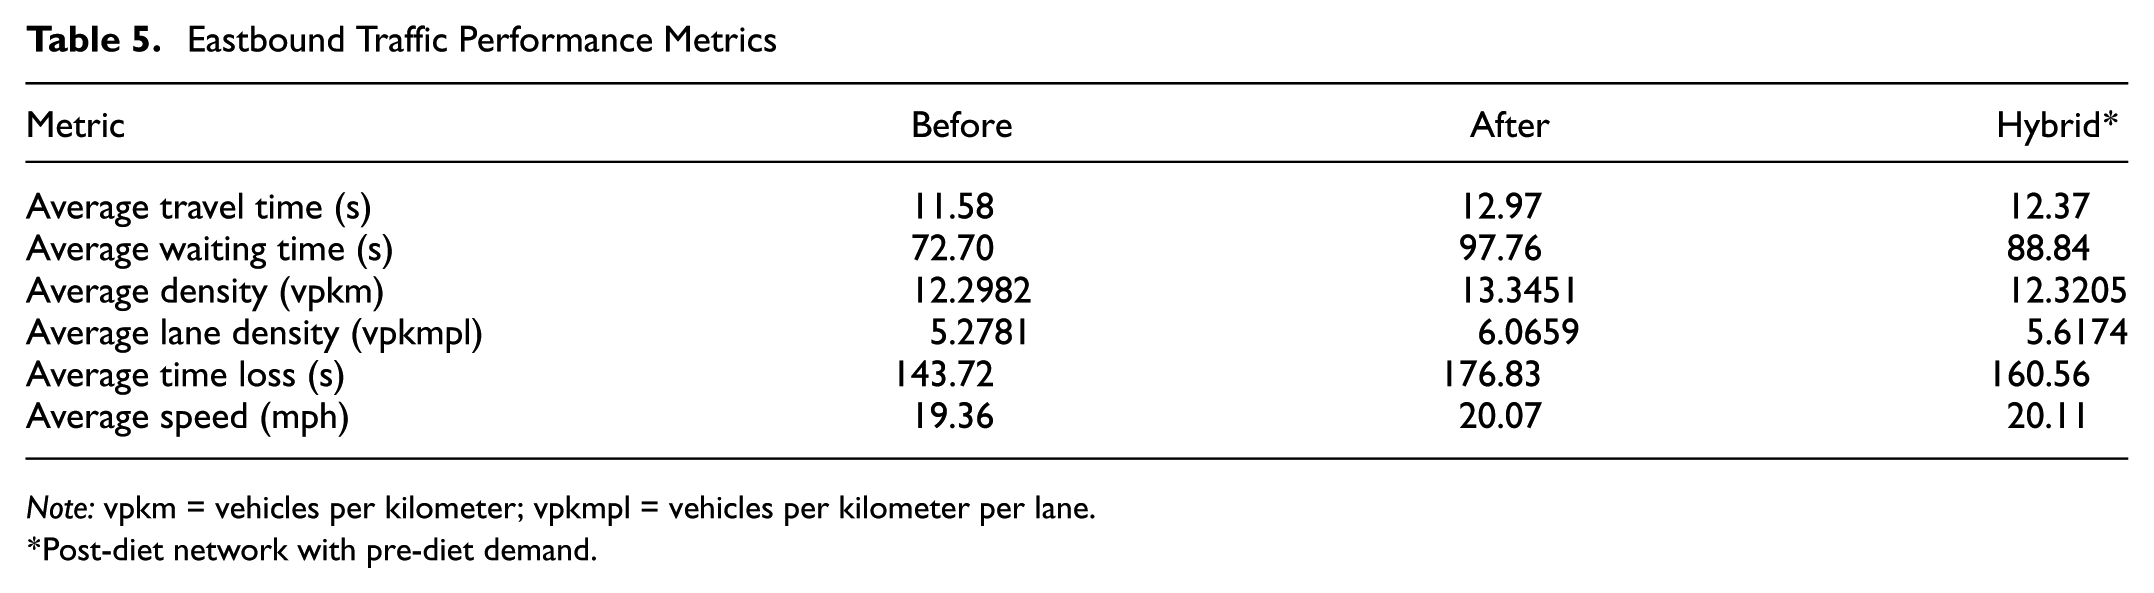
Note: vpkm = vehicles per kilometer; vpkmpl = vehicles per kilometer per lane.
*Post-diet network with pre-diet demand.
Directional Performance Analysis
The road diet implementation demonstrates asymmetric impacts across traffic directions, as shown in Tables 4 and 5.
Queue Length Analysis
Figure 10 presents a detailed analysis of queue length impacts at key intersections along the corridor, covering both eastbound and westbound directions before and after the road diet implementation. The results reveal notable variations across different intersections.
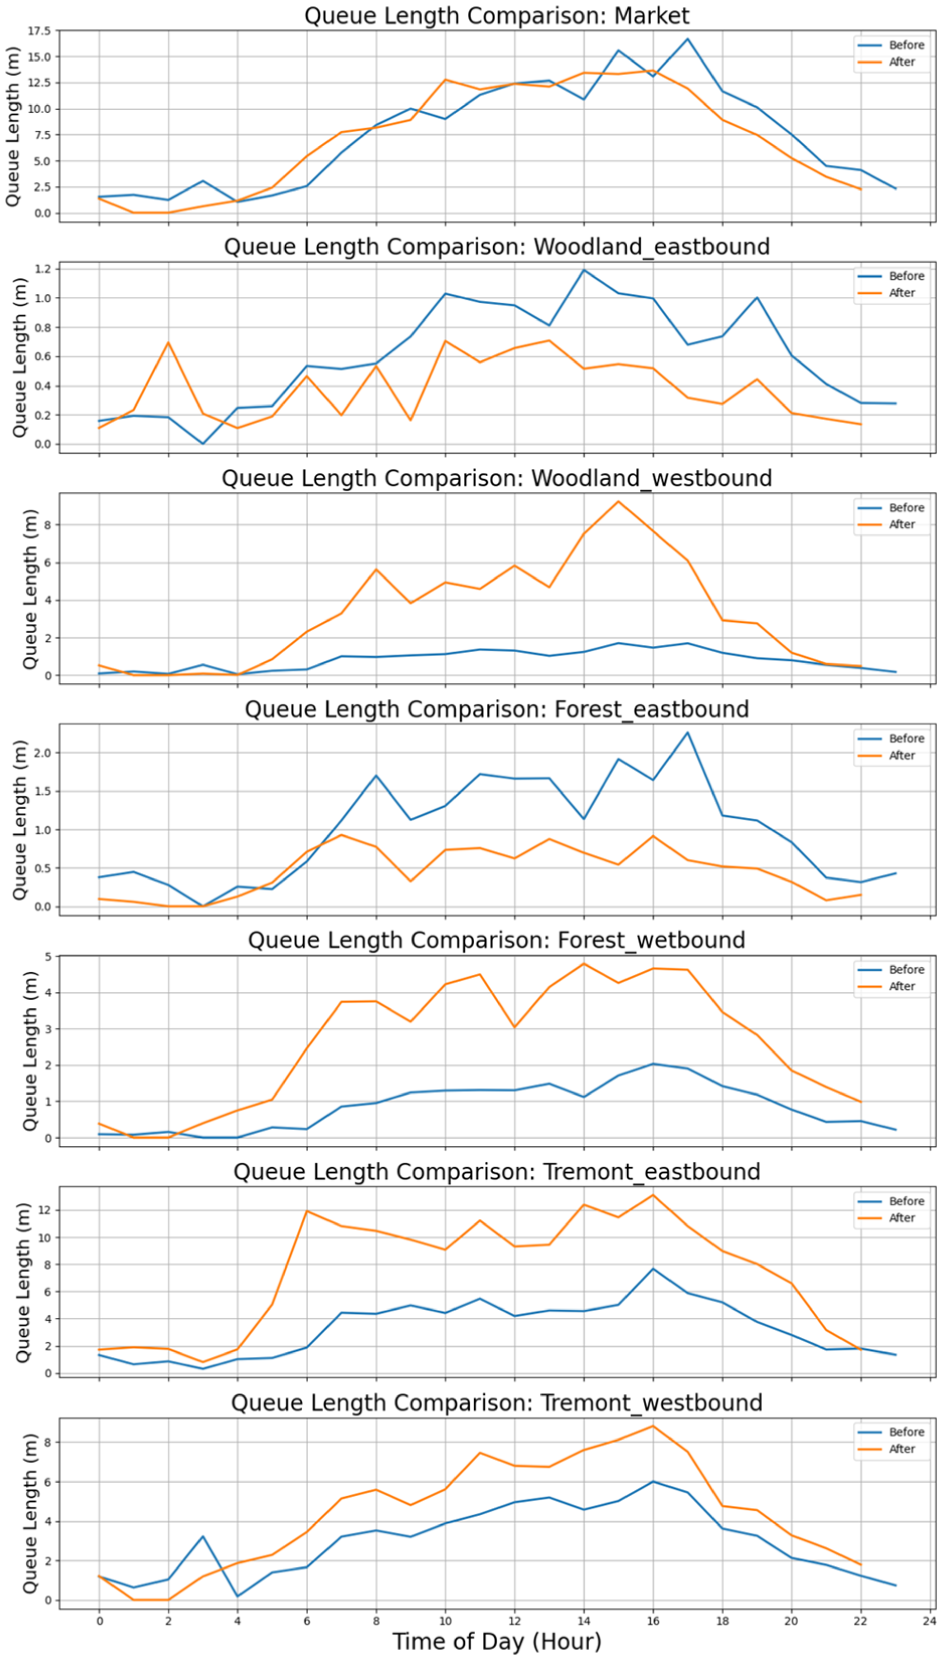
24 h queue length profiles at seven corridor approaches before and after the road diet.
Market intersection—being the largest junction within the studied corridor—exhibited a modest reduction in queue length after the road diet, with an average decrease of approximately 4%.
Woodland intersection showed divergent impacts by direction—eastbound experienced a substantial 37% reduction in queue lengths, while westbound experienced a significant 303% increase, indicative of altered traffic dynamics.
Forest intersection demonstrated mixed outcomes with eastbound queue lengths decreasing by 53%, whereas westbound experienced a 208% increase.
Tremont intersection showed increases in both directions, with eastbound experiencing a 125% rise and westbound witnessing a 48% increase post-implementation.
Validation Against Previous Research
Based on the calculation of queue changes during afternoon peak hours from 3 to 7 p.m., previous research relied solely on pre-road-diet data from Frazier Avenue and demonstrated an overall simulated queue increase of approximately 50.31% ( 12 ). In this current research, using actual post-road-diet data for the same period, an increase of approximately 63% was observed. The close alignment between the simulated results (approximately 50%) and the actual data indicates the robustness and reliability of simulation models as effective tools for aiding decision-makers in evaluating traffic management strategies.
Demand Elasticity Insights
The After Road Diet Network with Before Demand scenario provides insights into pure geometric effects versus demand response. Comparing this scenario with actual post-implementation conditions reveals that traffic demand exhibits some elasticity, as performance metrics are generally worse when pre-implementation demand levels are maintained on the modified network. This suggests partial demand management through route choice or temporal shifting occurs following road diet implementation.
Sensitivity Analysis of Road Diet Configuration
To evaluate the robustness of the road diet configuration under hypothetical future traffic conditions, a comprehensive sensitivity analysis was conducted by systematically varying traffic demand levels on the post-intervention network. Four demand scenarios were simulated—baseline (0%), moderate growth (+10%), high growth (+20%), and maximum capacity (+30%)—corresponding to daily vehicle counts of 15,177, 16,694, 18,212, and 19,729 vehicles, respectively. The +30% scenario approaches the FHWA’s recommended 20,000 ADT threshold for road diet implementations, providing insight into the corridor’s performance limits under the modified geometry.
Segment-Level Analysis
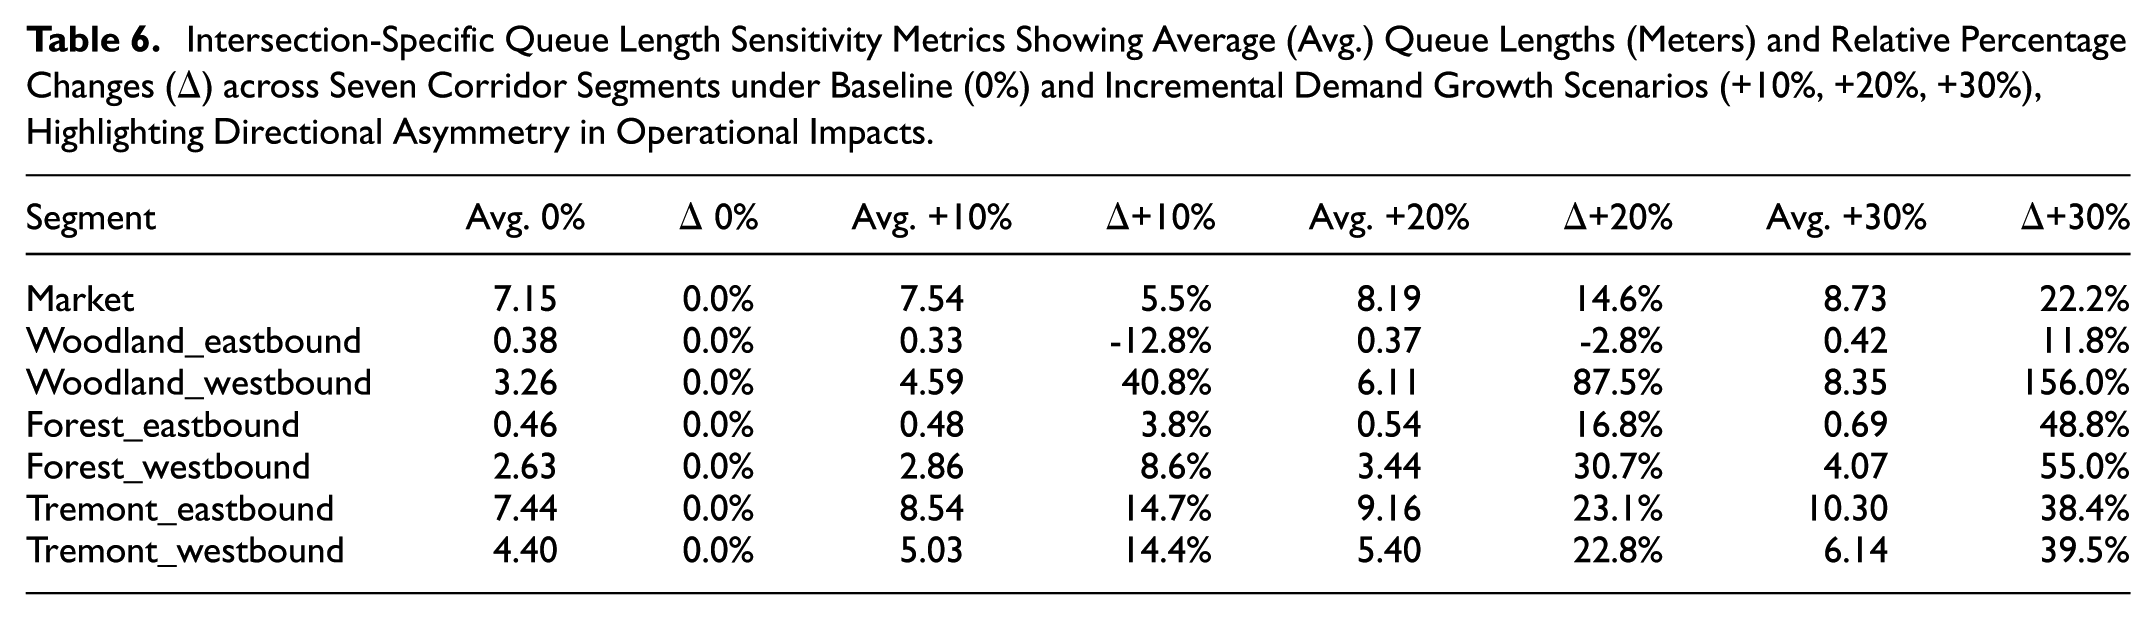
Table 6 provides a disaggregated analysis of queue length sensitivity across individual corridor segments. The results reveal substantial heterogeneity in segment-level responses to demand increases. Woodland westbound emerges as the most sensitive location, with queue lengths increasing by 40.8%, 87.5%, and 156.0% under the +10%, +20%, and +30% scenarios, respectively. This pronounced sensitivity suggests that westbound movements at this intersection represent a critical bottleneck under elevated demand conditions. Similarly, Forest westbound and Tremont eastbound exhibit considerable sensitivity, with increases of 55.0% and 38.4%, respectively, at the +30% demand level. Conversely, certain segments demonstrate relative resilience to demand fluctuations. Woodland eastbound shows minimal sensitivity, with queue lengths remaining nearly constant across scenarios (−2.8% at +20%, +11.8% at +30%). This directional asymmetry corroborates the findings from the primary analysis, which identified westbound movements as bearing disproportionate operational impacts from the road diet configuration.
Intersection-Specific Queue Length Sensitivity Metrics Showing Average (Avg.) Queue Lengths (Meters) and Relative Percentage Changes (
Corridor-Wide Performance
Table 7 presents the corridor-wide queue length metrics across all demand scenarios. The results reveal a non-linear relationship between demand increases and operational degradation. While a 10% demand increase produces a 14.4% increase in average queue length (3.67 to 4.20 m), the +30% scenario yields a disproportionate 50.7% increase in average queue length (5.53 m). Maximum queue lengths exhibit even greater sensitivity, increasing from 13.65 m at baseline to 33.62 m under the +30% scenario, representing a 146% increase. This non-linear escalation indicates that the road diet configuration maintains operational stability under moderate demand growth but approaches capacity constraints as volumes approach the 20,000 ADT threshold.
Corridor-Wide Queue Length Metrics under Incremental Demand Growth Scenarios
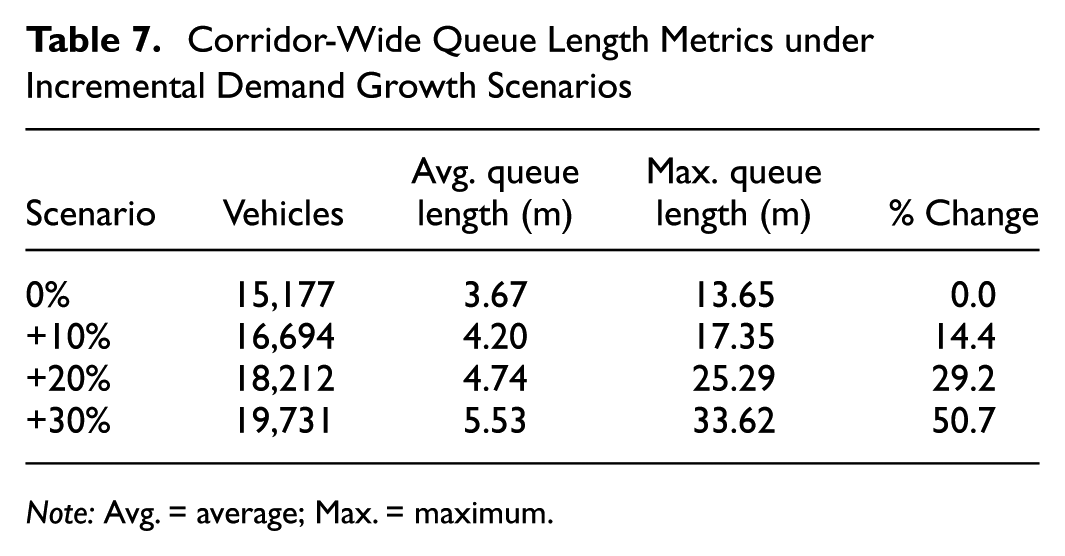
Note: Avg. = average; Max. = maximum.
Temporal Patterns
Figure 11 illustrates the hourly queue length variations across all demand scenarios. The temporal analysis reveals that sensitivity to demand increases is most pronounced during peak periods, particularly between 10:00 a.m. and 6:00 p.m. Under the +30% scenario, afternoon peak queues at Woodland westbound and Tremont westbound exceed 15–20 m, compared with approximately 5–8 m under baseline conditions. Off-peak periods (before 6:00 a.m. and after 8:00 p.m.) remain largely unaffected across all scenarios, indicating that the road diet maintains adequate capacity during low-demand periods regardless of overall volume increases.
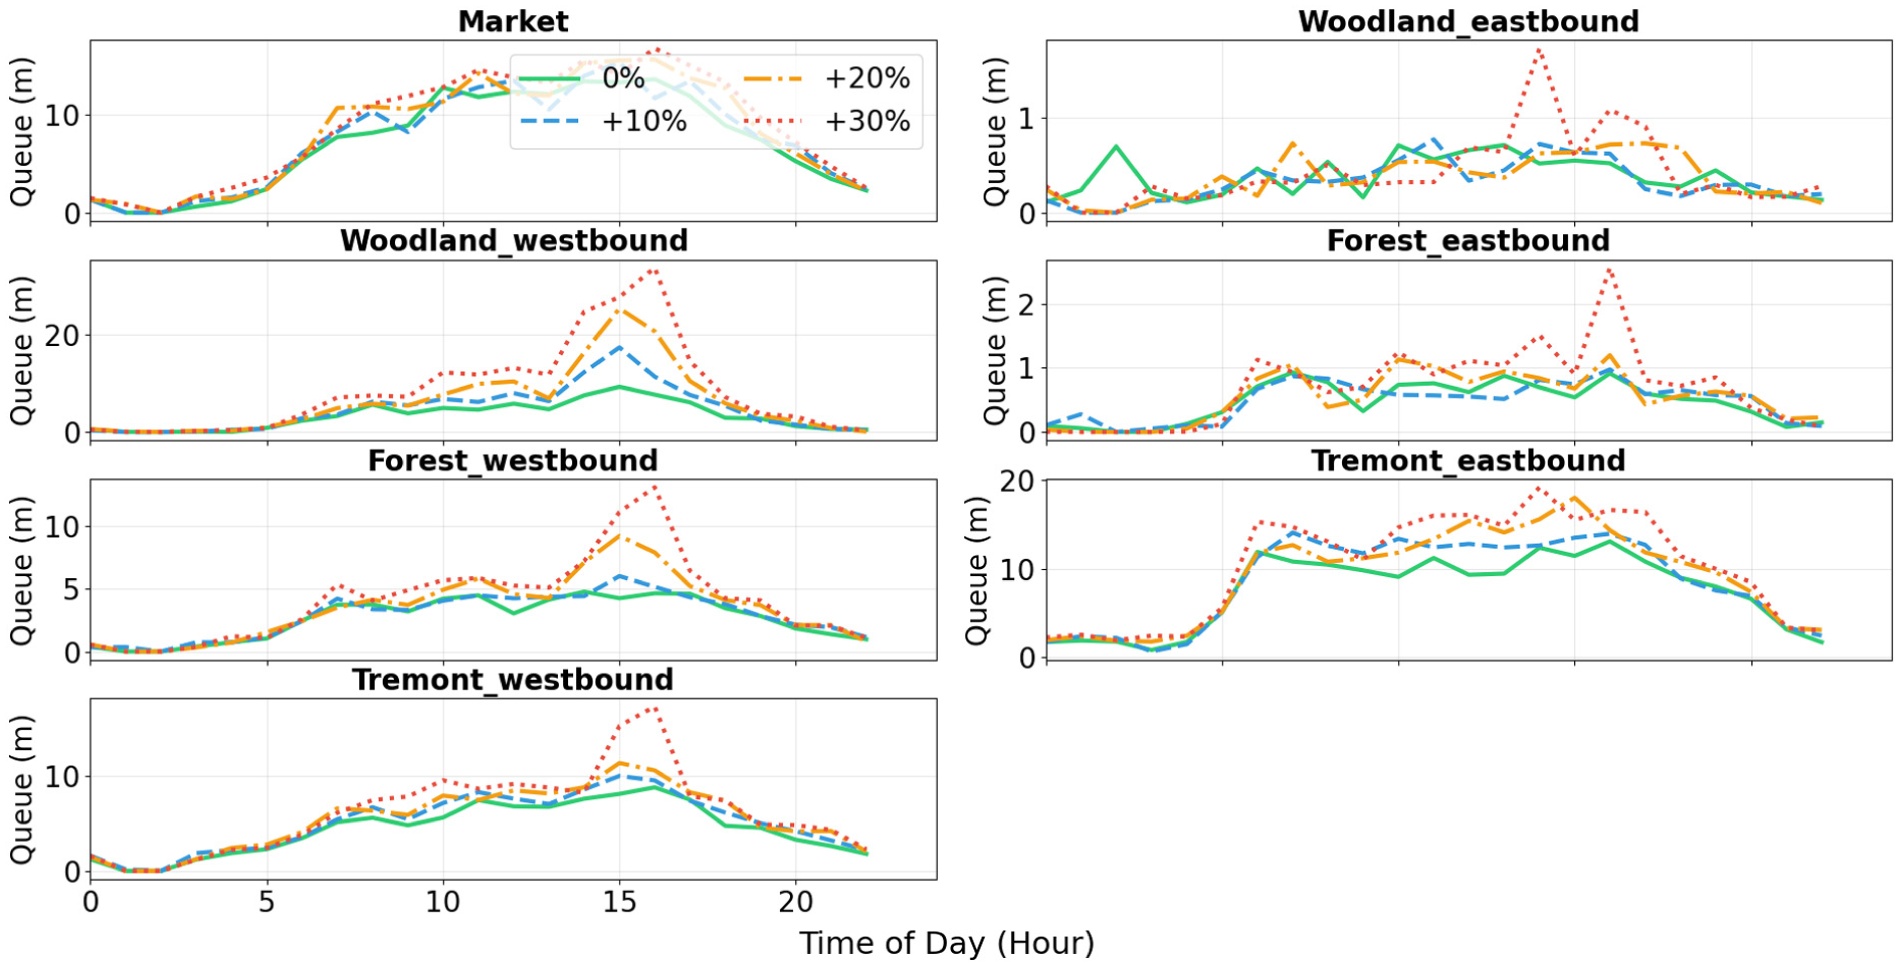
Temporal sensitivity analysis of queue lengths at corridor intersections under four demand scenarios: baseline (0%), moderate growth (+10%), high growth (+20%), and maximum capacity (+30%) corresponding to 15,177–19,729 daily vehicles.
Insights for Transportation Planners
The sensitivity analysis provides several insights for transportation planners considering the long-term viability of the Frazier Avenue road diet.
Capacity Buffer
The corridor currently operates with approximately 32% capacity buffer before reaching the FHWA-recommended 20,000 ADT threshold. Assuming modest annual traffic growth of 1%–2%, this buffer suggests the road diet can accommodate projected demand for approximately 10–15 years before significant operational degradation occurs.
Critical Thresholds
Operational metrics remain within acceptable bounds up to approximately +20% demand growth. Beyond this threshold, queue lengths and delays increase at an accelerating rate, suggesting that proactive demand management strategies may be warranted if traffic volumes approach 18,000–19,000 ADT.
Targeted Interventions
The identification of Woodland westbound as a critical sensitivity hotspot suggests that localized signal timing optimization or turn lane modifications at this intersection could enhance corridor resilience under future demand growth scenarios.
SSM Device and Safety Analysis Using TTC
A “traffic conflict” is defined as a scenario in which two road users would likely collide without appropriate evasive maneuvers. Traffic conflict analysis, initiated in the late 1960s, has become an established method for assessing road safety, based on the correlation between conflict frequency and actual collision risk ( 23 , 24 ).
In traffic simulation software such as SUMO, vehicles can be instrumented with SSM devices. These devices record conflicts involving the equipped vehicle and other traffic entities, currently limited to vehicle-to-vehicle interactions, along with corresponding safety surrogate measures. SUMO identifies conflicts based on predefined thresholds, including TTC, deceleration rate to avoid crash (DRAC), modified DRAC, post encroachment time, brake rate, spacing gap, and time gap. Traffic conflicts in SUMO are categorized into three primary interaction types: 1) lead/follow situations, where vehicles traverse identical lane sequences before and after the conflict point; 2) crossing situations, where vehicles traverse different lane sequences intersecting at the conflict point; and 3) merging situations, where vehicles initially travel on separate lanes but merge into a shared lane after the conflict point. Each conflict scenario in SUMO includes specific entry points, with additional exit points defined for crossing and merging conflicts. Entry and exit points for the vehicles involved (termed “ego” and “foe” vehicles) may differ slightly because of being referenced from the vehicles’ front or rear bumpers rather than their exact collision points. Distances such as entryDist (distance from the vehicle’s front bumper to the entry point), exitDist (dependent on encounter type), mergePoint (initial common lane of the vehicles), and crossingPoint (intersection of conflicting lane trajectories adjusted for vehicle dimensions) are used to precisely define conflict locations. SUMO further classifies conflicts by assigning encounter type codes to clarify and enable proper interpretation of the measured surrogate safety values.
In this study, the TTC measure was specifically utilized for intersection conflict analysis. TTC is calculated differently based on the interaction type. For lead/follow interactions, TTC is calculated using the following formula:

For crossing or merging interactions, TTC is defined only if the expected exit time of the first-arriving vehicle (vehicle A) from the conflict area exceeds the expected entry time of the second vehicle (vehicle B). Under these conditions, TTC is calculated as:

SUMO provides detailed output for TTC, including minTTC (time at which the minimum TTC occurs), position (coordinates of the conflict point), type (encounter type code), value (minimum TTC measured), and speed (vehicle speed at the moment minimum TTC is recorded).
In this simulation, we focused on the largest intersection on Frazier Avenue, namely the Market intersection. Figure 12 illustrates the number of vehicle conflicts, measured by instances where the TTC fell below the safety threshold of 3 s throughout the 24 h simulation period. The analysis reveals a substantial reduction in conflicts following the implementation of the road diet. Specifically, the total number of conflicts decreased significantly from 1,754 incidents before the road diet to 953 incidents afterward, representing an overall reduction of approximately 45.7%. Similarly, the peak conflicts recorded within any 5 min interval declined notably from 26 to 18 conflicts. Additionally, the average conflicts per 5 min interval decreased from 8.0 to 4.4, demonstrating improved safety and smoother vehicle interactions at this intersection. Importantly, the figure highlights specific periods of heightened conflict occurrences, indicated by shaded intervals. These critical times predominantly coincide with midday hours, encompassing late morning through afternoon, and highlight periods with elevated risks because of intensified vehicle interactions.
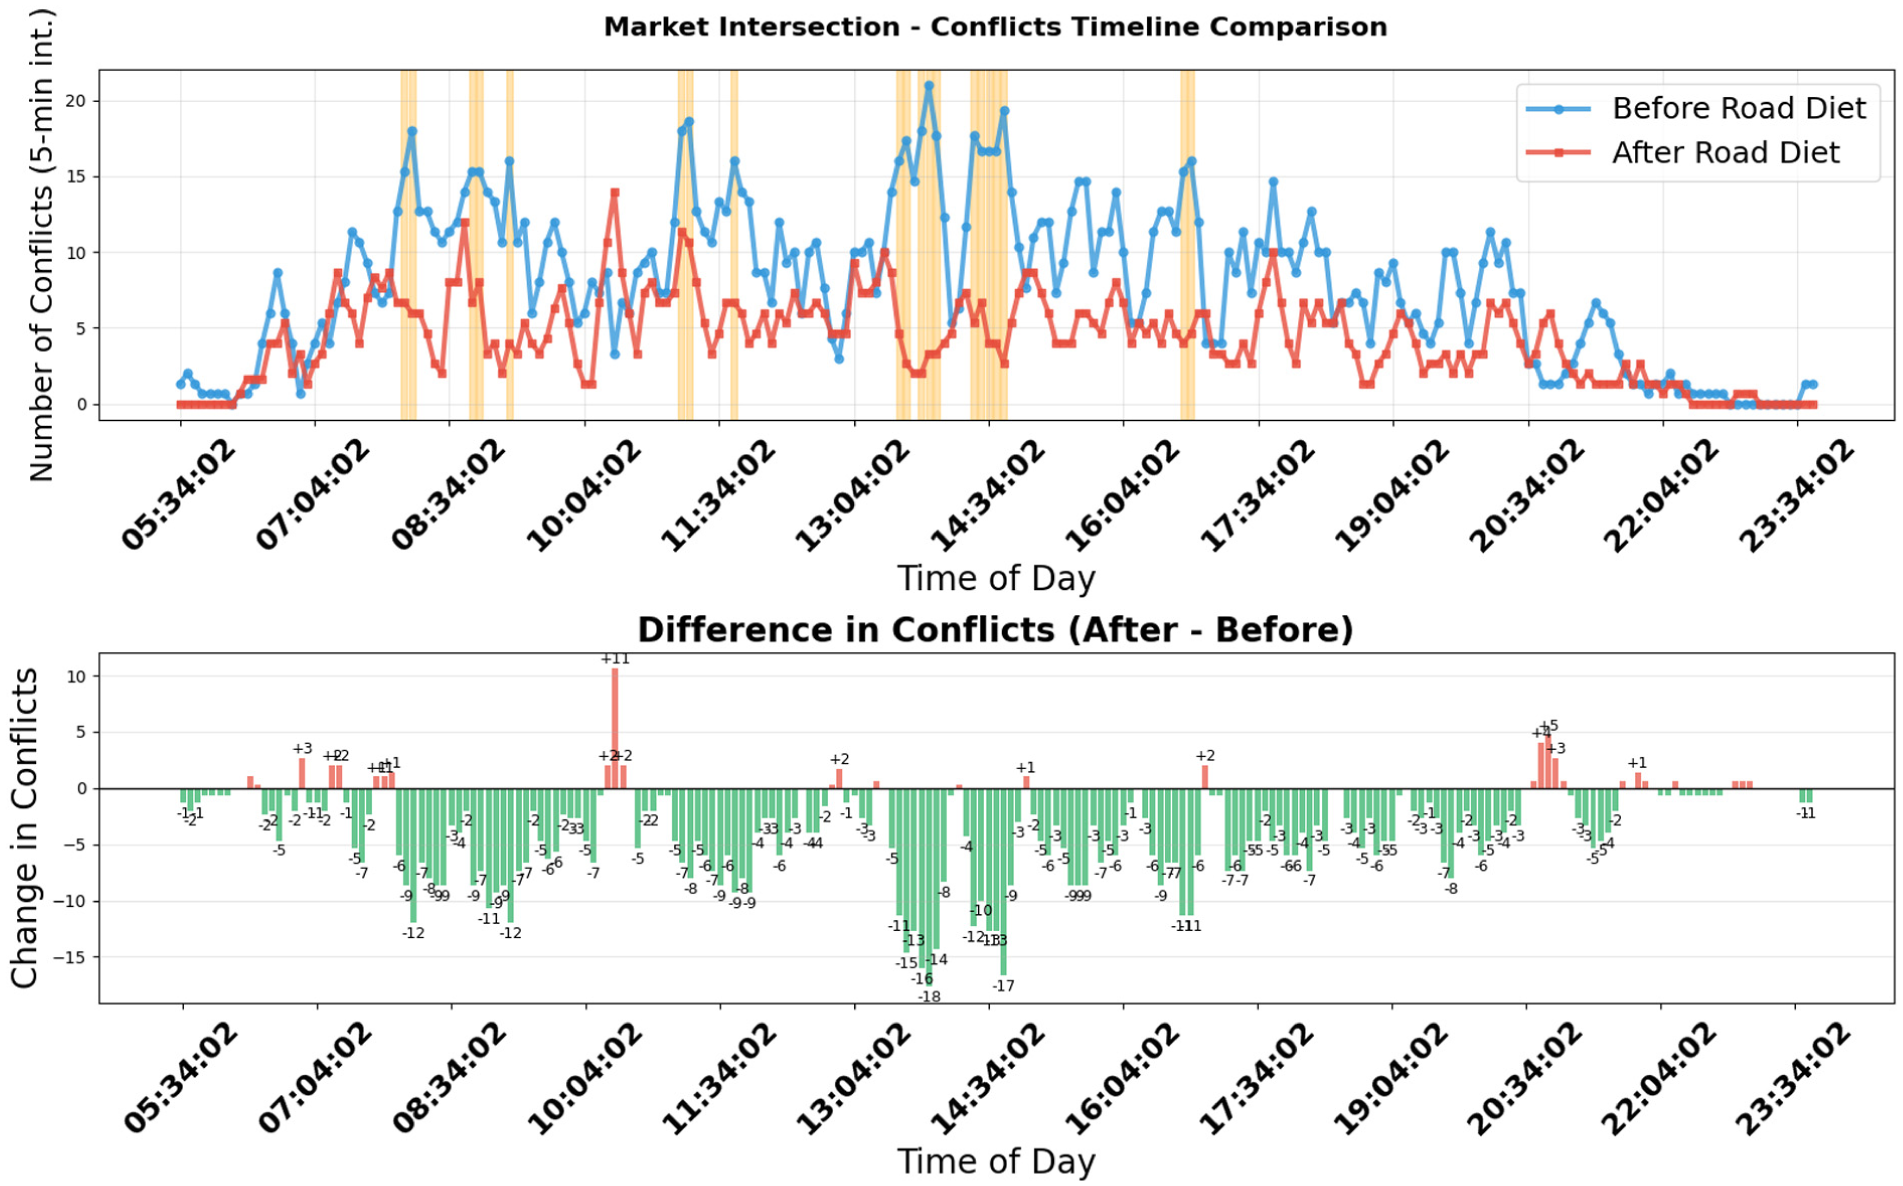
24 h time-to-collision-based conflict frequency timeline at the Market Street intersection before and after the road diet (top) and interval-level difference plot showing a net reduction of 801 conflicts (45.7%) post-implementation (bottom).
Figure 13 presents a detailed breakdown of conflict severity at the Market intersection, classified based on TTC intervals, to distinctly quantify conflict aggressiveness and identify potentially aggressive driver behavior. The analysis categorizes conflicts into three severity levels: critical (TTC <1 s), moderate (TTC 1–2 s), and low (TTC 2–3 s). Before the road diet was implemented, critical conflicts constituted the largest proportion, totaling 790 events. Such critical interactions indicate high-risk situations and aggressive driving behaviors. Following the road diet, critical conflicts decreased dramatically to 298 incidents, clearly demonstrating a substantial improvement in intersection safety. Moderate- and low-severity conflicts also showed notable reductions, decreasing from 424 to 325 and from 540 to 330 incidents, respectively.
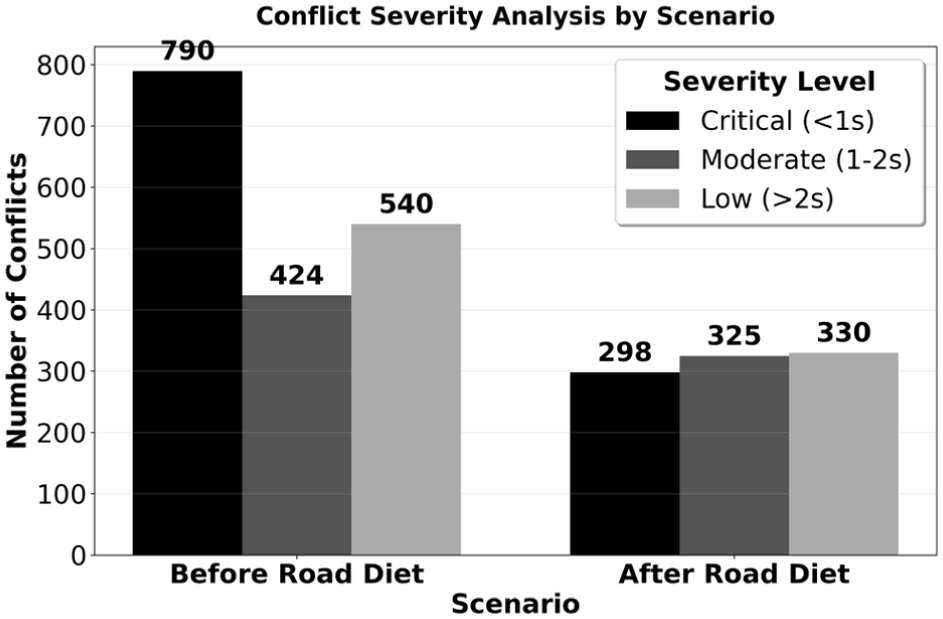
Conflict severity distribution at Market Street intersection by time-to-collision category—critical (<1 s), moderate (1–2 s), and low (2–3 s)—showing a 62.3% reduction in critical conflicts following road diet implementation.
In analyzing the spatial distribution of conflicts at the Market intersection, we provide a detailed examination utilizing several visual representations.
Firstly, Figure 14 illustrates the precise locations of conflicts within the intersection boundary before and after the road diet implementation. It is evident that conflicts in the Before Road Diet scenario are dispersed more broadly and numerously across the intersection. Also, some right turn movement conflict can be seen in the intersection whereas conflicts in the After Road Diet scenario are fewer and more centralized, indicating more predictable and controlled vehicle interactions.
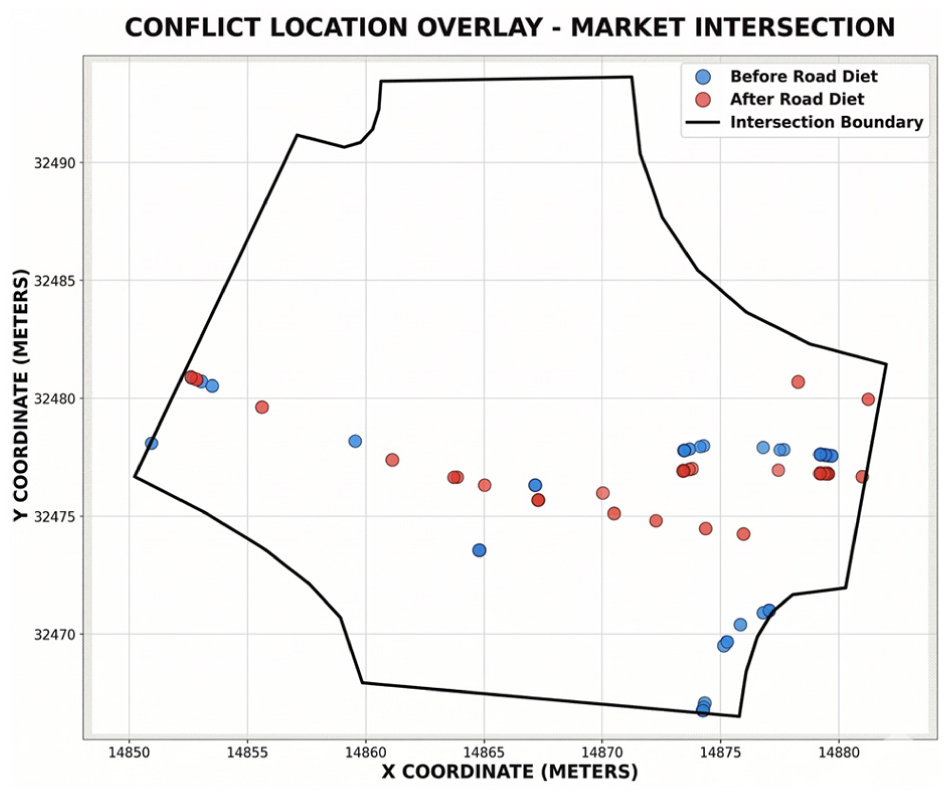
Spatial overlay of time-to-collision-based conflict locations at the Market Street intersection boundary before and after the road diet, illustrating reduced conflict dispersion and more centralized interaction patterns post-implementation.
Secondly, Figure 15 presents a visualization of conflict intensity within the intersection boundary. Before the road diet, several areas show notably high-density conflict clusters, with certain locations exhibiting over 500 conflict occurrences, particularly near central conflict zones. Following the road diet, these hotspots substantially decrease both in frequency and intensity, signifying an overall mitigation of conflict risks.
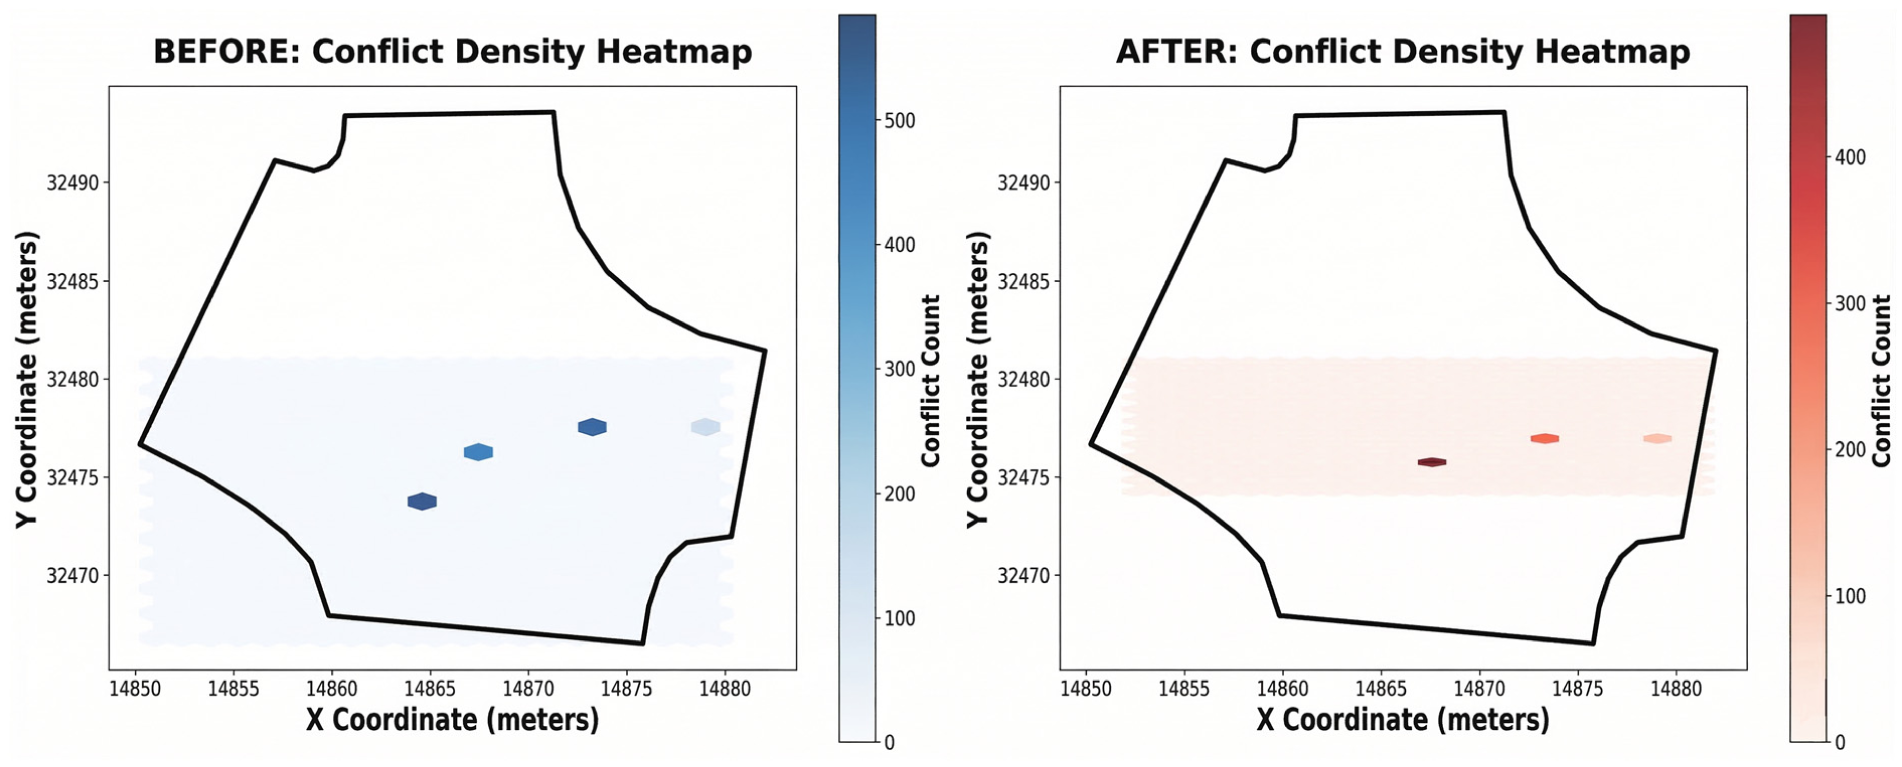
Conflict density heatmaps at the Market Street intersection before (left) and after (right) the road diet, showing substantial attenuation of high-intensity conflict hotspots following lane reconfiguration.
Further, Figure 16 categorizes conflict patterns based on vehicle movements. Before the road diet, “Opposing Flows” accounted for the majority of conflicts (67.6%), followed by “Complex Movements” (24.3%), “Crossing Movements” (4.8%), and “Same Direction” conflicts (3.2%). After the road diet, despite a significant numerical reduction in all categories, “Opposing Flows” remain dominant at 59.4%, followed by “Complex Movements” at 30.4%, “Crossing Movements” at 5.8%, and “Same Direction” conflicts at 4.4%. These proportions indicate a particularly significant reduction in conflicts involving opposing vehicle flows and complex movement patterns.
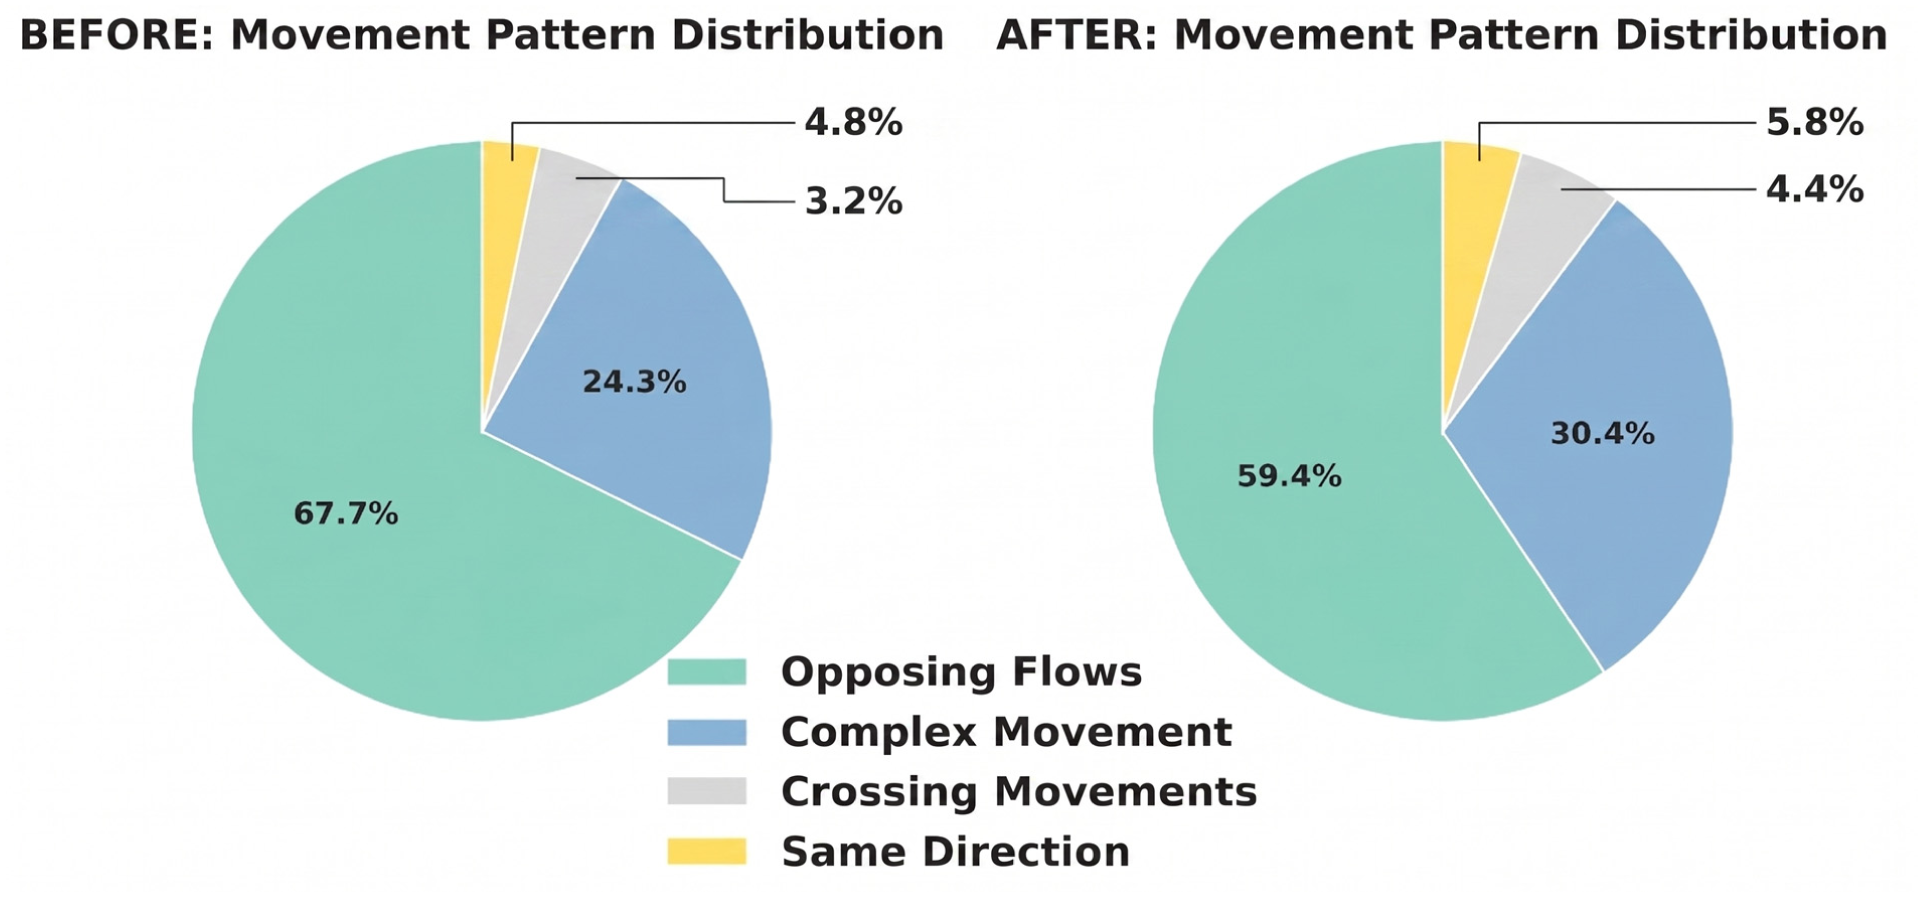
Movement pattern distribution of vehicle conflicts before and after the road diet, categorized as Opposing Flows, Complex Movements, Crossing Movements, and Same Direction, showing a proportional shift away from opposing-flow interactions.
In-depth analysis of conflict clusters before the road diet highlights two primary zones with high conflict frequency: Cluster 1 with 1,050 conflicts (avg. TTC of 1.55 s) and Cluster 0 with 679 conflicts (avg. TTC of 1.15 s), both predominantly driven by opposing vehicle movements. After the road diet, conflict occurrences significantly consolidated into Cluster 0 (947 conflicts, avg. TTC of 1.58 s), reflecting reduced dispersion of aggressive interactions.
Overall, the spatial and pattern analyses illustrate a considerable improvement in intersection safety, with total conflicts decreasing by 801 events, corresponding to a 45.7% reduction. These insights clearly underscore the effectiveness of road diet interventions in reducing spatial conflict dispersion, mitigating aggressive driver interactions, and promoting safer traffic conditions.
XGBoost for Post-Intervention Waiting Time Prediction
Traditional traffic signal systems, which operate based on predetermined fixed cycles, are frequently identified as primary contributors to traffic congestion, primarily because of their inability to adapt dynamically to varying road conditions. Traffic congestion significantly affects drivers and other road users by increasing travel delays and hindering efficient mobility to their intended destinations ( 25 ). Extended queues of vehicles commonly form at numerous urban signalized intersections, a phenomenon attributed to multiple factors, notably the mismatch between signal durations and vehicle arrival patterns ( 26 ). Therefore, accurate prediction and calculation of waiting times at intersections are essential, particularly for optimizing traffic signal control strategies. Such optimization becomes even more critical when intersections are closely spaced; drivers often experience frustration on observing nearby intersections with green signals while being detained at red lights, indicating the need for comprehensive coordination and advanced optimization techniques. A study by Reddy et al. addresses this issue by introducing an analytical model designed to estimate maximum vehicle delays at signalized intersections ( 27 ). The validity of this analytical approach was assessed by comparing its predictions against the performance outcomes from five distinct intersection management methods within a simulated 2 x 2 grid network environment. Simulation results using SUMO demonstrated that the analytical model reliably provides an upper-bound estimate of waiting times. Although this estimate tends to be conservative, it remains valuable as a robust analytical tool for assessing and benchmarking intersection performance.
XGBoost has been widely used for trajectory prediction in transportation studies. Lartey et al. applied XGBoost to predict hourly traffic volume on roads, addressing congestion issues caused by increasing vehicle numbers ( 29 ). In another research, a hybrid approach was developed that combined wavelet decomposition with XGBoost for fast and accurate short-term traffic flow prediction ( 30 ). That study addressed the challenges of non-linear and randomly changing traffic patterns that are difficult to handle with traditional machine learning algorithms.
This study used XGBoost to forecast waiting times after road diet implementation using traffic parameters before intervention. XGBoost operates through the sequential construction of decision trees, where each successive tree is trained to minimize the residual errors of its predecessors optimizing gradient descent ( 28 ). The algorithm objective function combines a differentiable loss function with a regularization term, expressed as:

where the regularization component
The methodological framework commenced with comprehensive data extraction from SUMO simulation outputs by parsing XML files containing traffic state information aggregated at 5 min intervals with the total of 289 observations. The feature matrices included four fundamental traffic flow parameters collected during pre-intervention conditions: queue length, traffic density, travel time, and average vehicle speed. These variables were selected because of their theoretical relevance in traffic flow theory and their standard availability in traffic simulation outputs. The target variable comprised waiting times recorded post-road-diet implementation, creating a predictive paradigm in which pre-intervention conditions forecast post-intervention performance.
The XGBoost regressor was configured with 100 estimators and a maximum tree depth of 5. These hyperparameters were selected to balance model complexity and generalization capabilities. Figures 17 and 18 represent the hourly average waiting time patterns comparing actual observations with XGBoost model predictions, and test set predictions distributed across the hours of the day, respectively. Performance evaluation demonstrated strong predictive accuracy, with the model achieving a coefficient of determination (
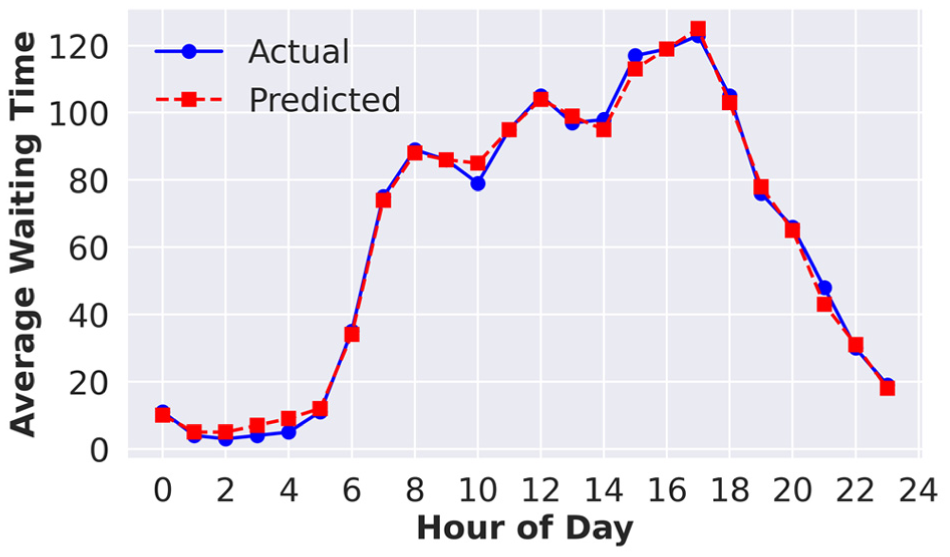
Hourly average waiting time comparison between SUMO-observed post-road-diet values and XGBoost model predictions trained on pre-intervention traffic features, achieving
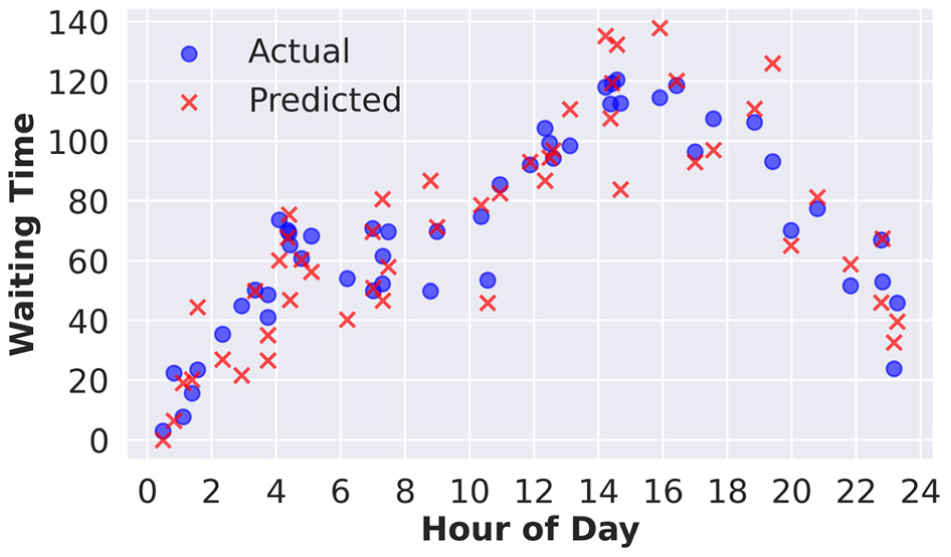
Test-set scatter plot of XGBoost-predicted versus actual post-road-diet waiting times distributed across hours of the day, revealing stronger predictive fidelity during peak periods and increased uncertainty during transitional demand regimes.
The implications of this research extend beyond technical validation to practical applications in transportation planning. The demonstrated ability to predict post-intervention waiting times with 90% explained variance enables evidence-based decision-making in road diet implementations, though practitioners should note the increased uncertainty during transitional traffic periods.
Discussion
The objective of this study is to validate the reliability of microscopic simulation tools in accurately capturing complex traffic dynamics and evaluating traffic interventions. We employed the SUMO model to assess the road diet implemented on the Frazier Avenue corridor, which demonstrated significant improvements in traffic safety while maintaining manageable impacts on traffic performance.
The SUMO model was calibrated against real-world INRIX speed data, achieving discrepancies of less than 5%, thereby ensuring model accuracy. We established three distinct scenarios for our analysis: the pre-road-diet condition (“before”), post-road-diet implementation (“after”), and a hybrid scenario combining the pre-road-diet traffic demand with the post-road-diet geometry. Traffic demand data for Frazier Avenue was sourced from Gridsmart cameras provided by the City of Chattanooga, capturing vehicle counts at multiple intersections in 5 min intervals over continuous 24 h periods. This raw data was processed by aggregating lane-specific vehicle entries into combined entry points and converted into an XML format compatible with the SUMO traffic simulation software. We compared traffic volumes before and after the road diet implementation, specifically examining periods from April to October, 2024, (before) and October, 2024, to June, 2025, (after). Peak traffic volumes decreased from 15,547 vehicles in September, 2024, to 15,177 vehicles in April, 2025, indicating that the road diet likely encouraged commuters to choose alternative routes, resulting in reduced overall traffic along Frazier Avenue. Subsequently, we conducted a comprehensive analysis of traffic performance metrics, including average speed, travel time, waiting time, and queue lengths, for both the before and after conditions. Decision-makers were provided with extensive performance insights from three analytical perspectives: overall corridor performance, westbound directional analysis, and eastbound directional analysis. The corridor-wide analysis revealed moderate impacts resulting from the road diet. Specifically, average travel time increased slightly from 13.36 to 13.94 s, whereas waiting time experienced a more substantial increase, rising from 82.65 to 116.32 s. Additionally, lane density nearly doubled from 5.84 to 7.73 vpkmpl, reflecting the reduced lane capacity from four lanes to three. The average speed experienced only a modest reduction, decreasing from 19.09 to 18.10 mph.
Although the present simulation did not explicitly model pedestrian and cyclist trajectories, the observed corridor-wide reduction in average vehicle speed from 19.09 to 18.10 mph is safety-relevant for vulnerable road users because pedestrian injury-severity studies consistently show that the probability of severe or fatal injury increases sharply with vehicle impact speed. Prior impact-speed risk models and meta-analytic evidence indicate that even moderate changes in vehicle speed can materially influence pedestrian injury outcomes. Therefore, while this study cannot directly quantify pedestrian or cyclist risk because of the absence of VRU trajectory and exposure data, the observed 5.2% reduction in average speed provides an injury-severity rationale for interpreting the road diet as beneficial to multimodal safety, particularly when considered alongside the observed reductions in TTC-based conflicts ( 33 , 34 ).
Further analysis of intersection queue lengths using 24 h traffic simulation data revealed significant variations across intersections. The Market intersection showed a modest 4% reduction in queue lengths, while the Woodland eastbound intersection exhibited a substantial 37% reduction. Conversely, the Woodland westbound intersection experienced a dramatic increase of 303% in queue length. The Forest intersection demonstrated mixed results, with eastbound queues decreasing by 53% and westbound queues increasing by 208%.
SSMs, particularly TTC, indicated significant safety improvements following the road diet implementation. Conflicts were reduced by approximately 45.7%, underscoring the direct safety benefits associated with lane reductions and traffic calming measures. Spatial analyses further demonstrated a substantial reduction in critical conflict events and a more concentrated spatial distribution of conflicts, indicating enhanced predictability of vehicle interactions and improved driver adherence to lane discipline.
Additionally, predictive modeling using XGBoost effectively illustrated the capability of machine learning algorithms to forecast traffic performance metrics, specifically waiting times post-intervention. With an R2 value exceeding 0.90, the high explanatory power of this model underscores its potential utility in traffic management and operational decision-making. Nevertheless, caution is advised in interpreting transitional states, which may exhibit greater predictive uncertainty.
Conclusion
This study presented an end-to-end, data-driven framework that integrates microscopic traffic simulation and machine learning to evaluate the operational and safety consequences of a road diet on an urban arterial corridor. Using multi-month GridSmart turning-movement counts, INRIX speed data, AADT statistics, and OSM-based infrastructure, we developed and calibrated a SUMO microscopic model of Frazier Avenue in Chattanooga, Tennessee, for both pre- and post-implementation geometries, as well as a hybrid validation scenario that holds demand constant while altering only the cross-section. Across a continuous 24 h horizon, the implemented road diet yielded substantial safety benefits while maintaining corridor-level mobility within acceptable bounds, albeit with localized and direction-specific operational penalties.
Methodologically, the work demonstrates that open-source microscopic simulation platforms can be configured and calibrated to a level of fidelity suitable for policy-relevant evaluation of roadway reconfigurations. A one-way ANOVA-based sensitivity analysis isolated nine statistically influential driver and vehicle parameters from the broader SUMO parameter space, and a genetic-algorithm optimization scheme, driven by observation speed data and GridSmart volumes, achieved less than 5% deviation from observed speeds and GEH values below 5.0 for over 89% of turning movements. This combination of principled parameter screening and evolutionary calibration provides a transferable template for building high-fidelity digital replicas of urban corridors using routinely available data sources, and establishes microscopic simulation as a cost-effective complement to traditional before–after field studies.
Substantively, the three-scenario analytical design—pre-intervention baseline, post-intervention conditions, and a hybrid configuration that applies pre-intervention demand to the post-intervention geometry—enabled a clear decomposition of geometric versus demand-driven effects. Corridor-wide, average travel time increased only modestly (from 13.36 to 13.94 s), average speed decreased slightly (from 19.09 to 18.10 mph), and lane density nearly doubled after the reduction from four to three lanes, indicating a managed, but not catastrophic, capacity loss. However, intersection- and direction-specific analyses revealed pronounced asymmetries: westbound movements experienced substantial increases in time loss and density, and certain approaches (e.g., Woodland and Forest westbound) exhibited large queue growth, while others (e.g., Woodland eastbound and Market) benefited from reduced queues. These results underscore that aggregate performance measures can mask important spatial heterogeneity, and that post-road-diet mitigation strategies should be targeted at specific approaches and intersections rather than the corridor as a whole.
The integration of SSMs within the microscopic simulation environment enabled a detailed safety assessment in the absence of long-term crash data. Instrumenting all simulated vehicles with SSM devices and analyzing TTC outputs at the Market Street intersection revealed a 45.7% reduction in conflicts with TTC
Beyond simulation, the study demonstrated the feasibility of coupling microscopic models with machine learning to construct predictive tools for post-intervention performance. An XGBoost regressor trained on pre-diet traffic features (queue length, density, travel time, and speed) successfully predicted post-diet waiting times with
The demand-sensitivity experiments further quantified the long-term robustness of the Frazier Avenue road diet. By incrementally increasing daily volumes up to approximately 30% above current levels, approaching the FHWA’s 20,000 ADT guideline, we showed that average corridor queue lengths grow in a strongly non-linear manner, with particularly pronounced degradation at already stressed westbound approaches. These results imply that, under plausible growth trajectories, the corridor retains a meaningful capacity buffer for roughly 1–2 decades, but that targeted operational interventions—such as retiming signals or enhancing turn bay storage at critical approaches—will become necessary as volumes approach 18,000–19,000 ADT. From a planning perspective, the framework therefore provides not only an evaluation of current performance but also an evidence base for staged, data-driven adaptation of signal and geometric design as demand evolves.
Several limitations qualify the generality of these findings. The analysis focuses on a single corridor and exclusively on motor-vehicle traffic; bicycle lanes, on-street parking operations, pedestrian flows, and transit were intentionally abstracted out of the simulation model, precluding a full multimodal assessment of the road diet. Signal control was modeled using calibrated, but fixed, actuated logic rather than jointly optimized or adaptive strategies, and the machine learning component relied on a relatively small sample of 5 min aggregates, which limits its ability to capture rare or transient regimes. Future work should extend the framework to multi-corridor networks, incorporate multimodal and equity-oriented performance metrics, explore joint optimization of geometry and signal control, and investigate alternative learning architectures and domain-adaptation strategies that explicitly address distributional shifts between pre- and post-intervention conditions.
Taken together, the results demonstrate that a carefully calibrated microscopic simulation, enriched with surrogate safety analysis and coupled to modern machine learning methods, can provide a scientifically rigorous and operationally useful basis for evaluating and designing road diets in complex urban environments. For practitioners, the framework offers a replicable blueprint for constructing corridor-scale digital twins that leverage existing sensor and speed datasets to quantify both operational trade-offs and safety gains before physical implementation, and to support iterative refinement of designs as real-world demand and behavior evolve.
Footnotes
Authors’ Note
Language editing was performed using ChatGPT 5.1 and Grammarly solely for grammar checking and minor improvements to textual fluency. No AI tools were used for data analysis, content generation, or drawing conclusions.
Author Contributions
The authors confirm contribution to the paper as follows: study conception and design: Mehdi Khaleghian, Mina Sartipi; data collection: Tam Bang, Mahshid Malazizi; analysis and interpretation of results: Mehdi Khaleghian; draft manuscript preparation: Mehdi khaleghian, Mina Sartipi. All authors reviewed the results and approved the final version of the manuscript.
Declaration of Conflicting Interests
The authors declared no potential conflicts of interest with respect to the research, authorship, and/or publication of this article.
Funding
The authors received no financial support for the research, authorship, and/or publication of this article.
The authors would like to thank David Lee, Assistant Director of TDOT, and Cindy Shell, Traffic Signal Design Specialist from the City of Chattanooga, for their valuable support in providing traffic data for this research.