
Abstract
Ambitious transport policies are necessary to mitigate current, undesired transport system outcomes and effects. However, in times of rising societal polarization, it is unclear whether there is political support for such measures. Based on a representative survey with over 1,700 respondents, the latent policy preference classes that can be identified in German society are examined. Which groups prefer regulatory interventions such as pricing over infrastructural improvements is assessed. Based on the covariates, the results are interpreted as political cleavages in the transport policy domain. Using latent class regression on best/worst rankings of policies across six areas, four distinct preference classes are identified: (1) Public Transport Advocates (26%); (2) Long-Distance Optimizers (15%); (3) Car-Oriented Pragmatists (43%); and (4) Multimodal Interventionists (17%). Of interest, not all groups consistently favor pull measures such as infrastructure improvements over push measures such as a carbon dioxide tax. This suggests that preferences cannot be explained by self-interest alone. The results show the influence of sociodemographics, spatial residential context, and travel behavior on policy preference classes. To reduce dimensionality, principal component analysis is applied to posterior-weighted covariate averages. The results suggest two main conflict lines: (1) a sociodemographic axis (lower to higher resources); and (2) a travel behavior axis (green and multimodal to car-centered mobility). The travel behavior axis is only relevant among those with higher socioeconomic status, suggesting that behavior reflects preferences only if individuals have the resources to choose. The findings contribute to the political economy of transport by highlighting which cleavages shape policy preferences. The results can inform future land use and transport modeling.
Keywords
Introduction
As Germany seeks to shift its transport sectors toward environmental, social, and fiscal sustainability, understanding public preferences is essential for policymakers to make more informed choices about the allocation of limited funds. In transport policy research, policy instruments are commonly categorized as either push or pull measures. Commonly also referred to as the distinction between sticks and carrots ( 1 ). Push measures (sticks) are designed to actively discourage behaviors deemed undesirable by policymakers, typically through coercion, restrictions, or price increases. Pull measures (carrots), attempt to promote desirable behaviors by improving services or providing incentives, encouraging voluntary behavioral change ( 1 , 2 ). Examples of push instruments include domestic flight bans, carbon dioxide (CO2) levies, speed limits, or access restrictions. In contrast, pull measures might encompass improvements in the comfort and accessibility of public transport, the expansion of cycling infrastructure, or subsidies for electric vehicles. A central challenge for policymakers is that while push measures are often more effective in achieving policy objectives such as decarbonization, they tend to encounter stronger public resistance because of their restrictive nature (3–5). However, this categorization has been subject to critique. First, the distinction between push and pull factors is often impossible, as measures can exhibit characteristics of both simultaneously ( 6 ). In dense urban contexts where spatial resources are highly constrained, the allocation of space to one mode of transport frequently necessitates a distribution of space away from another. For instance, the development of cycling infrastructure may initially appear to be a pull measure. However, if the required space is repurposed from car parking or traffic lanes, it also functions as a push measure by discouraging car use. Second, an increasing body of research publications questions the analytical value of examining public acceptance of isolated interventions. It has been argued that such an approach provides limited insights for policymakers and that greater attention should be paid to the design and contextual framing of (especially push) measures ( 2 , 4 , 7 ). Relatedly, there is a growing emphasis on the public perception of integrated policy packages ( 8 ). Previous studies have shown that the implementation of compensatory mechanisms, such as expanding public transport options alongside cost increases for unsustainable travel behavior, can improve public and political support for such interventions ( 9 , 10 ).
There is a growing body of literature examining individual-level acceptance of specific transport policies and how this acceptance shifts depending on policy design or bundling; comparatively, less attention has been paid to the heterogeneity of respondents. Three studies have applied clustering techniques to identify different groups based on acceptance patterns. Mehdizadeh et al. ( 11 ) used latent class analysis (LCA) to identify unobserved respondent subgroups and differentiate between classes based on their acceptance or opposition to various transport policy types. Two Canadian studies identified distinct public preference clusters on climate and transport policies, differing in support for regulatory versus pricing measures. Group membership was closely linked to values, environmental concern, demographics, and regional context ( 12 , 13 ).
Rhodes et al. ( 12 ) and Long et al. ( 13 ) both measure policy support using Likert-scale items. In these studies, respondents were asked to indicate their level of agreement or disagreement with the different policies. These approaches are closer to what is typically labeled as acceptability. However, what often remains unclear in the literature is the precise conceptualization of the type of response being measured and why. The terms acceptance, acceptability, support, and preference are frequently used in this line of research, although they refer to different constructs ( 14 ). Acceptability is understood as an attitude, whereas acceptance describes a behavioral response ( 15 , 16 ). In contrast, preference describes a comparative evaluation and is only meaningful in relation to other available options. Preferences are considered observable through the ordering of alternative options and are foundational in theories of individual decision-making and collective choice ( 17 ). In democratic policymaking, policy choices are made within a constrained set of options. Citizens are not asked to evaluate measures in isolation but to express preferences between competing parties proposing policy bundles. This study follows this logic by focusing on preferences for transport policy measures across modes, allowing how policy preferences vary across citizens to be examined.
This is of particular relevance in the German context, in light of the recently adopted €500 billion investment package with one focus being transport infrastructure, announced by the newly elected German government in March 2025 ( 18 ). The funding is intended to be spent over the next 10 years. However, the precise allocation of the investment package remains undecided ( 19 ). Germany faces mounting challenges in transport policy. Alongside growing demands for the modernization, renovation, and maintenance of railways, road bridges, and urban streets, Germany is under pressure to decarbonize the sector in line with its national climate targets ( 20 ). However, the German transport sector remains the only major economic sector in the European Union (EU) where greenhouse gas emissions have continued to rise since 1990. In 2022, emissions from transport accounted for roughly one-quarter of the EU total ( 21 ), and around 22% of Germany’s national emissions ( 22 ). Other sectors have made progress, but the transport sector is challenged by a growing mismatch between rising pressure for transformation and a lack of effective political responses. The question is not only where such unprecedented public funds should be invested, but also which of these are preferred or rejected by the population?
Building on established political cleavages, this study aims to understand how these broader divisions are reflected in transport policy preferences. Societal groups with distinct preferences in different policy domains, the push measures they are willing to accept, and how they evaluate measures outside their immediate priorities are identified. This leads to three research questions: (1) what latent preference classes can be identified across respondents based on their ranking of transport policy measures; (2) are people willing to also priorities push measures, such as regulatory or fiscal interventions, over infrastructural improvements; and (3) what are the dominant lines of conflict in policy preferences, and how can these be situated within political and sociodemographic cleavages in the literature?
The remainder of this study is structured as follows. First, a more detailed review of the literature on political preferences and societal conflict lines in transport policy. This is followed by a description of the data collection and survey design. The methodological approach is outlined, the empirical results are presented, and this study concludes with a discussion of the main findings.
Literature Review
Political Preferences and Conflict Lines
To better understand these heterogeneous policy preferences, the concept of political cleavages offers a useful perspective for capturing systematic divisions in public opinion. It allows us to connect individual preferences to broader, persistent lines of conflict within society. Political cleavages are permanent lines of conflict within societies ( 23 ). In their original formulation, the cleavages of center–periphery, church–state, rural–urban, and owner–worker were identified as structuring party competition ( 24 ). Since then, cleavage theory has been updated to include new divisions such as immigration ( 25 , 26 ) and European integration ( 27 , 28 ). These cleavages influence electoral behavior and other forms of political mobilization, including protest movements ( 29 ). Therefore, cleavage theory provides a valuable framework for analyzing processes of politicization and polarization, which can be particularly relevant in the transport sector. Climate-related policies in transport often provoke intense public controversy with polarized positions, as seen in the ongoing debate over the highway speed limit in Germany ( 30 ).
Travel Behavior: Car–Public Transport
It is well established in the research community that the perceived proximity or personal relevance of a policy influences its level of public acceptance. For instance, Long et al. ( 13 ) show that individuals who commute daily by car, and are those most likely to be directly affected, were overrepresented in the classes most strongly opposing several proposed push-type transport policies. Similarly, Schade ( 31 ) found a negative correlation between kilometers traveled by car and the acceptance of push measures such as road tolls. Andor et al. ( 3 ) demonstrate that monomodal car users are significantly less likely to support restrictive transport measures compared with multimodal users, who use other modes of transport and a car. Thaller et al. ( 4 ) observed a consistent downward trend in support for climate mitigation measures across all intensity levels with increasing annual driving distance, further underlining how usage patterns mediate policy acceptance.
Spatial Context: Center–Periphery
Previous research has found mixed results on how spatial variation affects transport policy preferences. For example, a study in Michigan found that many residents support public transport services even if they do not benefit themselves because of the location of the service ( 32 ). However, newer research found that those living in rural areas are more likely to universally oppose low-carbon transport policies ( 13 ) or are more critical of carbon taxes ( 33 ).
Socioeconomic Divide: Income, Education, Age, Gender
Higher income is a predictor for support for public transport policies in some studies ( 34 ), while others find no significant effect ( 35 ). Education influenced support for environmentally friendly transport policies, with those with a higher education being more likely to support these policies ( 13 , 33 ). In addition, age seems to be an important predictor, with young people being more open to policy instruments such as a carbon tax ( 33 ). For gender, there were mixed results, with some studies finding men to be more favorable of low-carbon transport policies ( 7 ), some finding men to be more opposed ( 33 ).
Cultural Divide: Left–Right
Political context plays a crucial role in shaping the barriers to implementing transport policies, for example, congestion pricing ( 36 ) or urban planning initiatives ( 37 ). In transport policy, partisan divisions help explain support for and resistance to regional transport planning, across contexts in North America ( 38 , 39 ) and Europe ( 40 ). For instance, individuals identifying as right-wing favor allocating public funds toward car-centric policies ( 41 ), while support for the welfare state is linked to greater support for investments in pro-environmental public transport infrastructure ( 42 ). Partisan alignment can account for policy preferences even when controlling for knowledge, self-interest, values, and beliefs about change ( 43 ). In addition, local electoral data show that parties can benefit from transformative urban planning projects such as Barcelona’s superblocks ( 44 ).
Measuring Policy Preferences in the German Context
The survey design draws on the transport policy questions and experimental setup of the Swiss Household Travel Survey ( 45 ). The target group for the survey was the German population aged 18 years or older. The survey was fielded shortly before the federal elections on February 23, 2025, during a period marked by heightened political debate, particularly surrounding climate and transport policy. The survey had a quota for age, gender, and federal state to ensure a balanced representation of respondents across Germany. Therefore, the final sample of 2,011 respondents of this survey is representative of this quota ( 46 ).
Survey Design
To answer these questions, a quantitative stated preference study was conducted.
For this analysis, relevant sections of the survey include: (1) questions on travel behavior; (2) a stated ranking (SR) section; and (3) questions on sociodemographic characteristics of the respondent and their household. The first section gathered information on key mobility-related aspects, such as vehicle ownership, possession of public transport season tickets, and mode usage frequency. In the SR section, respondents were asked to rank transport policy preferences across six domains using a drag-and-drop interface: public transport, cycling, road traffic, pedestrian infrastructure, measures aimed at reducing the environmental effects of transport, and finally, a question including other policies on housing, shared or autonomous mobility. Respondents first ranked these general infrastructure improvements across the domains and then ranked detailed measures within each domain. The ranking tasks covered a range of regulatory, fiscal, and infrastructural policy measures, and included seven ranking questions in total, each with 4–6 items. The ranking questions were randomized, and respondents had to click on at least one item to proceed with the survey. The randomization failed for the block concerning measures aimed at reducing environmental effects; therefore, the results for this block should be interpreted with caution. The exact wording of the ranking questions is included in the Appendix.
SR Task
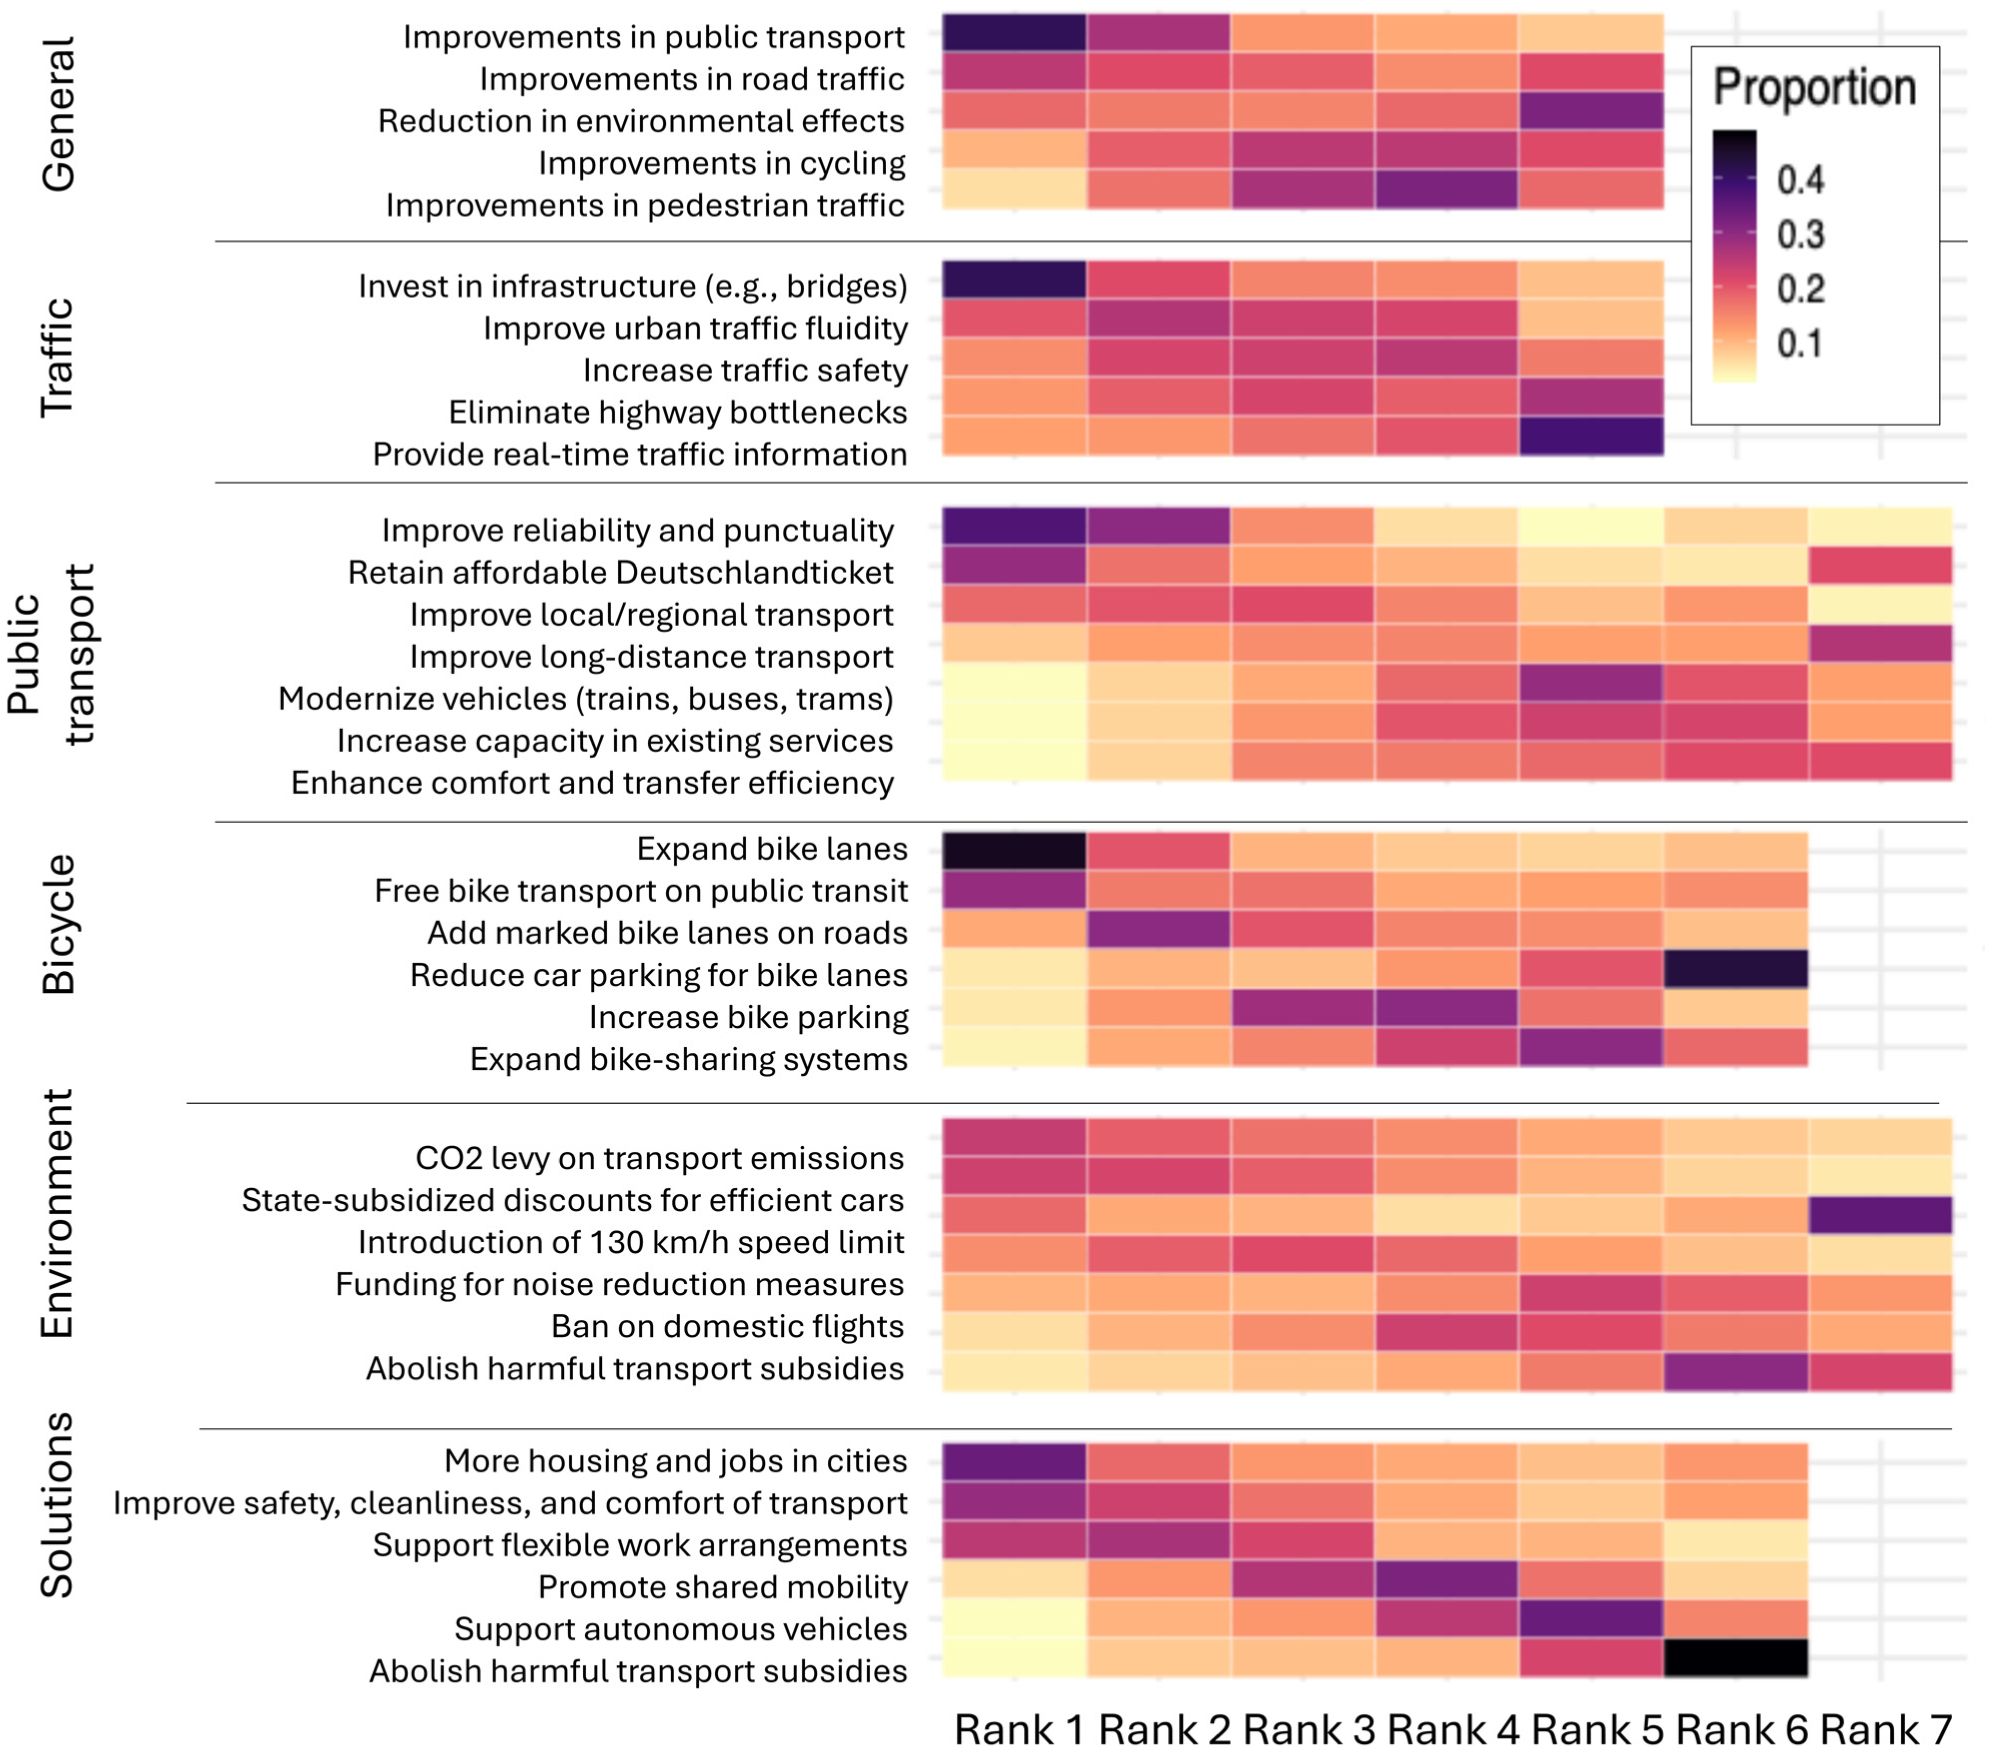
In the SR task, respondents were presented with a series of questions where they had to rank items according to their preferences within each of the seven topic-specific blocks: general policy ranking, mode-specific policy ranking, environmental policy ranking, and further transport policy ranking. Of note, ranks are relative within blocks and not comparable across them. Figure 1 shows the seven block topics, the associated ranking items, as well as the distribution of how often each item was selected for each rank. The data offers insights into the trade-offs and policy preferences across a wide range of transport policy fields. An exemplary ranking question with the corresponding framing of the task is shown in Figure 2.
Distributions of ranks across stated ranking questions.
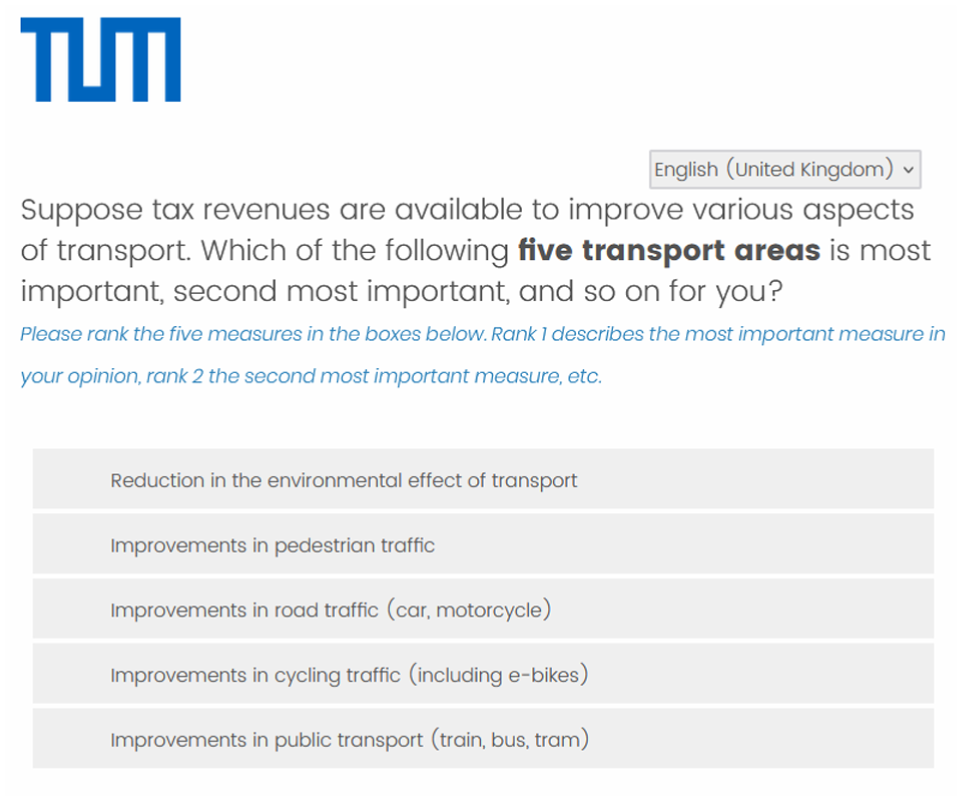
General ranking question as depicted in the survey.
Data Processing and Sample Description
For this analysis, the sample was further filtered to ensure high data quality.
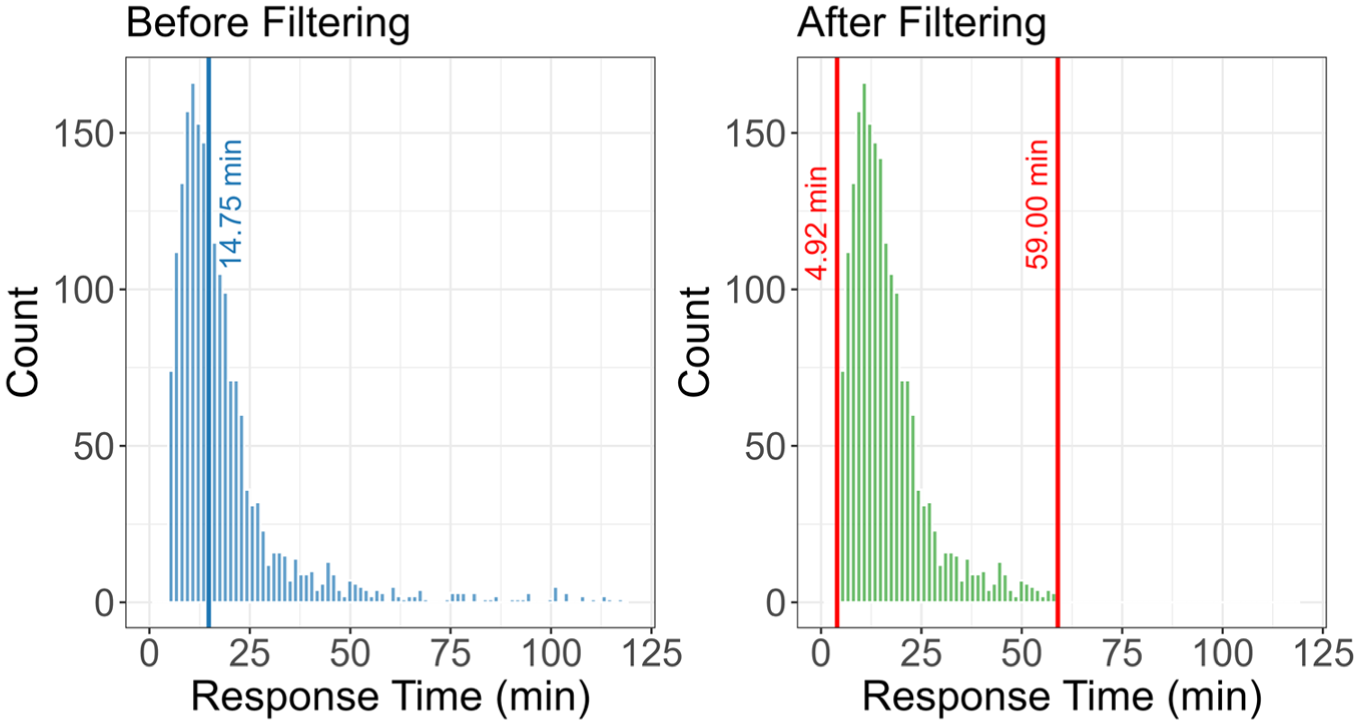
Using an online panel for the survey, the risk of respondents rushing through the survey to minimize their invested time while receiving compensation was increased ( 47 ). Such behavior is typically classified as carelessness, a form of “content nonresponsivity,” where answers are provided without adequate cognitive engagement. Including these responses can meaningfully reduce data quality and distort substantive findings ( 48 ). In the literature, several post hoc indicators exist to detect careless responding, with response time being one of the most widely applied metrics ( 48 ). The underlying assumption is that inattentive behavior manifests in unusually short completion times and in excessively long ones ( 49 ). Extremely short durations suggest superficial engagement, while very long durations often reflect interruptions, multitasking, or fragmented answering. To address this, statistical outlier detection can be relied on, or survey-specific thresholds can be applied. The panel provider itself does not incentivize respondents who finish within 2 min, an implausibly short duration for this survey; however, this alone does not sufficiently identify all careless respondents. Therefore, established practice used by other panel providers was followed, and respondents who completed the survey in less than one-third of the median response time were removed ( 50 ). At the upper end of the distribution, several respondents required more than four times the median completion time. These cases were also excluded. Very long durations typically indicate that respondents paused the survey and returned later, engaged in unrelated tasks while the survey remained open, or attempted to mask rapid responding by artificially inflating the recorded time ( 48 ). All of these behaviors introduce irregularities that compromise response consistency. The median response time and the resulting cut-offs are shown in Figure 3. Of note, while no respondents fell below the lower threshold, several exhibited excessively long times, probably because the survey platform allowed respondents to pause and resume at a later point.
Data filtering for response time.
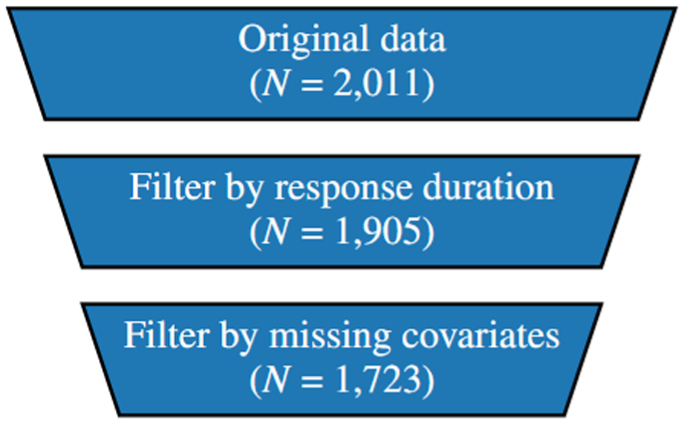
For subsequent analysis, all respondents with missing data in the relevant independent covariates, including income, personal mobility restrictions, the number of children in the household, and travel behavior, were removed from the data set. Figure 4 shows this data processing; the final sample consists of 1,723 respondents.
Data processing.
Table 1 provides an overview of the sample characteristics and, where applicable, comparison values for the German population. The sample is well-balanced on most covariates. There is an underrepresentation of individuals over 80 years old, which is expected given the survey format, as well as respondents with children, and those with low educational attainment. Individuals with a higher socioeconomic status and those living in urban regions are overrepresented. In future analyses, this imbalance can be addressed using appropriate weighting procedures to ensure more representative and generalizable results.
Respondents’ Sociodemographic Characteristics (N = 1,723)
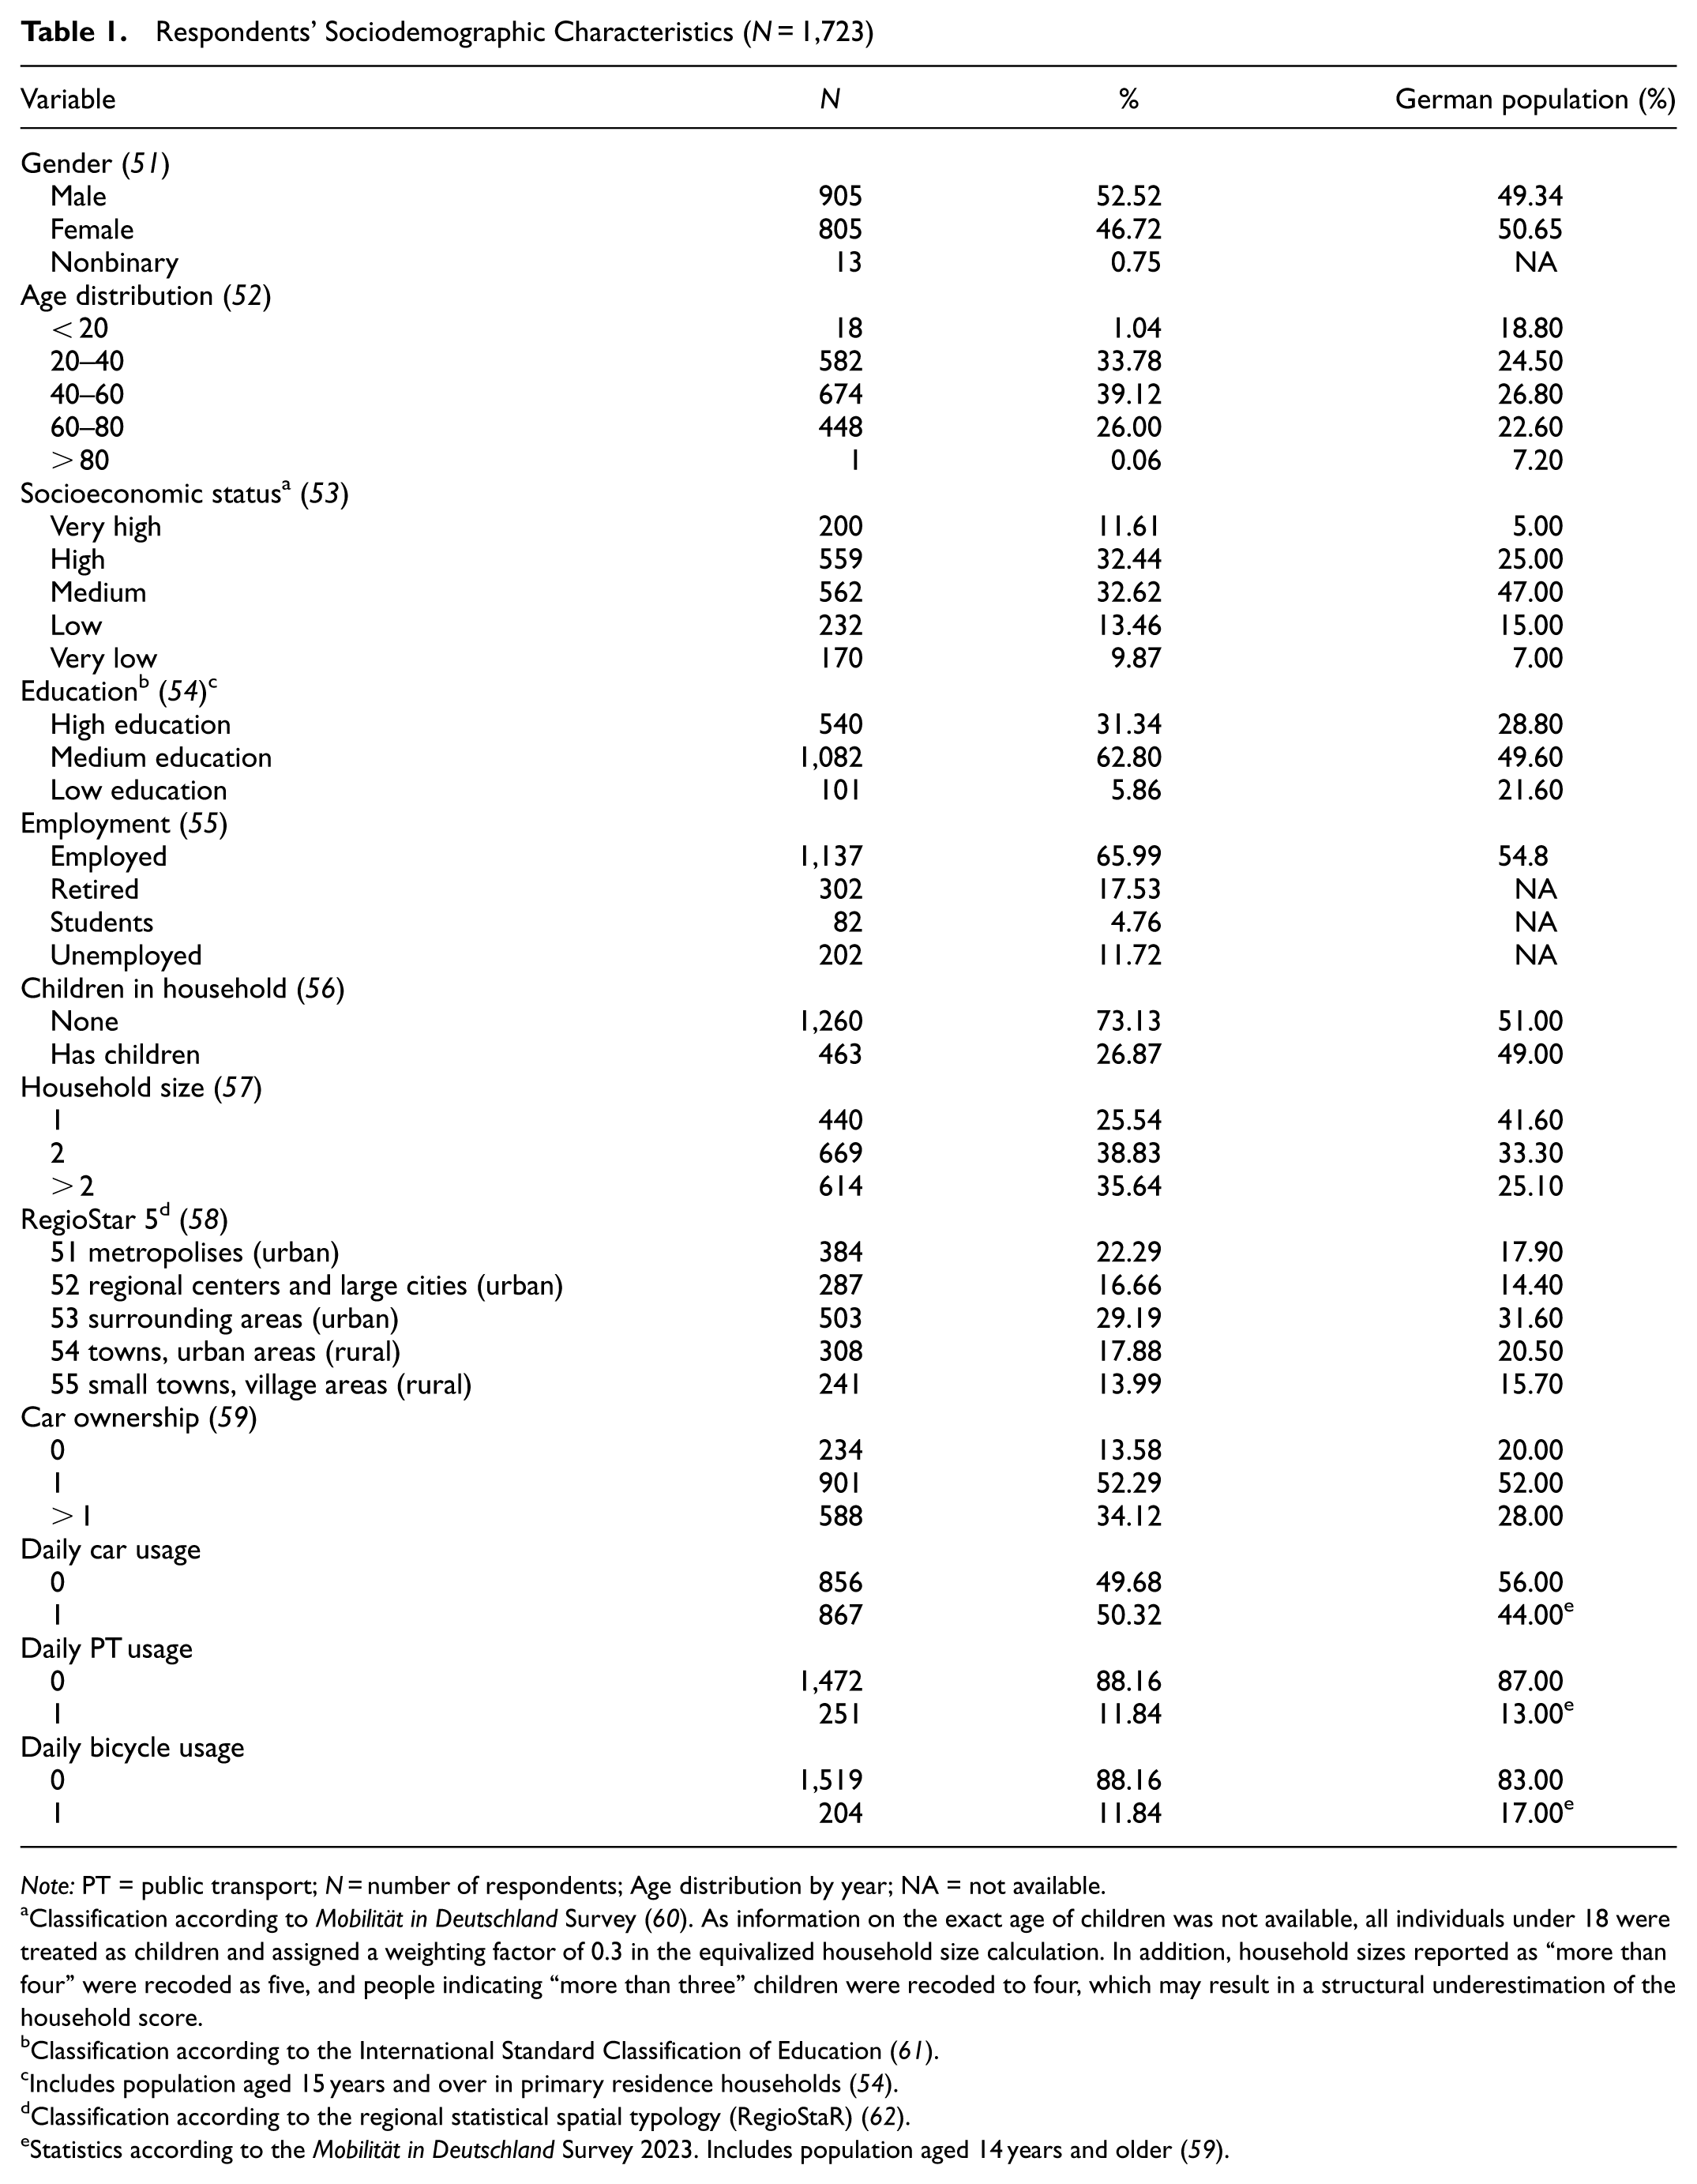
Note: PT = public transport; N = number of respondents; Age distribution by year; NA = not available.
Classification according to Mobilität in Deutschland Survey ( 60 ). As information on the exact age of children was not available, all individuals under 18 were treated as children and assigned a weighting factor of 0.3 in the equivalized household size calculation. In addition, household sizes reported as “more than four” were recoded as five, and people indicating “more than three” children were recoded to four, which may result in a structural underestimation of the household score.
Classification according to the International Standard Classification of Education ( 61 ).
Includes population aged 15 years and over in primary residence households ( 54 ).
Classification according to the regional statistical spatial typology (RegioStaR) ( 62 ).
Statistics according to the Mobilität in Deutschland Survey 2023. Includes population aged 14 years and older ( 59 ).
Methodology
Latent Class Analysis
LCA is a statistical method to identify unobserved (latent) categorical variables on multivariate categorical data. The latent classes are groups of individuals with similar response patterns. Latent class models have been used to model travel behavior; for example, the use of on-demand services (
63
) or daily mobility patterns (
64
) as well as political attitudes (
65
). In this study, the R package poLCA was used and the notation and formulation in the poLCA manual were followed (
66
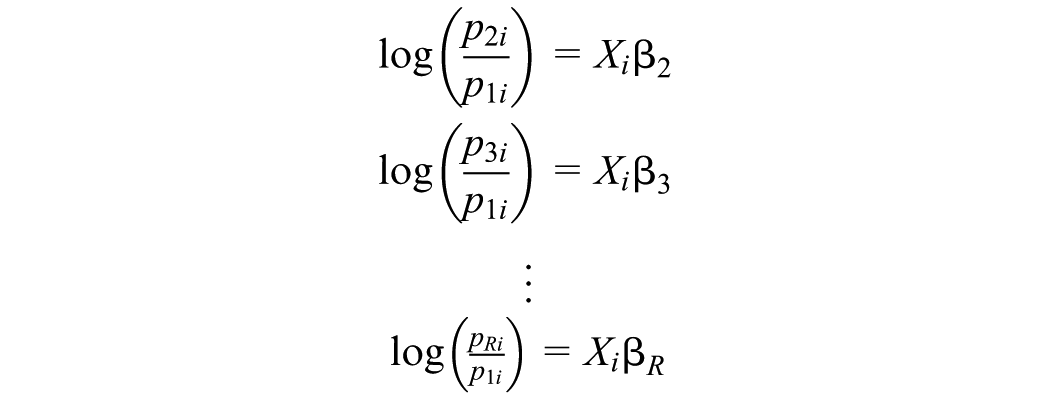
). For each individual

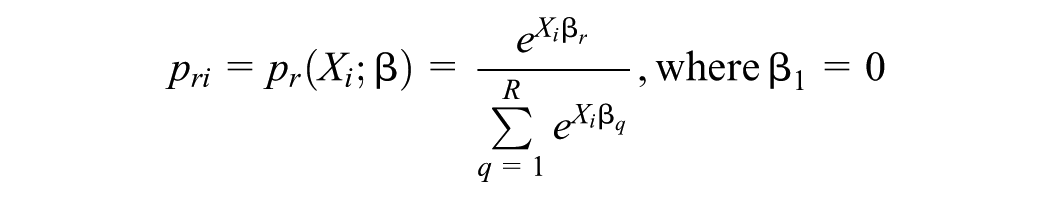
Latent class regression models further generalize the basic latent class model by allowing the inclusion of covariates to predict latent class membership. This is also called a one-step approach, because the measurement model is simultaneously estimated with the class membership model. In the latent class regression model, the mixing proportions
This leads to the general expression for individual-specific class membership priors.
Given the estimated parameters
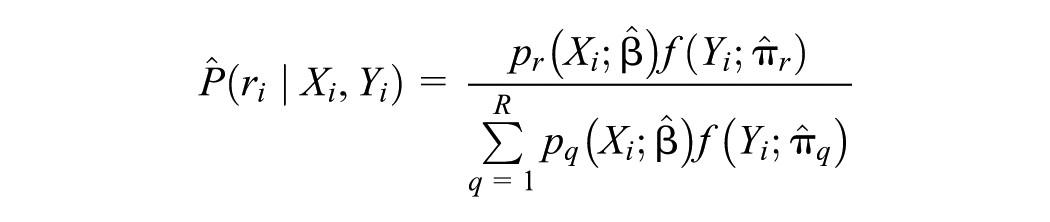
Estimation proceeds via a modified expectation-maximization algorithm with a Newton–Raphson step ( 68 ), and standard errors for the covariate coefficients are derived from the empirical observed information matrix. To reduce sensitivity to local maxima, the estimation should be repeated with multiple random starting values. See the literature (66–68) for further technical details.
A one-step approach was used to model specification, rather than adopting the alternative three-step method, which first estimates the latent class model based on manifest indicators and subsequently uses posterior class membership probabilities as the dependent variable in a regression. The one-step procedure is generally preferred because it yields consistent, asymptotically unbiased, and efficient estimates, provided the model is correctly specified ( 69 ).
Principal Component Analysis
Because the model includes many covariates, interpreting each individually is challenging. To simplify and uncover the key divides between classes, Principal Component Analysis (PCA) was applied. PCA is used to reduce data dimensionality to its essential features. Linear combinations of the covariates were used to ensure that they collectively explained the maximum variance across all variables ( 70 ).
Model Selection
One challenge in analyzing seven separate SR blocks is achieving meaningful dimensionality reduction without losing interpretability. As the ranking tasks provide only relative preferences within each block, no coherent global ranking can be derived to serve as input for standard ranking-based clustering algorithms ( 71 ). Instead, the existence of latent respondent types is assumed to share characteristic preference profiles that shape their ranking behavior. Another challenge lies in the assumption that respondents provide rankings that fully reflect their underlying preferences. However, individuals often struggle to make fine-grained distinctions between items of relatively similar priority, and they tend to have clearer preferences for the most and the least preferred alternatives. Therefore, the stability of ranking information is the lowest in the middle ranks ( 72 ). Because the goal is to identify cleavages and heterogeneity in the data, only the best- and worst-ranked items per block were used as the covariate variables within the LCA. This is based on evidence that suggests that choices of extremes tend to reflect more consistent preferences, and assumes that respondents were more confident in identifying the most and least preferred options ( 73 ). For example, Palma ( 74 ) shows that predictive power is highest for top-ranked alternatives and declines sharply for middle-ranked items. This notion is also the underlying assumption of best-worst scaling, where the relative importance of attributes is determined by asking respondents to select only the best and worst alternative from a set of alternatives ( 75 ). The resulting data identify pairs of alternatives with the largest utility differentials and exploit respondents’ tendency to evaluate extreme options more consistently ( 76 ).
Covariate selection was performed via iterative testing, including models with interaction terms and models restricted to sociodemographic variables only. The final specification was informed by the relevant literature. Included covariates are shown in Figure 5 and include sociodemographics such as age, gender, socioeconomic status, education, employment status, presence of children, and self-reported mobility restrictions, as well as land use and regional characteristics. Finally, key travel behavior indicators were added, including daily usage of car, bicycle, and public transport, along with car ownership.
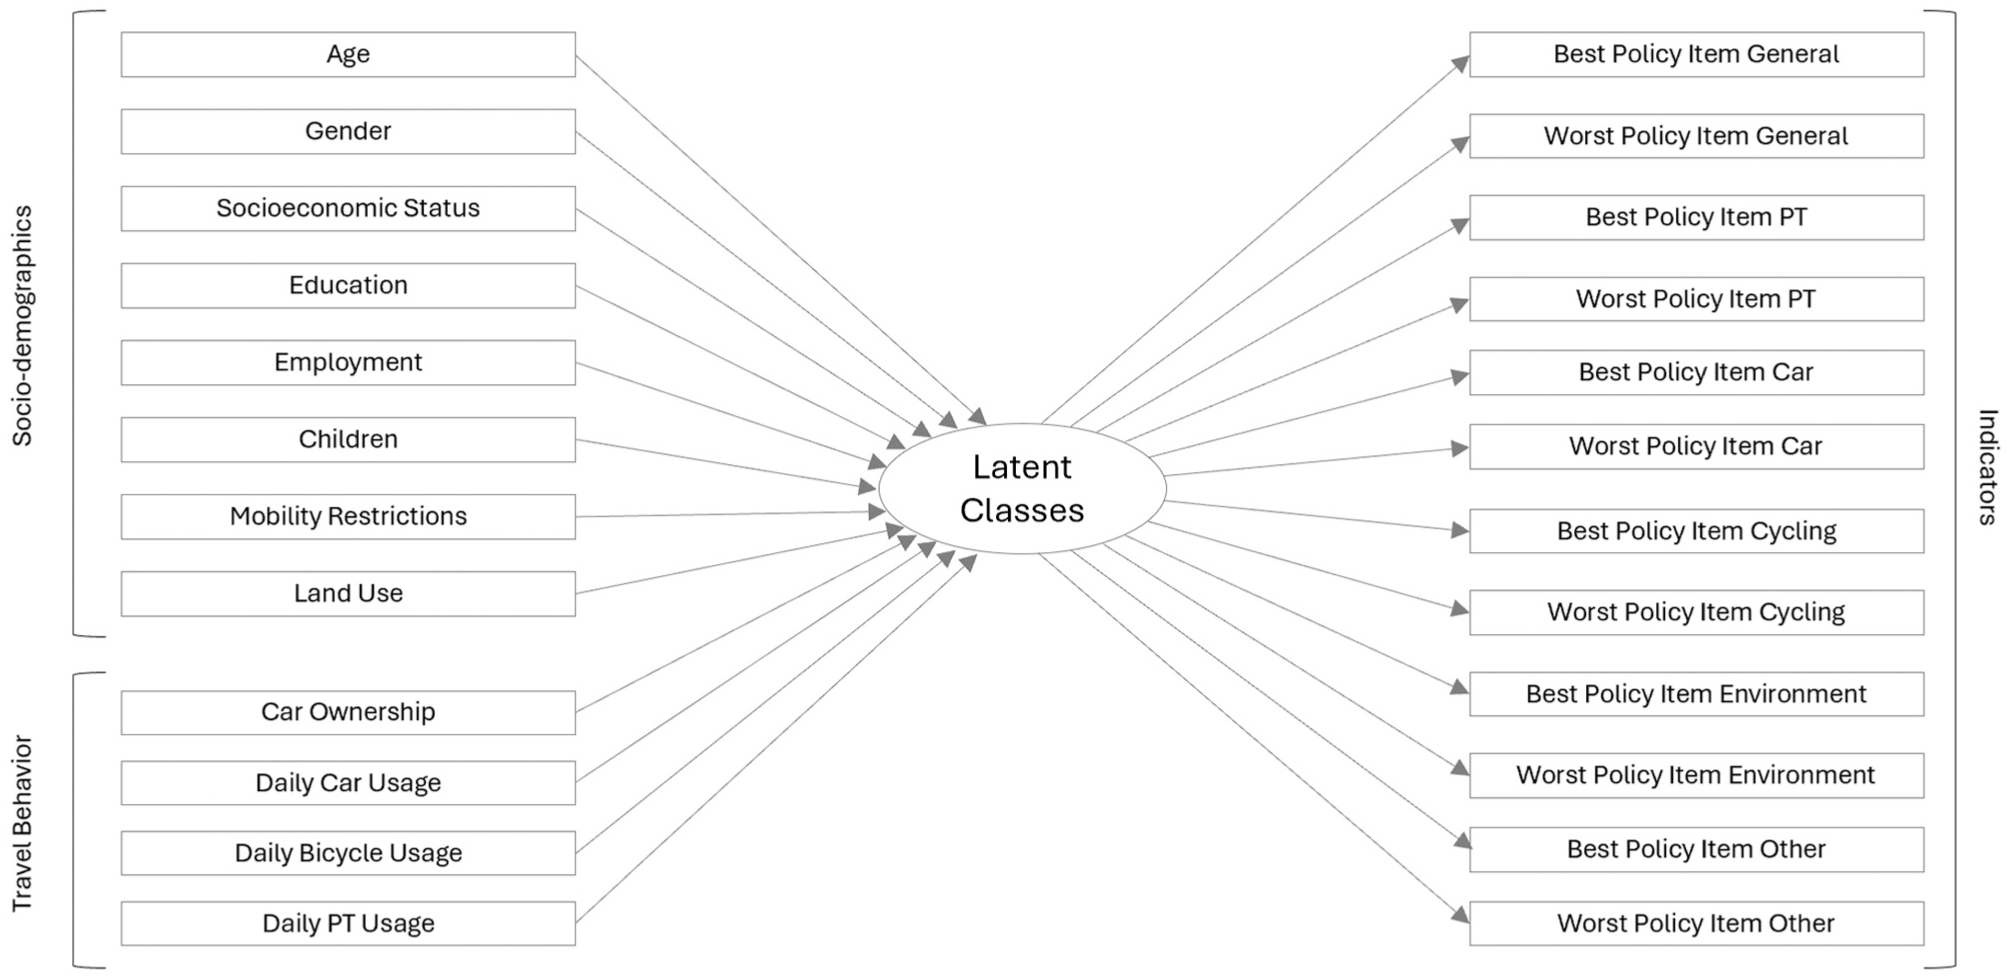
Latent class model conceptualization.
Internal correlation was assessed using Pearson’s r and Cramer’s V (
77
). All observed associations were weak to moderate. The variance inflation factor, which quantifies the degree of multicollinearity, was below three for all the variables included in the LCA, which is well below the common threshold typically indicating concern (
78
). Originally, the survey featured an SR block concerned with pedestrian traffic. The block featured measures such as shared zones with 20 km/h limits, public space enhancements, and wider sidewalks. The block was excluded from further analysis and clustering because items were overly specific, and it produced weaker results in the LCA. To determine the optimal number of classes, a class enumeration process was employed, starting as recommended with the estimation of a one-class LCA model and incrementing the number of classes
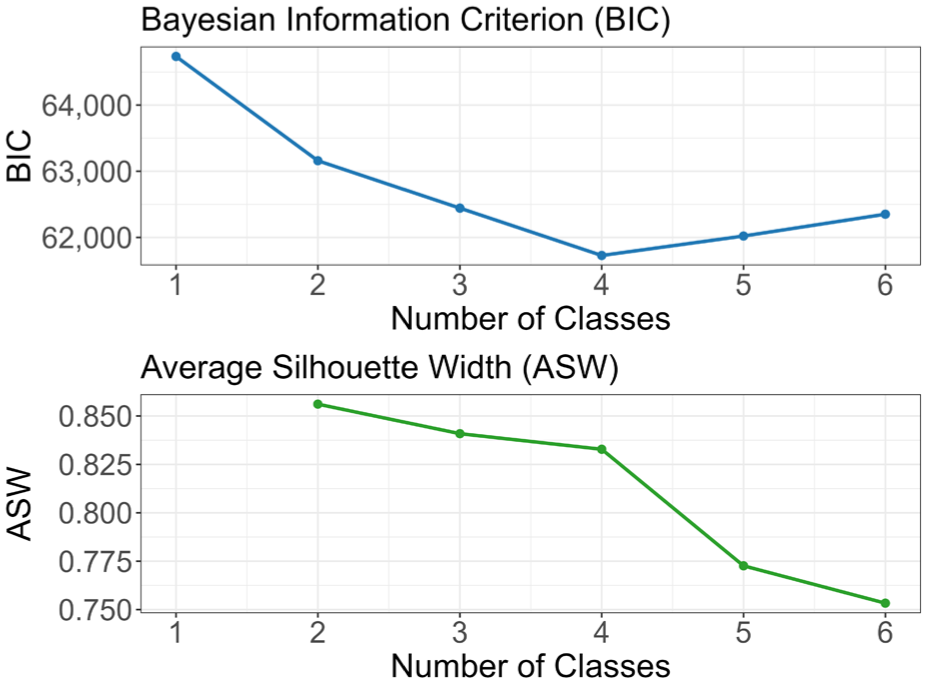
Model fit indices for the latent class analysis.
Results
Overall Policy Preferences
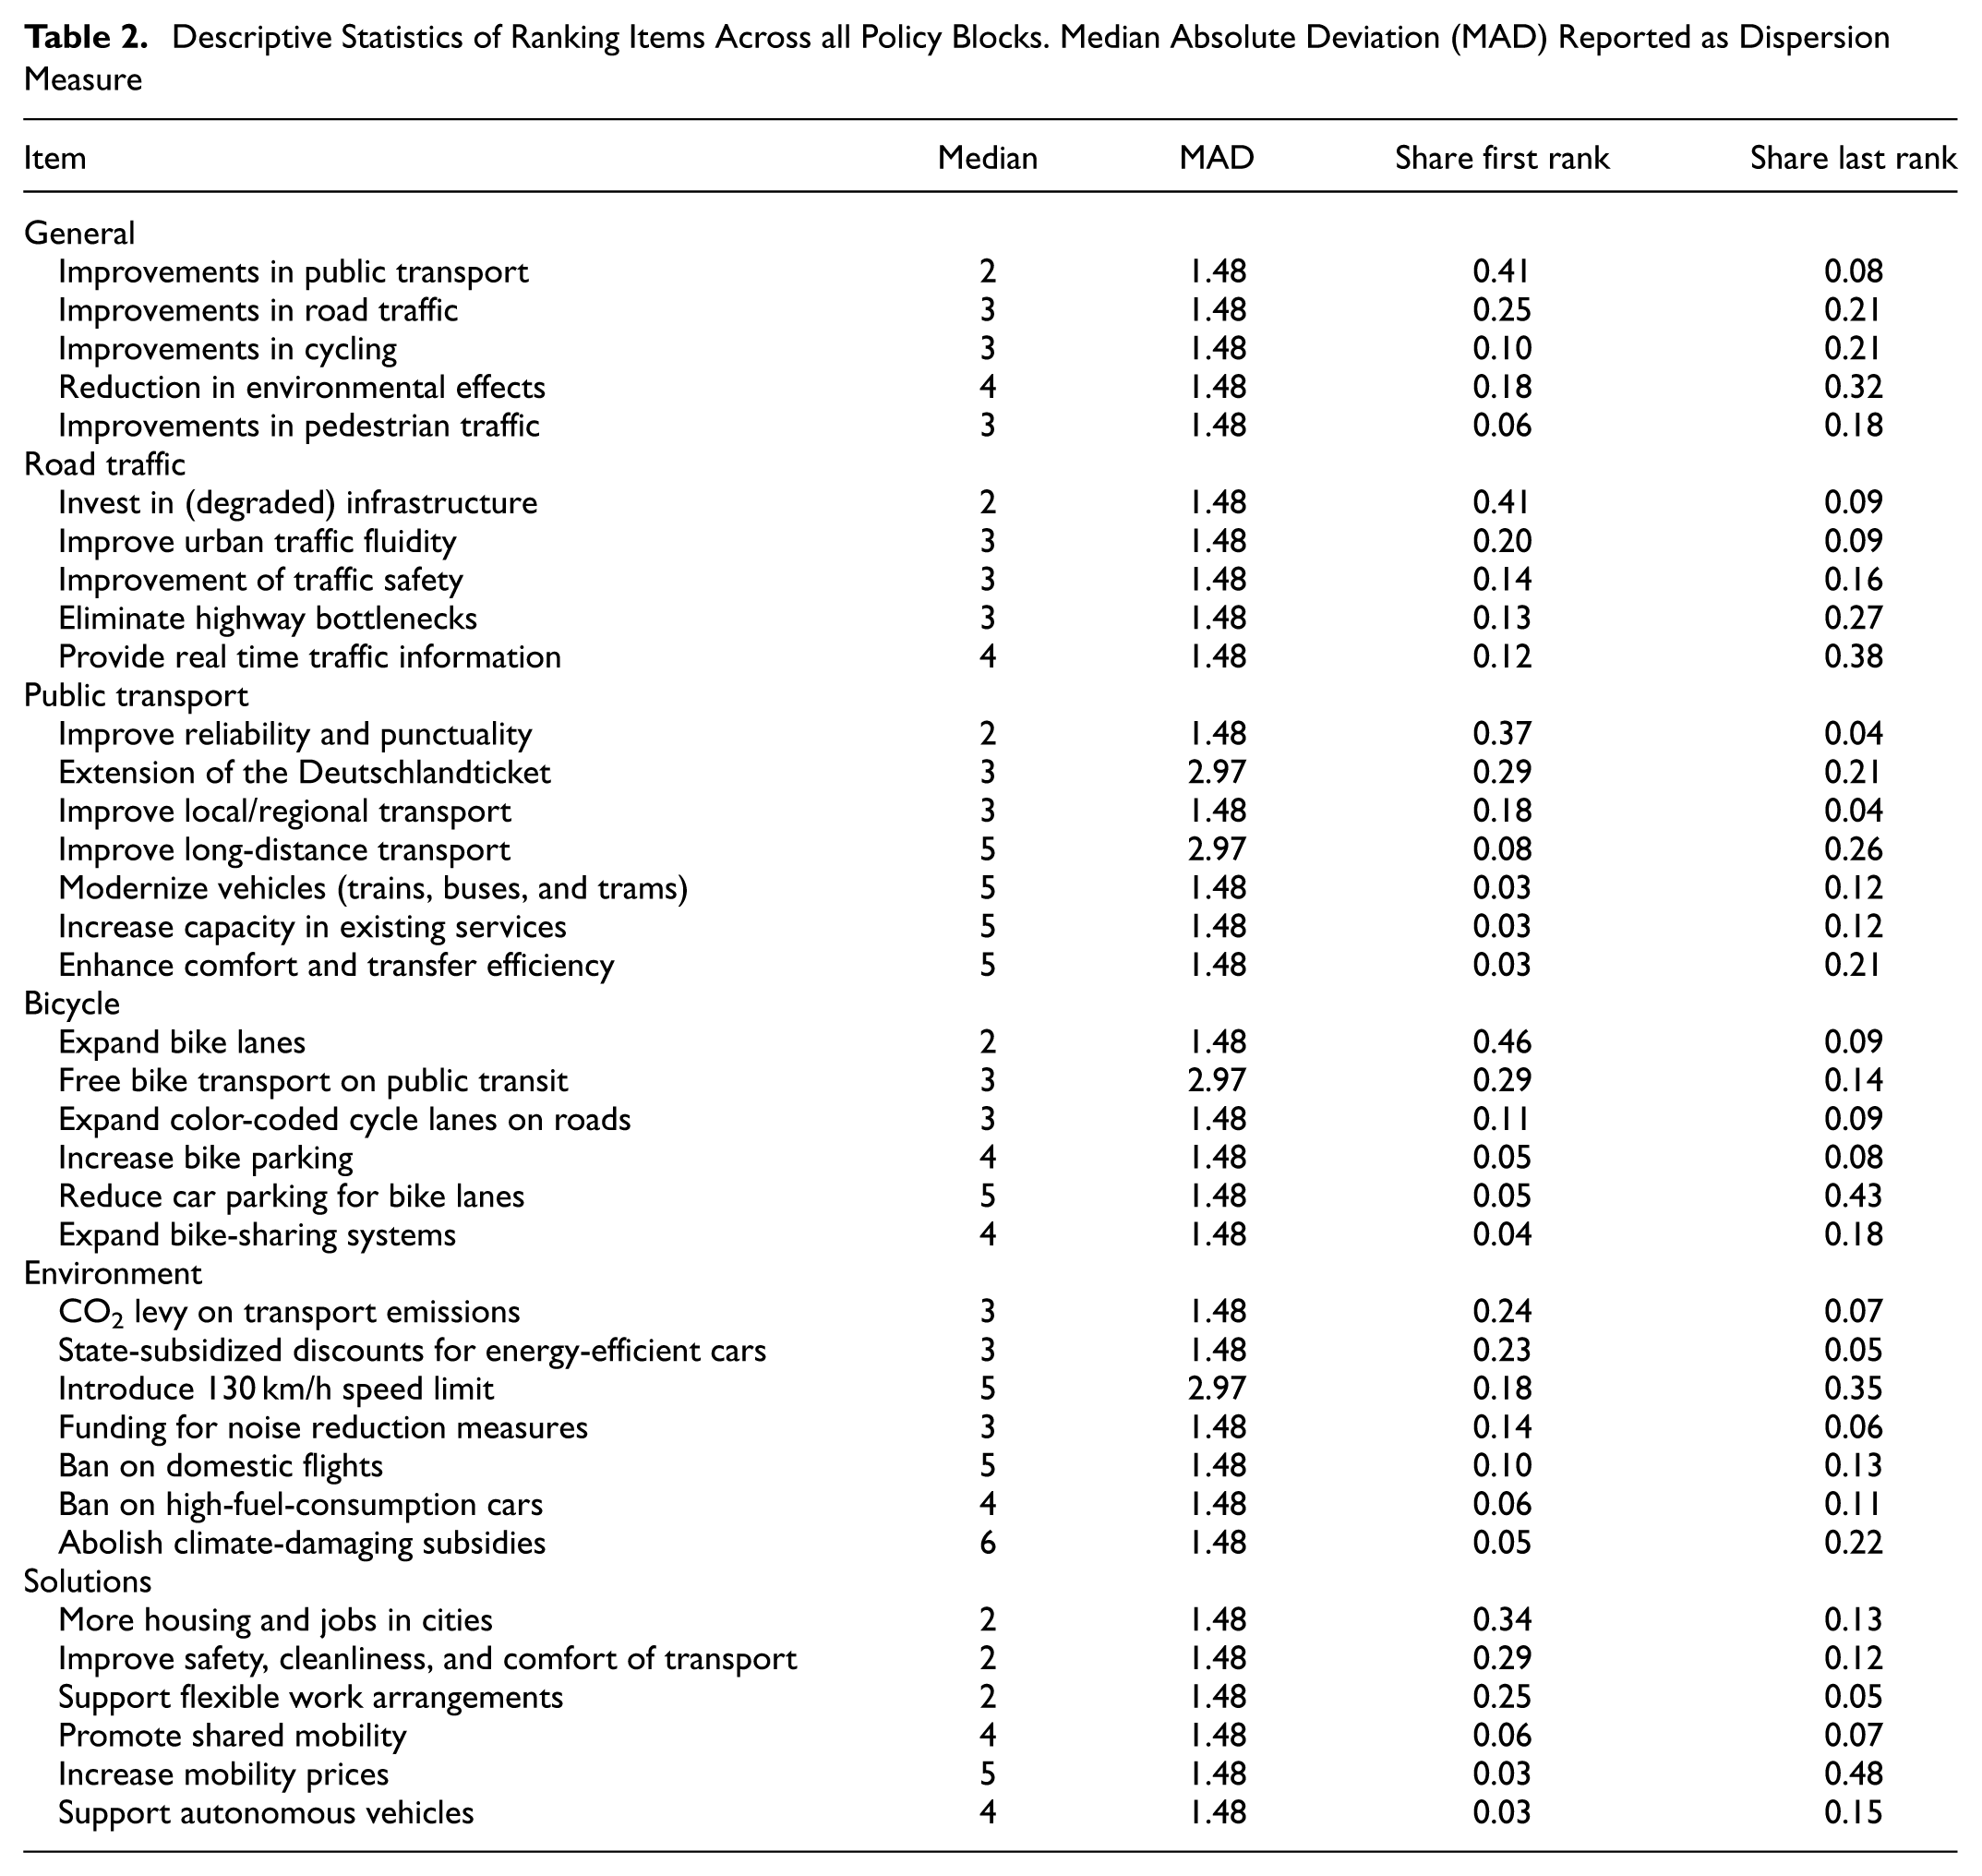
In Figure 1, the distribution of ranking positions for all policies is shown. Table 2 complements this by reporting the share of respondents placing it in the top or bottom rank, as well as its median rank and the median absolute deviation (MAD) for each item. Improvements in public transport are consistently prioritized. This is not unexpected, given the widespread perception that German public transport suffers from chronic underinvestment and unreliability ( 81 ). In Germany, public transport is a frequently used and common mode of transport. In total, 19% of the distance traveled is by public transport ( 59 ); therefore, the high prioritization of public transport might reflect personal usage and broader societal expectations and frustrations with current service levels. In total, 25% of respondents ranked “Improvements in road traffic” first. This aligns with Germany’s persistent reliance on the private car ( 59 ) and is visible in a high mode share in this study, as shown in Figure 7. The reduction in environmental effects was ranked by 18% of respondents as the most important topic; however, 32% ranked it lowest, indicating that there might be relevant heterogeneity in the population. In contrast, “Improvements to pedestrian traffic” was put only in 6% of the answers at the top rank and was ranked the lowest by 32% of respondents, despite 55% of respondents reporting walking daily or almost daily. This gap between mode share and prioritization highlights that politically salient issues are not directly dependent on usage.
Descriptive Statistics of Ranking Items Across all Policy Blocks. Median Absolute Deviation (MAD) Reported as Dispersion Measure
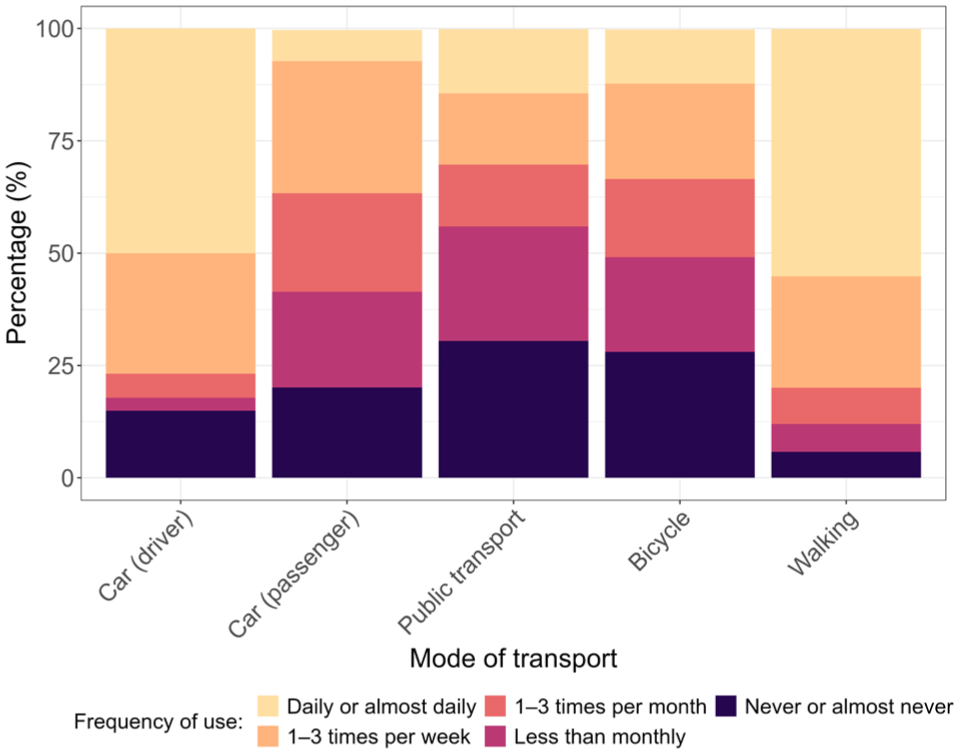
Mode share of the respondents.
In the public transport ranking block, the item “Improve reliability and punctuality” received 37% of all top rank placements. In addition, “Improve local and regional transport” was prioritized with 18%. Of interest, “Extension of the Deutschlandticket” received with 29% a high share of top rank positions among respondents. However, it was also ranked by 21% of people as the least important policy in the block. This highlights the importance of affordability as a distributed topic. It should be emphasized that the improvements in local public transport were ranked more important than the enhancement of long-distance travel.
Another noteworthy finding concerns traffic safety in the ranking block about road/car traffic. Although motorized traffic continues to impose high risks on public health ( 82 , 83 ), “Increase traffic safety” did not emerge among the top-ranked items, with only 14% ranking it top. This suggests that safety concerns do not dominate citizens’ immediate prioritization of transport policies. There appears to be consensus about the importance of investing in infrastructure. In the bicycle ranking block, infrastructure also exhibits high consensus: almost half of all respondents (46%) placed the expansion of bike lanes at the top of the ranking block, signaling broad support for strengthening cycling as a strategic policy direction. However, it is important to note that this expansion should not be at the expense of car parking because 43% of respondents ranked this policy at the lowest level. The high ranking of “Free bike transport on public transit” indicates that multimodality is an important need in the sample. Another contested topic is the speed limit in the environmental block. The high MAD of 2.97 indicates that a high proportion of people either prioritize this issue or strongly deprioritize it. Finally, respondents show a strong preference for more flexible work arrangements, which may indicate unmet expectations on work–life balance and commuting patterns. The descriptive results point to a public mandate for improving public transport infrastructure and reliability.
Transport Policy Preference Classes
To address the first research question on the identification of latent preference classes, Table 3 presents the four resulting classes, summarized by the policy items most frequently ranked within each thematic block as first or last. The selection of items is based on the estimated conditional probabilities and not the empirical distribution. The conditional probabilities reflect how likely each item was prioritized as most important within the respective class. The resulting classes were labeled as follows:
PT Advocates.
Long-Distance Optimizers.
Car-Oriented Pragmatists.
Multimodal Interventionists.
Summary of Cluster Characteristics
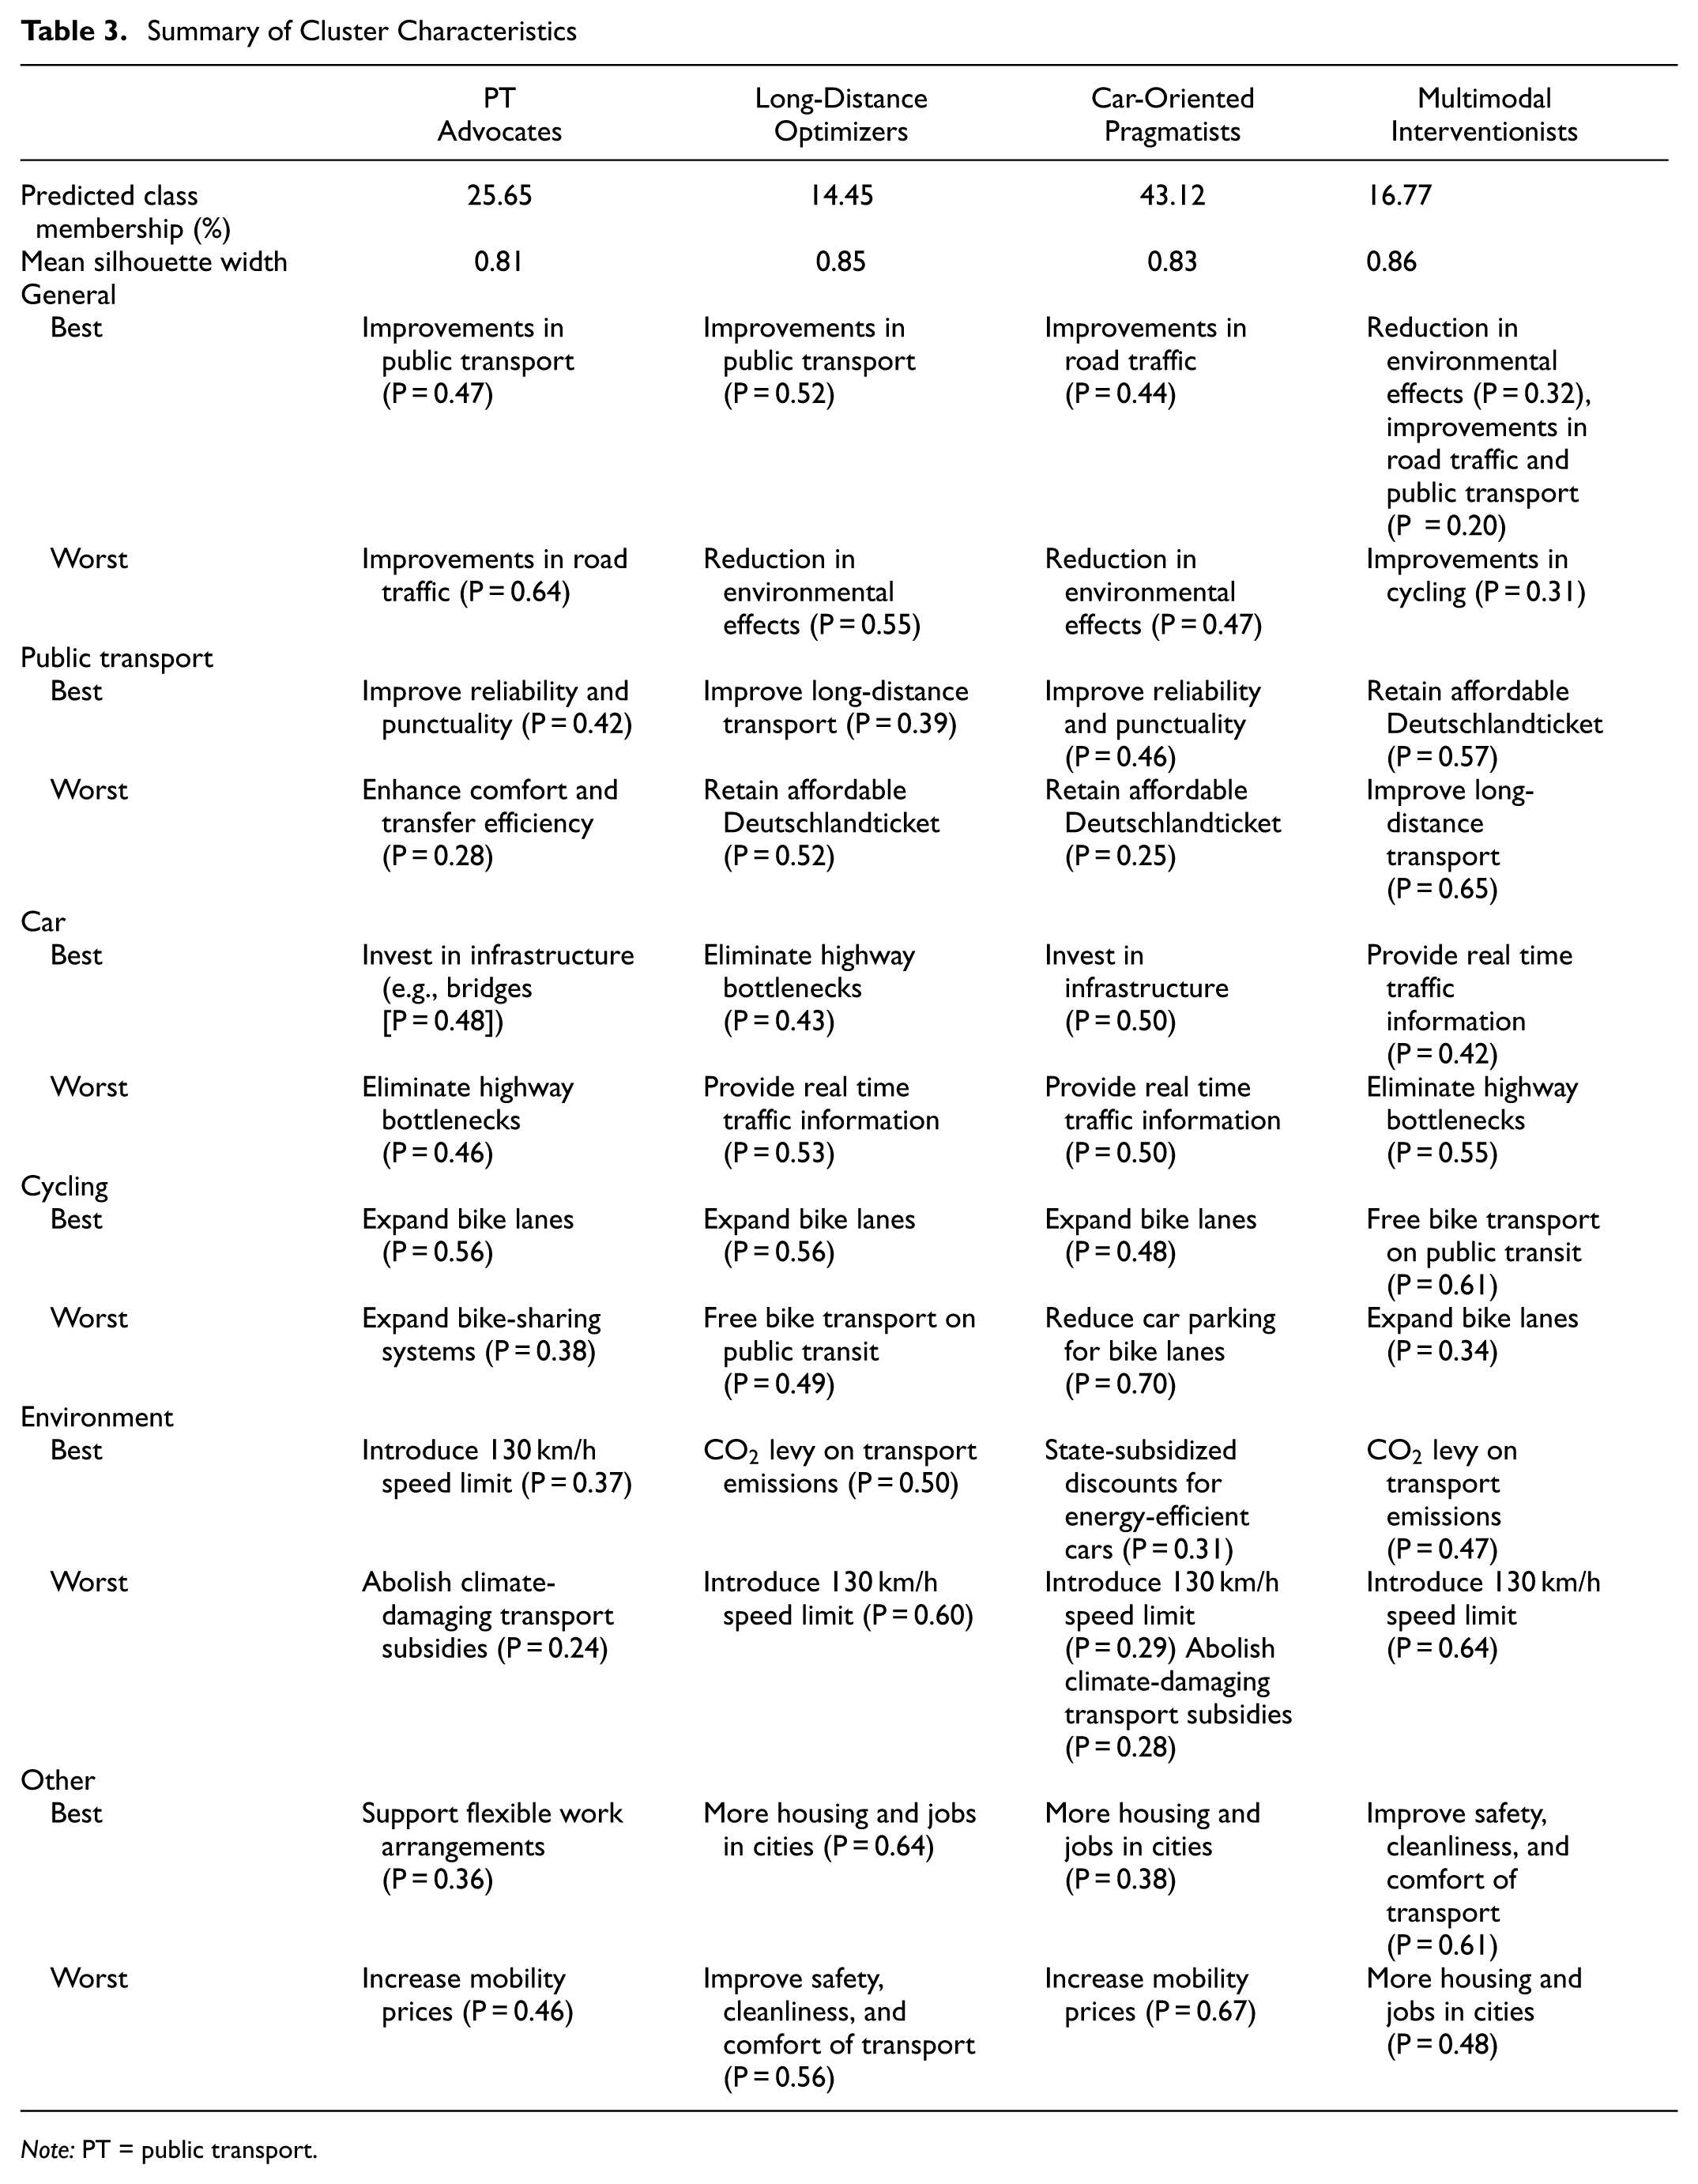
Note: PT = public transport.
The largest group by predicted class memberships, consisting of 43.12% of the sample, is the Car-Oriented Pragmatists. Respondents in this class consistently favor improvements in road traffic and reject measures aimed at reducing environmental effects. While they support improvements in the reliability and punctuality of public transport, they show limited interest in maintaining the affordable Deutschlandticket, a discounted ticket for regional and local public transport all over Germany ( 84 ). Of interest, this group supports the expansion of cycling infrastructure but strongly opposes its implementation at the expense of car parking. The item “reduce car parking for bike lanes” is most frequently ranked as worst in this cluster, with a conditional probability of 70%, highlighting the political sensitivity of pull measures framed as push measures. This preference pattern also aligns with their support for state subsidies for efficient vehicles and their rejection of regulatory environmental measures such as highway speed limits and the abolishment of harmful transport subsidies. In this group, the respondents live more in suburban and rural areas, which aligns with a heavy reliance on car usage in their daily lives, as indicated by the results in Table 4. This group exhibits a coherent preference structure: a strong orientation toward car-based mobility, support for infrastructure investments and land use improvements, and the selective endorsement of fiscal incentives, provided they reinforce, rather than restrict, automobility.
Posterior-Weighted Covariate Means by Latent Class
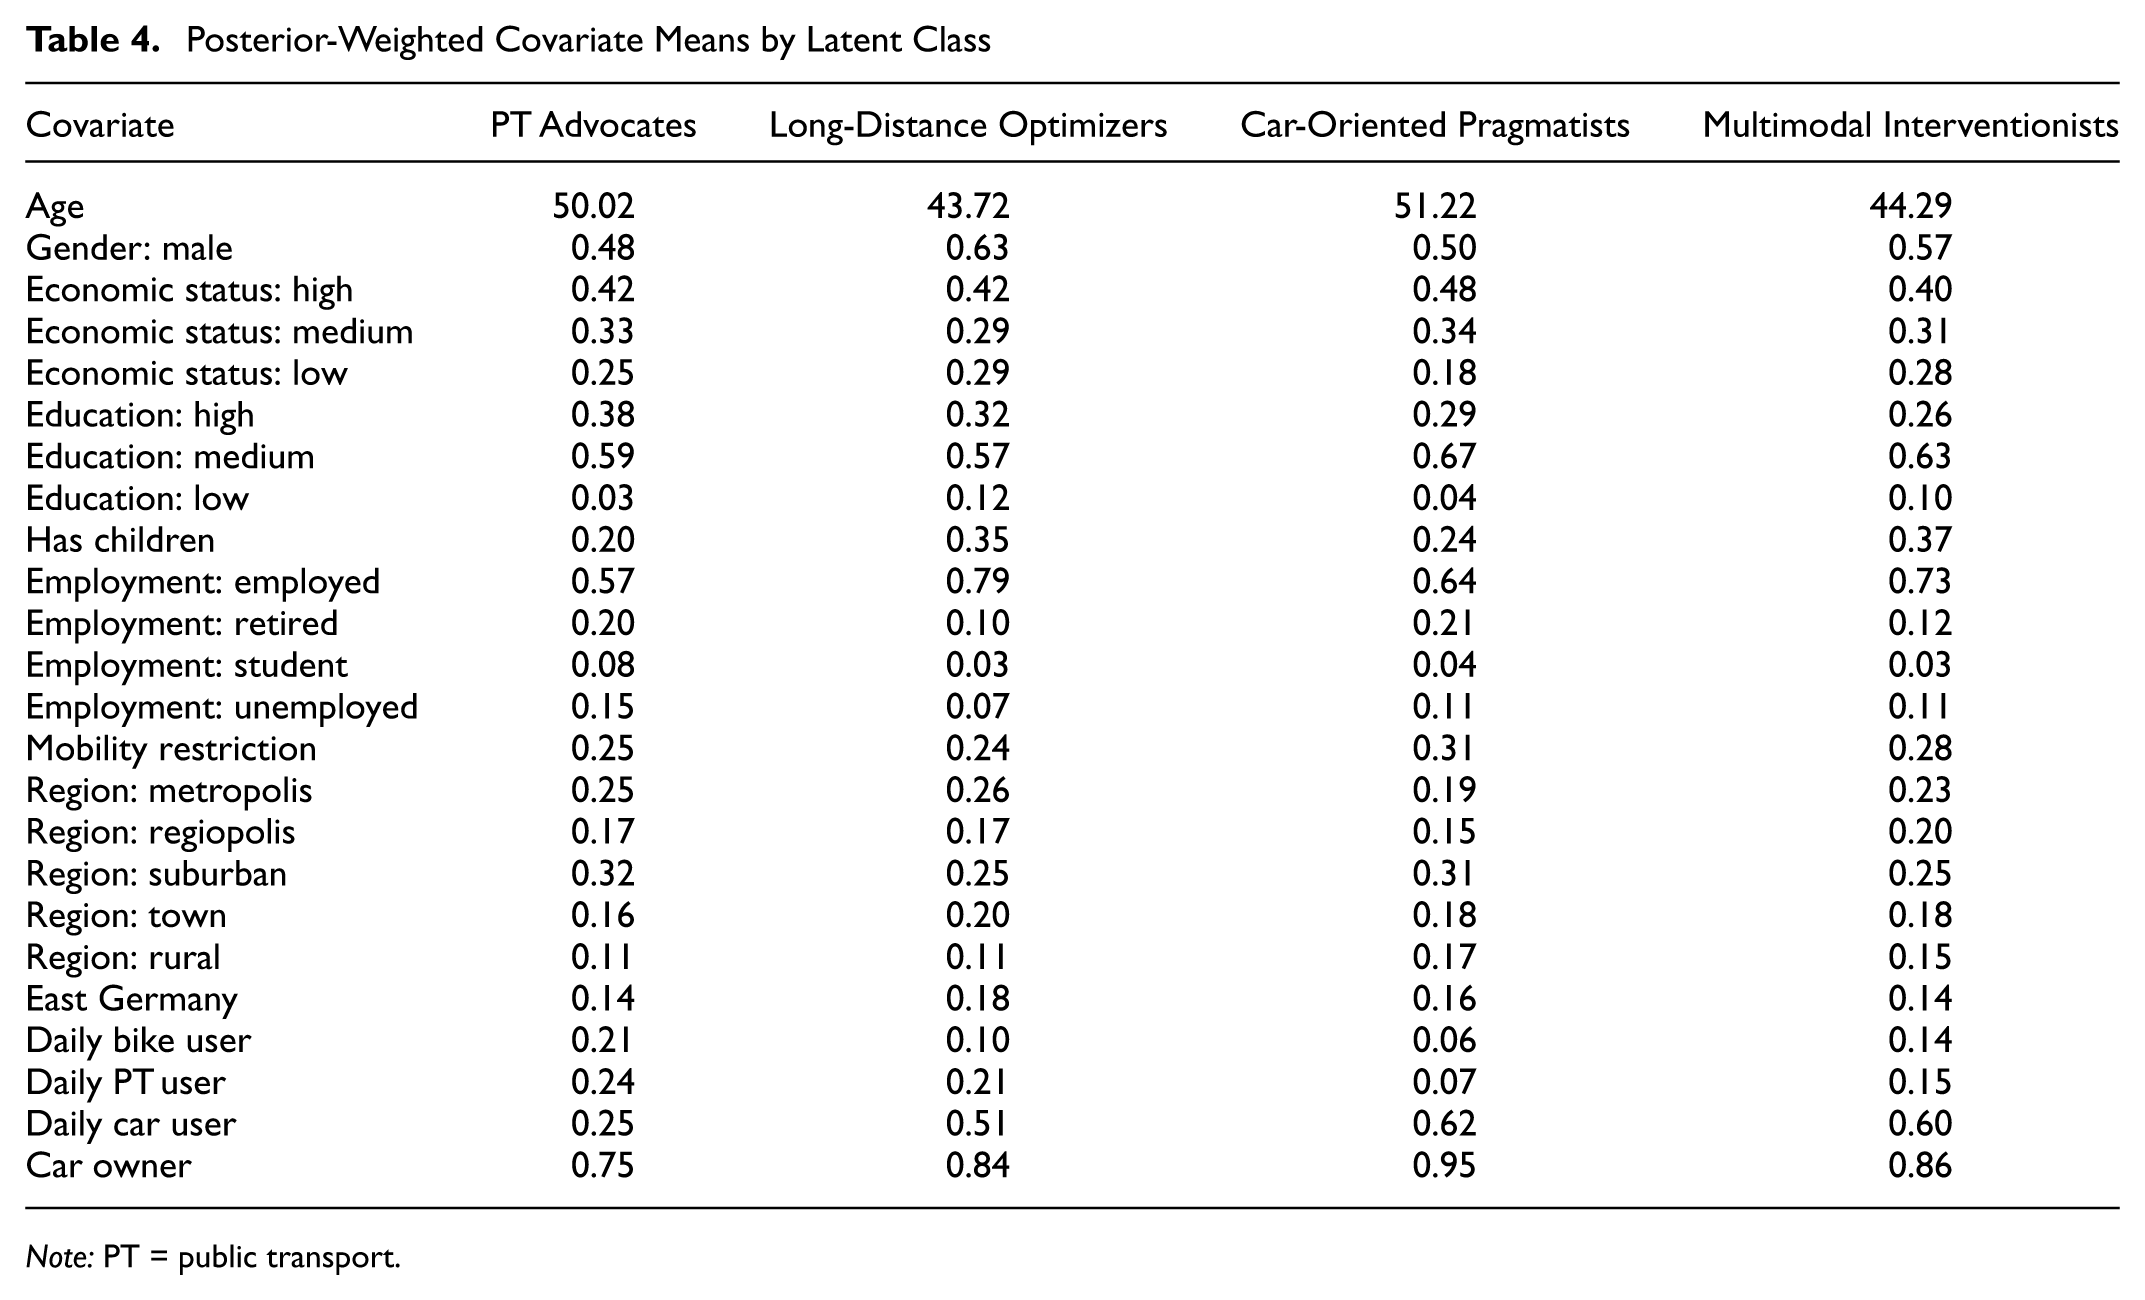
Note: PT = public transport.
The second largest class (25.65%), labeled as PT Advocates, displays a clear preference for improvements in public transport, particularly on reliability and punctuality. In the general ranking question, little support is given to improvements in road traffic; however, in the question block about road infrastructure, investment in infrastructure is the highest-ranked policy. Since the elimination of highway bottlenecks is ranked lowest, this could still suggest a low priority for car-centered measures. Of note, 37% of respondents within this class ranked introducing a speed limit as their top environmental measure. However, this class simultaneously rejects the abolishment of harmful transport subsidies. In the German context, these subsidies typically benefit private car ownership and the use of fossil fuels. This contradiction raises the question about how respondents interpret the term harmful subsidies and whether they associate it with other forms of economic support. In line with their general orientation toward sustainable public transport usage and urban mobility, this group also supports flexible work arrangements.
The third-largest class (16.77%) was labeled Multimodal Interventionists because of their broad yet internally inconsistent preference profile. While this group generally supports measures aimed at reducing environmental effects, 20% of respondents within the class also prioritized improvements in road infrastructure and public transport, indicating a more heterogeneous orientation and an openness to enhancements across multiple transport modes. This is the only class in which the most preferred public transport measure is the retention of the Deutschlandticket. This group also favors more housing and jobs in the city; therefore, this group could be heavily using public transport for their day-to-day activities, and often live in urban and suburban contexts. Of interest, this is the only group that does not favor expanding cycling infrastructure. Their most supported environmental measure is the introduction of a CO2 levy, and they also prioritize improvements in safety, cleanliness, and comfort in transport. This class exhibits a preference for soft operational improvements and pricing interventions, but is more skeptical of disruptive physical or spatial changes. The rejection of infrastructure measures, even if aimed at active mobility, distinguishes them from other clusters. Reasons could be that this group already relies on public transport usage, might commute longer distances, and comes from different income classes. Therefore, from the results, this group might primarily be interested in affordable public transport, dislikes disruptions to service levels because of construction, and is willing to support higher levies when mainly targeted at other transport modes. Further research is needed to investigate the exact reasons and interests of this heterogeneous group.
The smallest class, consisting of 14.45% of the sample, was the Long-Distance Optimizers. Respondents in this group appear to prioritize measures that enhance the efficiency of longer trips. Their top-ranked measures include long-distance public transport improvements and the elimination of highway bottlenecks. In the environmental block, they most strongly support a CO2 levy on transport emissions but are notably critical of a general highway speed limit. In contrast to other classes, this group expresses the lowest preference for retaining the Deutschlandticket, suggesting an orientation toward system efficiency rather than equity or affordability. This is also the only group that prioritizes long-distance improvements in contrast to enhancing regional public transport. They indicate that when they use public transport, they may mainly use it for traveling longer distances, which could explain their low preference for the Deutschlandticket. This group has the highest percentage of people coming from mid-sized areas, suggesting that they might prefer a better integration into the long-distance network. This class exhibits a policy profile focused on network performance and regional connectivity.
Values for categorical covariates represent posterior-weighted class shares. Age reflects the posterior-weighted mean. The values are computed from individual posterior class membership probabilities obtained in the LCA.
The second research question addresses whether people are also willing to prioritize push measures. Most push measures were included in the environmental policy ranking block. Based on the presented literature review, push policies such as taxes or bans should be ranked among the least preferred items, and pull measures such as subsidies should dominate the top ranks across the preference classes. This expectation is met in the Car-Oriented Pragmatists class, where a typical pull measure, such as the state-subsidized discounts for energy-efficient cars, is most frequently chosen as the best option. Regulatory push measures aimed at abolishing climate-damaging transport subsidies appear among the least preferred policies in this class. This expected pattern of opposition toward push measures does not hold across all classes. In the PT Advocates, the speed limit on German highways, typically considered a push policy, is the measure most likely to be ranked in the top position. Similarly, the Long-Distance Optimizers and Multimodal Interventionists prioritize a fiscal push measure, ranking the CO2 levy highest. This is a notable finding, as this tax is generally expected to increase individual travel costs. These results are somewhat unexpected, given the academic consensus that push measures tend to encounter stronger public resistance because of their restrictive nature (3–5). The observation that, in three out of four policy preference classes, respondents rank push measures as top priorities within the environmental block suggests that opposition to such measures may not be universal. Several explanations may account for these findings. First, when push measures are embedded within a broader preference profile and aligned with a particular normative worldview, they may receive greater acceptance. Therefore, support may emerge when these measures are perceived as consistent with an overarching policy doctrine that reflects individuals’ goals and values. Second, push measures may be prioritized by individuals who are less directly affected by them. For instance, Long-Distance Optimizers and PT Advocates rank the CO2 levy highly, potentially because individuals in these classes are less likely to own or regularly use a car compared with Car-Oriented Pragmatists. It is plausible that respondents anticipate that a CO2 levy would primarily increase costs for less sustainable modes of transport, such as private car use and air travel. Third, the relatively abstract formulation of a CO2 levy in the survey may have influenced responses. As respondents were not provided with concrete information on the magnitude of price increases, the measure may have been easier to support in principle. It is conceivable that more explicit information on cost implications would lead to different ranking behavior.
In this study, it must be acknowledged that randomization of item order failed in the environmental block. The fixed display order may bias the resulting rankings, particularly because the survey design required at least one modification to the displayed order: respondents could proceed after moving only a single item. Under inattentive responding, this increases the likelihood of near-identical rankings with minimal adjustments. A further threat to internal validity arises from general order effects, where the initial presentation of items can shape respondents’ assessments and reduce the study’s internal validity (
85
). This might be especially problematic when the order remains fixed, and the ordering effect systematically affects choice behavior. To assess the magnitude of this risk, item-level variances aggregated at the block level were calculated first. If nonrandomization had biased the rankings, substantially lower heterogeneity would be expected in the environmental block relative to the randomized blocks. Second, the distribution of the normalized Kendall
The results could suggest that opposition to push measures is not universal. When push measures are part of a broader policy vision or of a preference bundle, respondents appear willing to prioritize them over pull-based alternatives.
A common challenge in latent class regression modeling is interpreting the effects of covariates. As shown in Figure 5 (based on a similar depiction used in the literature [ 11 ]), covariates influence the latent class indicators only indirectly, through their effect on latent class membership ( 87 ). The estimated coefficients represent the log-odds of belonging to a particular class, conditional on all other covariates in the model, which makes direct interpretation difficult. To improve interpretability, odds ratios (ORs) were calculated, which express how the odds of being assigned to a specific class change with a given covariate value. The results of the analysis are depicted in Table 5.
Latent Class Regression Coefficients and Odds Ratios (Reference = Class 1)
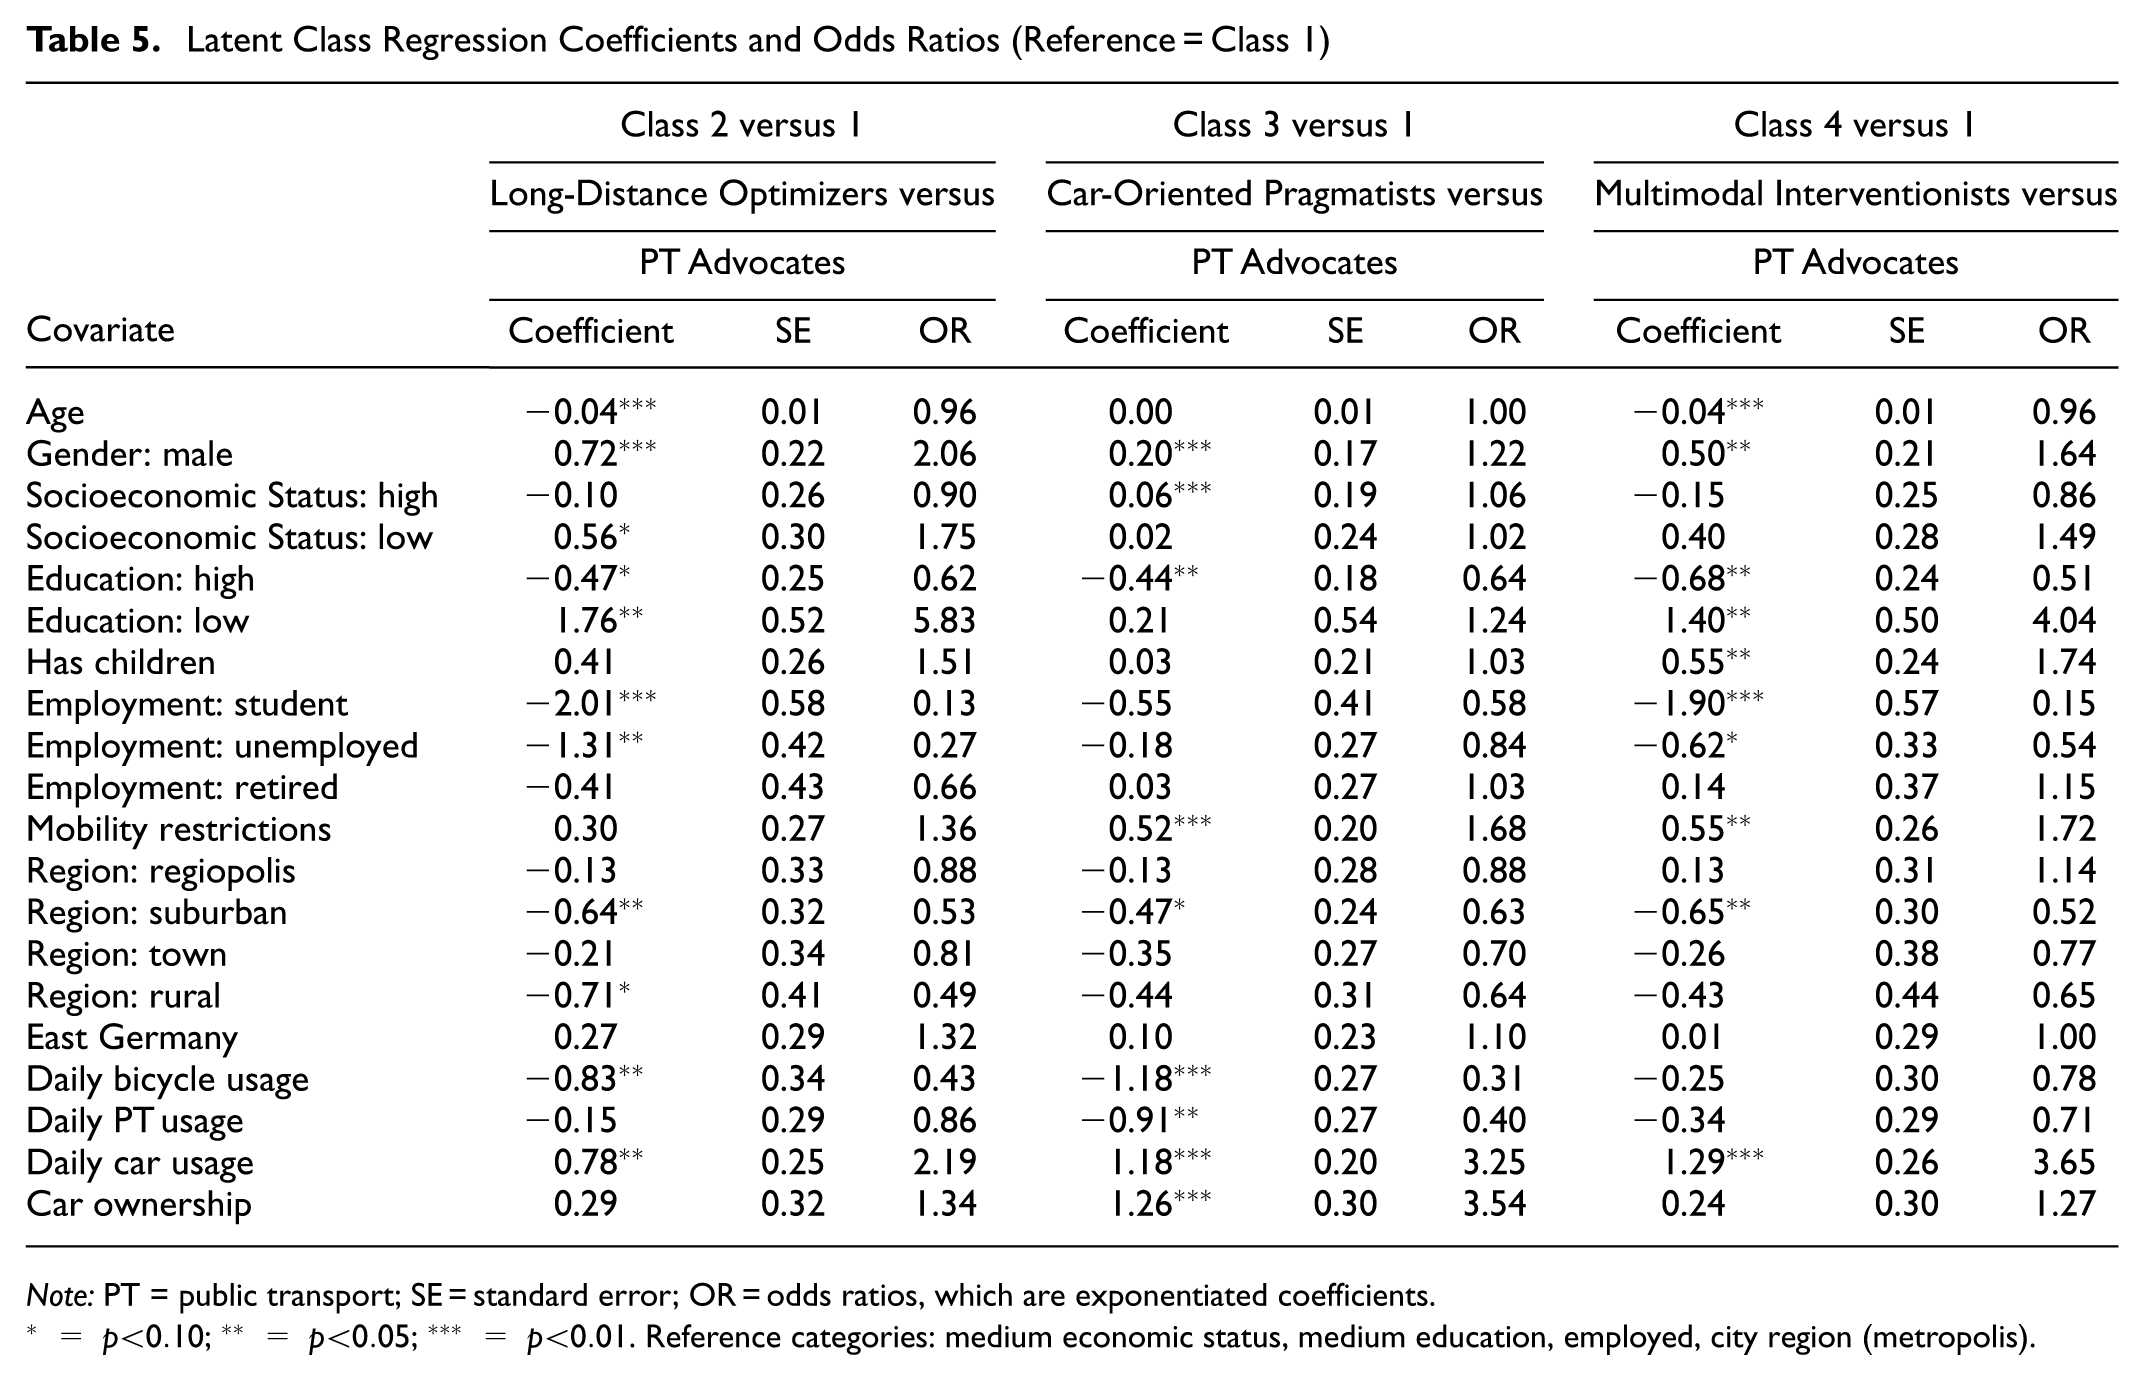
Note: PT = public transport; SE = standard error; OR = odds ratios, which are exponentiated coefficients.
To further examine how covariates shape class membership, posterior-weighted averages were computed, which have been employed in previous studies ( 88 ). These averages are calculated from the observed covariate values in our sample, weighted by each individual’s posterior probability of belonging to a certain class. Therefore, they account for uncertainty in class assignments. As given in Table 4, several covariate means vary meaningfully across classes. For instance, the proportion of daily cyclists is 21% in the PT Advocates class but falls to 6% among the Car-Oriented Pragmatists.
Principal Component Analysis
PCA is used to reduce the dimensionality of the covariates. The first two components of the PCA together explain 89% of the total variance. Table 6 gives the resulting loadings. PC1 spans a young, lower-status, working-family pole at the positive end to an older, higher-status, nonworking pole at the negative end. PC2 runs from an “active–PT–urban” pole at the negative end to a “car–rural–restricted” pole at the positive end. Although covariates such as education, employment, and regional context contribute to both components, PC1 can be broadly interpreted as a sociodemographic axis and PC2 as a travel behavior axis.
PCA Loadings for Covariates (PC1 and PC2) Including Reference Categories
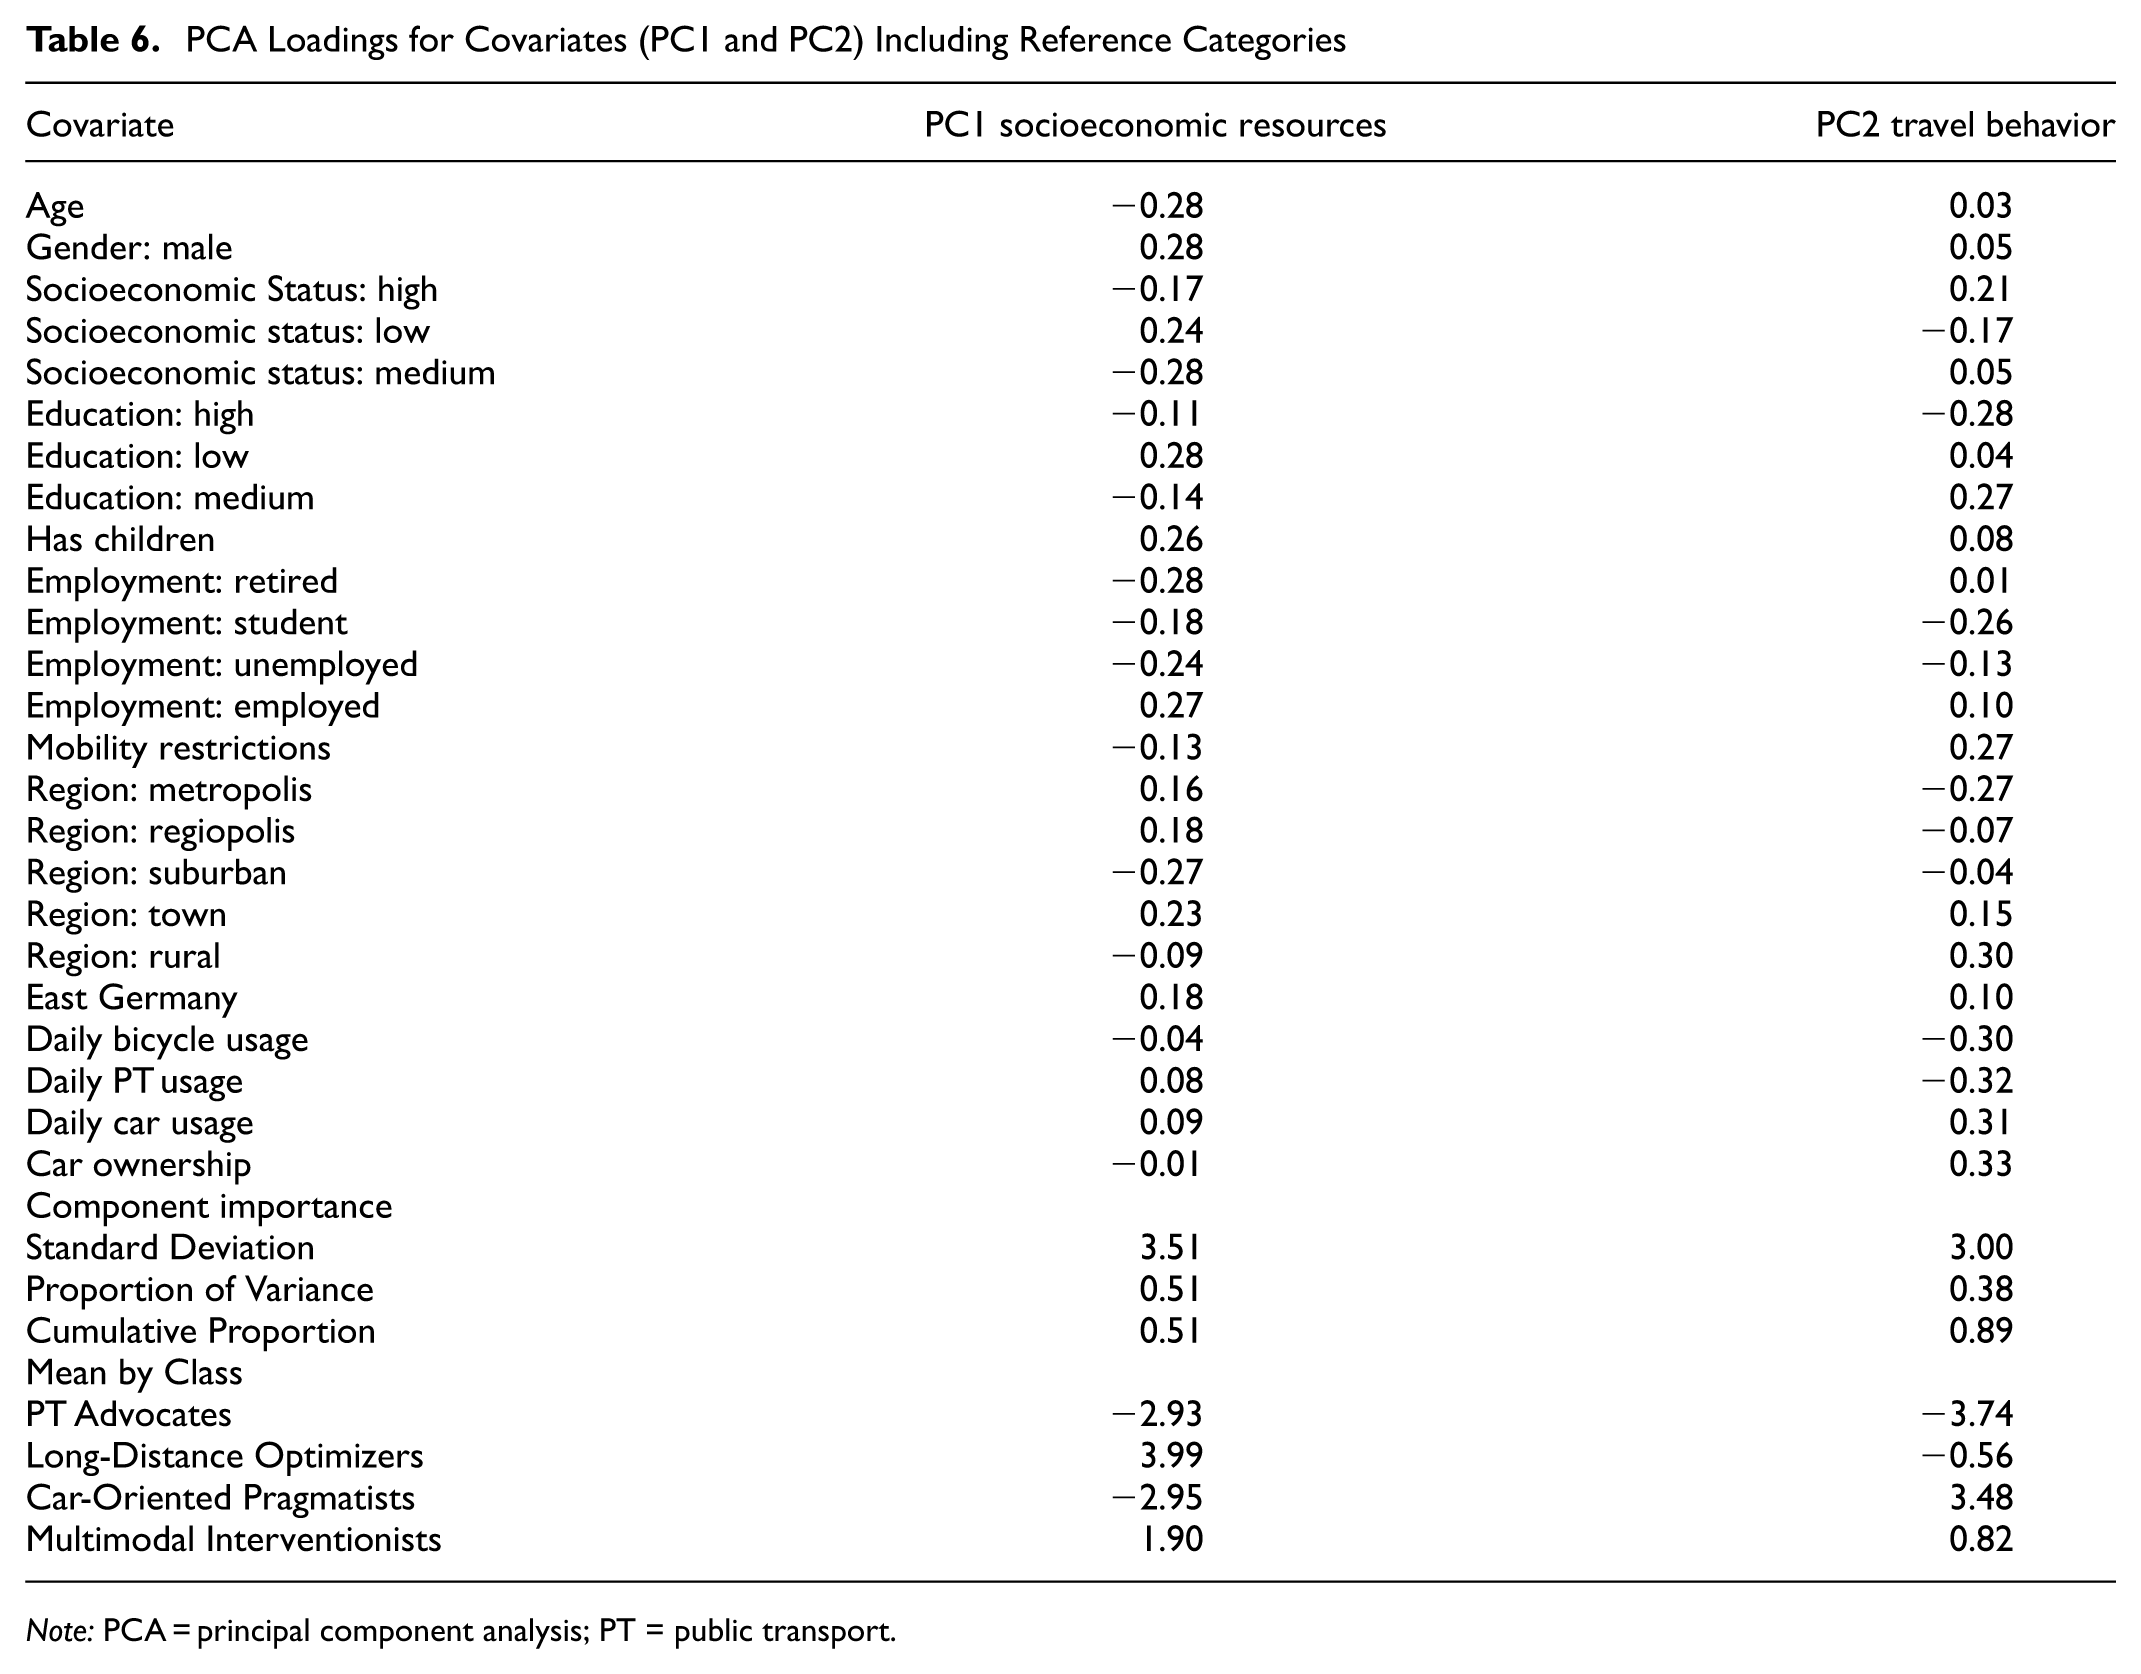
Note: PCA = principal component analysis; PT = public transport.
Figure 8 shows how the four classes are positioned on these two PCA dimensions. These results are used to answer the third research question and interpret the PCA axis as broader lines of conflict in policy preferences. The Car-Oriented Pragmatists and the PT Advocates both lie on the negative side of PC1, which corresponds to higher socioeconomic resources (higher education, older age, nonworking, childless, and female). They diverge along PC2, the travel behavior axis: the PT Advocates score negatively on PC2, indicating low car ownership, high daily public transport and bicycle use, predominantly urban residence, fewer mobility restrictions, and a higher probability of being highly educated or a student; the Car-Oriented Pragmatists score positively on PC2, reflecting high car ownership and usage, more rural residence, and greater mobility restrictions. In contrast, the Long-Distance Optimizers and Multimodal Interventionists fall on the positive side of PC1, indicating lower socioeconomic resources, but classes near zero on PC2. Therefore, travel behavior does not meaningfully distinguish these two lower-resource groups. In combination, this pattern suggests that travel behavior emerges as a salient policy cleavage primarily among higher-resource segments, where mode choices reflect genuine preferences rather than constraints of availability or affordability.
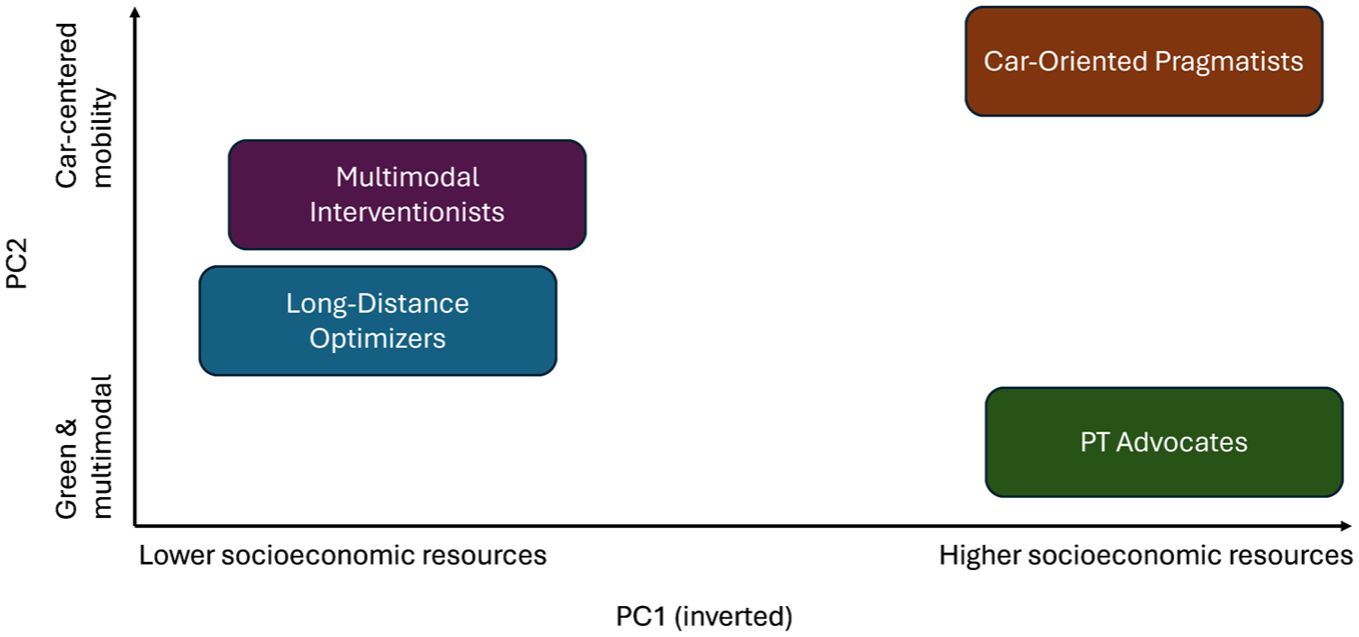
Policy preference cleavages based on travel behavior and socioeconomic resources.
When the findings are related to the societal cleavages discussed in the literature review, a conflict line emerges between what could be described as an active–PT–urban orientation versus a car–rural–restricted pattern. The behavioral divide is intertwined with spatial accessibility and the identified center–periphery cleavage. However, what stands out is that the travel behavior cleavage seems to only influence policy preferences when aligned with higher socioeconomic resources.
Discussion
Policy Implication
Looking at the descriptive statistics of the ranking questions, in many transport policy areas, there is a certain degree of consensus. For general prioritization, road traffic, and public transport, the share of the top-ranked measure is close to 40% or higher, given 5–7 measures to choose from. These top-voted measures are “Improvement in public transport”(general), “Invest in infrastructure” (road traffic), “Improve reliability and punctuality” (public transport), and “Expand bike lanes” (bicycle). The high share of these top-voted measures suggests that overall transport policy preferences are not strongly polarized. Certain items, however, appear more polarized. This is indicated because some measures receive a relatively high share of both top and lowest rankings, close to 20%. Examples include “Improvements in road traffic” (general), “Reduction of environmental effects” (general), and “Retain affordable Deutschlandticket” (public transport). This pattern is interpreted as evidence that polarization in transport policy is situational, arising for specific policies rather than across the policy domain. These patterns resonate with arguments made in the German debate on “Triggerpunkte” (trigger points) ( 89 ): a broad consensus exists in German society. This is seen in general improvements, such as public transport investment, bridge maintenance, or the expansion of bike lanes, while only a few issues become societal conflicts. The results show a similar dynamic: many measures attract wide agreement, environmental policies (road transport and environmental effects), and affordability generate the highest heterogeneity, with some groups strongly prioritizing them and others firmly rejecting them. These issues do not emerge as conflict points on their own; they are actively amplified and framed as societal fault lines by political actors, media outlets, and organized interest groups, which contributes to their heightened polarization ( 89 ).
To further investigate this heterogeneity, transport policy preference classes were analyzed. These classes show that there are distinct societal groups that prioritize different policies. For policymakers, it is important to take these groups and distributional effects on them into account when they want to design acceptable and equitable policies. For example, within the Multimodal Interventionists who are estimated to make up 17% of the sample, affordability of public transport is ranked higher than service improvements, in contrast to the other groups. With limited resources, there is a trade-off for affordability. For groups with lower socioeconomic status, such as the Multimodal Interventionists, it is an important topic because affordability makes public transport accessible. However, funding is required to make costly infrastructure improvements possible. It is possible that a more targeted approach would be more appropriate. The primary objective is to ensure that tickets are available at a reasonable price for individuals of a lower socioeconomic status, while also maintaining an appropriate price for those who possess the necessary financial resources.
When the findings are related to the political and sociodemographic cleavages discussed in the literature review, a conflict line emerges between what could be described as an active–public transport–urban orientation versus a car–rural–restricted pattern. As modes often compete for resources, space, and political attention, travel behavior structures policy preferences. How people move through space shapes how they perceive, prioritize, and are affected by transport measures. The behavioral divide is intertwined with spatial accessibility and the identified center–periphery cleavage. The Car-Oriented Pragmatists, for instance, are characterized by car-dependent routines, rural residence, and a preference for efficiency-focused, car-friendly policies such as road improvements or subsidies for low-emission vehicles. In addition, they express strong opposition to environmental push measures. In contrast, urban centrality in the PT Advocates correlates with daily use of public and active modes, and a greater openness to policies that favor public transport or restrict car use. However, what stands out is that the travel behavior cleavage seems to only influence policy preferences when aligned with higher socioeconomic resources. This suggests that material conditions are not just background factors, but key drivers of transport preference. The Long-Distance Optimizers and Multimodal Interventionists, for example, differ from the other two classes in policy orientation and demographic profile. They sit in a more ambivalent position in the travel behavior cleavage but are united by lower socioeconomic resources. Their preferences reflect concerns for affordability and access, supporting, for example, the Deutschlandticket or investments in housing and jobs in cities.
A key finding of the analysis is that resistance to push measures is not universal. This has policy relevance: price increases or the reduction of traffic subsidies need not provoke broad opposition if they are coupled with visible pull measures that offer concrete benefits. The classes demonstrate that different groups prioritize different improvements, for example, the Long-Distance Optimizers favor regional and long-distance public transport upgrades, and the PT Advocates focus more on local services. This suggests that revenues from stricter car-related policies should be channeled into alternatives that directly benefit the groups most affected, rather than into areas where these groups see little personal gain (e.g., purely urban cycling infrastructure).
Methodology
This study contributes content-wise to the discussion on policy preferences and uses an innovative approach for reducing the dimensionality of the six ranking blocks. Therefore, this approach of selecting the best- and worst-ranked policy items across the thematic question blocks is an interesting and effective new approach for utilizing such a multitude of ranking questions in LCA. Some studies suggest relying only on the top-ranked alternatives ( 90 ); the best and worst items were included in this study to capture the full polarity of respondent preferences. In addition, the analysis was tested only with the best-ranked items; however, the inclusion of the worst-ranked policies would allow a better understanding of the conflict lines. However, this choice comes at the cost of losing the middle-ground nuance, which could provide further granularity. To assess the implications of losing mid-rank variation, the LCA was tested by including the full ranking into the model. The results are robust, and the same items occupy the first and last ranks, albeit with slightly different probabilities. These results are included in Table 9 in the Appendix. Of note, the mid-rank probabilities of the conditional class outcomes are more equal and evenly distributed compared with the best and worst items. This observation was tested by computing the Gini index for each class and each rank within each block and subsequently averaging these class-level values. This resulted in a single Gini index per rank ( 91 ). The Gini coefficient captures inequality as the mean absolute distance between all pairs of observations and ranges from zero (perfect equality) to one (maximum inequality) ( 92 ). Consistent with the theoretical expectation, the middle ranks exhibit markedly lower Gini values, indicating higher uniformity and, therefore, greater randomness or uncertainty, compared with the extreme ranks. This pattern is shown in Figure 9. Pairwise Wilcoxon tests confirm that the best and worst ranks differ significantly from the middle ranks for their Gini distributions (Appendix Table 10). Given the substantially higher uncertainty and lower discriminatory power associated with middle ranks, using only the best and worst items provides the most robust and analytically meaningful information for identifying policy cleavages. One limitation comes from unequal salience across the policy blocks. The general block was not only cognitively the least demanding by covering broad policies, and by being the first question in this survey block.
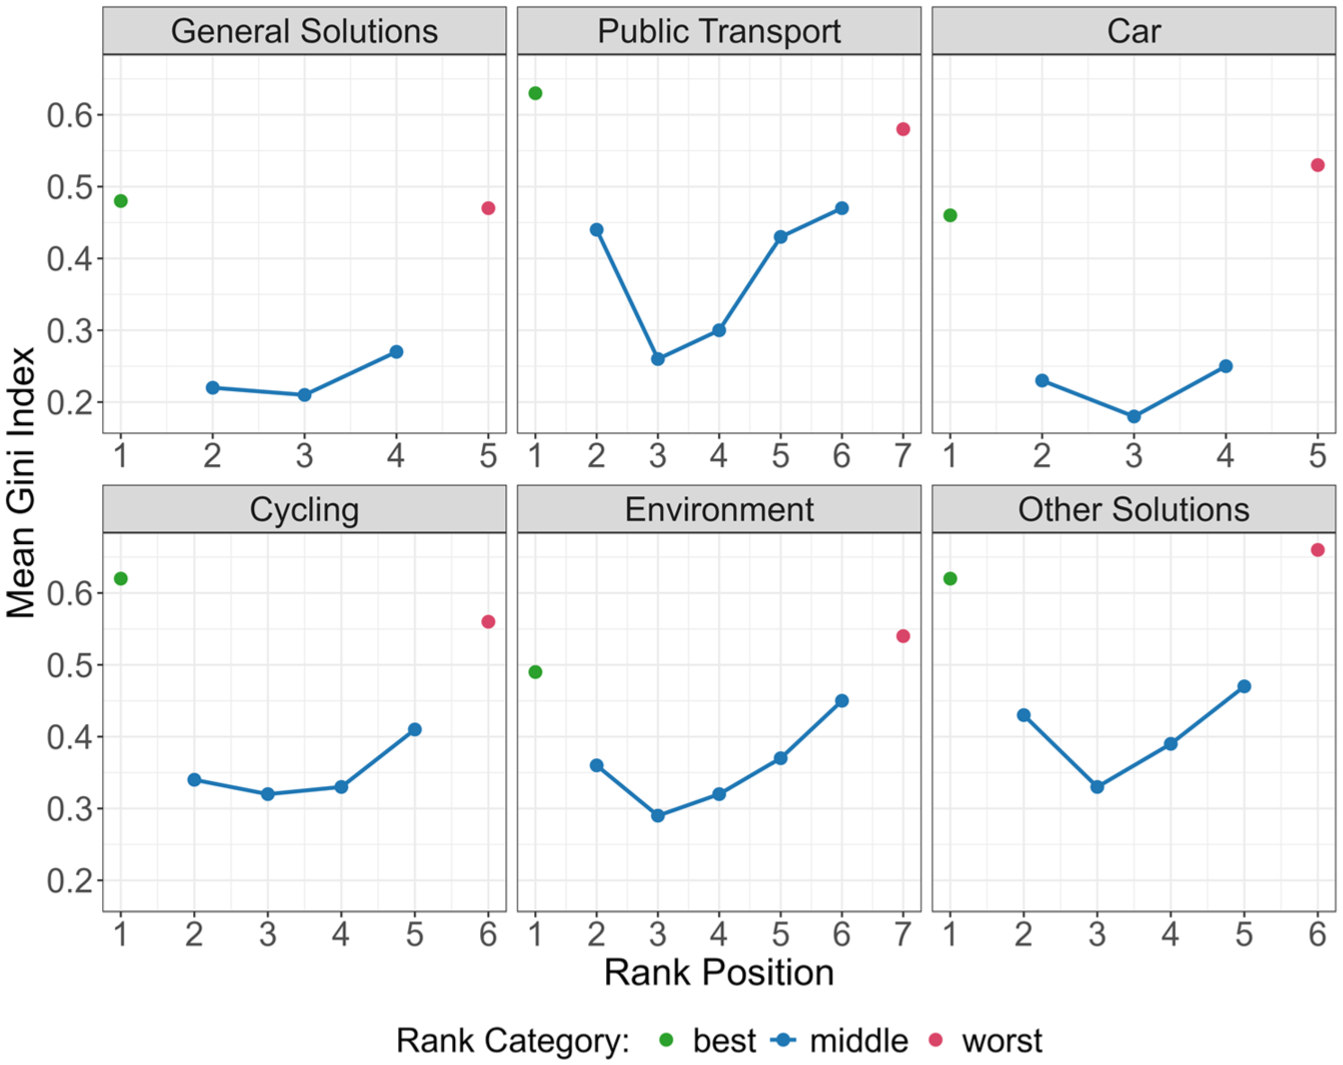
Mean Gini index for each block.
Future Research
The limitation of this study is how political cleavages can be extracted across different ranking blocks when information on the relationships between blocks is limited. Of note, conclusions could only be drawn on preferences rather than about overall policy acceptance. What was observed were conditional preferences: respondents evaluated each policy item relative to the other items presented within the same block. This constrains the scope of the conclusions that can be drawn. However, this structure is analytically meaningful. In representative democratic processes, individuals are rarely asked for absolute judgments; instead, they are confronted with a limited set of policy options and must articulate their relative preference among them. This study approach mirrors this logic. For each transport mode, how respondents prioritize improvements was captured, even if they are not heavy users of a particular mode, to understand what type of policy direction they would still favor within that domain.
Because a wide range of policy areas were included in the ranking questions, the level of specificity varies across and within the different blocks. The more general ranking block focuses on broad policy objectives; the mode-specific blocks and the environmental block include more concrete policy measures, such as the expansion of the Deutschlandticket, a ban on domestic flights, or expanding bike-sharing systems. In developing the survey, aligning the items with current policy debates in the transport sector was attempted, selecting measures that are widely discussed in the media and policy realm to ensure both relevance and recognizability. Examples were included when deemed necessary. However, the resulting variation in specificity, especially because of adding very specific examples such as financing of measures to reduce traffic noise (e.g., low-noise road surface and quieter trains), also entails certain risks. It becomes unclear whether the respondents rank the broader policy items or the different examples named, implying that the same policy item is not interpreted uniformly across individuals. Moreover, more abstract policy areas, such as those related to walking or environmental measures, are likely to involve greater uncertainty when respondents form their preferences. Respondents may have less developed preferences in these areas or struggle to meaningfully rank policies they perceive as distant or less relevant. One way forward would be to explicitly ask for certainty levels for each ranking task or allow respondents to skip blocks where they feel uninformed. Of note, the first ranking block, in which respondents prioritized broad fields of transport improvements, provides a general picture of overall priorities (as shown in Figure 2). This information offers a useful reference point for interpreting the more mode-specific preference structures that follow. It is not possible to weight these policy items of the general ranking block within the used LCA approach. Future research should consider a methodological approach that allows certain manifest variables to be weighted for more insightful class identification. Another open question concerns the role of push measures in shaping policy preferences. The intention was to include a mix of push and pull instruments, most blocks did not offer a fully balanced policy mix and only included pull measures. Including a greater variety of policies in future surveys could allow for a more systematic assessment of when and for whom push interventions are acceptable, and under what conditions. One additional limitation of this study is the missing possibility for replicability and future comparative work because the LCA is based on six ranking questions and 36 policy items. Including these questions in a survey significantly increases the response burden for the participants. In a future study, it could be insightful to think about a process of testing for similar policy preference classes by analyzing a smaller number of ranking questions and policy items.
Conclusion
The findings contribute to the growing literature on heterogeneity in transport preferences and to current debates on the political conflict lines emerging around low-carbon transitions. Against the backdrop of increasing societal polarization, how material conditions and ideological orientations shape support for transport policies were analyzed. An SR survey was designed, and data were collected in Germany to identify political cleavages underlying support for transport policies in this analysis. This study addresses broader questions of political economy by investigating how social stratification, access to resources, and travel behavior influence cleavages that shape policy preferences. A high-dimensional preference space was successfully reduced into four classes: (1) PT Advocates; (2) Long-Distance Optimizers; (3) Car-Oriented Pragmatists; and (4) Multimodal Interventionists. This typology enables applications in travel behavioral modeling, for example, tracking changes in these classes over time, potentially using longitudinal surveys or synthetic populations, enabling their integration into agent-based land use transport interaction models that account for evolving political preferences. Another central finding is the presence of two lines of conflict. First, the travel behavior divide between urban, PT-, and bike-oriented groups and car-dependent, rural respondents was reflected in policy priorities of the classes. However, this behavioral cleavage only gained political salience among high-resource groups where transport choices are less constrained by income or infrastructure availability. This has important implications for politics and policy design. From a political perspective, the findings underline the importance of recognizing behavioral divides and the ideological and material undercurrents that shape public support for transport transitions. If low-carbon mobility policy is to succeed politically, it must take these societal tensions seriously. Finally, the results raise the question of whether a third, less-discussed cleavage exists: one that separates investment- and infrastructure-heavy measures from regulatory or fiscal instruments. This became particularly visible in the Multimodal Interventionists, who consistently prioritized noninfrastructural policies across blocks, even where others favored infrastructural upgrades. This suggests that the type of policy, beyond its directional objective, may influence preference, pointing to a possible distinction between physical transformation and regulatory interventions as dimensions of conflict. Future work should examine whether this distinction is viable and how it interacts with material interests and values attached to transport infrastructure. Furthermore, it would be interesting to analyze transport policy preferences across European countries to reveal cultural differences and see where the EU can gather support for post-fossil policies.
Supplemental Material
sj-docx-1-trr-10.1177_03611981261451195 – Supplemental material for Who Wants What? Identification of Transport Policy Preference Classes by Latent Class Regression
Supplemental material, sj-docx-1-trr-10.1177_03611981261451195 for Who Wants What? Identification of Transport Policy Preference Classes by Latent Class Regression by Friederike Beck, Isabella Waldorf, Klaus Bogenberger and Allister Loder in Transportation Research Record
Footnotes
Acknowledgements
The authors would like to thank Basil Schmid for his support in the survey design and Patricia Lyon Mokhtarian for her suggestions on the attitudinal questions.
Authors’ Note
ChatGPT-4 assisted in debugging the R code, creating LaTeX tables, and making language edits.
Author Contributions
The authors confirm contribution to the paper as follows: study conception and design: Friederike Beck, Isabella Waldorf; data collection: Friederike Beck, Allister Loder; analysis and interpretation of results: Isabella Waldorf, Friederike Beck, Allister Loder; draft manuscript preparation: Friederike Beck, Isabella Waldorf, Klaus Bogenberger. All authors reviewed the results and approved the final version of the manuscript.
Declaration of Conflicting Interests
The authors declared no potential conflicts of interest with respect to the research, authorship, and/or publication of this article.
Funding
The authors disclosed receipt of the following financial support for the research, authorship, and/or publication of this article: This research was supported by the READAPT project (grant no. 525732760) from the German Research Foundation.
Supplemental Material
Supplemental material for this article is available online.
References
Supplementary Material
Please find the following supplemental material available below.
For Open Access articles published under a Creative Commons License, all supplemental material carries the same license as the article it is associated with.
For non-Open Access articles published, all supplemental material carries a non-exclusive license, and permission requests for re-use of supplemental material or any part of supplemental material shall be sent directly to the copyright owner as specified in the copyright notice associated with the article.