
Abstract
Over the last decade, there has been a growing trend toward integrating human factors (HF) into traffic flow models to better understand the complexities of human behavior and its effect on traffic dynamics. This study seeks to advance this trend by bridging the gap between traditional car-following models and the inherent variability in human driving behavior. By incorporating these elements, the models provide valuable insights into how driver behavior adaptation and risk-taking influence traffic flow dynamics. This study proposes a model, the Intelligent Driver Model with Task Saturation (IDMTS), that integrates behavioral adaptations and risk-taking strategies into the established Intelligent Driver Model, enriched by a cognitive layer based on Fuller’s Task Capability Interface model. This amalgamation enables interplay between driver behavior adaptation as the driving task saturates and drivers’ risk-taking strategy. First, steady state equilibria and fundamental diagrams of IDMTS are derived, and local and string stability are analyzed under rational driving constraints. Then, the IDMTS is calibrated and validated on three complementary data sets: controlled driving simulator experiments with normal and distracted driving, and naturalistic car-following trajectories from the Next Generation Simulation I-80 and Milan Trajectories data sets. The model is investigated for behavioral soundness and numerical soundness. The results demonstrate that the model effectively incorporates endogenous heterogeneity in driving behavior under varying task loads. The model generates two plausible HFs: (1) risk-taking; and (2) behavior adaptation. The findings of this study suggest a step toward a more realistic representation of driving behavior adaptation and risk-taking strategies.
Introduction
Over the last decade, there has been a growing movement in the traffic flow theory community to integrate human factors (HF) into mathematical models of driving behavior ( 1 , 2 ). This reflects an increasing recognition that cognition, perception, and decision-making substantially influence a driver’s ability to maintain situation awareness and execute safe maneuvers. Incorporating such factors enables more realistic car-following models that respect the psychological mechanisms underlying longitudinal control ( 2 , 3 ). The practical stakes are considerable: car-following models underpin microsimulation platforms used for infrastructure design, safety analysis, and the evaluation of emerging technologies such as adaptive cruise control and connected automated vehicles. If these models rest on unrealistic assumptions about driver cognition, the downstream assessments they inform will likewise be unreliable ( 2 ).
Car-following theory has a rich history spanning several paradigms, stimulus-based, safe-headway, desired-measures, optimal velocity, and psycho-physical models, each distinguished by its assumptions about driver behavior ( 4 ). These formulations have proven valuable for traffic engineering; however, a fundamental limitation persists: they are premised on the strict assumption of unlimited cognitive processing capacity ( 1 ). This assumption is unrealistic because it fails to account for the inherent limitations of drivers’ task-processing capacity. In longitudinal driving, drivers continually adapt their behavior to compensate for increases in task demand. For instance, by increasing headway or reducing speed when the driving task becomes more difficult, such as when engaging in a secondary task. Such behavioral adaptation is not merely a reaction; it is a fundamental principle embodied in Fuller’s Task Capability Interface (TCI) model ( 5 ), which posits that drivers regulate control variables to maintain perceived task difficulty within tolerable bounds. This theoretical insight has motivated a growing body of work seeking to layer cognitive and perceptual mechanisms onto established car-following formulations.
Efforts to incorporate HFs into car-following modeling have broadly followed two methodological directions. The first develops behaviorally grounded car-following formulations from behavioral decision theories, such as prospect theory, where driver acceleration decisions are derived from risk perception and gain–loss evaluation ( 6 ). In these models, behavioral assumptions form the primary basis of the model structure rather than being embedded within an existing traffic flow formulation. A second line of research introduces human driver mechanisms within existing car-following models, most notably within the Intelligent Driver Model (IDM). These extensions incorporate features such as memory effects ( 7 ), variance-driven defensive behavior ( 8 ), reaction delays and multi-vehicle anticipation ( 9 ), psycho-physical action points ( 10 ), and time-varying desired time gaps ( 11 ). Although these models improve behavioral realism by representing specific perception and response processes, they typically address these mechanisms individually and do not explicitly represent driver task demand as a state variable governing behavioral adaptation. Therefore, existing models rarely provide a unified formulation in which evolving traffic conditions influence driver behavior through measurable task demand constructs. Moreover, empirical validation of behavioral mechanisms remains limited because relatively few models have been evaluated using controlled distraction experiments and naturalistic trajectory data.
To address these shortcomings, this study introduces the Intelligent Driver Model with Task Saturation (IDMTS), a behaviorally grounded car-following model that embeds HF mechanisms directly into the car-following dynamics. The model endogenizes behavioral adaptation using distinct driving regimes, free driving, car-following, and behavioral adaptation, derived from Fuller’s risk allostasis theory ( 12 ). The behavioral adaptation mechanism allows driver behavior to evolve dynamically in response to changing task demands. To achieve this, the well-established IDM is adapted ( 13 ), layering a cognitive dimension on top of the foundational physics of the original model. This additional layer is designed to ensure a fine balance between engineering and cognitive aspects of driving behavior. Together, these enhancements bridge the gap between classical car-following theory and cognitive behavioral modeling, yielding a mathematically tractable yet behaviorally realistic framework.
The specific contributions of this study are threefold. First, a task saturation measure expressed for observable traffic variables (speed, spacing, and desired time gap) is formulated that satisfies Fuller’s TCI theory, and embedded into the IDM to create endogenous regime transitions. Second, steady state equilibria and fundamental diagrams are developed for the IDMTS, analyzing both local and string stability under rational driving constraints, establishing the analytical tractability of the model. Third, the IDMTS is calibrated and validated on three data sets: controlled driving simulator experiments with normal and distracted driving, and naturalistic car-following trajectories from the Next Generation Simulation (NGSIM) I-80 and Milan Trajectories (MiTra) data sets and the model is evaluated for numerical and behavioral soundness at microscopic and macroscopic levels.
The remainder of this paper is organized as follows. First, the relevant literature on car-following models is reviewed. Next, the TCI model is introduced and interpreted using key traffic flow variables, followed by the formulation of the proposed car-following model, with particular emphasis on drivers’ behavior adaptation and risk-taking strategies. The stability analysis of the model is then presented. Subsequently, the calibration and validation procedures are described. The results and discussion are then presented. Finally, the paper concludes with a summary of the main findings and directions for future research.
Literature Review
Since the seminal work of Pipes ( 14 ), five broad paradigms of car-following models have emerged ( 4 ): (1) stimulus-based models in which acceleration responds to position and speed variations of the leader ( 15 ); (2) safe-headway models, exemplified by Gipps ( 16 ), which ensure the follower can stop safely; (3) desired-measures models, such as the IDM ( 13 ), that minimize deviations from a preferred driving criterion; (4) optimal velocity models ( 17 ) in which a speed-dependent optimal velocity governs acceleration; and (5) psycho-physical models originating from Wiedemann ( 18 ) that partition the stimulus space into distinct perceptual regimes. Each paradigm captures important facets of longitudinal driving; all share a common limitation: the assumption of unlimited cognitive processing capacity ( 1 ). Drivers, in contrast, continuously regulate their behavior, increasing headway or reducing speed, to maintain the perceived task difficulty within tolerable bounds, a principle formalized in Fuller’s TCI model ( 5 ). This omission motivates the development of HF-informed extensions that explicitly acknowledge cognitive constraints.
Several studies introduced HFs into car-following formulations ( 3 ). Yang and Peng ( 19 ) proposed an error-able model that acknowledges perceptual inaccuracies whose magnitude grows with following distance. Hamdar et al. ( 6 ) incorporated risk-taking attitudes using prospect theory, linking subjective risk evaluation to acceleration decisions in congested settings. These approaches explicitly account for drivers’ risk perception and gain–loss evaluation; they primarily focus on behavioral responses to perceived collision risk. Kochi et al. ( 20 ) demonstrated that perceived task difficulty correlates with driving speed and that inexperienced drivers underestimate it. For model-level integration, Saifuzzaman et al. ( 21 ) introduced task difficulty as a scaling factor on desired spacing or acceleration within the IDM. This improves sensitivity to workload; however, it does not create an emergent behavioral response: there is no feedback loop from task difficulty to the driver’s evolving state, and the multiplicative scaling can generate unrealistic trajectories when task difficulty deviates substantially from unity. Van Lint and Calvert ( 22 ) proposed a more comprehensive multilevel framework based on TCI that endogenously incorporates heterogeneities in driver traits and cognitive capacity using fundamental diagrams of task demand. However, the framework’s input requirements, real time measures of task load, and driver awareness, remain abstract and difficult to observe, limiting its practical applicability to data-driven calibration.
A parallel line of research has focused on enriching the IDM with specific human driver mechanisms. Treiber and Helbing ( 7 ) introduced a memory effect by coupling an internal dynamical variable, the subjective level of service to the IDM’s time gap parameter, modeling a resignation effect in which drivers gradually become more tolerant of congested conditions. Treiber et al. ( 8 ) demonstrated that adapting time headways as a function of local velocity variance, a proxy for the driver’s cognitive load induced by strong inter-vehicle speed variations, reproduces the capacity drop and wide scattering in flow–density data, which can be interpreted as a direct implementation of the TCI and task difficulty homeostasis. In a complementary study, Treiber et al. ( 9 ) incorporated finite reaction times, estimation errors grounded in visual perception theory, and anticipation in time and over several vehicles into the IDM, showing that the destabilizing effects of delays can be compensated by experienced driver anticipation. Treiber and Kesting ( 10 ) introduced action points reflecting the psycho-physical observation that humans respond only when the stimulus has changed sufficiently, providing new insights into the relative importance of instabilities, noise, and perception thresholds in generating traffic oscillations. In a complementary empirical direction, Tian et al. ( 23 ) analyzed 25-car platoon experiments and proposed a mode-switching stochastic car-following model incorporating speed adaptation and spacing indifference, demonstrating that traffic instability arises from the competition between deterministic speed adaptation and cumulative stochastic perturbations rather than from classical deterministic instability alone. This work provides important evidence for mode-dependent driving behavior and regime-specific dynamics; the switching mechanism is governed by spacing thresholds defining an indifference region rather than by a cognitive construct linked to driver workload or task demand. Xiong et al. ( 11 ) proposed an alternative approach by allowing the desired time gap parameter to change over time in response to prevailing traffic conditions. More recently, Kashifi et al. ( 2 ) proposed a behavioral and numerical evaluation framework that benchmarks intra-driver heterogeneity car-following models across numerical soundness and behavioral soundness, demonstrating that improvements in numerical fit do not necessarily correspond to improvements in behavioral soundness.
The literature points to three unresolved issues. First, most classical car-following models do not explicitly represent cognitive limitations. Second, existing behavioral extensions tend to focus on perceived collision risk or to treat workload-related effects using parameter modification rather than by endogenous state-dependent adaptation. The conceptual distinction between risk perception under collision threat and workload regulation under task demand ( 5 , 12 ) has seldom been reflected in model design. Third, few models provide a parsimonious and calibratable formulation in which a dimensionless task saturation measure, constructed from observable traffic variables, functions as a state variable governing endogenous regime transitions between normal car-following and behavioral adaptation.
TCI Model and Car-Following Control Task
The TCI model explains driver decision-making by recognizing the inherent limitations of perception and vehicle control. It posits that drivers continuously regulate their behavior to ensure that task demands do not exceed their capabilities ( 5 ). The model is grounded in the principle of task difficulty homeostasis, where drivers adjust control variables such as speed and headway to maintain perceived difficulty within tolerable limits. When task demand increases, as in distraction, drivers may increase headway to reduce difficulty. In contrast, when the task feels too simple, such as driving on a straight road, they may increase speed to restore a desired level of challenge ( 21 ). Therefore, task saturation converges toward an acceptable range shaped by task capacity and motivational factors. The following variables are defined that are required for model development, following the definitions of Lint et al. ( 24 ), as given in Table 1.
Human Factor Constructs used by IDMTS
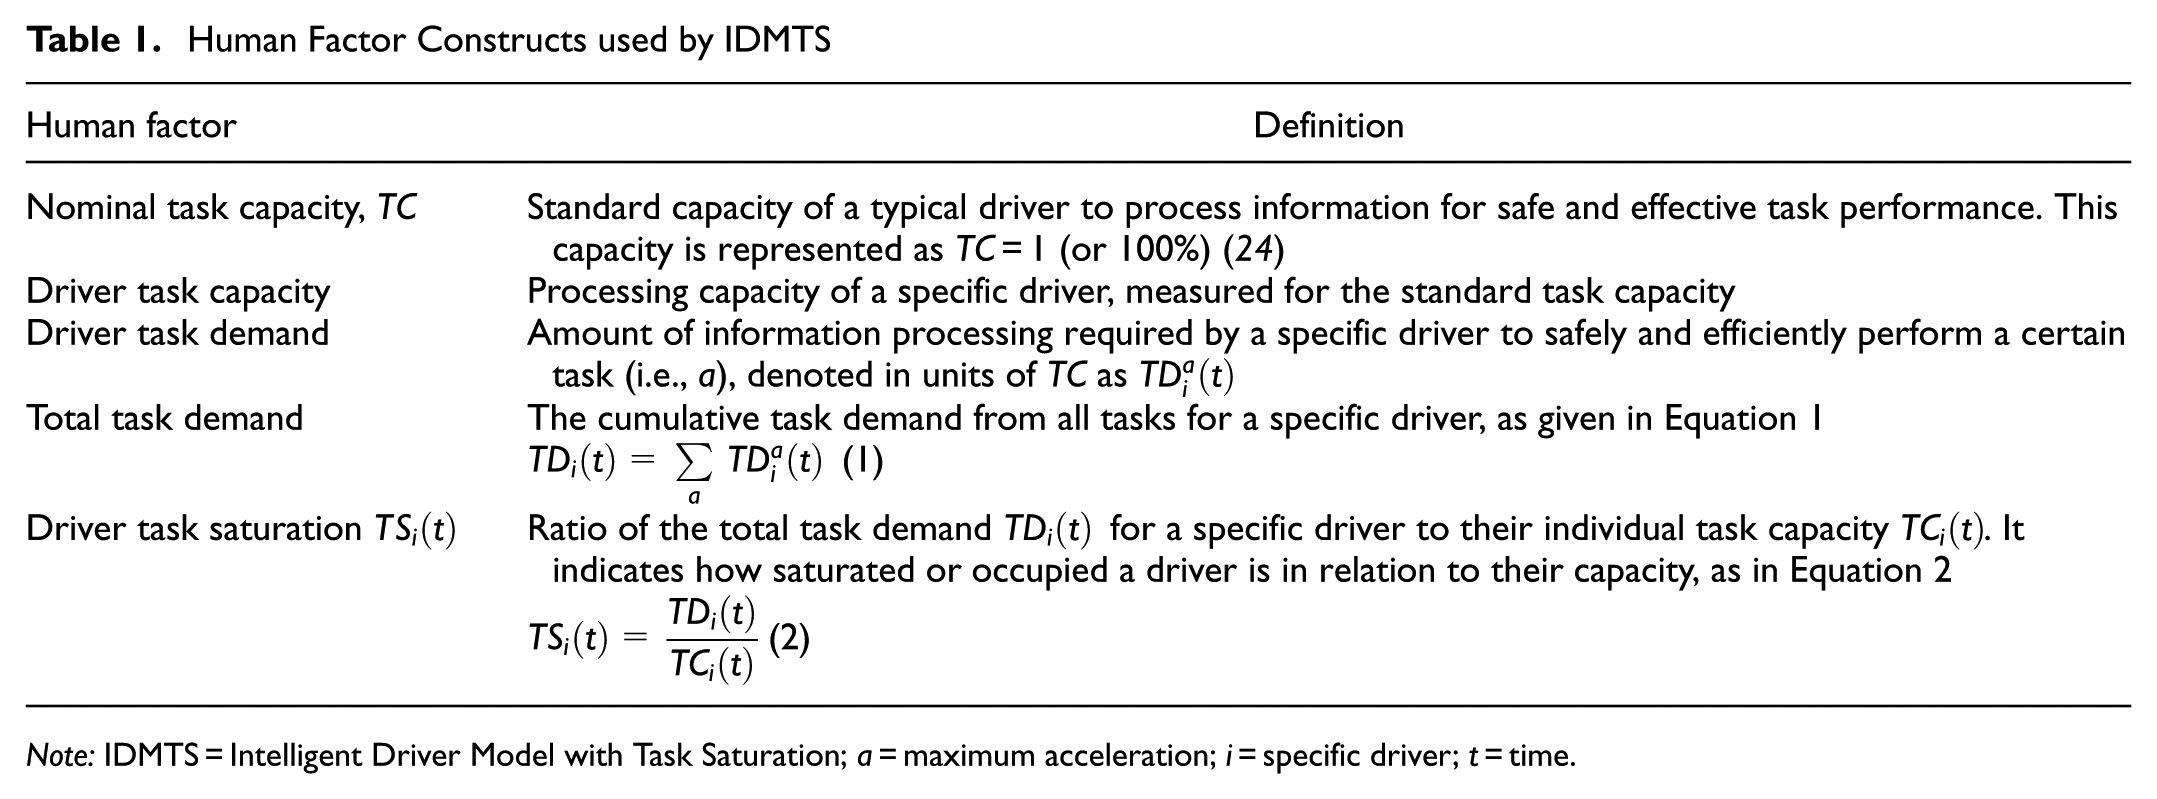
Note: IDMTS = Intelligent Driver Model with Task Saturation; a = maximum acceleration; i = specific driver; t = time.
According to Fuller ( 25 ), drivers continuously regulate their behavior to maintain an acceptable balance between task demand and capacity. Task demand at any moment depends primarily on the vehicle’s speed and the spacing to the leader. Therefore, task saturation can be expressed for traffic variables under three behavioral assumptions.
Task demand increases with speed. At higher speeds, the time available to perceive hazards, process information, and execute control actions diminishes, increasing cognitive and physical workload.
Task demand decreases with spacing. Smaller headways reduce the reaction time available in the event of a sudden maneuver by the leader, increasing perceived difficulty ( 21 ). In general, higher speeds or shorter spacings (or both) narrow the safety margin and elevate the instantaneous task demand.
Drivers with greater task capacity select shorter desired time gaps. The desired time headway reflects the temporal buffer a driver maintains to respond to unexpected events such as abrupt braking. Empirical evidence shows that drivers with higher cognitive capability or confidence often accept shorter headways, perceiving them as manageable (26–28). Nevertheless, this tendency is moderated by individual risk attitude, traffic context, and distraction level, implying that the relationship between task capacity and preferred headway represents a behavioral tendency rather than a strict rule.
Let

These signs operationalize Fuller’s idea that higher speed compresses perception–decision–action time, smaller spacing reduces safety margin, and a driver’s chosen (larger) desired headway reflects a tendency to keep the task easier; therefore, increasing

where
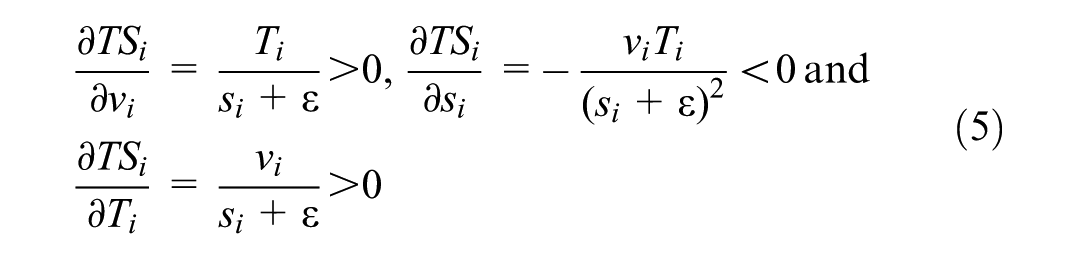
Therefore, Equation 4 satisfies the design rules by construction (Equation 3) while remaining interpretable.
Model Formulation and Behavioral Extensions
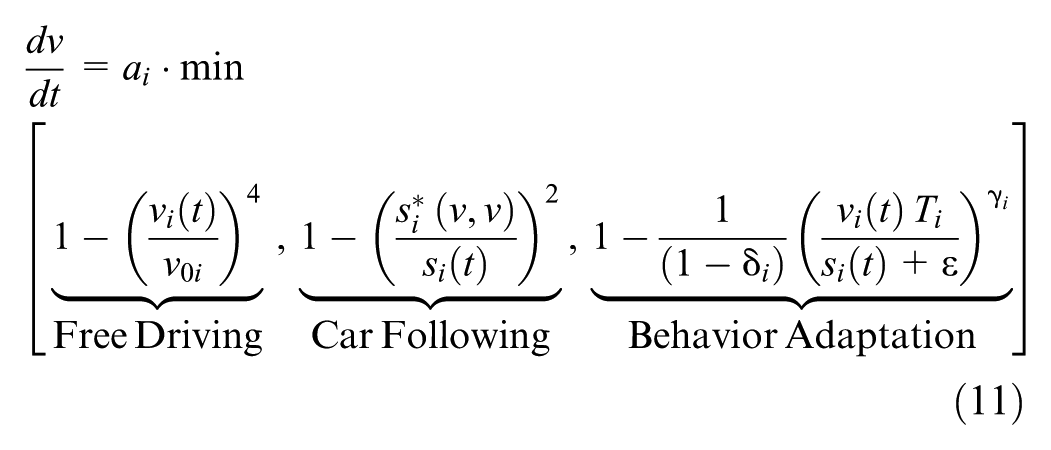
To incorporate HFs into a mechanistic framework, the Intelligent Driver Model Plus (IDM+) ( 29 ) is adopted as the foundation for the proposed model. IDM+ extends the original IDM ( 13 ) by separating free driving and car-following components and selecting the minimum of their respective accelerations, rather than superimposing them. This modification yields more realistic capacity estimates and a smoother transition between traffic regimes.
The instantaneous acceleration of vehicle
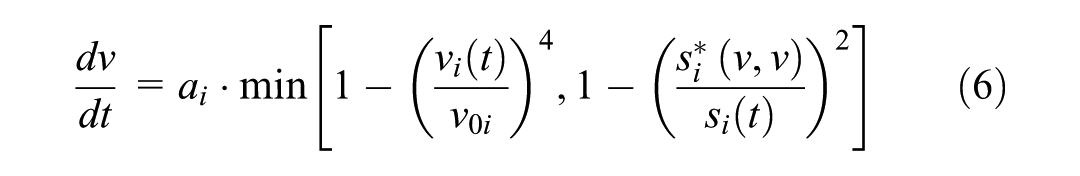
where the desired dynamic spacing is,
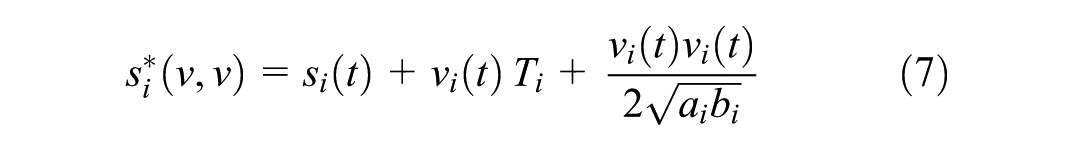
where
Behavioral Adaptation: Task Difficulty Homeostasis
The fundamental idea underpinning behavior adaptation is the task difficulty homeostasis theory. This theory posits that drivers consistently make instantaneous decisions to ensure that the perceived level of task saturation of the driving task remains within acceptable limits. They achieve this by modulating control elements such as speed and headway ( 5 ), which is called driver behavior adaptation.
The behavior adaptation effects emerge because of the dynamic interplay between the total task demands and the capacity of the driver. Therefore, when the driver perceives that the task saturation exceeds their tolerable limit, such as driving while being distracted by a cell phone call, they tend to reduce their speed to bring the task saturation back within their acceptable range. In contrast, when the driving task appears overly uncomplicated, as when driving along a straight highway in free-flow conditions, the driver may accelerate to increase the challenge. The scope of task difficulty the driver aims for is determined by their perception of their own abilities and their desire to engage at a specific level of task saturation.
The driving parameters influencing the task demand are the driving speed and spacing to the leading vehicle ( 25 , 30 ). These two parameters influence the available time for decision-making and response to stimuli that, ultimately, influence the task demand. The higher speed and short spacing mean a short time available for decision-making and response, which leads to a higher task demand ( 21 ). If the driver’s task capacity exceeds the task demand, the driving task is straightforward. However, if task demand exceeds the driver’s task capacity, loss of control may occur ( 5 ).
The original IDM might not offer a comprehensive understanding of behavior adaptation effects in longitudinal driving behavior. This limitation stems from the IDM’s lack of incorporation of crucial HFs ( 26 ). This suggests that for a more accurate representation of driving behavior adaptations, especially in scenarios of driver distraction, models should integrate and reflect human behaviors and characteristics more explicitly.
Risk Sensitivity and Behavioral Heterogeneity
Drivers’ behavioral adaptation occurs when they sense a need to adapt their behavior, especially when faced with an oversaturated driving task. Of interest, not all drivers respond in the same manner to these heightened driving tasks. Some proactively adapt their behavior; others remain unresponsive to the escalating risks, continuing their journey without any behavioral adaptations. This variation underscores the importance of acknowledging the diverse range of responses and factoring in the heterogeneity of driving behaviors.
This analysis suggests two predominant car-following strategies. The first group, risk-taking drivers, tend not to adapt their behavior even when task demands exceed their capacity. Their safety margins are narrow, often operating closer to the boundaries of risk. In contrast, risk-averse drivers adapt their behavior when task demands exceed their capacity. They prioritize safety by creating larger buffers or headways, ensuring sufficient reaction time even under challenging conditions. The behavior adaptation regime (BAR) in this model is designed to capture these divergent strategies, providing a more nuanced representation of driver heterogeneity in risk-taking behavior.
Mathematical Formulation
Building on the behavioral concepts introduced earlier, the proposed IDMTS is formalized by specifying the acceleration function as a regime-dependent control law. In this model, behavioral adaptation and risk-taking are endogenized. This allows behavior to evolve dynamically rather than being imposed externally. Task saturation triggers a BAR when the driving task becomes challenging. The central idea is that drivers do not respond uniformly across all contexts but operate within three qualitatively distinct regimes. Therefore, acceleration is expressed as a function of spacing
Free Driving Regime
When the leader is distant and its influence is negligible, the driver accelerates toward the desired speed
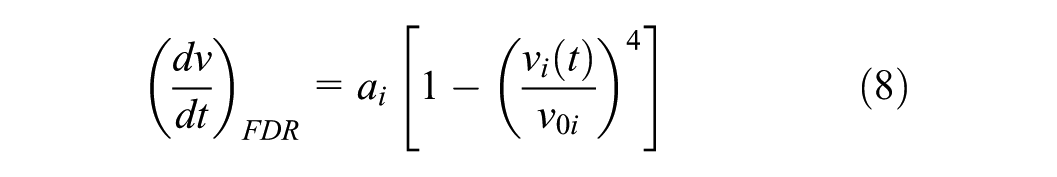
This term reflects the natural tapering of acceleration as the desired speed is approached.
Car-Following Regime
When interaction with the leader is dominant, acceleration depends on the ratio between desired and actual spacing.
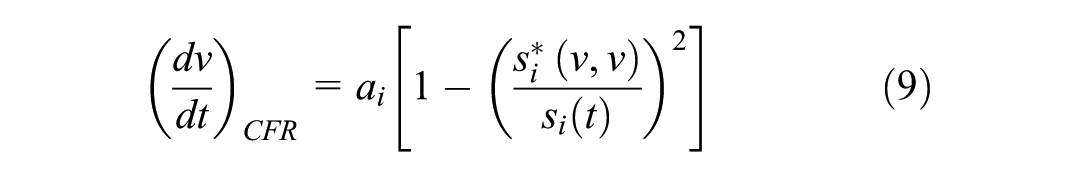
with
Behavior Adaptation Regime
This regime encapsulates two interrelated mechanisms: (1) driver adaptation in response to variations in task saturation; and (2) risk sensitivity that governs how strongly this adaptation is expressed. Following the modeling principles of Treiber et al. (
31
), introducing minimal new parameters, preserving the interpretation of existing ones, and maintaining parsimony, the BAR extends the IDM + model with two additional behavioral parameters: (1) the adaptation smoothness exponent
Formulating Driver Behavior Adaptation in Response to Task Saturation
Drivers consistently make instantaneous decisions to ensure that the perceived level of driving task saturation remains within their acceptable limit. Drivers maintain their desired level of task saturation based on “task difficulty homeostasis” of Fuller (
5
). In essence, drivers are inclined to decelerate (reduce speed or increase the gap between vehicles) when they feel overwhelmed by task saturation. In contrast, they accelerate when they sense that task saturation is below their capability. Therefore, the rate of acceleration in the BAR is inversely proportional to the task saturation. The task saturation, articulated for speed, spacing, and desired time gap, referenced in Equation 4, is integral to the BAR in this model. A noteworthy aspect is the drivers’ inclination toward a certain deceleration curve when they perceive high task saturation. The smoothness factor
Formulating Risk-Taking Strategy and Behavior Adaptation
The degree to which drivers adapt their behavior depends on their individual risk-taking strategies. Therefore, could every driver possess a unique risk-taking strategy when exposed to higher task saturation, symbolized by
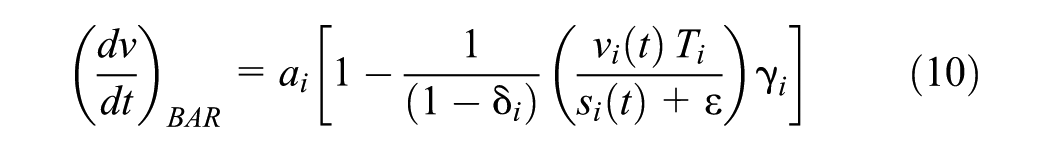
where
To ensure that acceleration remains within physical and behavioral limits
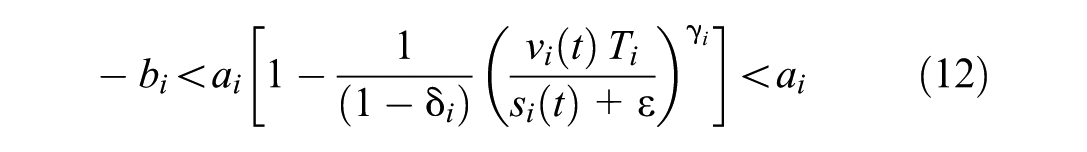
Solving for the admissible range of
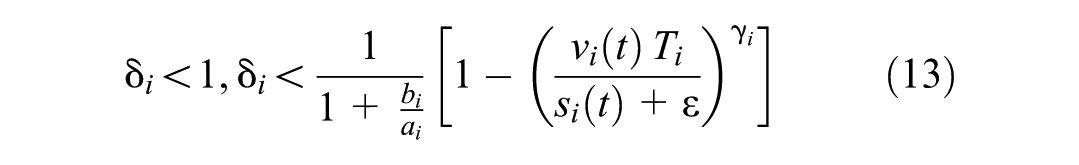
Values of
Illustration of Behavioral Adaptation and Risk-Taking Strategy With an Example of Distracted Driver
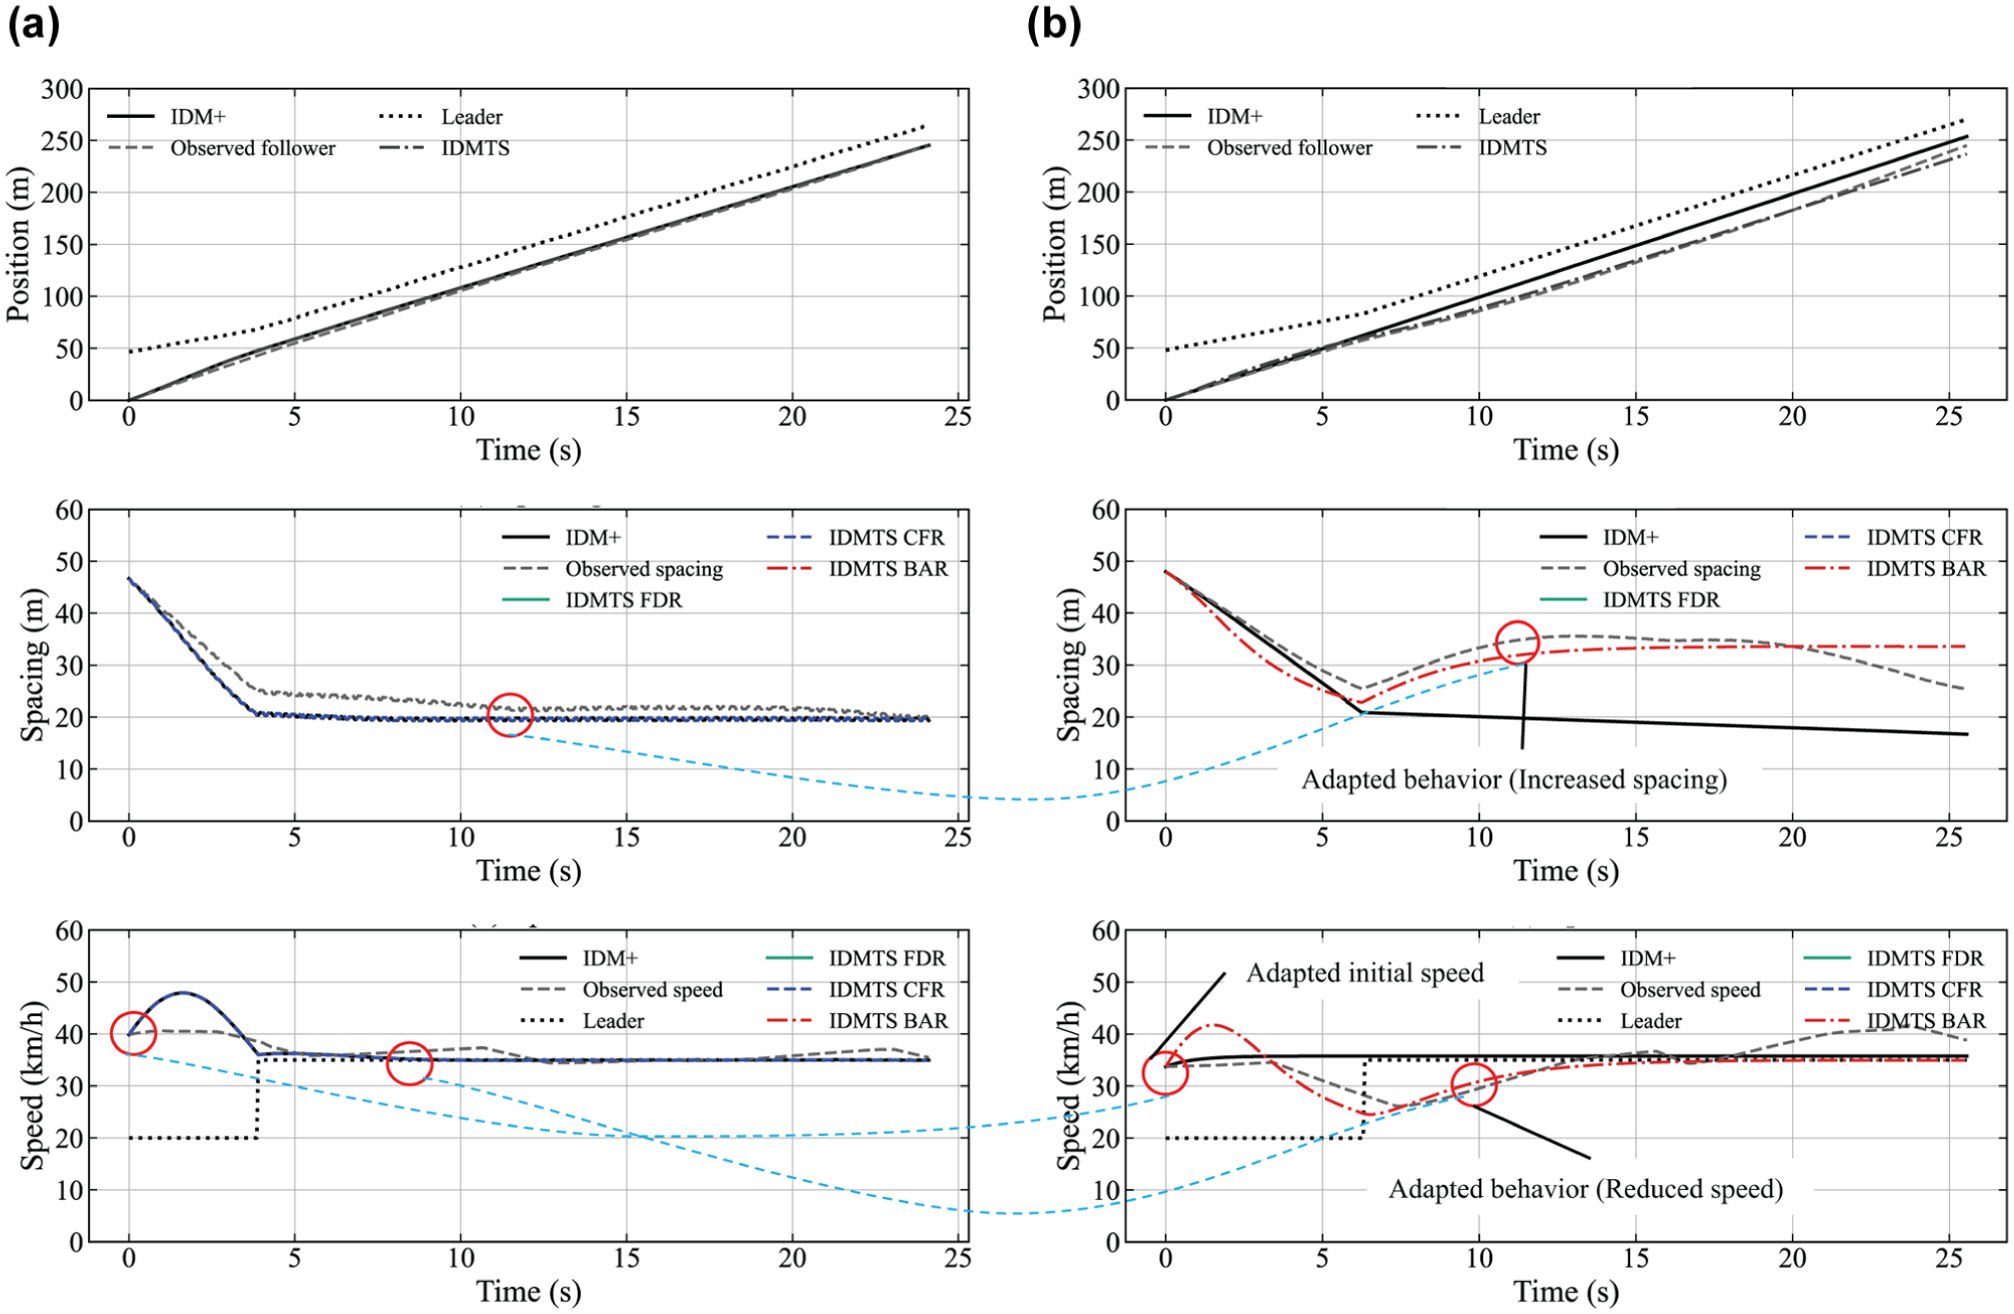
Figure 1 shows the driver behavior adaptation, emphasizing the difference between risk aversion and risk-taking strategies. In the first scenario presented in Figure 1a, the driver is risk-averse and characterized by high risk sensitivity (i.e., high risk sensitivity parameters δ). The driver’s journey can be broken down into specific phases.
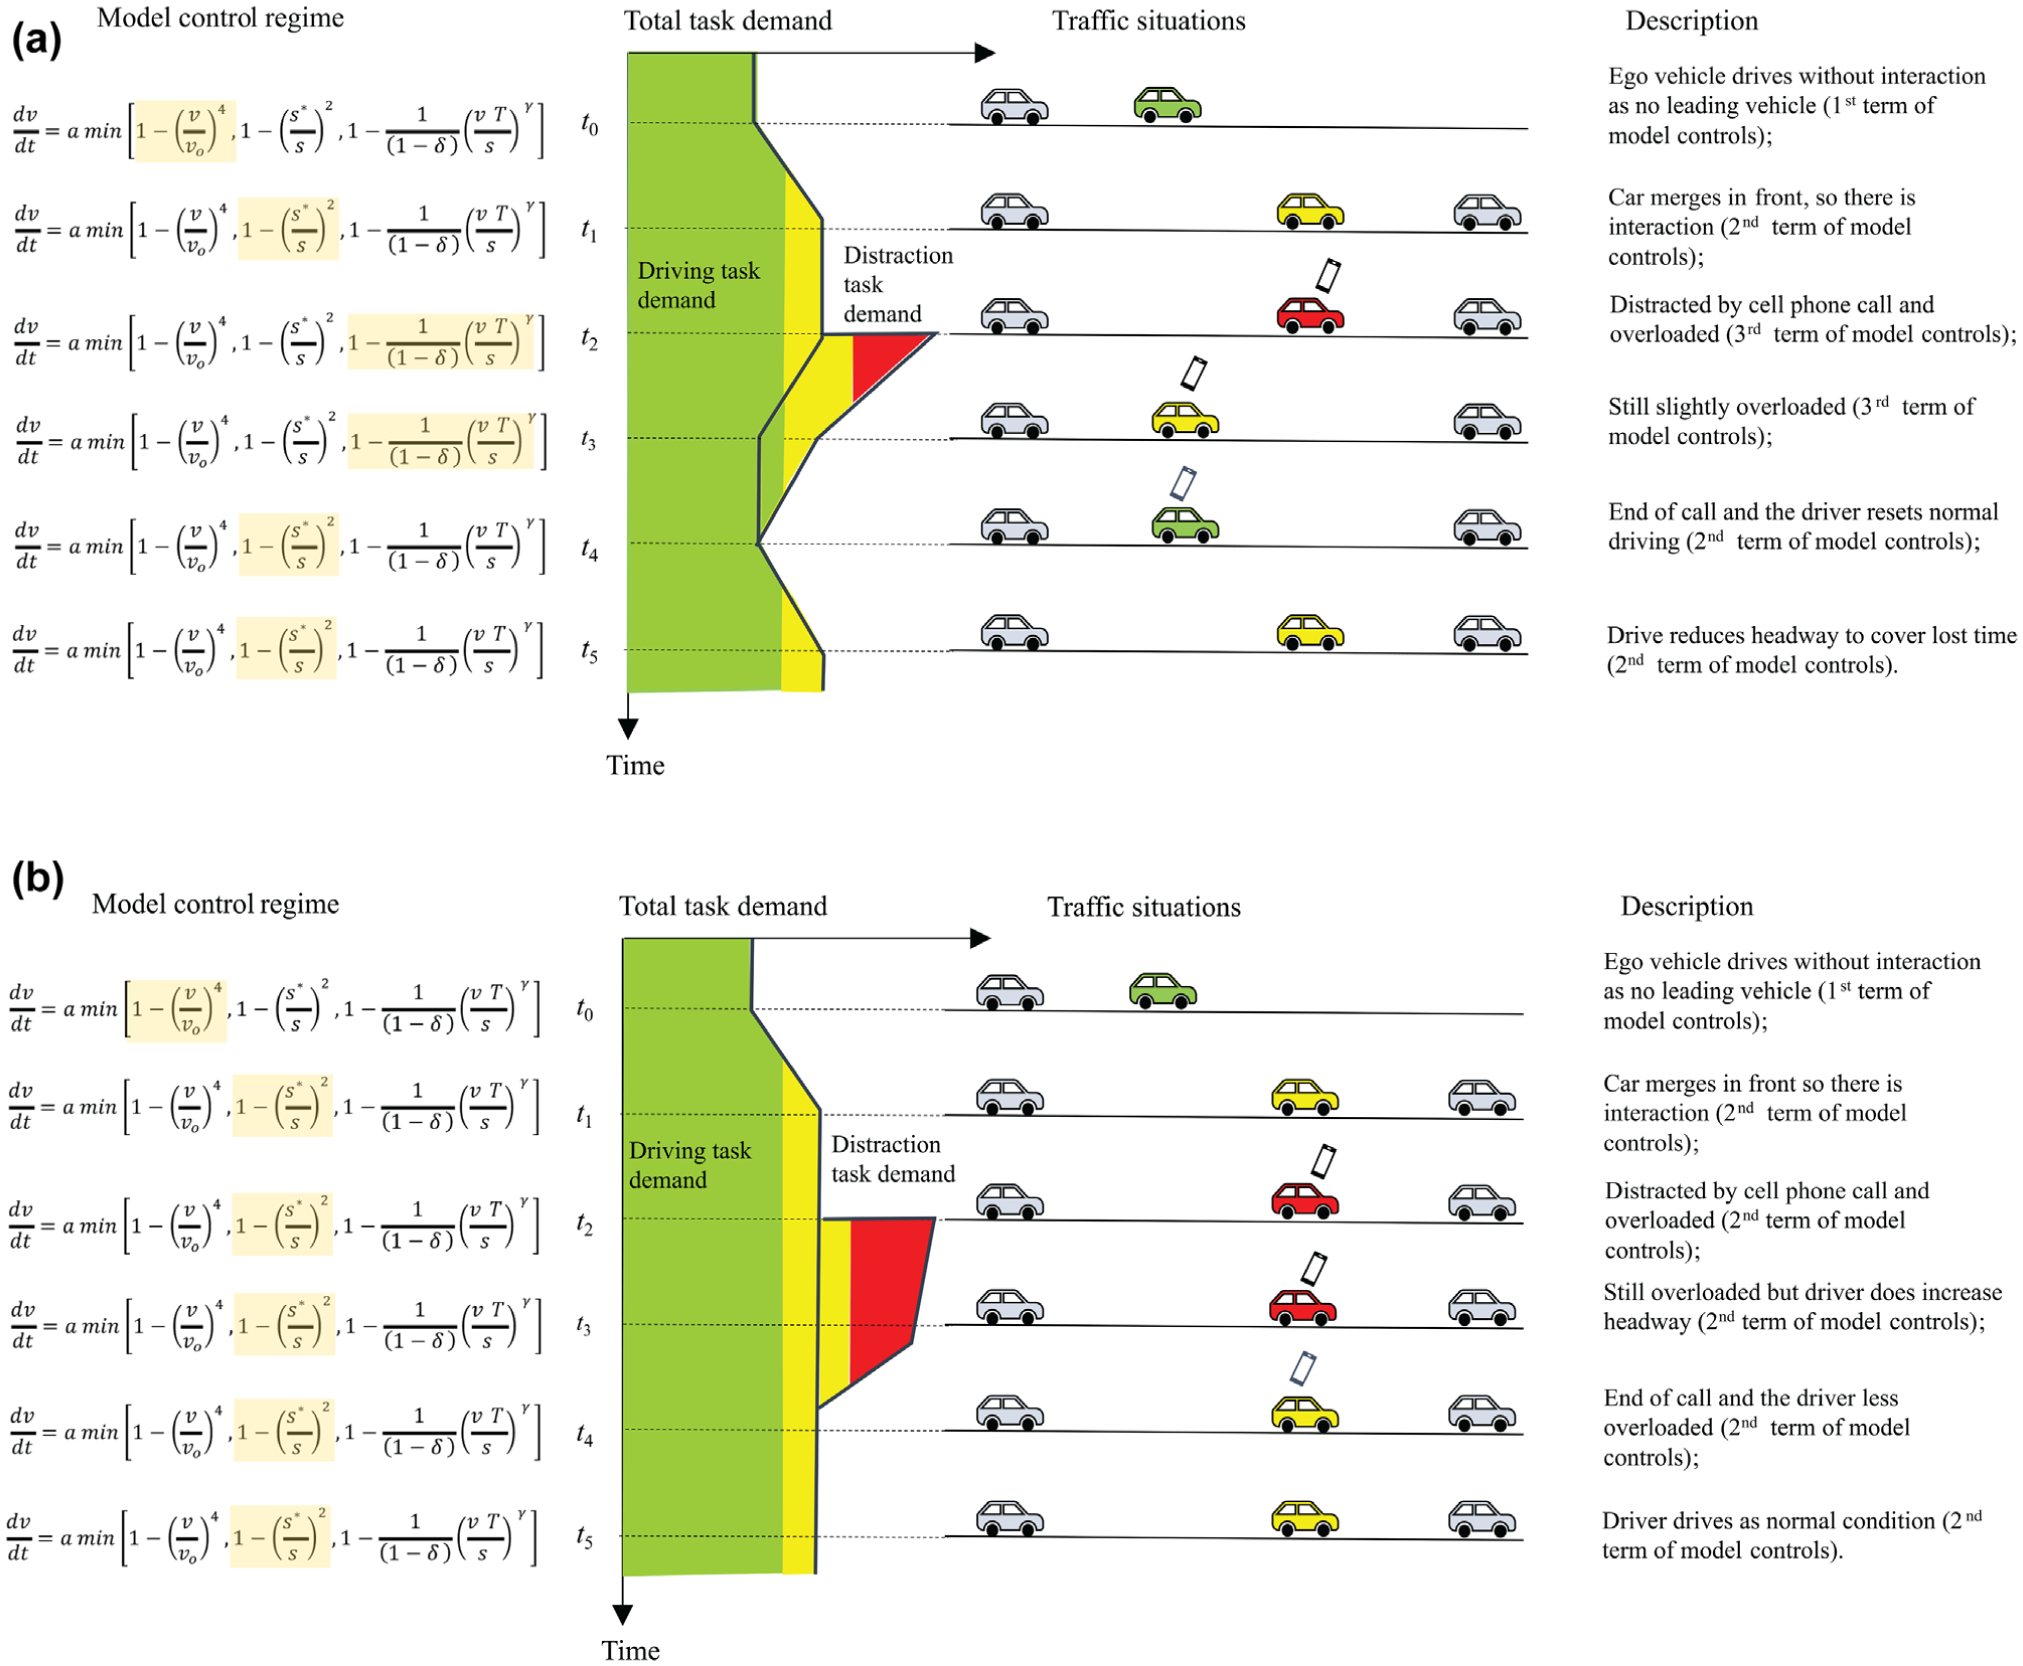
Driver behavioral adaptation and risk-taking strategy in the IDMTS model: (a) a risk-averse driver (high risk sensitivity
This figure links model control terms, task demand profiles, and traffic situations to highlight the integration of behavioral regimes (free driving regime [FDR], car-following regime [CFR], and BAR) within the proposed framework.
Moving without the interaction phase (time t0). The driver moves effortlessly at their desired speed, free from interaction with the leading vehicle, resulting in an uncomplicated drive that is well within their control. In this instant, the driving behavior is modeled by the FDR of IDMTS (i.e., the first term of the model).
Merging vehicle in front phase (time t1). A new element is introduced as another vehicle merges directly ahead of the ego driver, inducing a change in dynamics. The short headway with this new vehicle increases task demand on the ego vehicle, though the driving task is still sufficiently within their skill set to manage, as the driving task is less than the driver’s capacity. In this phase, the interaction with the leading vehicle is controlled by the CFR of this model (i.e., the second term of the model).
Distraction phase (time t2). The driver receives a phone call. This external distraction acts as an additional layer of task demand to the already evolving driving scenario. The total task demand outweighs the driver’s capacity, intensifying the challenge of the driving task. In this phase, the transition from CFR to BAR occurs, and the third term of the IDMTS model controls the driving behavior.
Behavior adaptation phase (time t2–t4). Adopting a risk-averse strategy, the driver adapts their behavior in this situation by reducing speed, naturally increasing the headway, and decreasing total task demand. This risk aversion strategy is maintained consistently until the phone conversation ends (t4). Therefore, the BAR of this model controls the driving behavior in this period until the driver begins the recovery to normal driving behavior.
Back to normal phase (time t4). When the conversation ends, the driver wants to return to a normal situation. In this phase, the transition from BAR to CFR occurs. Therefore, the model shifts from BAR to CFR and the second term of the IDMTS controls the driving behavior.
Recovery phase (time t5). The driver wants to recover the lost time by increasing speed. The second term of this model controls the driving behavior.
In contrast, Figure 1b shows a risk-taking driver scenario. While the initial conditions mirror the previous scenario, a notable divergence occurs when the driver receives a call at time t2. Unlike the risk-averse driver, this driver does not adapt their behavior because of increased task demand, maintaining their speed and distance from the vehicle ahead. This lack of behavior adaptation makes driving tasks risky during the phone call conversation (from t2 to t4). This choice, coupled with the added distraction, elevates the difficulty and risk during the conversation, signifying a driving strategy marked by lower risk sensitivity (i.e., low risk sensitivity δ).
Steady State Equilibrium and the Fundamental Diagram of IDMTS
In microscopic models, it is essential to have uniform driver–vehicle combinations operating on a consistent road environment to describe a stable equilibrium state. This essentially means that all drivers and vehicles are characterized by the same model parameters. The acceleration or speed metrics relevant to the model are not distinguished by the type or identity of the vehicle. From a modeling perspective, this steady equilibrium can be defined by two primary conditions that are homogeneous traffic and no accelerations (
31
). When considering that
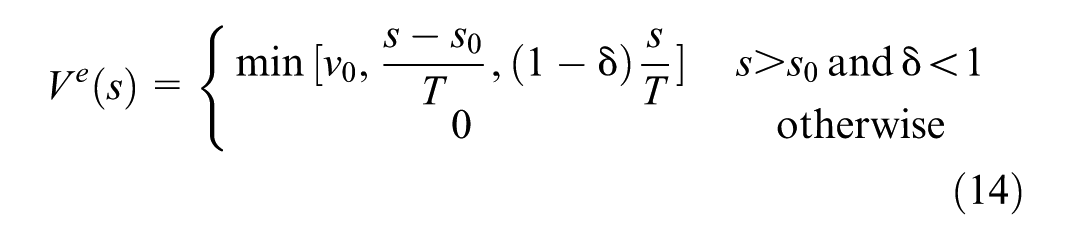
where
From Equation 14, in the FDR, a driver’s steady state equilibrium speed aligns with their desired speed
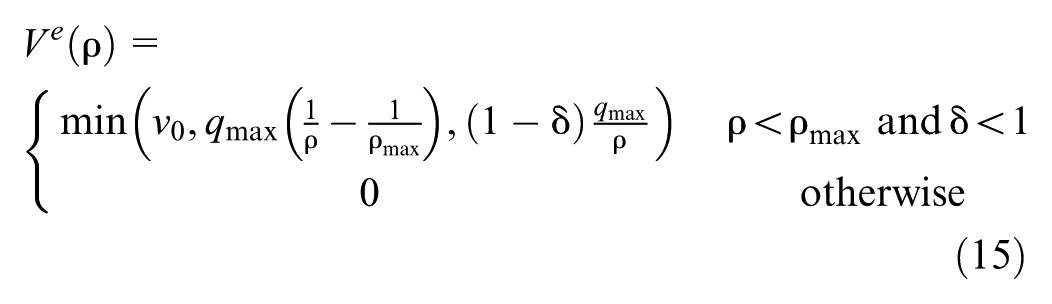
where ρ and
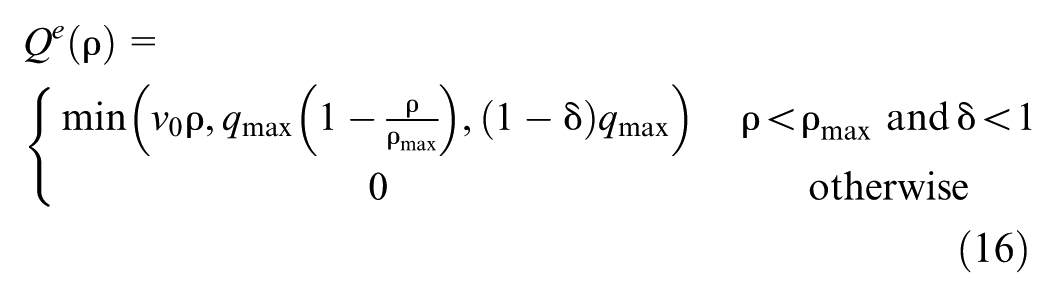
Figure 2 shows the equilibrium surfaces of the IDMTS model as a function of density and risk sensitivity. Figure 2a shows the flow–density–risk sensitivity surface, which retains the expected unimodal fundamental diagram shape. The influence of the risk sensitivity parameter
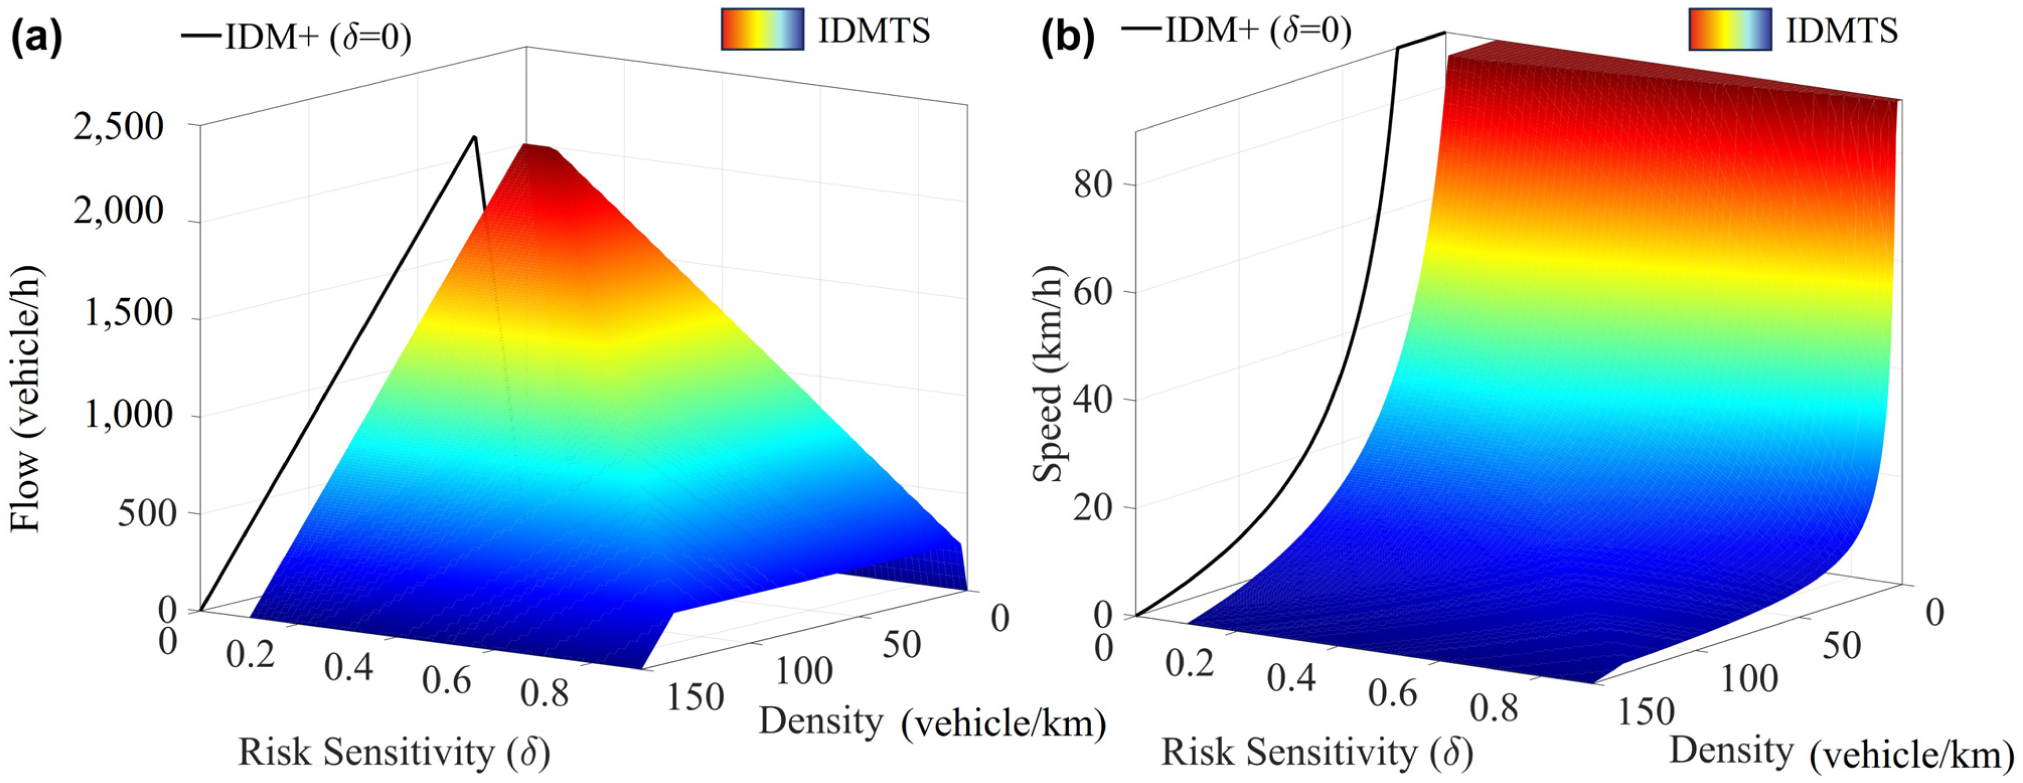
Equilibrium surfaces of the IDMTS model under varying densities and risk sensitivities and IDM +(
From a macroscopic behavioral perspective, the IDMTS demonstrates behavioral coherence via equilibrium restructuring. Higher risk sensitivity
To illustrate the transition between regimes and understand the task saturation that triggers regime transition, the IDMTS model was simulated for variations in speed and spacing. Figure 3 shows the phase diagram for a risk-averse driver (
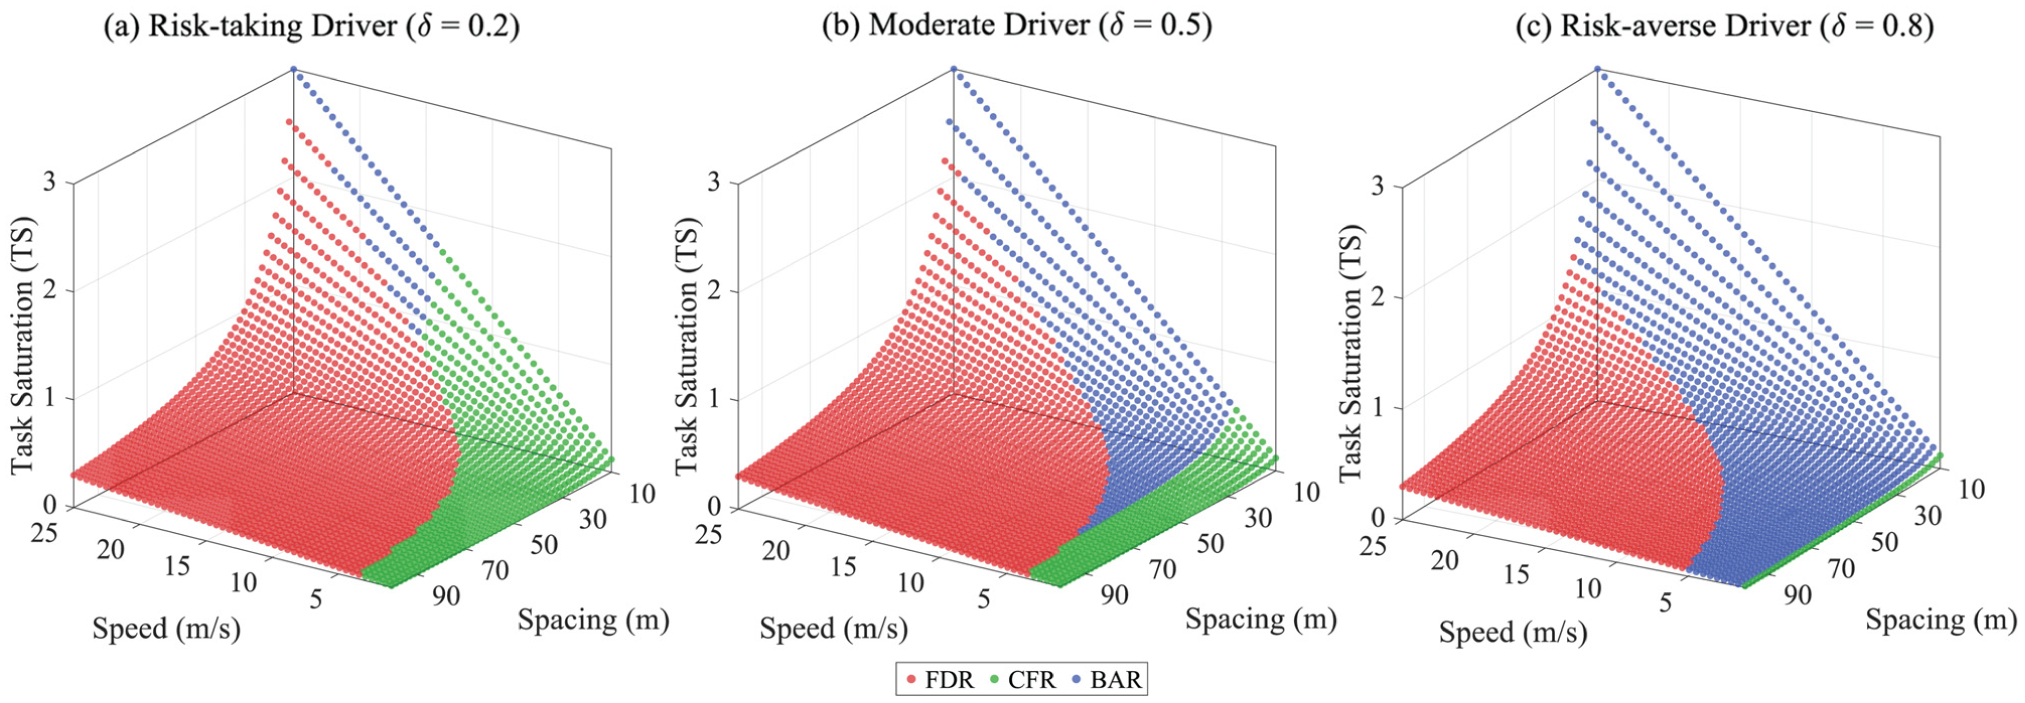
Regime phase diagrams of the IDMTS model under varying risk sensitivities. As δ increases, BAR dominates a larger
In contrast, the risk-taking driver (Figure 3c) shows BAR in a limited portion of the space. Instead, the CFR dominates at moderate spacings, and the FDR extends over a wider range of speeds and headways. This behavior highlights that risk-taking drivers sustain higher speeds and shorter spacings under elevated task demands without significant adaptation, resulting in consistently higher task saturation. The moderate driver is somehow between the risk-taking and risk-averse drivers (Figure 3b). The comparison underscores that higher risk sensitivity induces earlier behavioral adaptation and greater safety margins, and lower risk sensitivity sustains aggressive maneuvers with elevated task saturation. These differences align with Fuller’s TCI framework: risk-averse drivers adjust control variables (speed and headway) to reduce overload ( 25 ), and risk-taking drivers tolerate or even ignore overload, accepting narrower safety margins.
Stability Analysis and Rational Driving Constraints
Since the early development of car-following models, researchers have examined their stability by analyzing how small perturbations evolve over time (local stability) and across a platoon (string stability). This analysis primarily focuses on the progression of a minor disturbance from a leading vehicle temporally and spatially. Two types of stability are investigated: (1) local linear stability; and (2) string linear stability. Local stability concerns the behavior of a vehicle platoon over time when subjected to a small disturbance. A system is considered locally stable if a perturbation does not grow over time, allowing the system to return to equilibrium. String linear stability deals with the spatial stability of a vehicle platoon under a small disturbance originating from the lead vehicle. A system is deemed string stable if the disturbance decreases progressively across the vehicles; otherwise, it is string unstable ( 32 ). In this study, these two types of stability are discussed and the rational driving constraints that a car-following model should possess.
Local Stability and Rational Driving Constraints
Local instability is a particularly severe form of instability, and it is fundamental to design car-following models to avoid it. To analyze the local stability of our proposed car-following model, we consider the steady state equilibrium flow. The car-following model is structured as


where

where

In addition to the local stability requirement for a newly developed car-following model, the rational constraints of car-following models are fundamental to ensuring that the model’s dynamics are rational. Therefore, Wilson et al. ( 34 ) investigated the rational driving constraints of car-following models and concluded that the partial derivatives of sensible car-following models should satisfy the following conditions:

Therefore, in two scenarios with all other factors identical, greater spacing should lead to greater acceleration (or less braking). A higher (more positive) relative velocity should result in increased acceleration (less braking) as the leading vehicle is moving away. In addition, as a vehicle’s own velocity increases, the tendency to accelerate should decrease (or the tendency to brake should increase) (
34
). Theoretically, Equation 21 should be modified to allow

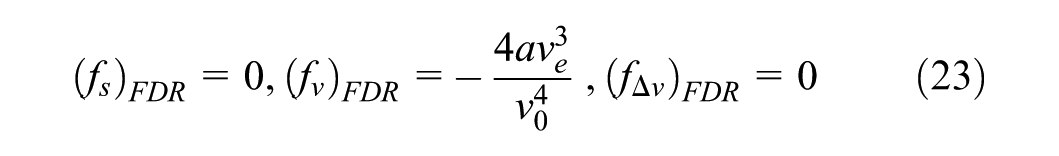
For reasonable car-following models that satisfy these rational driving constraints, which are shown in Equations 21 and 22, the local stability of such car-following models is automatically guaranteed ( 34 ). Therefore, the rational driving constraints expressed in Equations 21 and 22 are investigated to satisfy the local stability and rational constraints at the same time. The partial derivatives for each regime of the car-following model are taken separately. For FDR, Equation 21 leads to the Taylor expansion coefficients given in Equation 23.
Similarly, for CFR, the Taylor expansion coefficients are as follows:


Finally, the Taylor expansion coefficients for the BAR regime are represented by Equations 27–29.


The local stability of each regime will be evaluated. In the FDR, there is no interaction with leading vehicles. Therefore, the vehicle relative driving concerning spacing and relative speed must be zero according to Equation 22. Comparing the stability condition expressed in Equation 30, the stability condition is expressed as follows:
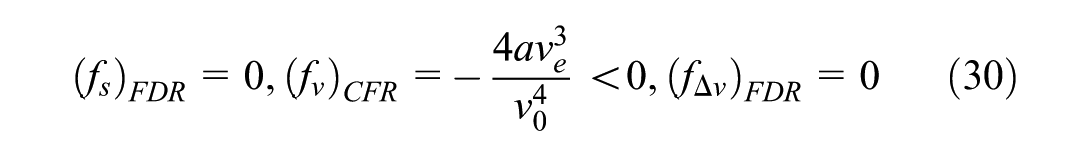
Equation 30 meets the stability condition in Equation 22. Therefore, the stability and rational constraints criteria are met for the FDR. The stability criteria for CFR can be met by the following:
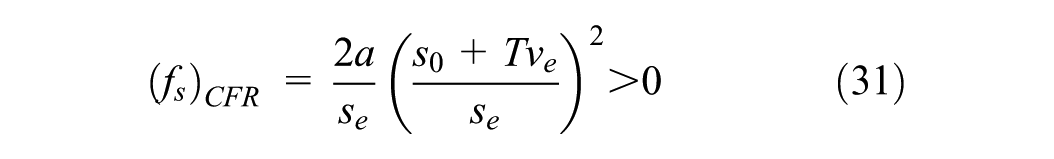


Because all parameters and variables are positive inequalities, verifying that the previous inequalities are true for all values of parameters and variables is easy. Therefore, the CFR meets the local stability and rational driving constraints accordingly. Finally, the BAR local stability and rational driving constraints are expressed as follows:

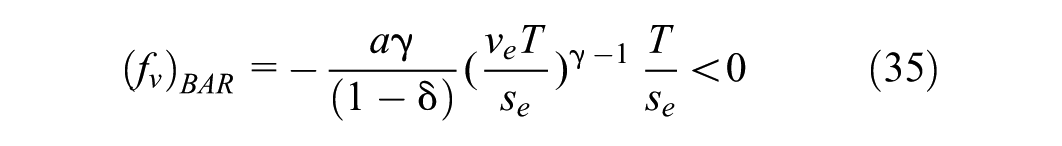

If
String Stability
Stability analysis is a fundamental requirement for evaluating the plausibility of car-following models because it ensures that small perturbations in speed or spacing do not escalate into unrealistic traffic oscillations. The general stability of car-following models (with no time delay) is indicated in the following equation:

Following the Sun et al. (2018) setup, the string stability of each regime in this model was evaluated. The length of the vehicle was
The string stability condition of FDR, following Equation 37, leads to

To assess the effect of each parameter, the stability regions for the CFR for various values of the desired headway and maximum acceleration were plotted (Figure 4). Figure 4 shows that increasing either the maximum acceleration or the desired time headway improves the string stability. Further, higher speed tends to stabilize the system, provided the other parameters remain constant.
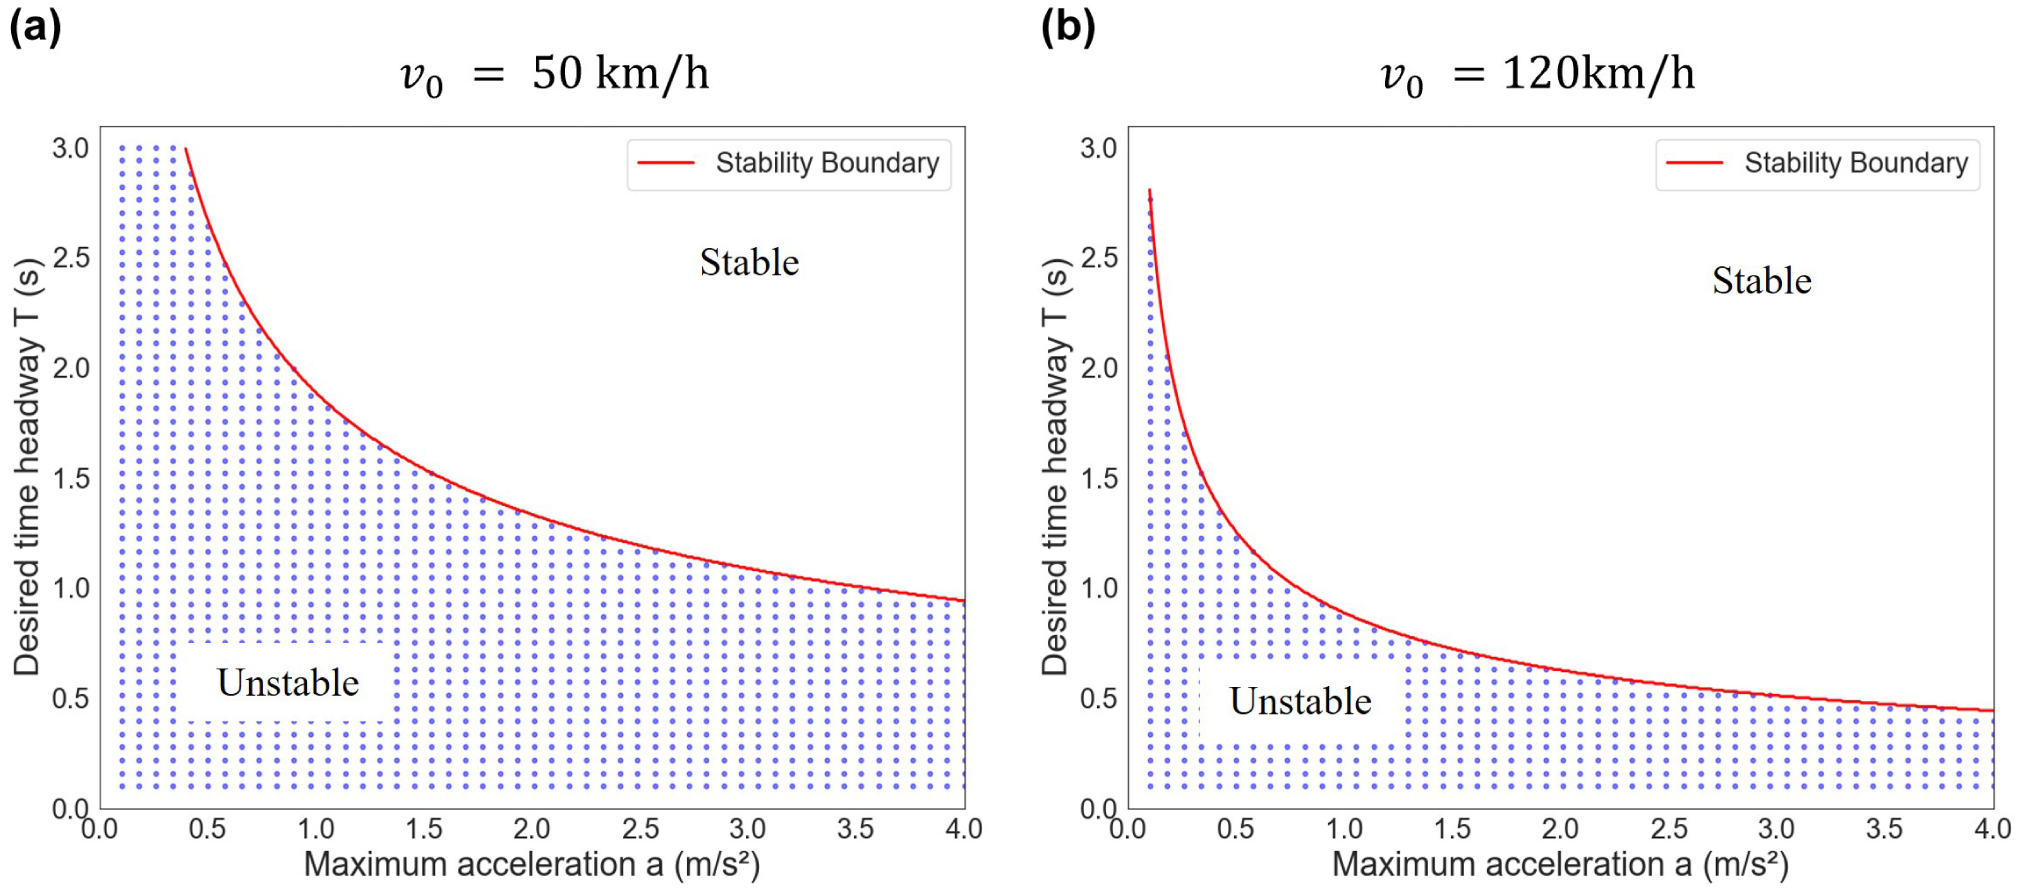
String stability region of the IDMTS model in the car-following regime (CFR) for two desired speeds: (a) 50 km/h; and (b) 120 km/h.
The solid red line separates stable from unstable regions. Each point represents a parameter combination that yields string instability in simulation, while the empty region corresponds to string-stable parameter sets.
Simplifying the string stability condition for the BAR leads to
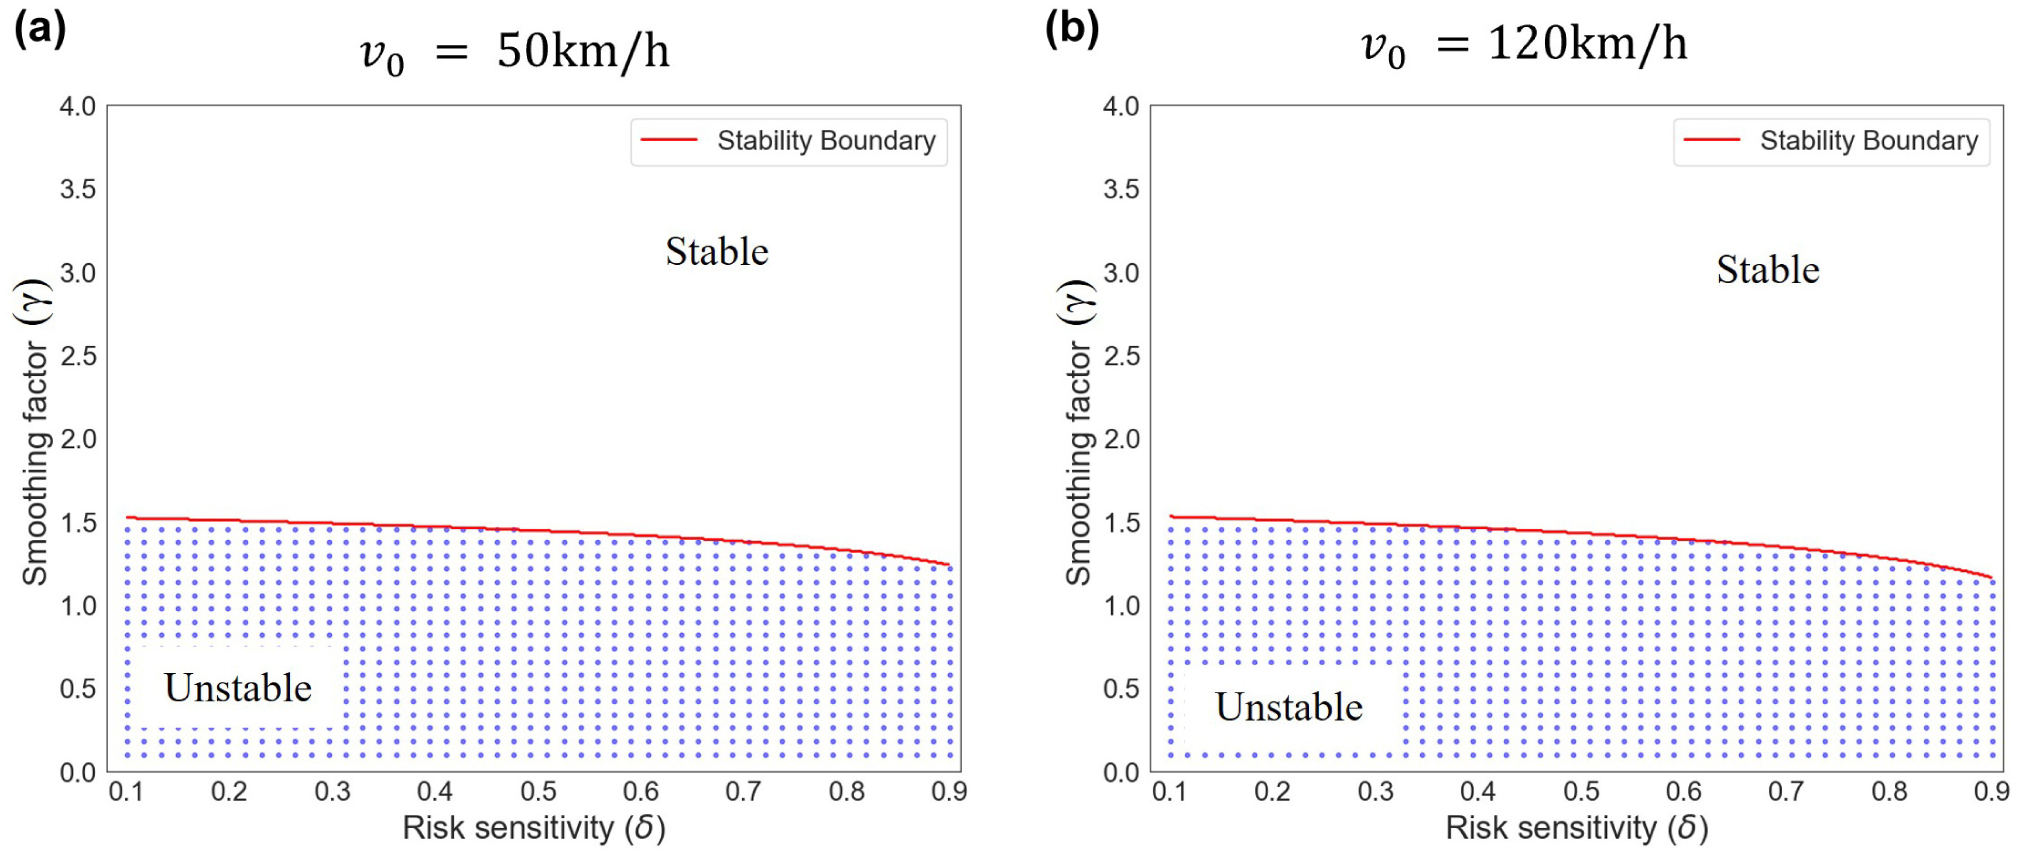
String stability region of the IDMTS model in the behavioral adaptation regime (BAR) for two speeds: (a) 50 km/h; and (b) 120 km/h.
The solid red line separates stable and unstable regions. Each point denotes a parameter combination that yields string instability in simulation, while the empty region corresponds to string-stable outcomes as a function of the smoothing factor and risk sensitivity.
Calibration and Validation
Models are simplified approximations of the real-world, which implies that they are subject to errors and limitations ( 36 ). The primary objective is to narrow down these discrepancies and ensure that the model’s outcomes align closely with observed values via calibration.
Data
Three complementary data sets were considered for model calibration and validation: (1) controlled driving simulator experiments; (2) naturalistic trajectory data from the NGSIM program ( 37 ); and the MiTra data set ( 38 ). The motivation for combining these data sets lies in their distinct advantages and limitations. Driving simulator data enables the simultaneous capture of trajectory information and HF inputs such as distraction, which are rarely observable in real-world trajectory data sets. They also allow systematic manipulation of behavioral conditions within a consistent driver population. However, simulator environments may not fully replicate naturalistic driving, particularly for car-following distances and risk-taking tendencies. In contrast, naturalistic data provides high-resolution, real-world trajectory data that reflects authentic traffic conditions and heterogeneous driver behaviors. However, it lacks direct HF measurements, such as distraction or risk sensitivity. By integrating both sources, the proposed IDMTS model is calibrated and validated against the behavioral richness of simulator data and against the empirical realism of freeway traffic, ensuring both behavioral soundness and practical applicability.
Driving Simulator Data
Calibration of the proposed model needs trajectory data and HF inputs. For this calibration, trajectory data derived from simulations in which participants were subject to distractions from mobile phone conversations during their drive were utilized. This experiment used the CARRS-Q Advanced Driving Simulator, as detailed in the study by Saifuzzaman et al. ( 21 ). The participant group consisted of 32 drivers. Each participant was subjected to two distinct driving scenarios within the simulator: (1) normal driving without any phone conversation; and (2) driving while engaged in a conversation through a handheld mobile phone.
The focus was on car-following, which took place on city roads with a designated speed limit of 40 km/h. A 245-m-long section of the road was chosen to monitor the car-following behaviors of every participant. This particular road stretch consisted of four lanes moving in a single direction. Vehicles were parked in outer lanes, restricting driving to the two middle lanes.
During this car-following event, the participant’s vehicle stopped at signals. No intervening vehicles were between the participant’s car and the leading ones. As the gap between the participant’s vehicle and the foremost vehicle diminished to 60 m, both leading cars increased their speed to 20 km/h. When the gap narrowed to 30 m or less, these vehicles surged to 35 km/h, maintaining that velocity until the car-following event was completed. The signal at the second intersection remained green to guarantee smooth flow. Essential data observation points, such as the position and velocity of the vehicles, were recorded every 0.05 s ( 21 ). From the driver population, 22 participants were randomly selected for model calibration, and the remaining participants were used for validation.
NGSIM I-80 Data Set
To complement the controlled experiment data, empirical trajectory data from the NGSIM data set were also utilized ( 39 ). The data set captures detailed vehicle movements along a 500-m segment of Interstate 80 (I-80) in Emeryville, California (Figure 6). Vehicle trajectories were recorded at 10 Hz, providing high-resolution measurements of vehicle positions, velocities, accelerations, and headways under varying traffic conditions. Because raw NGSIM trajectories are known to contain measurement noise and occasional inconsistencies, preprocessing was conducted before model calibration. Trajectory denoising and reconstruction were performed following the methodology proposed by Montanino and Punzo ( 40 ), which has been widely adopted in studies using NGSIM data to reduce high-frequency measurement noise and improve kinematic consistency.
In this study, Lane 2 was the focus, which exhibited relatively uninterrupted flow with fewer lane changes compared with the adjacent merge and weaving lanes. The full 45 min of data were considered, subject to stringent filtering criteria to ensure valid leader–follower pairs. Specifically: (1) only passenger cars were retained; (2) each car-following episode was required to last at least
60 s; (3) leader and follower were required to remain in the same lane throughout the observation window; and (4) a minimum initial speed differential of 5 m/s was imposed to exclude passive or nonreactive sequences ( 41 ). These filtering steps ensured that the retained trajectories represented active longitudinal interactions suitable for car-following analysis. After preprocessing and filtering, 396 valid car-following pairs were identified. These were randomly divided into 277 pairs (70%) for calibration and 119 pairs (30%) for validation. The resulting data set covers a broad range of traffic states, including free-flow and congested conditions, with corresponding variations in vehicle speeds and spacing.
MiTra Data Set
To complement the I-80 data set and mitigate its limitations for spatial coverage and observation duration, the MiTra data set was also utilized ( 38 ). While I-80 covers mostly congested traffic, MiTra has freeway traffic with varied traffic conditions. The data set was collected using six unmanned aerial vehicles (drones) flying in formation over a 900-m section of the A50 urban freeway in Milan, Italy (see Figure 7). Trajectory data were captured across nine flight campaigns totaling 135 min, spanning all traffic states from free-flow to heavily congested conditions, and include detailed vehicle positions, speeds, accelerations, and surrounding vehicle identifiers. Data were extracted at a sampling frequency of 30 frames per second. For this study, analysis was restricted to the mainline lanes (Lanes 1–7), which carry uninterrupted directional flow, while ramp and auxiliary lanes (0, 10, 11, 20, and 21) were excluded to avoid the confounding effects of merging and diverging maneuvers on car-following behavior. The same trajectory selection criteria used for the NGSIM data were applied. However, the MiTra data set has already been denoised. After preprocessing and filtering, 101 valid car-following pairs were identified. These were randomly divided into 70 pairs (70%) for calibration and 31 pairs (30%) for validation.
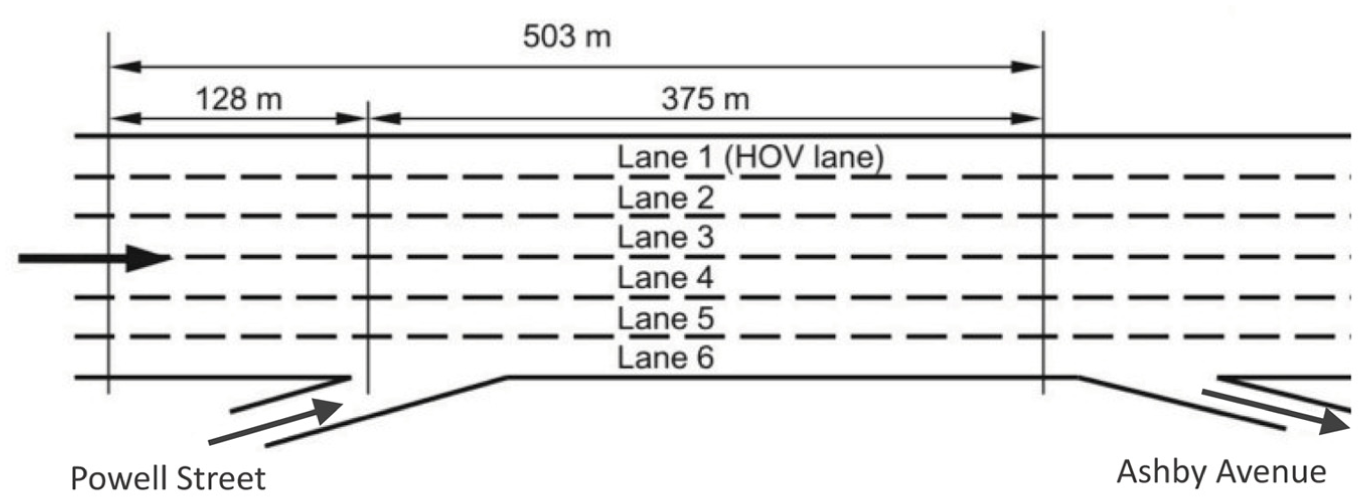
Layout of the NGSIM I-80 study site in Emeryville, California.
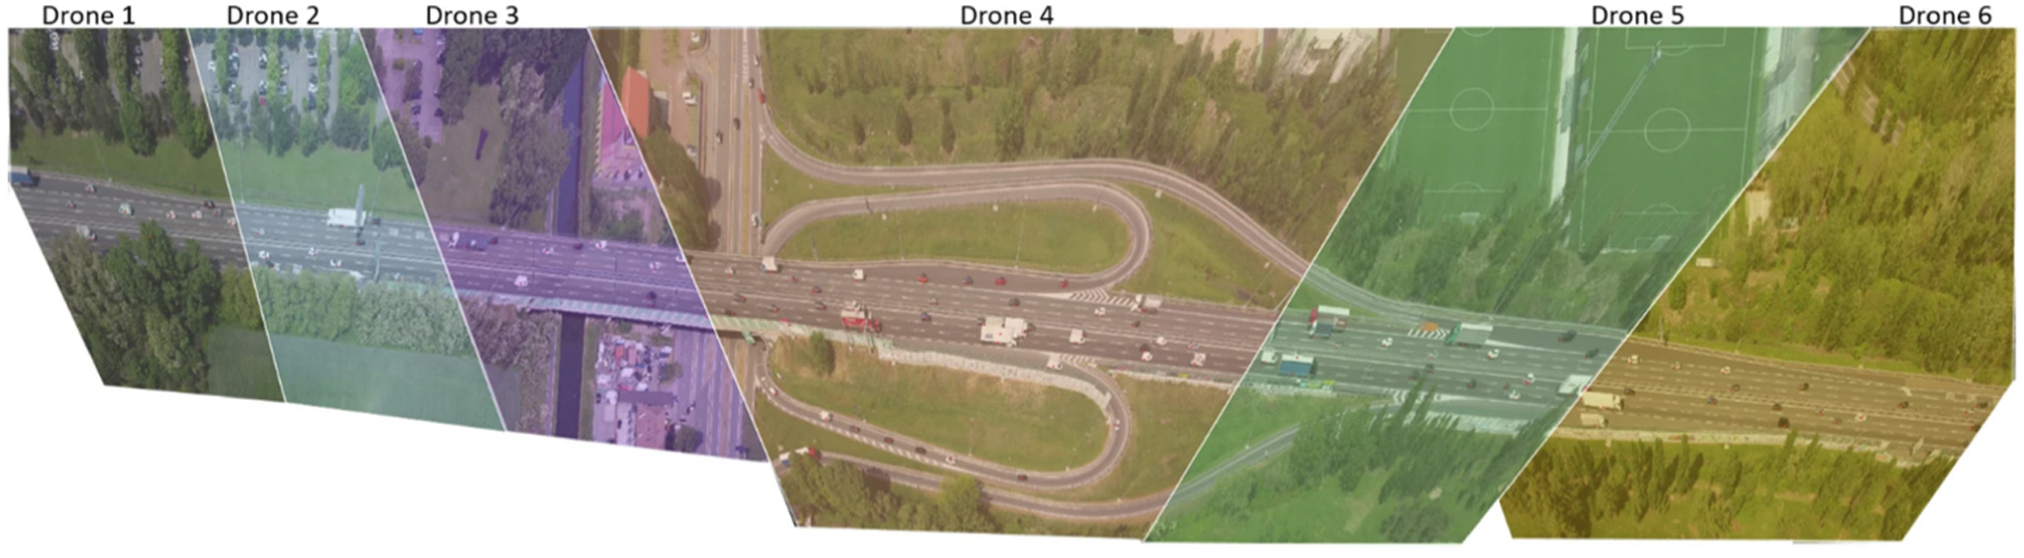
Aerial view of the Milan Trajectories (MiTra) data set study site, showing the monitored freeway segment and the coverage areas of the six drones used for trajectory extraction ( 38 ).
Measures of Performance and Goodness-of-Fit
The calibration problem was formulated by defining the model’s measures of performance (MoP) as a function of the parameter vector


where
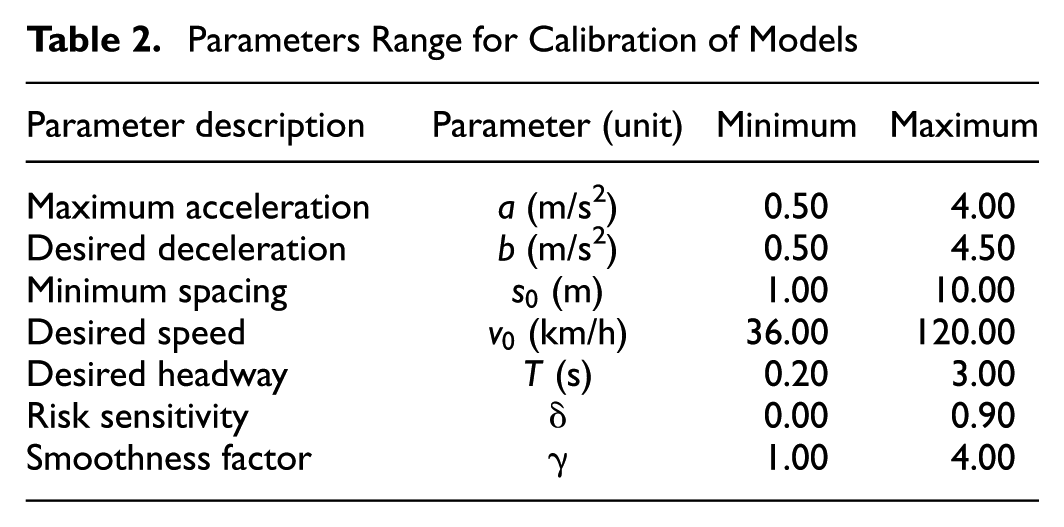
To evaluate model performance, various GoF metrics and MoP are employed in the literature. Punzo et al. ( 36 ) suggested that when calibrating car-following models, focusing on spacing yields optimal optimization for spacing and suboptimal results for speed. In contrast, calibrating on speed would result in an optimal speed trajectory but would leave spacing indeterminate. Therefore, spacing is preferred as MoP and was adopted in this study. For the GoF, the preferred root mean square error (RMSE) ( 36 ) was adopted, which is defined in Equation 42. Table 2 gives the range of parameters for the calibration of models.
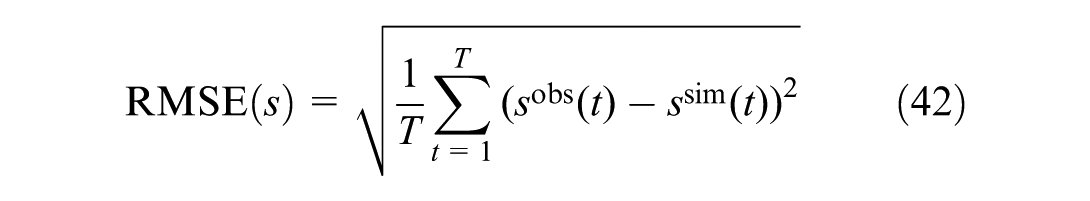
where
Parameters Range for Calibration of Models
Optimization Algorithm
The calibration process seeks to determine the model parameters that reduce the difference between the simulated values and observed data. In general, this is conducted using optimization techniques ( 43 , 44 ). In this study, the Whale Optimization Algorithm (WOA) was used to identify the optimum model parameters ( 45 ). The WOA is a population-based metaheuristic inspired by the bubble-net hunting behavior of humpback whales ( 45 ). The algorithm alternates between exploration, which searches broadly across the solution space, and exploitation, which refines candidate solutions near promising regions. These processes are implemented using mechanisms that mimic whale behaviors such as encircling prey, spiral bubble-net attacking, and random search ( 45 ). Such a balance between exploration and exploitation helps prevent premature convergence while maintaining efficient local search capability. Therefore, the WOA has demonstrated strong performance in solving complex nonlinear optimization problems and has been successfully applied across a wide range of engineering optimization tasks ( 46 ).
Car-following model calibration typically involves highly nonlinear objective functions with multiple local minima, where analytical gradients are unavailable and derivative-based optimization techniques are unsuitable ( 47 , 48 ). Population-based metaheuristics such as WOA are particularly appropriate for these problems because they perform global search without requiring gradient information and can effectively explore complex parameter spaces ( 46 ). To ensure robustness and reproducibility, identical optimization settings were applied across all experiments. The WOA was executed with a population size of 200 over 100 iterations. Multiple calibration runs with different initial populations produced consistent objective function values and parameter estimates, indicating that the optimization results were stable and not excessively sensitive to initialization. Convergence of the objective function was also monitored across iterations, and stable convergence behavior was observed.
Results and Discussions
This section evaluates the proposed model from two complementary perspectives: numerical soundness and behavioral soundness. Numerical soundness concerns the model’s quantitative validity, which is its ability to reproduce observed trajectories with low error and maintain plausible parameters. Behavioral soundness, in contrast, reflects the model’s plausible behavioral credibility, assessing whether simulated responses and regime transitions accord with established human behavior ( 2 ). At the microscopic level, behavioral soundness evaluates whether simulated speed, spacing, acceleration patterns, and endogenous regime transitions are consistent with established HF theories such as task difficulty homeostasis. This microscopic assessment focuses on trajectory-level behavioral adaptation under varying task demands. At the macroscopic level, behavioral soundness has already been examined analytically in earlier sections using equilibrium analysis and string stability properties. Considering both microscopic simulation behavior and macroscopic analytical properties is essential: a model that is numerically accurate but behaviorally implausible offers limited explanatory value ( 2 , 3 ). Evaluating the IDMTS using these complementary lenses provides a balanced assessment of its robustness, realism, and theoretical consistency.
Driving Simulator Experiment
Numerical Soundness
The calibration results obtained from the driving simulator experiments provide an initial assessment of the numerical soundness of the proposed IDMTS relative to the baseline IDM+. Both models were calibrated separately under normal and distracted driving conditions. The results presented in Table 3 indicate the calibrated parameters for the IDM+ and IDMTS models derived from normal driving trajectory data. The parameters obtained are plausible for the IDM+ and IDMTS models. The close correspondence between the IDM+ and IDMTS parameters demonstrates an important property of the proposed formulation: the addition of the cognitive layer enhances model responsiveness to changing task demands without disturbing the fundamental dynamics or parameter interpretability of the base model. The small reduction in calibration and validation RMSE confirms that the IDMTS improves numerical accuracy while preserving parsimony and numerical stability.
Calibrated Parameters of IDM+ and IDMTS with Normal Driving Data
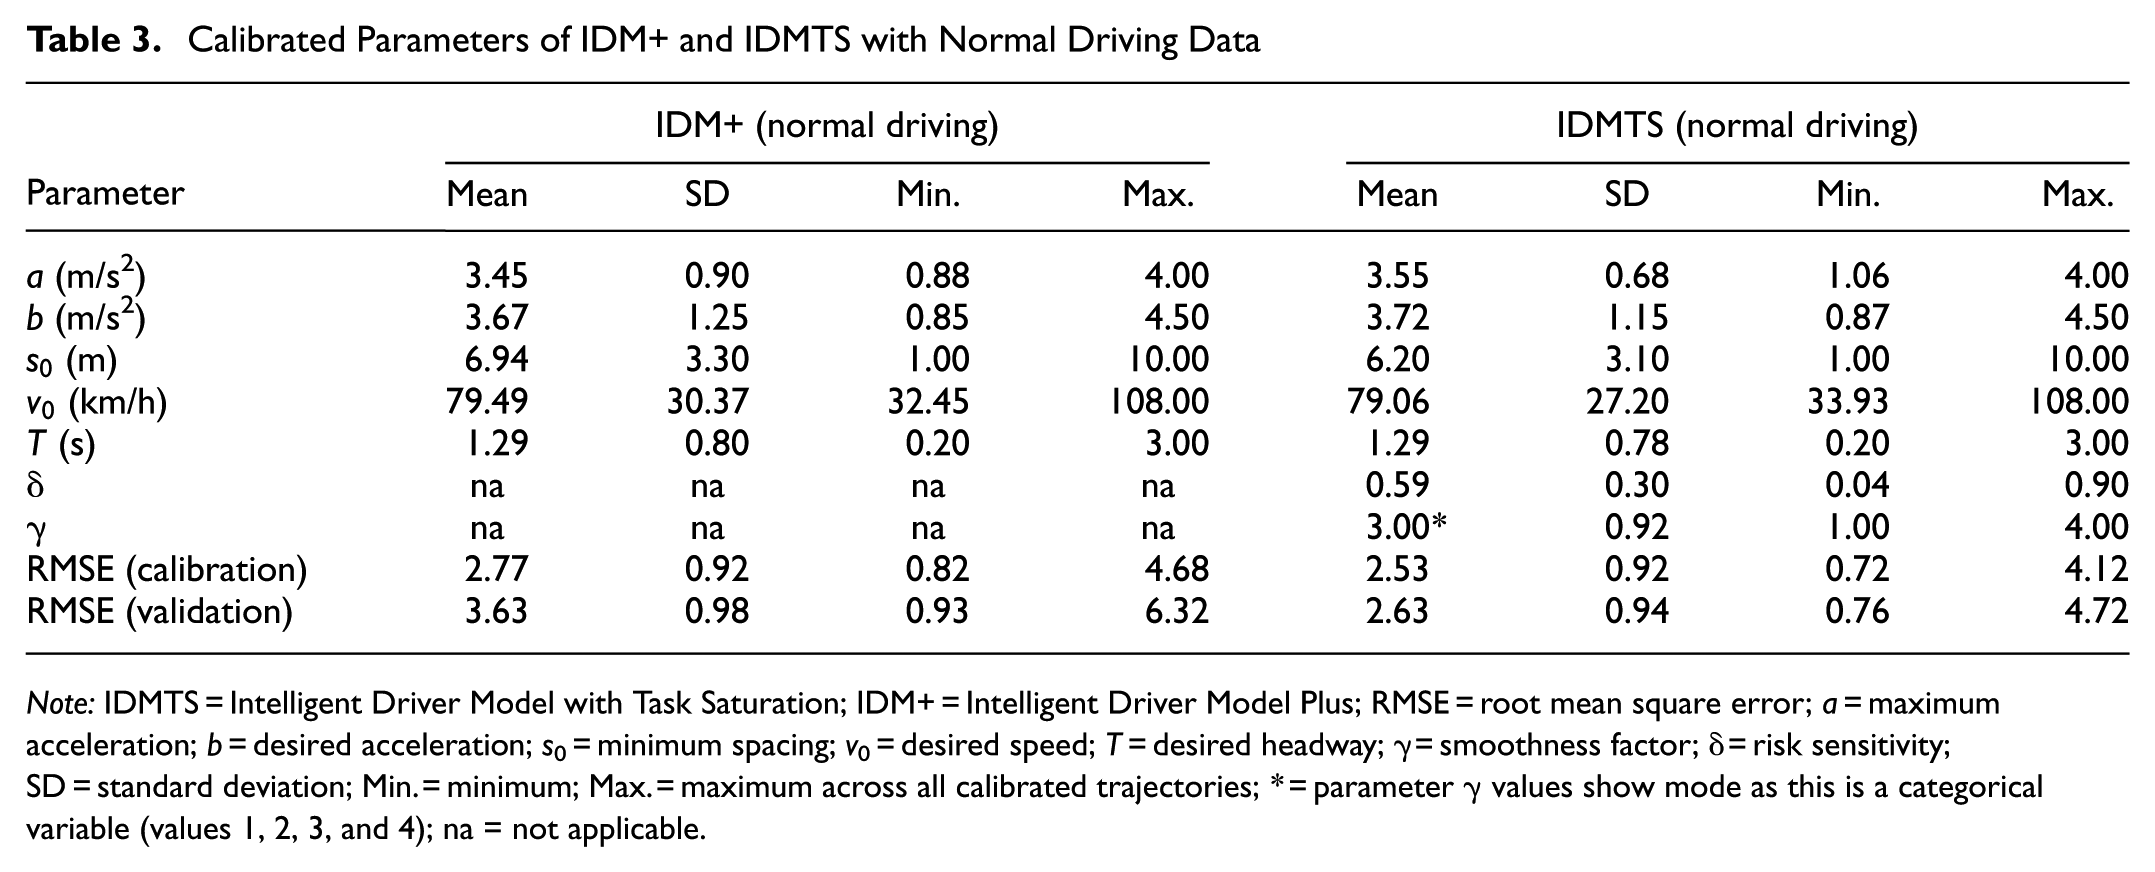
Note: IDMTS = Intelligent Driver Model with Task Saturation; IDM+ = Intelligent Driver Model Plus; RMSE = root mean square error; a = maximum acceleration; b = desired acceleration; s0 = minimum spacing; v0 = desired speed; T = desired headway; γ = smoothness factor; δ = risk sensitivity; SD = standard deviation; Min. = minimum; Max. = maximum across all calibrated trajectories; * = parameter
When distracted driving data were used (Table 4), systematic parameter shifts were observed that are consistent with behavioral expectations and reinforce the model’s numerical soundness. Both the maximum acceleration
Calibrated Parameters of IDM+ and IDMTS with Distracted Driving Data

Note: IDMTS = Intelligent Driver Model with Task Saturation; IDM+ = Intelligent Driver Model Plus; RMSE = root mean square error; a = maximum acceleration; b = desired acceleration; s0 = minimum spacing; v0 = desired speed; T = desired headway; γ = smoothness factor; δ = risk sensitivity; SD = standard deviation; Min. = minimum; Max. = maximum across all calibrated trajectories; * = parameter
For numerical fit, the IDMTS achieved lower calibration and Validation RMSEs than the IDM, demonstrating enhanced trajectory-reproduction capability under cognitively demanding conditions. The inclusion of the risk sensitivity parameter
These results establish the numerical soundness of the IDMTS. The model reproduces observed trajectories with reduced error, yields plausible and interpretable parameters, and remains numerically stable across contrasting behavioral contexts. Its ability to retain the structural elegance of IDM+ while delivering measurable gains in calibration and validation accuracy confirms that the cognitive extensions, task saturation and risk sensitivity are mathematically consistent, computationally efficient, and empirically justified.
Behavioral Soundness
Beyond numerical soundness, a car-following model must reproduce psychologically plausible behavioral patterns. The driving simulator experiments offer a controlled setting in which the behavioral soundness of the IDMTS can be assessed against established HF theories. In particular, the scenarios explicitly manipulate task demand via mobile phone conversations, operationalizing the core constructs of the TCI framework and task difficulty homeostasis ( 5 , 12 , 21 ). The key question is whether the IDMTS can endogenously reproduce the observed adaptations in spacing and speed between normal and distracted driving and whether the calibrated risk sensitivity and adaptation parameters provide a psychologically meaningful representation of intra-driver heterogeneity.
Figures 8 and 9 show two representative drivers spanning risk-averse and risk-taking profiles. For Driver 8, the model captures a case of risk-averse adaptation under distraction. Under the normal condition, the IDMTS remains almost entirely in the CFR, and its spacing and speed trajectories closely mirror IDM+, consistent with low task saturation: the driver experiences the task as manageable, and no additional adaptation is required. Under distraction, however, the observed trajectory exhibits larger headways and reduced speeds, in line with previous empirical findings that drivers often increase their safety margins when engaged in mobile phone conversations (
21
,
26
). The IDM+ is unable to represent this context-specific change in behavior and underestimates spacing during the distracted segment, and shows high speed. In contrast, the IDMTS transitions from CFR to the BAR as task saturation rises, and the simulated spacing profile aligns closely with the observed adjustment. This regime shift is not imposed exogenously but arises from the interaction between the task saturation function and the driver’s calibrated risk sensitivity
Comparison of IDM+ and IDMTS performance under: (a) normal; and (b) distracted driving conditions for a risk-averse driver.
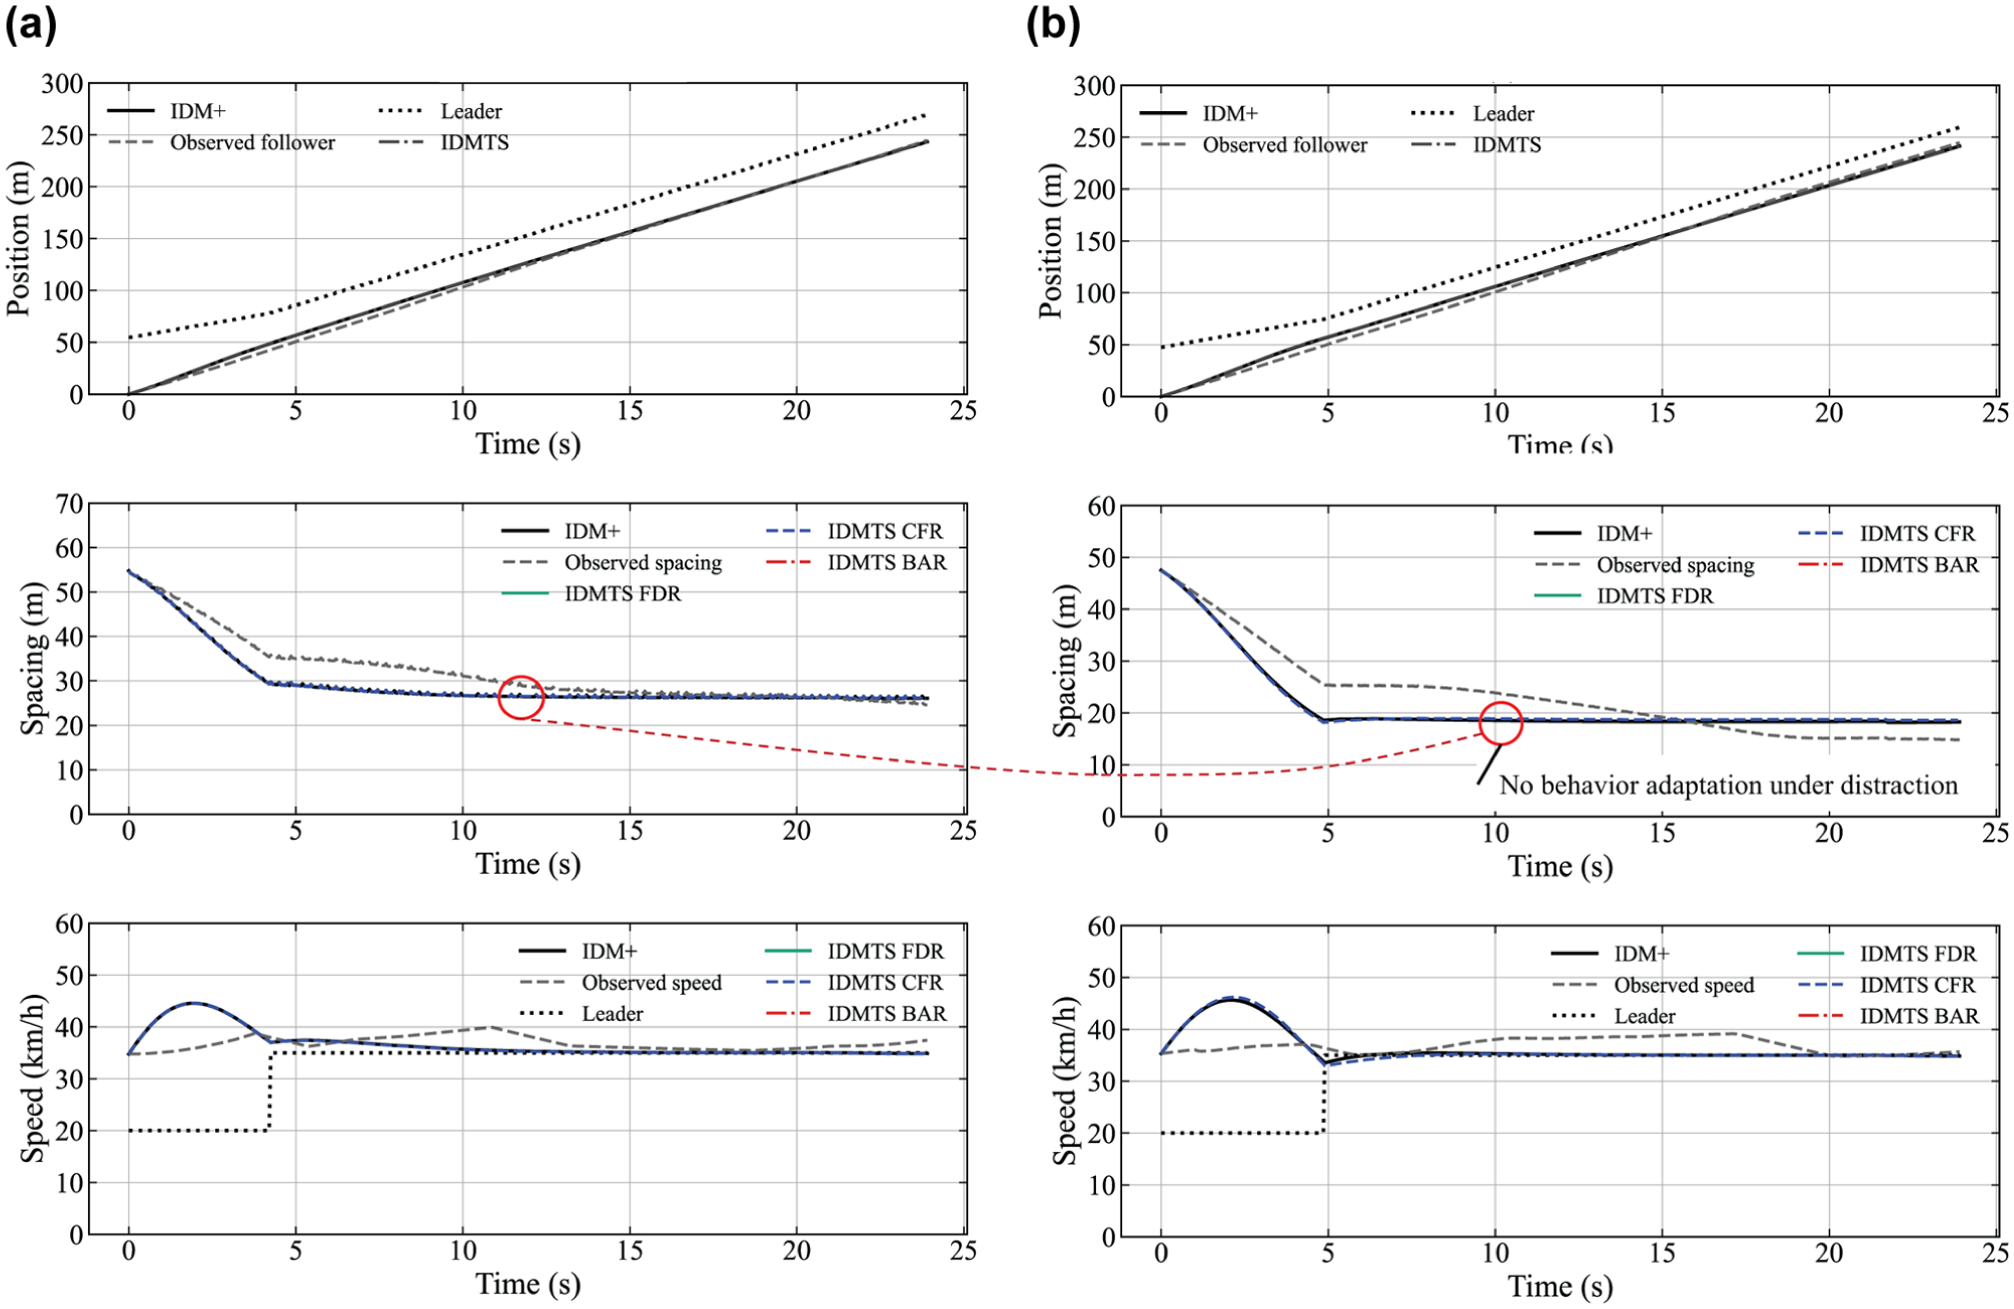
Comparison of IDM+ and IDMTS performance under normal and distracted driving conditions for risk-taking driver.
In contrast, Driver 17 exemplifies a risk-taking strategy (Figure 9). The empirical data show shorter headways and higher speeds during distraction compared with normal driving, consistent with drivers who underestimate task difficulty or accept elevated risk levels (
6
,
20
). The calibrated risk sensitivity for this driver is relatively low (
These three cases demonstrate that the IDMTS achieves behavioral soundness along several dimensions. First, regime selection is endogenous: transitions between free driving, car-following, and behavioral adaptation are governed by the evolving task saturation level and individual risk sensitivity. Second, the distribution of calibrated
The simulator analysis provides strong evidence that the IDMTS is numerically and behaviorally sound. It replicates key stylized facts about distracted driving, such as increased headways and reduced speeds for risk-averse drivers, and persistent short headways for risk-taking drivers, and maps these patterns onto interpretable HF parameters within a unified car-following law. This dual alignment with data and theory distinguishes the IDMTS from many existing engineering models and supports its use as a behavioral testbed for studying distraction, task demand and intra-driver heterogeneity in microscopic traffic flow simulations.
However, there are some important limitations. Behavioral interpretation of
NGSIM Experiment
Numerical Soundness
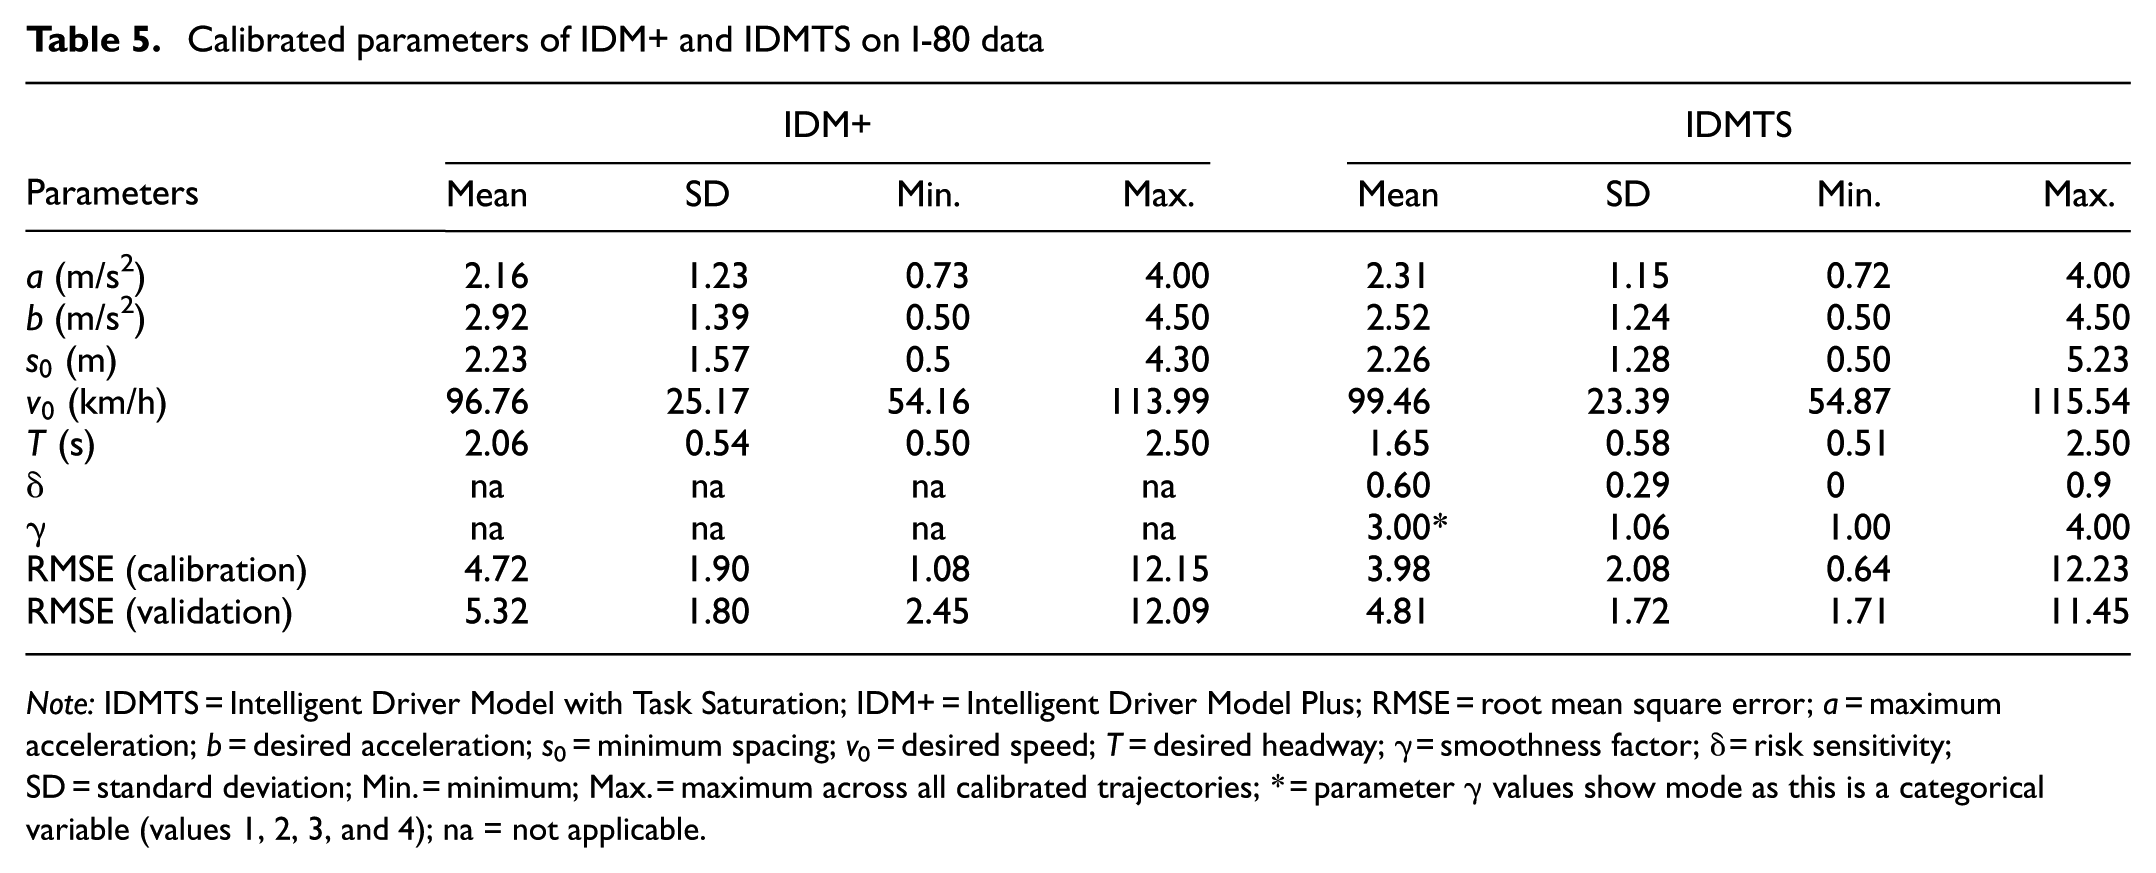
The evaluation of the IDMTS on the I-80 trajectory data set provides a test of its numerical stability and generalizability under naturalistic traffic conditions characterized by noise, heterogeneity, and complex interactions. Table 5 summarizes the calibration and validation statistics for the IDM+ and IDMTS across 396 leader–follower pairs. As in the driving simulator results, the IDMTS consistently achieves lower RMSEs in both calibration and validation phases, confirming that the proposed cognitive extension enhances numerical soundness without compromizing model stability. The mean calibration and validation RMSE for IDMTS decreases, indicating an average improvement of roughly 20%–25% in spacing accuracy relative to IDM+. These gains are meaningful in microscopic trajectory modeling, where sub-meter accuracy differences often translate into significant improvements in simulated flow stability and macroscopic realism ( 36 ).
Calibrated parameters of IDM+ and IDMTS on I-80 data
Note: IDMTS = Intelligent Driver Model with Task Saturation; IDM+ = Intelligent Driver Model Plus; RMSE = root mean square error; a = maximum acceleration; b = desired acceleration; s0 = minimum spacing; v0 = desired speed; T = desired headway; γ = smoothness factor; δ = risk sensitivity; SD = standard deviation; Min. = minimum; Max. = maximum across all calibrated trajectories; * = parameter
Of note, the IDMTS retains the numerical soundness of the IDM family. No instances of divergence, oscillatory instability, or negative spacing were observed during simulation, even under high-density, stop-and-go conditions. This stability can be attributed to the model’s design: the BAR modifies acceleration smoothly via the task saturation function, avoiding abrupt deceleration jumps that could cause numerical blow-ups. This feature contrasts with some hybrid or switching-logic models in which discontinuities in regime boundaries induce instability ( 49 , 50 ).
From a parameter estimation standpoint, the IDMTS demonstrates convergence comparable to IDM+, with parameter ranges remaining physically plausible. The mean desired time headway
Although the IDMTS introduces two additional parameters relative to IDM+, the consistent reduction in validation RMSE across both the simulator and the I-80 data sets indicates that performance gains are not confined to calibration data. Moreover, the BAR is conditionally activated; during large portions of trajectories where task saturation remains below tolerance, the IDMTS effectively collapses to IDM+. This conditional structure limits unnecessary parameter exploitation and reduces the risk of overfitting. The bounded parameter domains for
Behavioral Soundness
While numerical accuracy establishes a model’s quantitative soundness, behavioral soundness assesses whether its simulated dynamics remain psychologically and behaviorally plausible when exposed to the complexity of real-world traffic. The NGSIM I-80 data, which capture heterogeneous car-following interactions across varying densities and traffic regimes, provide an ideal testbed for this purpose. Under such uncontrolled conditions, drivers continuously balance task demand, situational awareness, and risk acceptance, an interplay central to TCI ( 5 , 12 ) and risk-homeostasis theories ( 27 ). Therefore, the key question is whether the IDMTS can replicate these adaptive responses in naturalistic car-following behavior without explicit regime labeling or driver-type classification.
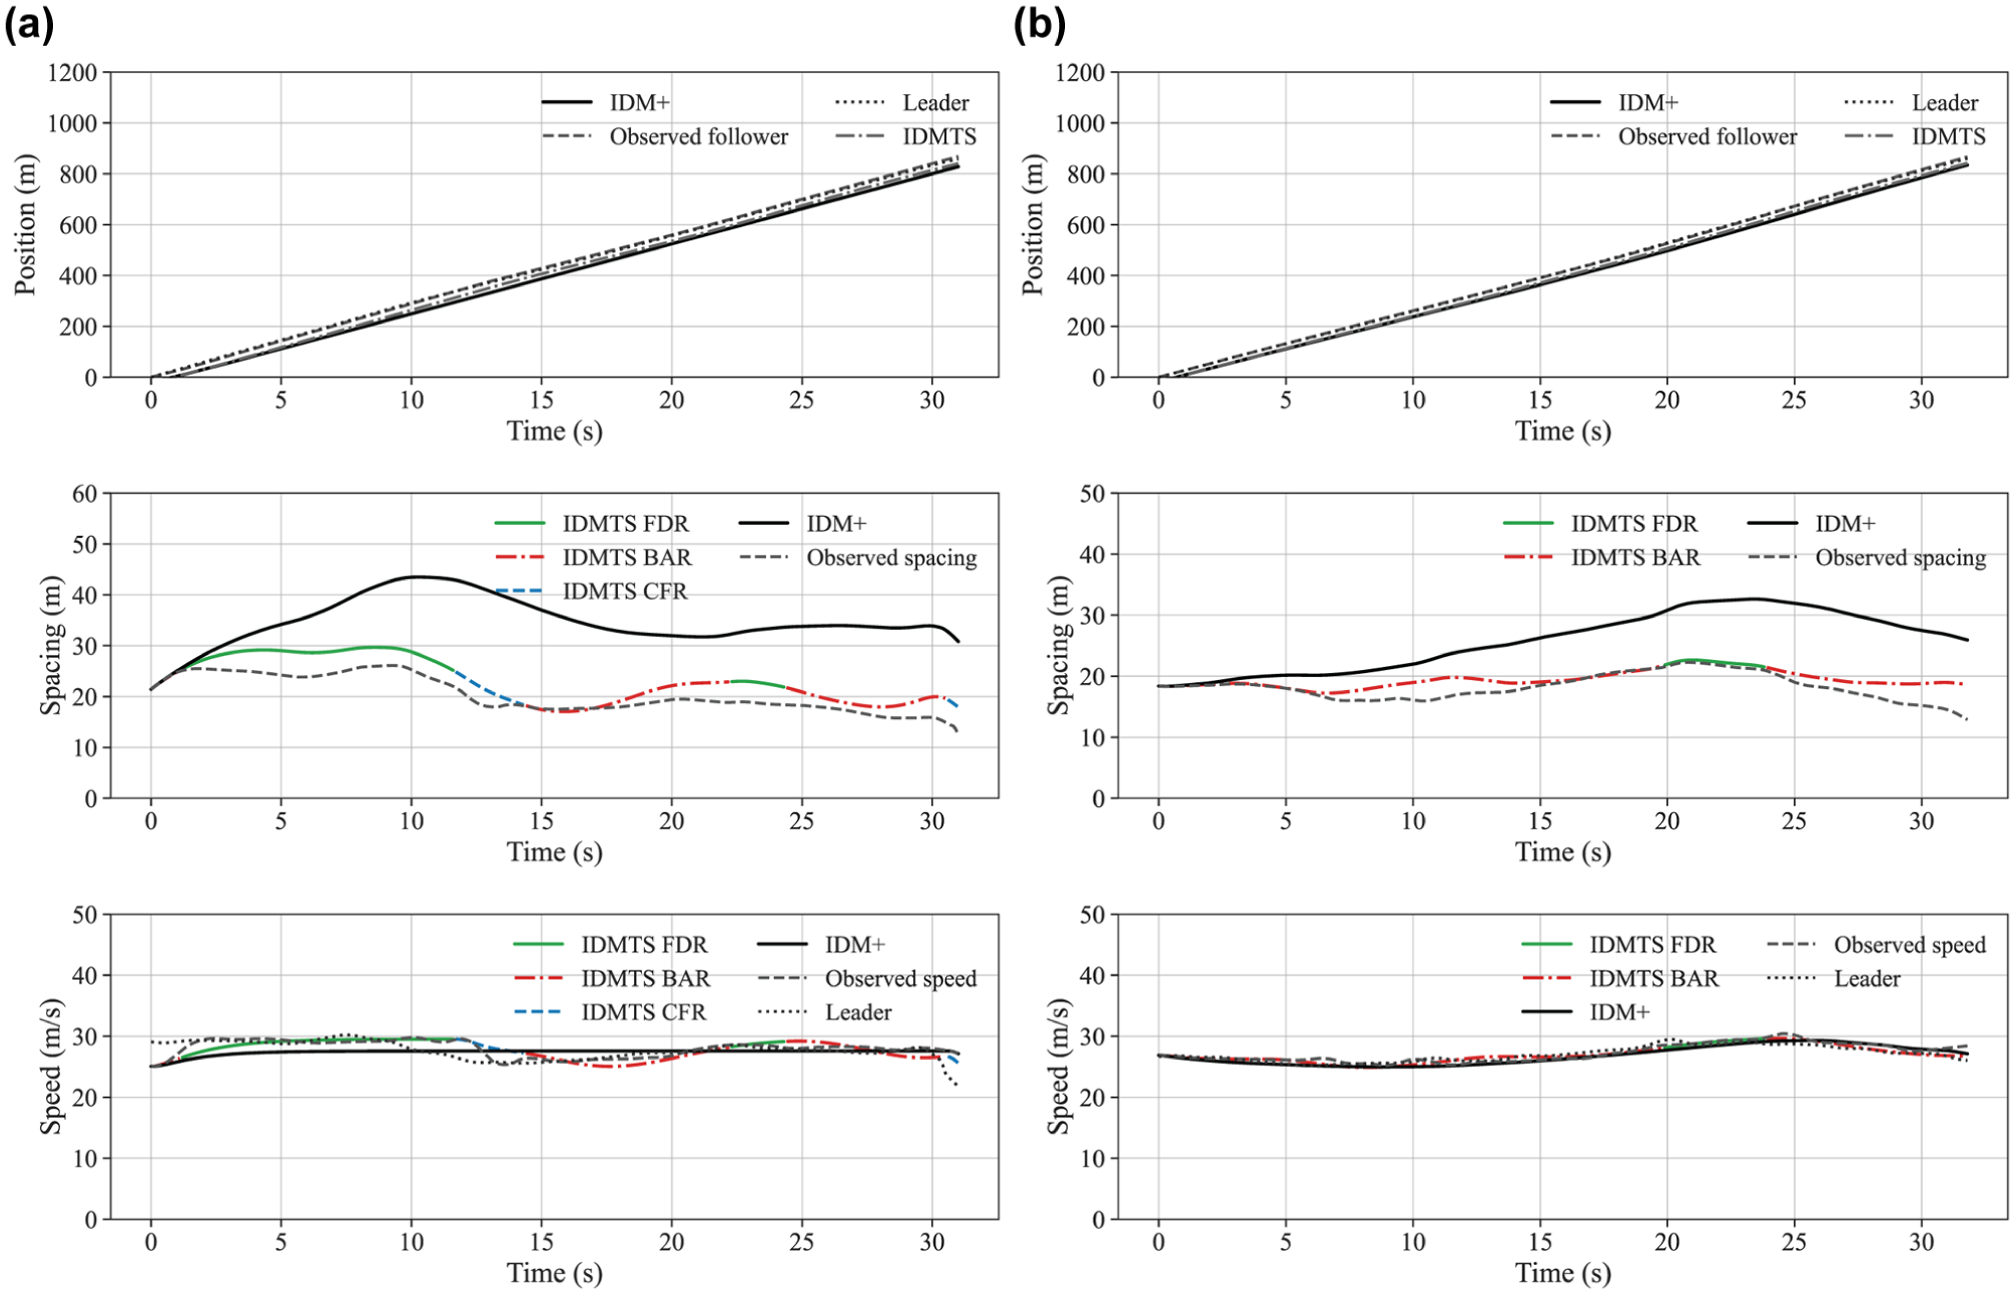
Figure 10 shows the simulated trajectories for two representative leader–follower pairs extracted from the NGSIM I-80 data set. For the IDMTS simulations, the follower dynamics are further decomposed into regime-specific segments corresponding to the FDR, CFR, and BAR. This decomposition emphasizes how the proposed model dynamically transitions between regimes as task saturation evolves. In particular, periods of reduced spacing and elevated traffic demand trigger the activation of the BAR regime, during which the IDMTS produces adaptive deceleration and spacing adjustments that more closely follow the observed trajectory compared with IDM+. Figure 10 shows how the task saturation mechanism enables the model to capture localized behavioral adaptation in naturalistic traffic conditions.
Simulation for two representative leader–follower pairs calibrated on I-80 data set comparing IDM+ and IDMTS. In the IDMTS model, speed and spacing profiles are decomposed into regime-specific segments: (
The calibrated IDMTS parameters reveal a behaviorally interpretable spectrum of intra-driver heterogeneity. The risk sensitivity parameter
Crucially, these behavioral tendencies arise endogenously in the IDMTS through the activation of the BAR. Under congested or unstable conditions, where spacing shortens and task saturation increases, the model predicts localized deceleration waves for high-
The calibrated smoothness parameter
The NGSIM experiment results confirm that the IDMTS is not merely a numerically improved variant of IDM+ but a behaviorally sound model capable of reproducing intra-driver adaptation and risk heterogeneity under naturalistic traffic conditions. By coupling task saturation with risk sensitivity in a single acceleration law, the IDMTS bridges the gap between physics-based and cognition-based modeling, providing a theoretically grounded and empirically verifiable framework for human-centered traffic flow analysis.
MiTra Experiment
Numerical Soundness
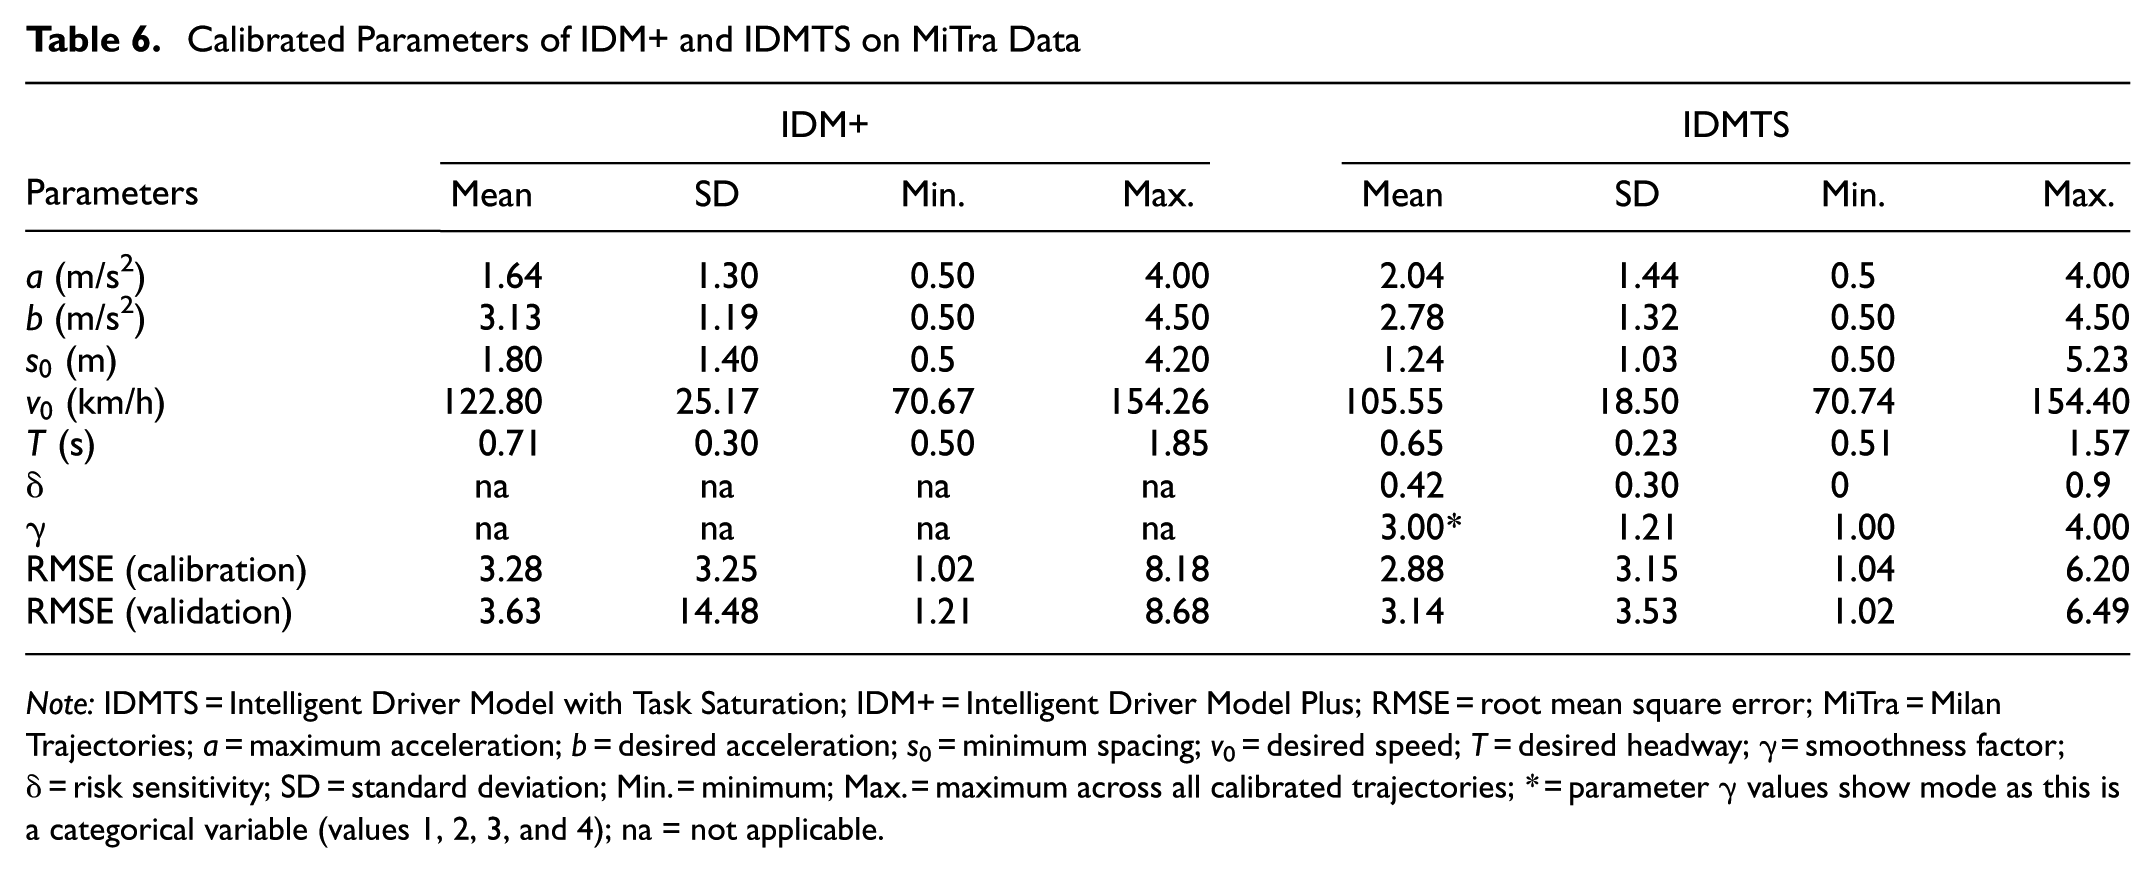
To further assess the robustness of the proposed model under naturalistic traffic conditions, the calibration and validation analyses were conducted using the MiTra trajectory data set. Table 6 presents the calibrated parameters for the baseline IDM+ and the proposed IDMTS model across all MiTra car-following trajectories. The optimization results indicate stable and physically plausible parameter estimates for both models. The calibrated maximum acceleration parameter
Calibrated Parameters of IDM+ and IDMTS on MiTra Data
Note: IDMTS = Intelligent Driver Model with Task Saturation; IDM+ = Intelligent Driver Model Plus; RMSE = root mean square error; MiTra = Milan Trajectories; a = maximum acceleration; b = desired acceleration; s0 = minimum spacing; v0 = desired speed; T = desired headway; γ = smoothness factor; δ = risk sensitivity; SD = standard deviation; Min. = minimum; Max. = maximum across all calibrated trajectories; * = parameter
For model performance, the proposed IDMTS consistently outperforms IDM+. The average calibration RMSE decreases from 3.28 m (IDM+) to 2.88 m (IDMTS), while the validation RMSE reduces from 3.63 to 3.14 m, representing an improvement in predictive accuracy. Of note, this improvement persists in the validation stage, indicating that the proposed model does not simply overfit the calibration trajectories but generalizes well to unseen data. The dispersion of the RMSE values across trajectories also indicates that the proposed model achieves more stable performance across diverse driving situations captured in the MiTra data set. These results demonstrate that incorporating task saturation mechanisms improves the model’s ability to reproduce longitudinal vehicle dynamics observed in naturalistic traffic environments.
Behavioral Soundness
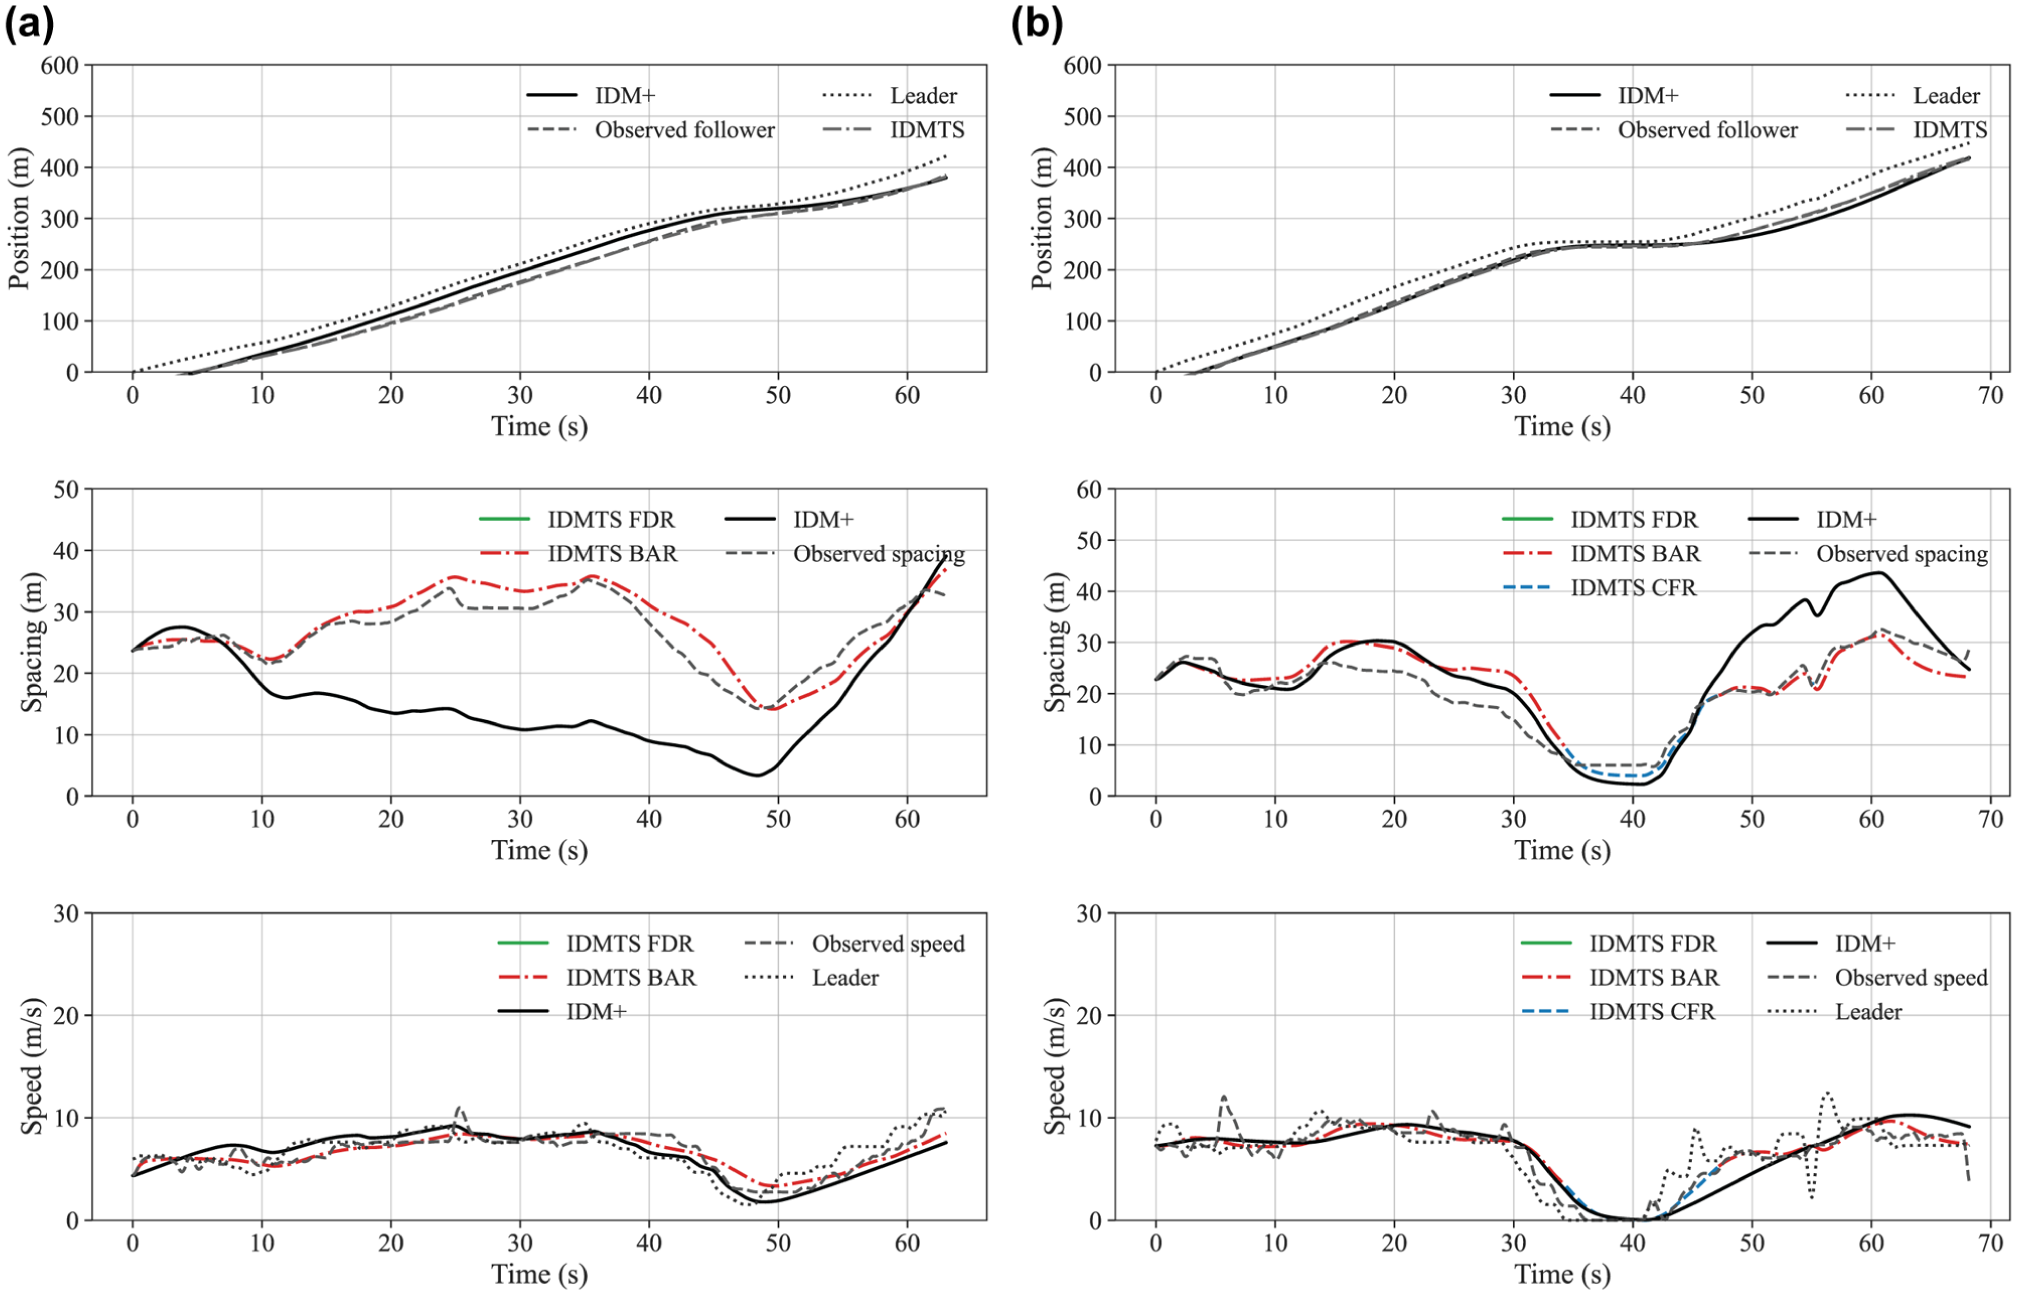
Figure 11 shows representative car-following episodes from the MiTra data set, comparing the observed trajectories with simulations generated by IDM+ and IDMTS. The position profiles indicate that both models broadly capture the general movement of the follower vehicle relative to the leader. However, noticeable differences emerge when examining spacing dynamics. The IDM+ model tends to overestimate spacing, producing trajectories that deviate from the observed follower behavior. In contrast, the IDMTS model reproduces the observed spacing dynamics more closely across different behavioral regimes.
Simulation for two representative leader–follower pairs calibrated on Milan Trajectories data set comparing IDM+ and IDMTS. In the IDMTS model, spacing profiles are decomposed into regime-specific segments
The proposed model distinguishes between three behavioral regimes (FDR, BAR, and CFR). These regimes enable the model to adapt the follower’s response according to the level of task demand. As shown in the spacing profiles, the IDMTS transitions smoothly between these regimes, allowing it to capture moderate adjustments and stronger responses when the leader’s behavior changes. The speed trajectories further confirm the behavioral realism of the proposed model. The IDMTS closely tracks the observed follower speed while maintaining consistency with the leader’s speed profile. In comparison, IDM+ occasionally produces smoother but less responsive speed adjustments, which leads to deviations in spacing over time. The results demonstrate that the IDMTS framework provides behaviorally plausible responses while maintaining numerical stability. By explicitly accounting for task saturation and behavioral adaptation, the model is able to better reproduce the longitudinal interaction patterns observed in the MiTra data set. This finding further supports the general applicability of the proposed modeling framework across different empirical trajectory data sets.
The simulator and naturalistic data analyses demonstrate that the proposed IDMTS framework achieves a balance between numerical reliability and behavioral interpretability. Across both controlled and naturalistic conditions, the model reproduces empirical trajectories with lower errors while retaining plausible, stable parameters, confirming its numerical soundness. Simultaneously, the risk sensitivity and task saturation mechanisms yield behaviorally coherent adaptations that align with established theories of driver workload regulation and risk-homeostasis ( 5 , 28 ). This dual consistency indicates that the IDMTS extends beyond a mere data-fitting improvement: it embeds a cognitively meaningful decision structure within a mathematically tractable acceleration law. From a methodological standpoint, this integration bridges the long-standing gap between HF soundness and numerical rigor in microscopic traffic modeling. Practically, the framework enables more faithful simulations of driver heterogeneity, distraction effects, and adaptive behavior, providing a foundation for next-generation traffic flow models and human-centered automated-vehicle controllers that can dynamically account for task demand and risk sensitivity.
Conclusion
This study introduced the IDMTS, a car-following framework that embeds a cognitive layer in a mathematically tractable structure. By integrating task saturation and risk sensitivity into the acceleration law, the IDMTS bridges the long-standing divide between behaviorally interpretable and numerically reliable traffic flow models. Analytical derivations confirmed that the extended formulation preserves equilibrium, rational driving, and stability properties of the base IDM+, ensuring theoretical soundness.
Using complementary data sets, controlled driving simulator experiments and naturalistic (NGSIM and MiTra) trajectories, the model was evaluated along two complementary dimensions: numerical and behavioral soundness. Numerically, the IDMTS achieved lower calibration and validation errors, stable convergence, and physically plausible parameter values across heterogeneous drivers, confirming its computational robustness. Behaviorally, the model reproduced key empirical features of driver adaptation under distraction and congestion, including risk-averse headway enlargement, risk-taking persistence, and endogenous regime transitions governed by task demand. Of note, the model distinguishes between equilibrium adaptation driven by risk sensitivity and perturbation damping governed by adaptation smoothness, highlighting the multilayered nature of behavioral influence on macroscopic traffic dynamics. Therefore, the macroscopic robustness of the traffic system is influenced by both the stability properties governed by
Beyond its empirical performance, the IDMTS offers methodological implications for the broader traffic flow modeling community. It demonstrates that cognitive constructs can be incorporated without sacrificing analytical elegance or numerical stability, paving the way for hybrid frameworks that unify physics-based dynamics with HF principles. Future research will extend the model to incorporate explicit reaction time variability, multitask demand components, and lane-changing behavior, as well as explore its application to adaptive cruise control and cooperative automated-vehicle systems. By quantitatively linking workload, risk sensitivity, and longitudinal control, the IDMTS contributes a step toward behaviorally sound and human-aware microscopic traffic modeling.
Footnotes
Acknowledgements
The author would like to express gratitude to Prof. Zuduo Zheng for generously providing the driving simulator data, which was instrumental in calibrating the model in this research.
Author Contributions
The author confirms sole responsibility for the following: study conception and design, data preparation and analysis, and manuscript preparation.
Declaration of Conflicting Interests
The author declared no potential conflicts of interest with respect to the research, authorship, and/or publication of this article.
Funding
The author received no financial support for the research, authorship, and/or publication of this article.