
Abstract
Lane changing is a challenging but critical task for autonomous vehicles (AVs), especially when interacting with human-driven vehicles. Numerous lane change (LC) models have been proposed; however most pay little attention to interactions with surrounding vehicles. Although a few studies have recognized the importance of vehicle interaction during LC, most have considered it only from the perspective of safety. In addition, most previous studies relied solely on numerical data to validate the effectiveness of LC models. Furthermore, deploying newly developed LC models directly in real vehicles is often impractical because of the associated cost and safety concerns. To address these gaps, this study proposes a game theory–based LC decision model for AVs that determines the optimal timing for lane changing based on payoff evaluation. The payoff function comprehensively incorporates three aspects—safety, efficiency, and comfort—to provide more reasonable decision-making during the LC process. In addition, the driving preferences of competing vehicles are estimated by the AV and incorporated into payoff weighting process, enabling better interaction with different types of human drivers. A Stackelberg game framework is further introduced to determine the optimal decision strategy. The proposed model was evaluated in Simulink using potential conflicting LC events from the Shanghai Naturalistic Driving Study. In the simulation, the original lane-changing vehicles were replaced by AVs controlled by the proposed model. The results show that the model is capable of successfully completing lane-changing maneuvers while alleviating traffic conflicts to some extent compared with the original trajectories.
Introduction
In recent years, autonomous vehicles (AVs) have become a major focus of research because of their potential to improve traffic safety. However, according to crash reports for AVs released by the California Department of Motor Vehicles between 2018 and 2023, lane-change (LC)-related crashes accounted for the second-largest proportion of accidents ( 1 ). In addition, interaction with human-driven vehicles remains one of the most challenging tasks for AVs ( 2 ). Because mixed traffic environments consisting of both human-driven vehicles and AVs are expected to persist for the foreseeable future ( 3 ), it is essential to consider interactions with surrounding vehicles when developing LC decision models for AVs.
Previous studies on LC decision models are mainly rule based and develop mathematical formulations based on speed or relative distance. With the development of artificial intelligence, some studies have applied “black-box” approaches to solve the binary decision problem of whether to change lanes. However, the lack of interpretability of these approaches has limited their practical application. In addition, both types of models generally lack interaction with surrounding vehicles, most of which are assumed to be obstacles moving at a constant speed. Game theory is another common method for establishing LC decision models. The complexity of human behavior can be accurately modeled through game theory, which can also facilitate the identification of optimal strategies by evaluating the costs and benefits associated with each participant ( 4 ).
Most existing game theory–based models constructed the total payoff primarily by considering safety, while overly conservative strategies or uncomfortable passenger experiences may also affect the acceptance and performance of AVs ( 2 , 5 ). Furthermore, the payoff parameters for competing vehicles are typically obtained through offline training; however, these parameters may be inaccurate because of variations in individual driving behaviors ( 6 ).
Limited by data acquisition equipment, previous studies on LC decision models have primarily utilized numerical data or driving simulator data to verify model performance in simulation platforms ( 7 ). Although these data can demonstrate the feasibility of successful lane changing, the lack of comparison with real-world trajectories makes it difficult to evaluate the superiority of the models. Moreover, conducting real-vehicle tests immediately after proposing a new model would be both costly and impractical. Therefore, evaluating new models in a simulation platform using real trajectory data would be a more appropriate approach.
In this study, we developed a game theory–based LC decision model for AVs. A comprehensive payoff function was defined, which included three components: safety, efficiency, and comfort. A Stackelberg game framework was introduced to determine the optimal timing for lane changing. Potential conflicting LC events were extracted from Shanghai Naturalistic Driving Study (SH-NDS) database to simulate and validate the proposed model in Simulink. In the simulations, lane-changing vehicles (LCVs) were replaced with AVs controlled by the proposed model, and the minimum time to collision (TTC) and LC duration were compared with those of the original events. The results demonstrated that the proposed model enabled AVs to complete lane changes successfully while reducing the conflict levels of the original events.
The main contributions of this paper are as follows. First, the proposed model considers the complex interaction between AVs and human drivers during lane-changing maneuvers and employs game theory to capture the dynamic interaction process. Second, the study comprehensively considers the trade-offs among safety, efficiency, and comfort during the LC process for AVs.
For clarity, a list of acronyms and their definitions used in this study is provided in Table 1.
List of Acronyms and Their Definitions
Literature Review
With the development of autonomous driving technology, increasing attention has been paid to LC decision models, with the aim of improving the safety for AVs during lane-changing maneuvers. Based on the underlying methodologies, LC decision models can generally be classified into four categories: rule-based, utility-based, artificial intelligence–based and game theory–based models ( 8 ).
Rule-Based Models
Rule-based models are primarily based on mathematical formulations that use vehicle kinematic parameters as inputs and establish relationships among variables through explicit mathematical formulas or functions. Gipps ( 9 ) was among the first researchers to study LC decision models. Relative distance and relative speed between LCVs and vehicles in the target lane were selected as input parameters to develop the decision model. Building on this work, Hidas ( 10 ) proposed a more systematic LC decision model by classifying lane-changing behavior into three categories: free lane changing, forced lane changing, and cooperative lane changing. Corresponding mathematical formulas were developed for each category. Moreover, many researchers have introduced adjustable parameters into these formulations to improve model accuracy ( 11 – 13 ).
However, rule-based models cannot be applied effectively to all LC events or driving scenarios because their predefined rules and fixed parameters limit their generalization capability. Moreover, most rule-based models assume that surrounding vehicles travel at constant speeds, thereby neglecting the interactions between LCVs and surrounding vehicles during the LC process.
Utility Theory–Based Models
Utility theory has been shown to perform well in decision-making problems involving multiple influencing factors and uncertainty ( 14 ). In LC decision models, utility theory is often combined with gap acceptance models.
Ahmed ( 15 ) was among the first researchers to apply utility theory to LC modeling by treating lane changing as a sequential decision-making process involving necessity, desirability, and safety. After identifying the target lane, a gap acceptance model was employed to determine whether the driver would accept or reject the available gap in the target lane. Toledo et al. ( 16 ) introduced an integrated LC model based on utility theory that enabled drivers to jointly consider mandatory and discretionary lane-changing behaviors, thereby avoiding a rigid behavioral structure. The model was validated in micro-simulation software. In addition, Ali et al. ( 8 ) proposed a comprehensive LC decision-making framework that captured both mandatory and discretionary lane-changing behaviors. The framework integrated utility theory for target lane selection and incorporated a gap acceptance mechanism.
However, utility theory–based models mainly focus on evaluating the rationality of the overall LC process and cannot effectively provide guidance on the optimal timing of lane changing. In addition, these models are not well suited for analyzing complex strategic interactions, especially decision-making under incomplete information.
Artificial Intelligence–Based Models
In recent years, artificial intelligence–based models have attracted increasing attention because of their ability to overcome the limitations inherent in rigid mechanistic models.
Fuzzy logic models, one of the most widely artificial intelligence algorithms in LC research, are capable of representing uncertainty in a manner that reflects drivers’ perceptions of real-world variables. Das and Bowles ( 17 ) introduced a fuzzy knowledge–based method to microsimulate drivers’ behavioral decision-making during LC by converting nonlinear systems into conditional rules using fuzzy knowledge. Wu et al. ( 18 ) classified LC behavior into two categories according to target lane type and established corresponding fuzzy sets for each category. Building on previous studies, Moridpour et al. ( 19 ) developed an LC decision model for heavy vehicles using three fuzzy sets and validated the model in a simulation platform.
Another important category of artificial intelligence–based models is machine learning. Using data reflecting different driving preferences, Vallon et al. ( 20 ) used support vector machines to construct an LC decision model capable of simulating drivers’ binary lane-changing decisions. In addition, random forest and XGboost algorithms have also been applied to human-like LC decision models ( 21 ).
However, artificial intelligence–based models are often regarded as “black-box” systems because the decision-making process is difficult to interpret. When accidents occur, identifying the specific causes or deficiencies within the LC model can be challenging, since these models typically provide only the final output without revealing the underlying reasoning process. In safety-critical autonomous driving applications, such opacity may also raise concerns related to reliability and ethics.
Game Theory–Based Models
Game theory was originally developed as a mathematical framework in economics ( 22 ) and has since been widely applied to the study of human decision-making behavior. It consists of three primary elements: players, strategies, and payoffs. Unlike the previously discussed methods, game theory can explicitly describe the interactions between AVs and human-driven vehicles. Kita ( 23 ) was among the first researchers to apply game theory to LC decision-making, in which both the LCV and surrounding vehicles attempted to take the best course of action by predicting each other’s behavior.
Yu et al. ( 7 ) developed a multiplayer dynamic game theory–based LC decision model and adopted Nash equilibrium as the optimal solution. Nash equilibrium aims to maximize the benefits of all participants and is commonly used to solve noncooperative mixed-strategy games ( 24 , 25 ). This approach is based on several assumptions, most importantly that all players are rational and fully understand the game, including the strategy sets and payoff functions of other players. However, these assumptions imply that all vehicles are connected to AVs under complete information conditions, which is not realistic in the short term because human-driven vehicles and AVs are expected to coexist on the roads for decades ( 3 ).
Another noncooperative game approach is the Stackelberg game, proposed by Heinrich von Stackelberg ( 26 ). The Stackelberg game is a two-player sequential game involving a leader and a follower. The leader first commits to a strategy, after which the follower observes the leader’s actions and responds with their own strategy. In LC decision models, LCVs are typically regarded as leaders, whereas target-lane following vehicles (TFVs) are considered as followers. Yoo and Langari ( 27 ) introduced a Stackelberg game–based framework to model freeway-merging behavior and analyzed the influence of different human driving styles. Ji et al. ( 2 ) constructed a two-player Stackelberg game for AV lane changing in dense traffic and validated the model using numerical data. Considering both safety and energy consumption, Jiang et al. ( 28 ) assigned different weights within the Stackelberg framework to improve realism, whereas Hang et al. ( 3 ) applied Stackelberg game theory to generate appropriate decisions for AVs platoons facing cut-in behaviors.
Nevertheless, most game theory–based models, including those discussed above, define payoff functions primarily from the perspective of safety, while efficiency and comfort are also important considerations for AVs during the LC process. In addition, most existing models and systems are evaluated only through numerical simulations, which may not adequately reflect microscopic driving behavior ( 8 ).
Three major research gaps remain to be addressed. First, commonly used approaches, such as rule-based methods, cannot adequately capture the interactions between AVs and human-driven vehicles during LC. Second, a comprehensive payoff function is needed in game theory–based models to support better LC decision-making for AVs. Third, greater emphasis should be placed on real vehicle trajectory data rather than solely on numerical simulation data.
Data Preparation
Shanghai Naturalistic Driving Study
The data used in this study were collected through the SH-NDS, which was jointly conducted by Tongji University, General Motors (GM), and the Virginia Tech Transportation Institute.
Five GM light-duty vehicles, equipped with the Strategic Highway Research Program 2 (SHRP2) NextGen data acquisition system (DAS), were used to collect real-world driving data at at frequency of 10 Hz. An interface module integrated into the DAS recorded vehicle controller area network data. In addition, the longitudinal and lateral accelerations of the experimental vehicle (EV) were measured using onboard accelerometers, while the distance and relative speed of nearby vehicles, including those in adjacent lanes, were obtained through the radar system. Environmental conditions, including light intensity, temperature, and humidity, were recorded in real time using corresponding sensors. A GPS sensor was used to capture the precise position of the EV. Furthermore, four additional camera views were employed to assist in validating the sensor data.
As of June 2024, the SH-NDS database contained a total of 161,055 km of naturalistic driving data collected from 60 drivers. The demographic characteristics and driving experience of the participants were generally consistent with those of the broader Chinese driver population ( 29 ). Specifically, female participants accounted for just over 20% of the sample, which was comparable with the gender distribution of drivers in China. In addition, none of the participants were professional drivers, and most had not committed traffic violations within the previous 2 years, indicating relatively safe driving behavior. All participants owned vehicles and regularly drove on various road types in Shanghai for daily travel purposes. Consequently, the dataset provides realistic driving scenarios that reflect natural driving behavior and enhance the authenticity, reliability, and diversity of the research data.
LC Events Extraction
The DAS-equipped naturalistic driving study (NDS) vehicles functioned as TFVs when LCVs merged into the gap directly ahead of them. In the experimental dataset, the term T0 refers to the vehicle immediately preceding the NDS vehicle; therefore, changes in T0 may indicate the occurrence of potential LC events. Using onboard sensors and cameras, the NDS vehicles recorded trajectory-related data, including vehicle speed, acceleration, and relative distance with respect to the NDS vehicle. A typical LC scenario extracted from the NDS database is shown in Figure 1.
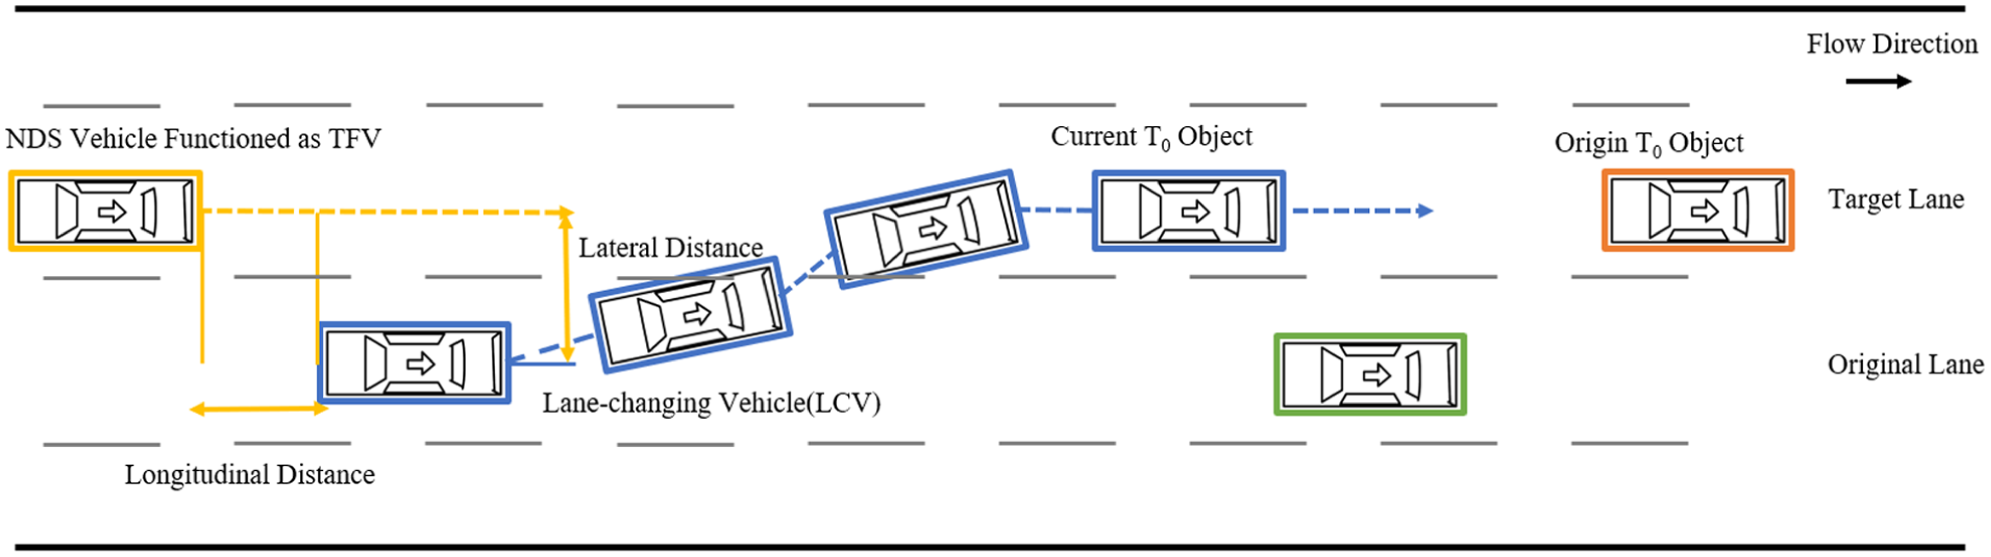
A typical LC scenario.
An extraction algorithm based on threshold criteria was utilized to automatically identify LC events from the NDS database ( 29 – 31 ). To capture as many LC events as possible, relatively broad threshold ranges were adopted to reduce the likelihood of missing valid lane-changing events. The criteria and corresponding threshold values are summarized as follows:
Both the TFV and LCV maintained speeds exceeding 1 m/s to ensure continuous vehicle motion.
The initial lateral distance between LCV and the TFV was less than 2.2 m, indicating that the LCV was traveling in the adjacent lane and had begun moving toward the target lane. The final lateral distance between LCV and the TFV is less than 1.2 m to guarantee the LCV is stable in the target lane.
The maximum longitudinal distance between the TFV and LCV was limited to 75 m to exclude LC events with negligible influence on surrounding vehicles. This threshold was determined based on 200 observations.
The maximum lateral acceleration of the TFV remained below 0.07 g, and the land offset was less than 1.7 m, conditions under which lane-changing behavior was considered unlikely.
These criteria were used to identify potential LC events. Subsequently, the corresponding video recordings were manually reviewed to confirm the occurrence of lane-changing maneuvers. A complete LC event consisted of three critical points: the initial point, the lane-crossing point, and the stabilization point. The initial point represented the driver’s intention to change lanes and was often accompanied by turn-signal activation or slight lateral movement. The stabilization point indicated the completion of the LC. Each point was determined according to changes in the lateral position of the LCV ( 30 , 31 ). Accordingly, the duration of each LC event was defined as the time interval between the initial point and the stabilization point.
However, not all LC events affected surrounding vehicles. In some cases, the LCV completed the LC without interacting with nearby vehicles. Therefore, LC events with a minimum TTC between the LCV and TFV of less than 3 s were classified as potential conflicting LC events in this study. These events were subsequently used to evaluate the effectiveness of the proposed LC decision model in the simulation platform.
Figure 2 illustrates the extraction process. Using the proposed extraction algorithm, 81 potential conflicting LC events were identified for further analysis.
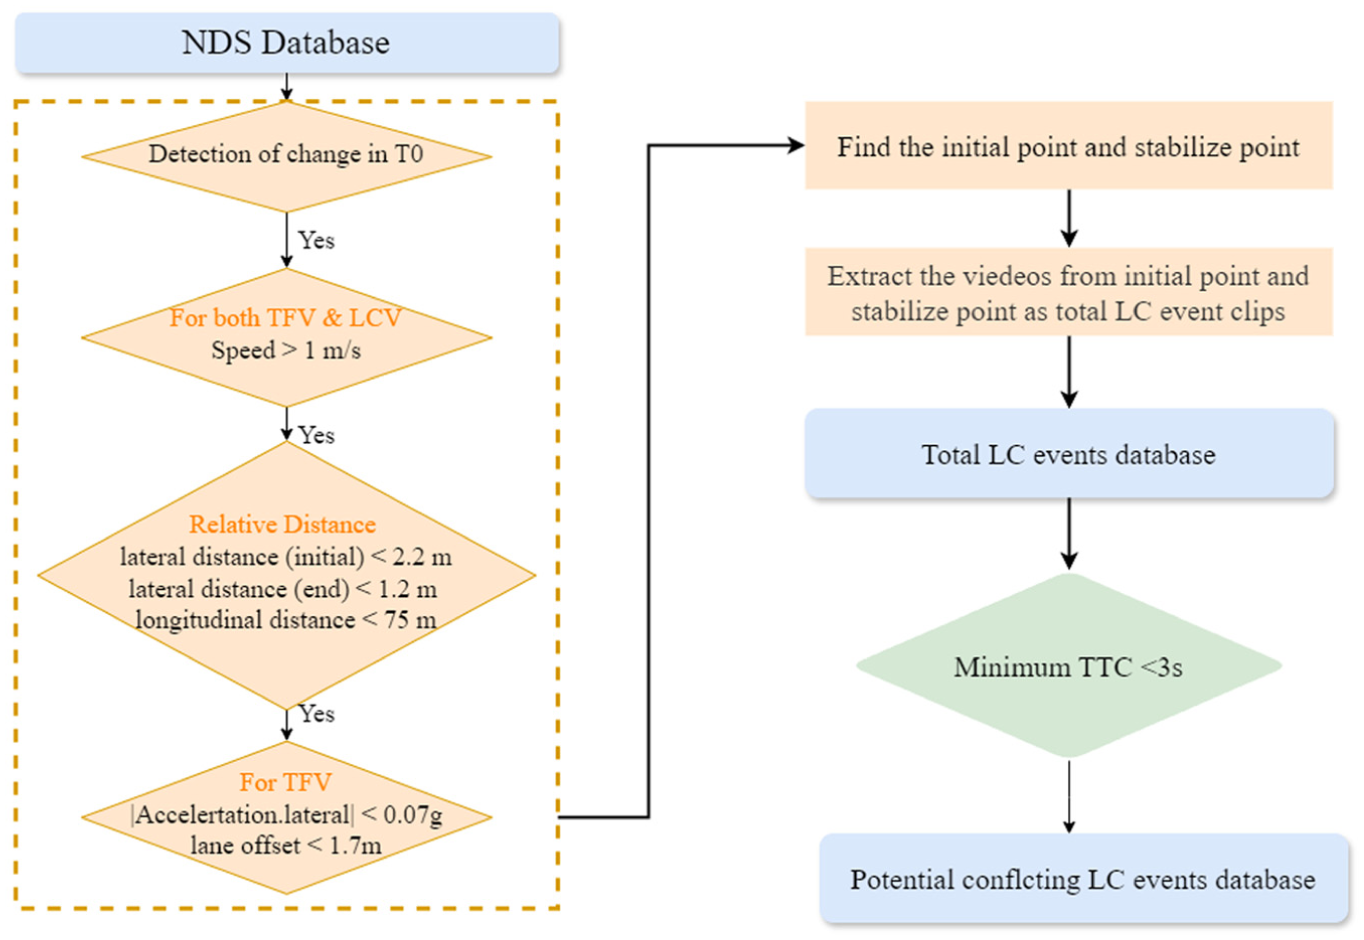
Extraction process for potential conflicting LC events.
Data Features
Based on the database of potential conflicting LC events, three categories of data features were obtained: NDS vehicle data, surrounding vehicle data, and environmental data, as shown in Table 2. The NDS vehicle data included instantaneous longitudinal and lateral velocity and acceleration. The surrounding vehicle data consisted of relative speed and relative distance between the NDS vehicle and nearby vehicles. In addition, the trajectory data of LCVs were derived from the NDS vehicle data and surrounding vehicle data. Environmental data included weather conditions, lighting conditions, and road type information.
Three Types of Data Features
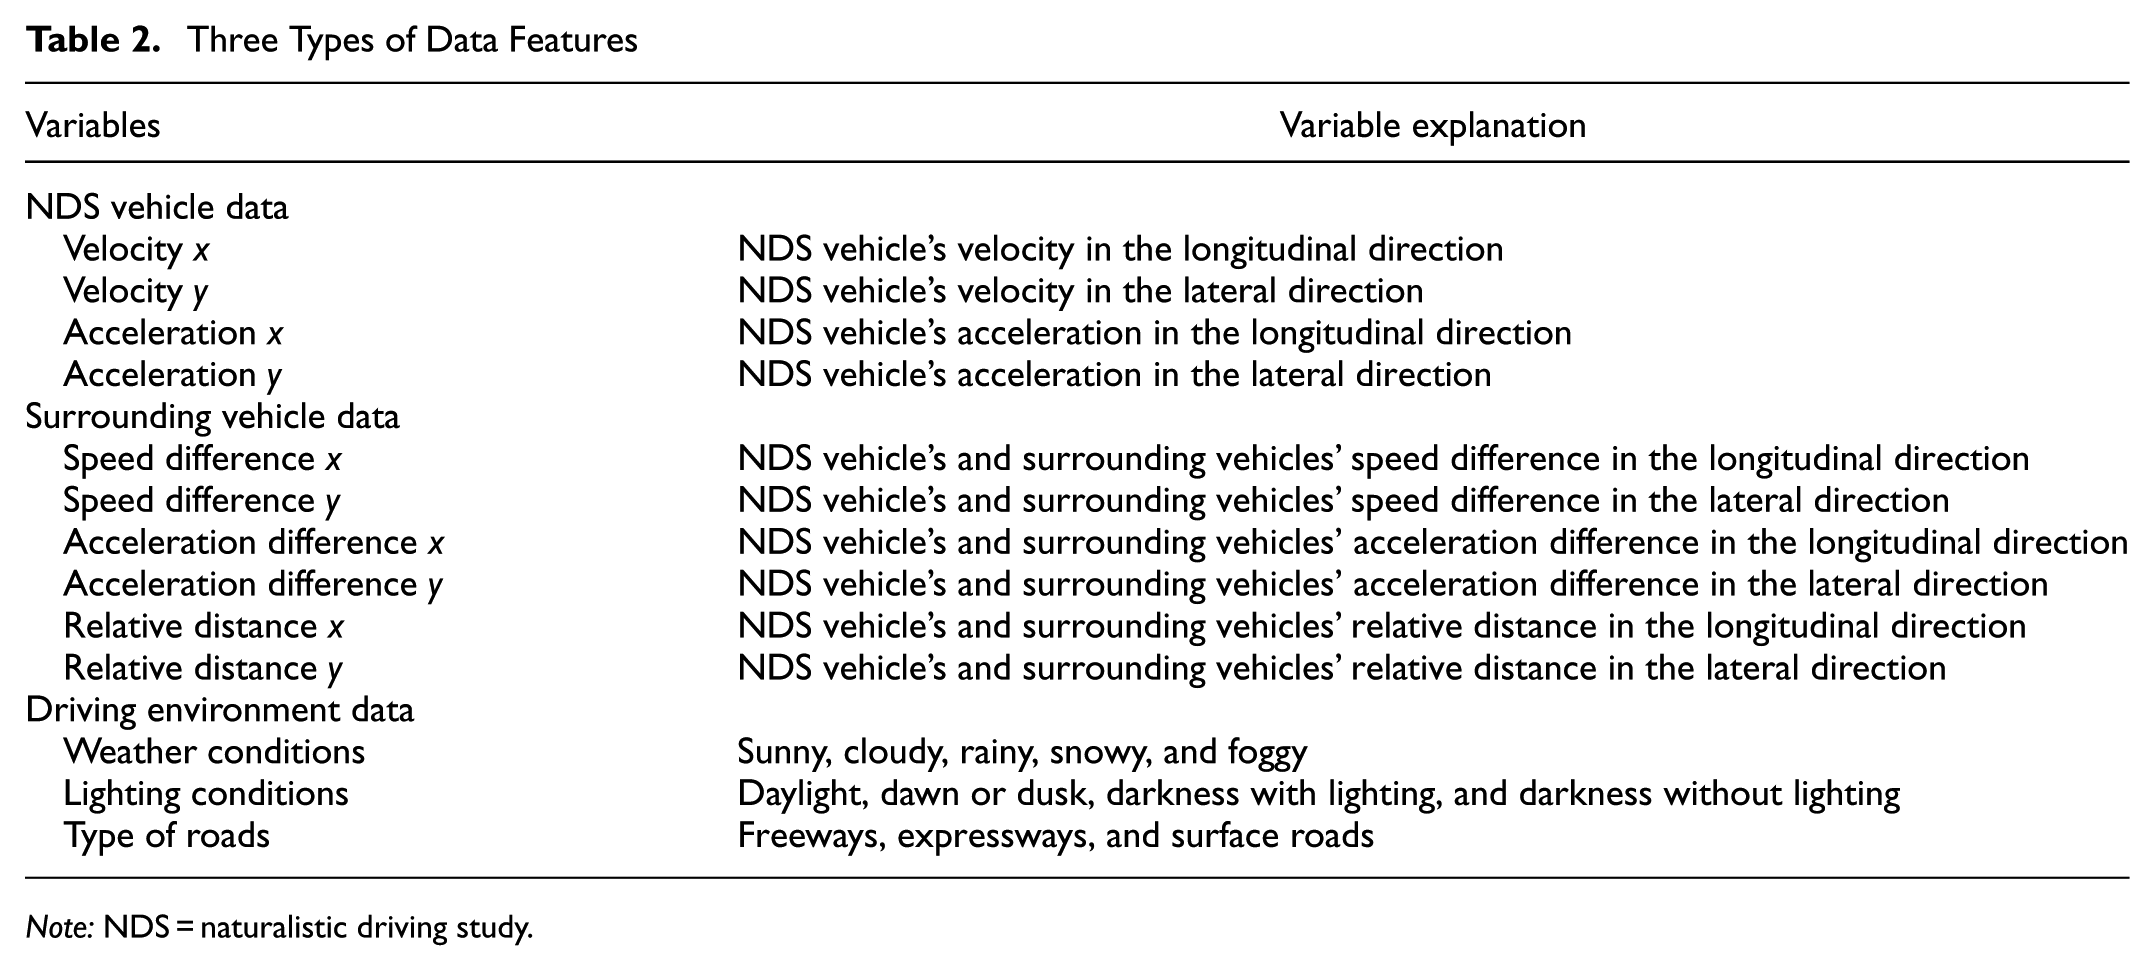
Note: NDS = naturalistic driving study.
All events and associated features were further validated using in-vehicle camera footage to confirm that each LCV executed a genuine lane-changing maneuver and to ensure the accuracy of the extracted environmental features ( 29 ).
Methodology
As shown in Figure 3, the framework of this study consists of three components: (1) data processing, (2) development of a game theory–based LC decision model, and (3) simulation-based validation of the proposed model. The data processing stage extracts the trajectories of LCVs and TFVs involved in potential conflicting LC events, as mentioned in Section Data Preparation. A game theory–based approach is then developed to generate reasonable decision-making strategies from the perspectives of safety, efficiency, and comfort when interacting with human-driven vehicles. In particular, a Stackelberg game framework is introduced to determine the optimal strategy.
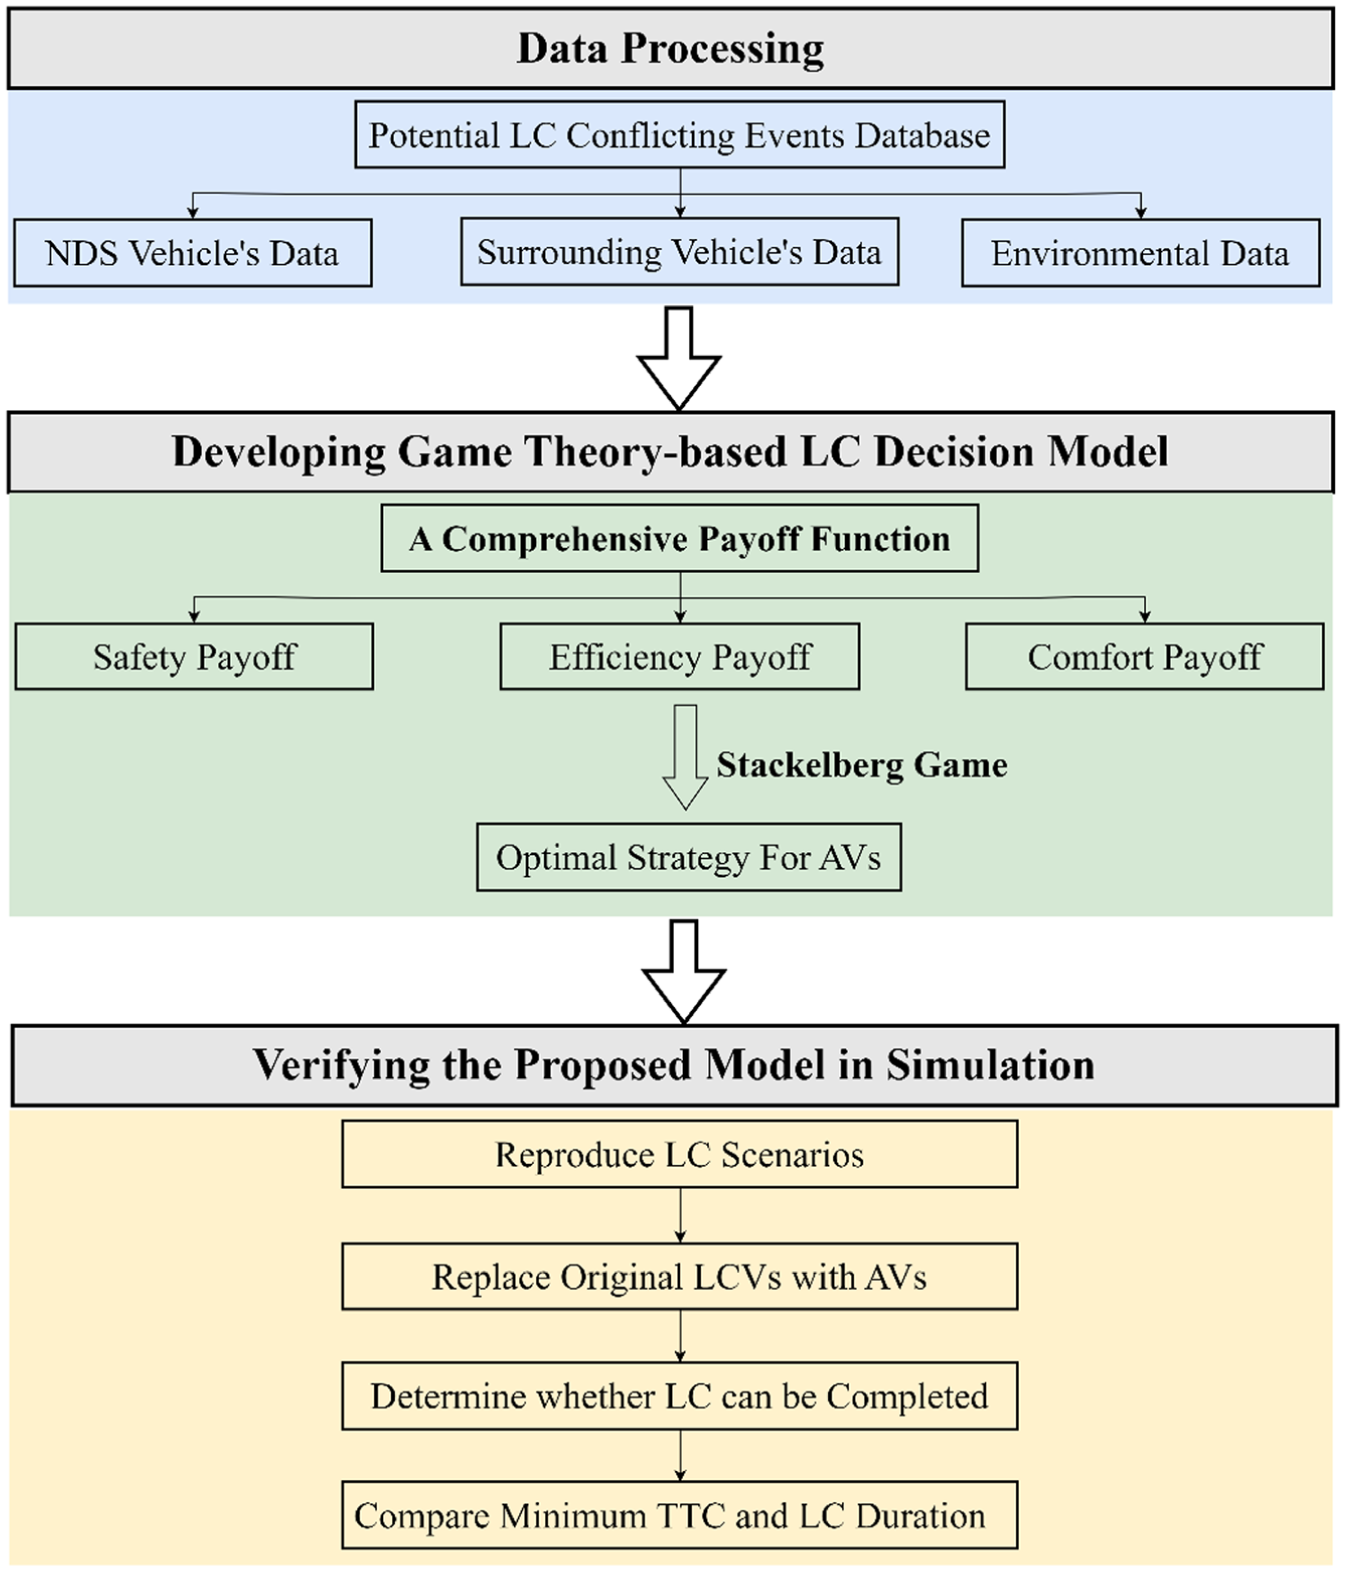
Framework of the study.
Model validation is conducted in Simulink, which is capable of reproducing the original LC scenarios. In the simulation, the trajectories of the original LCVs are replaced by AVs controlled by of the proposed model. In addition to verifying that the model can successfully complete lane-changing maneuvers, the minimum TTC during the LC process is compared with that of the original events to evaluate the safety performance of the model. Furthermore, LC duration is also compared to examine whether the proposed model avoids adopting overly conservative strategies for AVs.
Game Formulation
This study models the interactions between LCVs and TFVs as a two-player, non-zero-sum, noncooperative game. The proposed framework assumes that both players behave rationally during the decision-making process—that is, each player tends to select strategies that maximize their own payoff. In a non-zero-sum game, players receive distinct payoffs according to their chosen strategies, and the sum of the payoffs is not necessarily zero.
In the proposed LC model, the two players are the LCV and the TFV during the lane-changing process. The game framework assumes that the LCV determines its optimal strategy—that is, the strategy associated with the maximum payoff—by observing the actions of the TFV, such as providing larger acceptable gap or refusing to yield. The primary strategies available to the LCV are changing to the target lane or remaining in the current lane, whereas the TFV can adopt one of three strategies: accelerating, maintaining its current state, or decelerating. Because acceleration and deceleration are continuous variables, the strategy spaces of both the LCV and TFV can be considered virtually infinite.
To characterize the potential outcomes of these interactions, a comprehensive payoff function is constructed within the game framework. The overall game process is shown in Figure 4. The interaction begins when the LCV expresses its intention to change lanes, typically by activating the turn signal or making a slight lateral movement. After observing the response of the TFV, the LCV evaluates the TFV’s driving preference and selects the optimal strategy according to the total payoff.
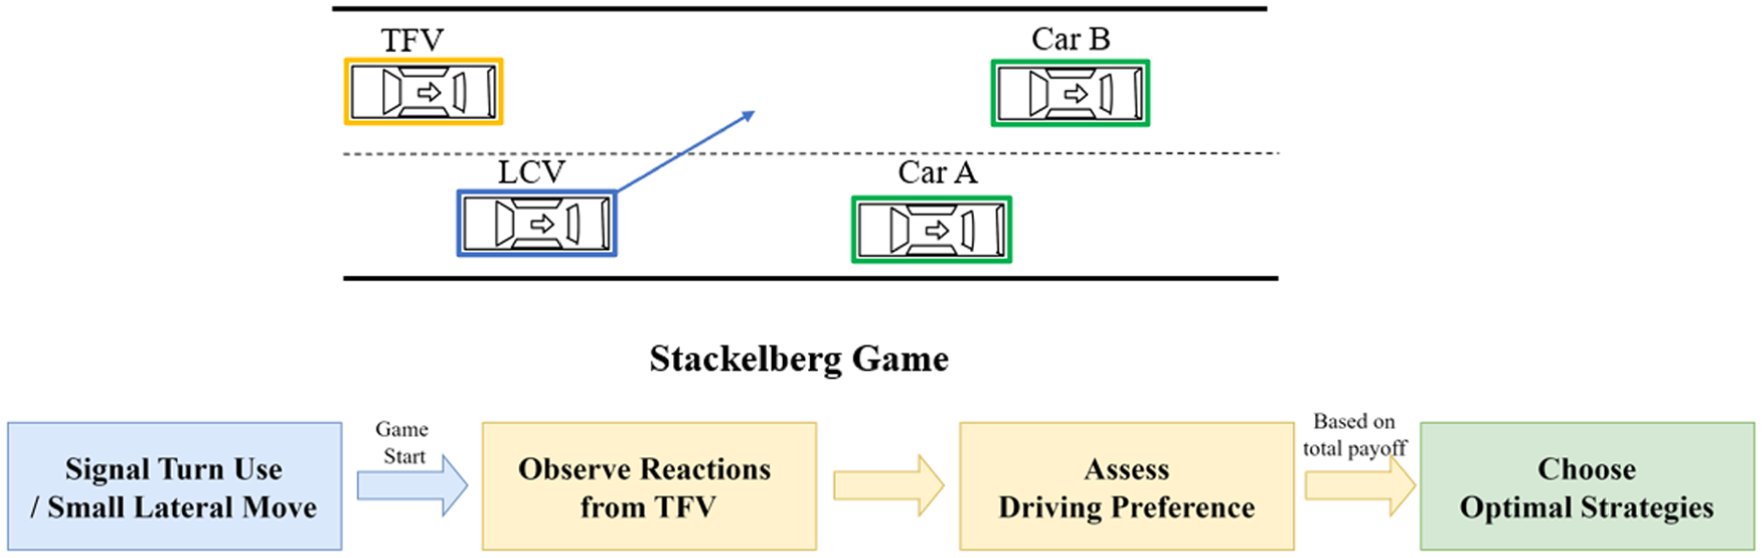
Core process of the Stackelberg game–based lane-change decision model.
Under the assumption of rational decision-making, both players are expected to choose strategies associated with higher payoff values. Accordingly, the LCV initiates a LC only when the lane-changing strategy yields the maximum payoff at the current time; otherwise, it remains in the current lane. If the LCV chooses to stay in the original lane, the game continues, and the LCV reassesses whether the subsequent time step represents a more suitable opportunity for lane changing. Once the LCV executes the lane-changing maneuver, the game is considered complete.
Game Payoff Function
Safety is one of the most important factors during lane-changing maneuvers. In addition, efficiency and comfort should also be considered to enable more realistic and reasonable decision-making. In this study, the total payoff is divided into three parts: safety payoff Us, efficiency payoff Ue, and comfort payoff P.
Safety Payoff
Us is defined as the change in safety level during the LC process between the previous time step and the current time step, as shown below:

where SLt is the safety level at time t, which is estimated using safety surrogate indicators.
Safety surrogate indicators can directly reveal the safety level during LC ( 32 ). In this study, the modified time to collision (MTTC) is adopted as the safety indicator, as it extends the traditional TTC by accounting for cases in which the following vehicle is moving slower than the leading vehicle ( 33 ). The MTTC is calculated as follows:


where
In this study, the desired MTTC is denoted as Tc, and the critical threshold value is set to 3 s ( 6 ). Accordingly, Tc is considered as:

where
The safety level of the vehicle at time t is then calculated as:

where
Efficiency Payoff
The efficiency payoff Ue measures the deviation between the actual speed and the desired speed ( 34 ). A Gaussian normalization function is adopted to smooth the formulation and better reflect realistic driving behavior.


where vt is the vehicle speed at time t,
The efficiency payoff approaches zero when the actual speed is significantly lower than the desired speed, indicating that the TFV is less likely to yield or create a gap for lane changing because of low efficiency gain. In contrast, when both vehicles can achieve speeds close to their desired values during the LC process, lane-changing maneuvers are more likely to occur.
Comfort Payoff
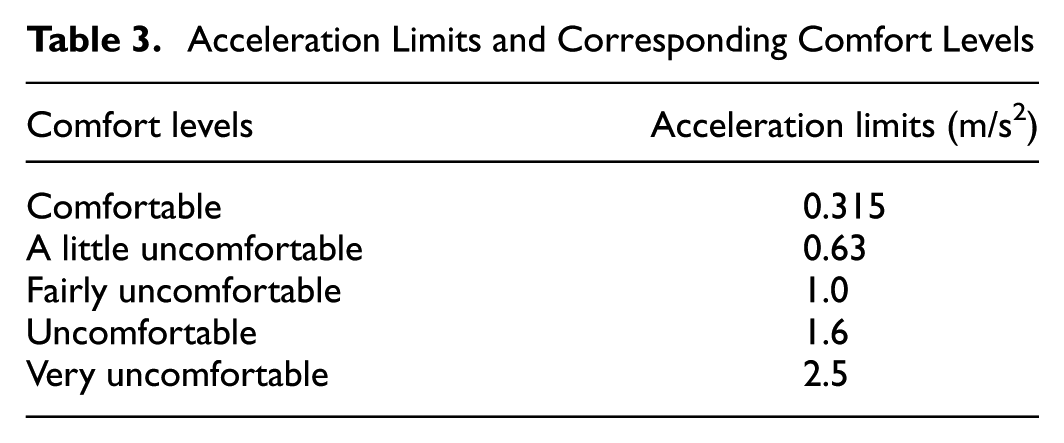
Passenger comfort is evaluated using vehicle acceleration as an indicator of ride quality. Based on ISO 2631-1, different acceleration ranges correspond to different levels of perceived comfort, as shown in Table 3. In this study, the absolute value of acceleration is used, regardless of whether it represents acceleration or deceleration. A comfort penalty term P is introduced into the total payoff function to capture discomfort effects. Instead of using a piecewise function, a logistic function is adopted to ensure a smooth and continuous formulation. By adjusting the parameter in the logistic function, the model ensures that when the absolute acceleration exceeds 1.0 m/s2, the comfort payoff gradually approaches 0. In this way, highly uncomfortable driving maneuvers are penalized and are less likely to be selected during the strategy optimization process.
Acceleration Limits and Corresponding Comfort Levels
Solution of the Game
The total payoff is composed of the three components described above and is given by:

where ∂ is the variable parameter based on the driving preference, which will be further discussed in Section Estimation of Driving Preference.
During LC process, the LCV and the TFV engage in a two-player Stackelberg game as described previously. However, in some cases, the optimal response of the follower is not unique ( 2 ). Therefore, the equilibrium of the game is defined as the strategy in which the leader (LCV) maximizes its payoff under the worst-case response of the follower (TFV). The solution is formulated as follows:

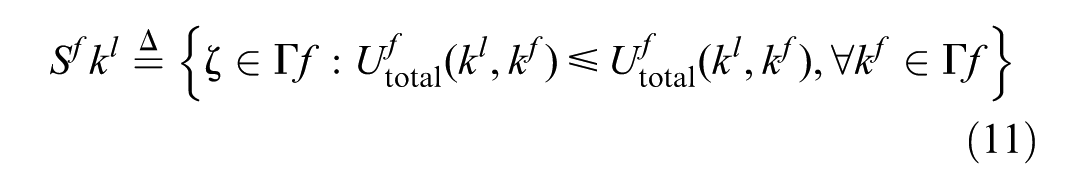
subject to:


where
Estimation of Driving Preference
Different drivers exhibit different driving preferences. It is generally assumed that drivers with more aggressive tendencies prioritize efficiency over safety, whereas cautious drivers place more emphasis on safety than efficiency ( 6 , 35 ). Vehicle acceleration can be used to characterize driving behavior and reflect driver-specific characteristics. In particular, more aggressive drivers tend to exhibit larger fluctuations in acceleration. Accordingly, in this study, the driving preference is defined as ∂, which represents the behavioral difference between drivers when interacting with human-driven vehicles. A smaller ∂ value indicates a stronger focus on efficiency rather than safety, and is therefore more likely to be associated with aggressive driving behavior.
In potential conflicting LC scenarios, acceleration behavior can be interpreted as an indicator of driving intent. Specifically, acceleration is associated with aggressive behavior when the TFV resists being cut in by the LCV during lane-changing maneuvers, whereas deceleration reflects a more conservative strategy that yields additional space for the LCV. Therefore, both the magnitude and direction (positive and negative) of acceleration are considered in estimating driving preference ∂, as shown in Figure 5. This differs from the comfort payoff formulation, where only the absolute value of acceleration is considered.
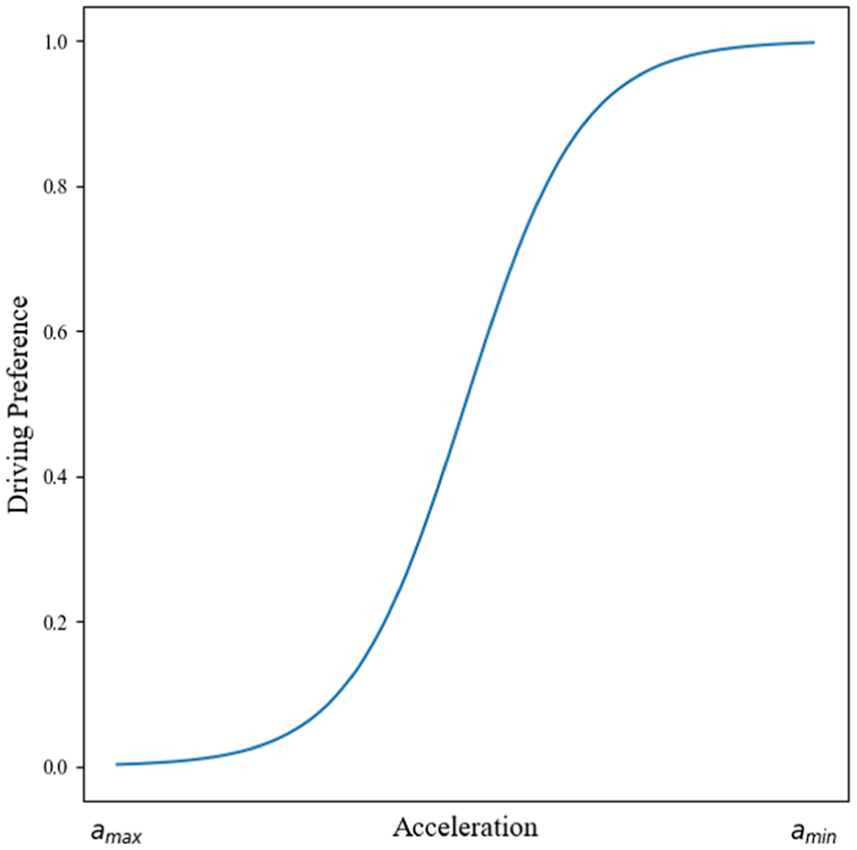
Estimation of driving preference.
At the beginning of the LC process, the LCV assumes that the TFV is driven by a normal driver with an initial driving preference of ∂ = 0.5. The LCV continuously updates
Results and Discussion
Simulation Setup
This section presents the testing results of the proposed LC decision model in a simulation environment. The simulations were conducted using Simulink, which supports the implementation and execution of MATLAB functions and scripts. The platform allows users to create road environments with customizable lane width and lane numbers, add traffic actors, and configure the mounting positions and specifications of sensors on the ego vehicle ( 36 ). Simulink provides powerful modeling and simulation capabilities and is particularly suitable for the integrated design of multi-domain systems. In addition, multiple toolboxes within Simulink support the development and evaluation of autonomous driving systems, including decision-making and control modules. Therefore, based on the Automated Driving Toolbox in Simulink, all potential conflicting LC scenarios were reproduced in the simulation environment.
Overall Simulation Results
A total of 81 potential conflicting LC events were simulated, and all AVs replacing the original LCVs successfully completed the lane-changing maneuvers within a limited time. Although no consensus has been reached in relation to the most suitable safety indicator for AV lane-changing scenarios, TTC was adopted in this study to evaluate the proposed model. The comparison between the original minimum TTC values and the simulated minimum TTC values was intended to verify the effectiveness of the model. In addition, a t-test of LC duration was conducted to determine whether the proposed model adopted overly conservative strategies during lane changing.
Overall, the distribution of minimum TTC values indicated that the simulated TTC values were generally higher than those observed in the original events, as shown in Figure 6. The 85th percentile was selected to compare the differences in minimum TTC. The results showed that the original minimum TTC was 2.71 s, whereas the simulated minimum TTC was 3.40 s, demonstrating that the proposed model was capable of alleviating conflict severity to some extent.
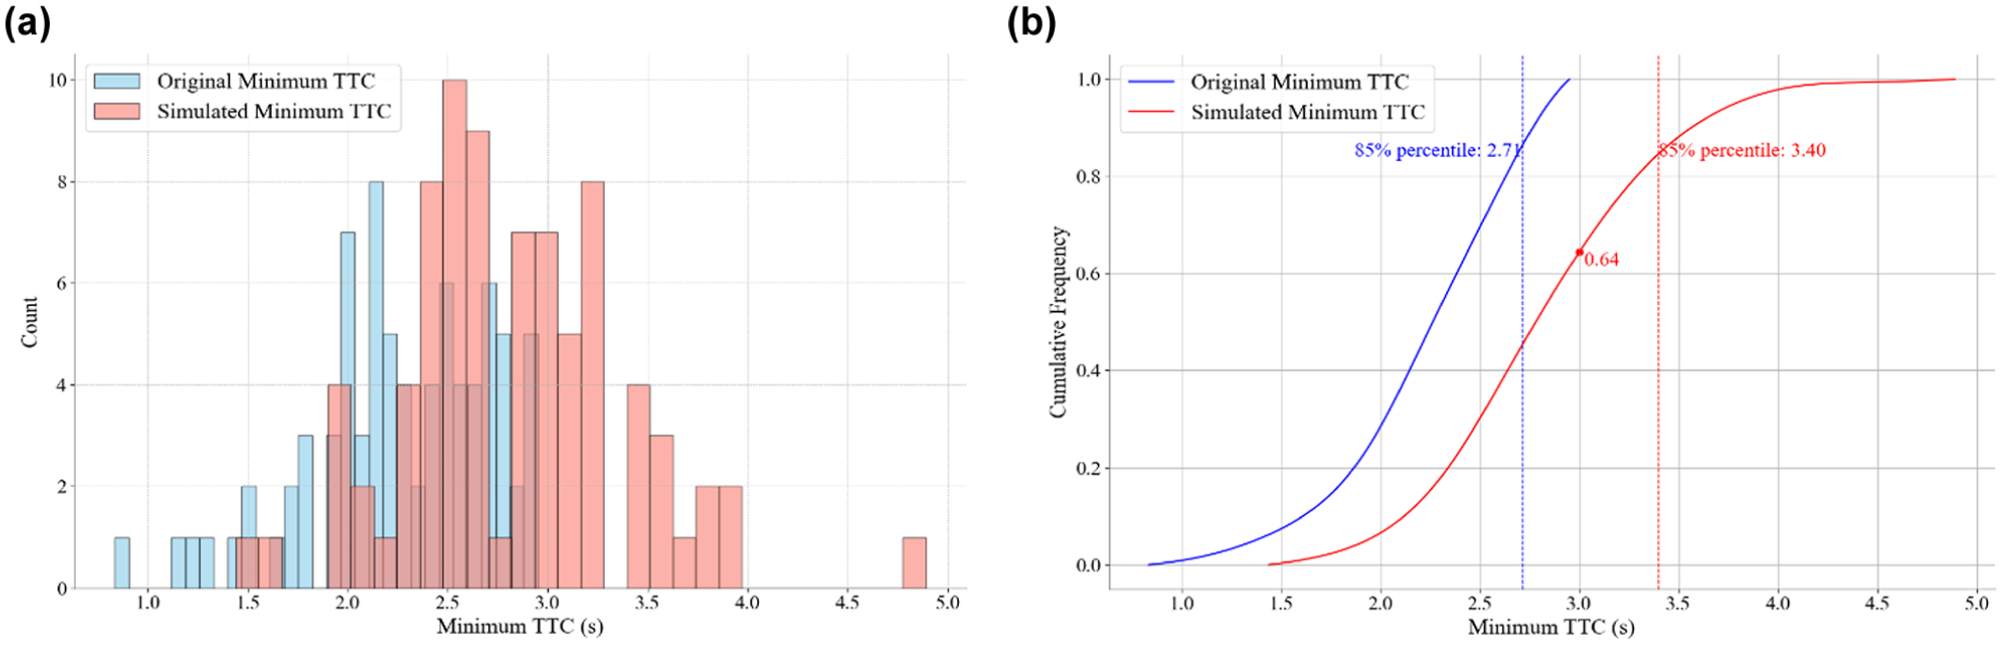
Comparison of minimum TTC between original and simulated trajectories. (a) Distribution of minimum TTC. (b) Cumulative frequency distribution of minimum TTC.
Based on the fitted cumulative distribution curve of simulated minimum TTC values, more than 30% of the potential conflicting LC events had a minimum TTC greater than 3 s after implementation of the proposed model, which can be regarded as relatively safe during the LC process ( 29 ). For the events in which the simulated minimum TTC remained below 2.0 s, the TTC had typically already reached a critical level at the beginning of the simulation.
The distribution of the original and simulated LC durations are illustrated in Figure 7. Among the candidate statistical models, the lognormal distribution demonstrated the best goodness-of-fit for both datasets, which is consistent with the findings reported by Wang et al. ( 31 ). Although the simulated LC durations were generally longer than the original durations, the observed fluctuations in duration were relatively small and considered acceptable. To further evaluate the difference, a t-test was conducted. The results showed a p-value of 0.45 and a 95% confidence interval ranging from −0.81 to 0.36 s, indicating that no statistically significant difference existed between the original and simulated LC durations.
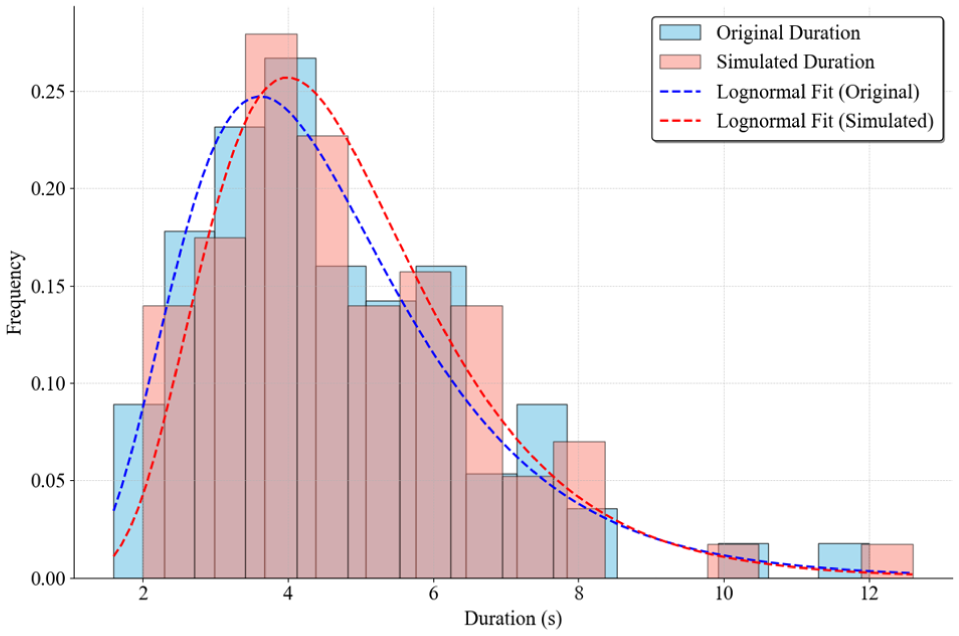
Comparison of LC duration between original and simulated trajectories.
Case Study
To further illustrate the proposed model, a typical cut-in event was selected as a case study for detailed analysis and discussion. The vehicle configuration was similar to that shown in Figure 1, in which the blue vehicle represents the LCV and the yellow vehicle represents the TFV. The actual LC situation and the initial conditions of both vehicles was shown in Table 4.
Initial Conditions of the Case Study
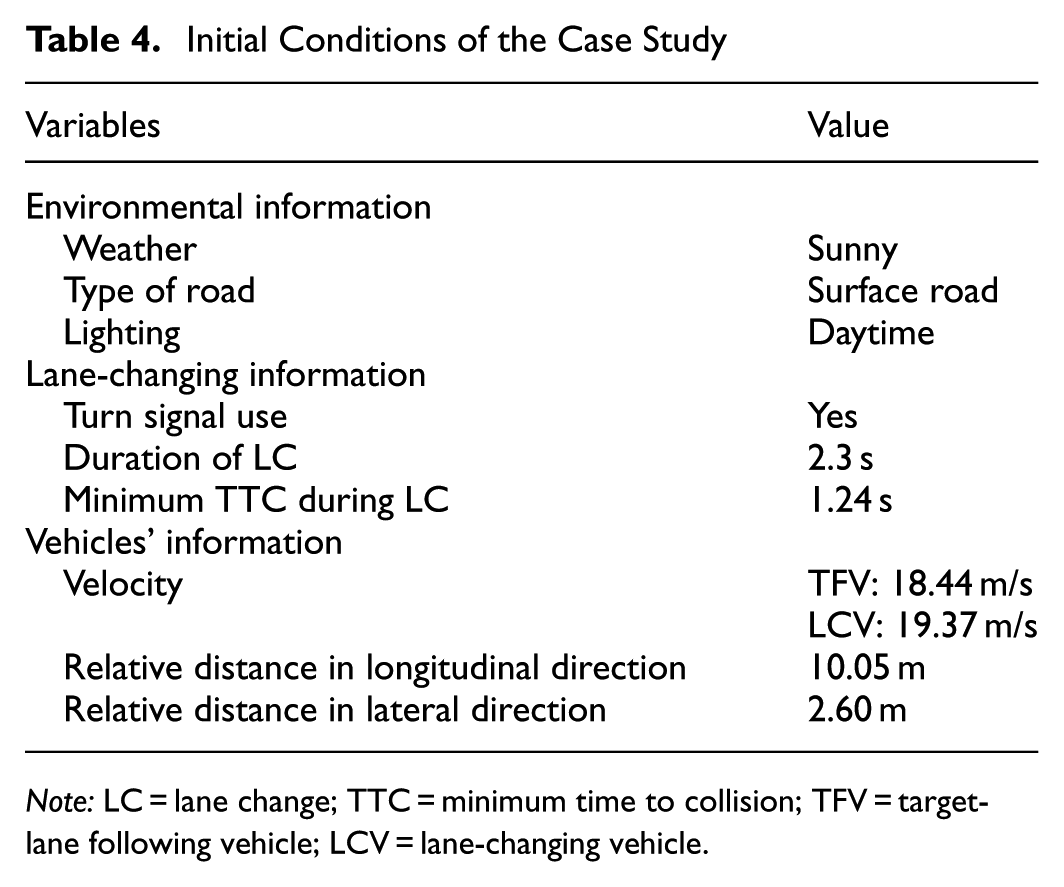
Note: LC = lane change; TTC = minimum time to collision; TFV = target-lane following vehicle; LCV = lane-changing vehicle.
Combined with manual video verification, the actual scenario was identified as follows: the TFV had just merged from the left lane, while the LCV intended to change lanes from the right lane. The original trajectory data indicated that the LCV initiated lateral movement and activated the turn signal approximately 0.4 s before crossing the lane centerline. Although the TFV began to decelerate and attempted to provide additional space for the LCV, the TTC between the two vehicles continued to decrease because of their initial speeds. The minimum TTC during the whole LC process was 1.24 s, which is substantially lower than the threshold typically considered safe for driving. Therefore, this cut-in event can be considered as a high-risk scenario and is suitable for evaluating the effectiveness of the proposed model.
In the simulation environment, the original trajectories of all vehicles were retained except for that of the original LCV, which as replaced by an AV controlled by the proposed game theory–based model. During the simulation, the AV also completed the lane-changing maneuver successfully. The TTC comparison between vehicles is presented in Figure 8, while the original and simulated speeds of the LCV are shown in Figure 9. In the figures, the blue lines represent the original trajectory data, and the red lines represent the simulated results.
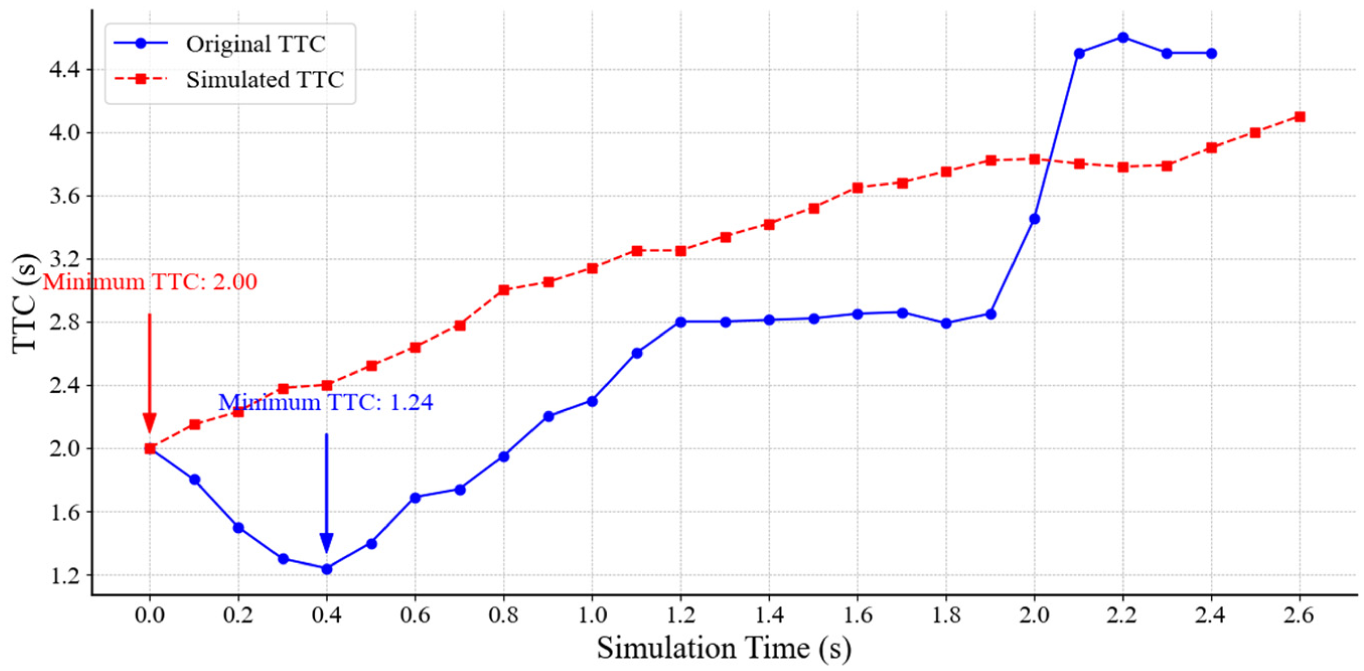
Comparison of TTC between the LCV and the TFV in the original and simulated trajectories.
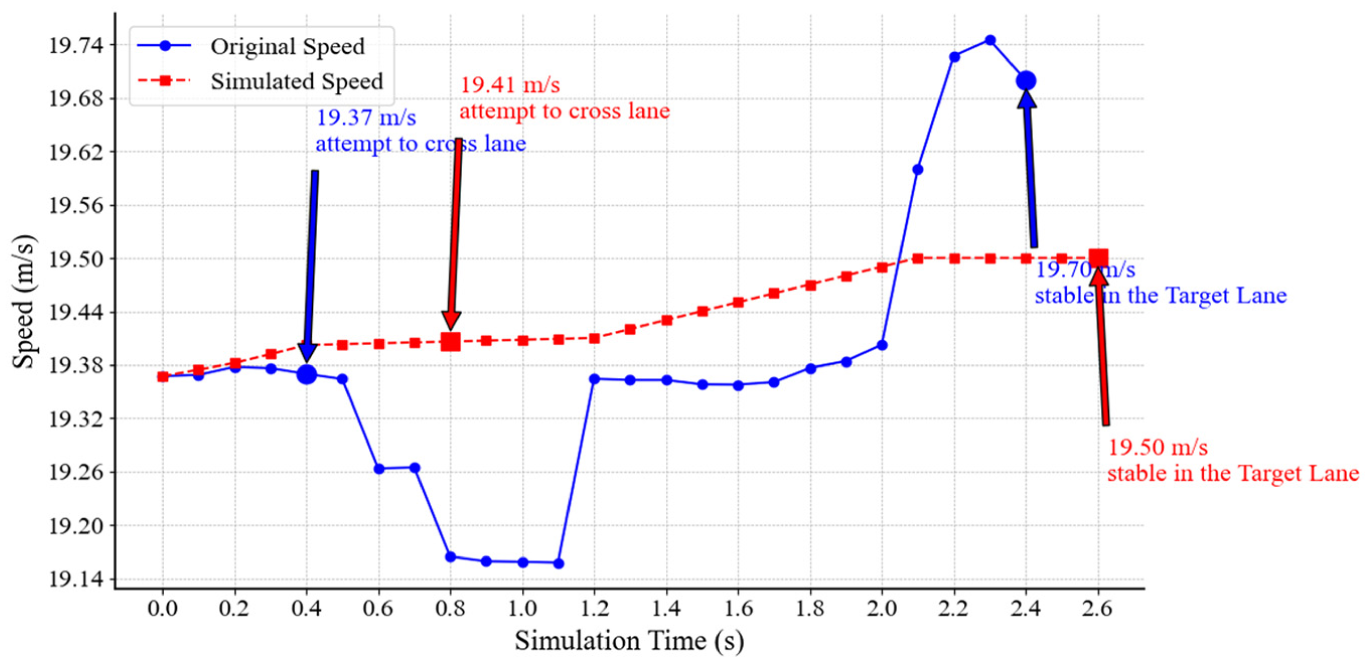
Comparison of LCV speed between the original and simulated trajectories.
As shown in Figure 8, the duration from the initiation of LC intention to the completion of the lane-changing maneuver was 2.4 s, and the minimum TTC reached 1.24 s at t = 0.4 s in the original trajectory. Based on the simulated data, the LCV completed the LC and stabilized in the target lane at t = 2.6 s. The slight difference of 0.2 s in LC duration indicates that traffic efficiency was not significantly affected in the simulation. Moreover, the minimum TTC in the simulated trajectory increased to 2.0 s. Throughout the entire LC process, the TTC did not decrease further, demonstrating a substantial improvement in lane-changing safety.
According to the original speed profile shown in Figure 9, the LCV adopted abrupt deceleration after attempting to cross the lane boundary at t = 0.4 s. Although the TFV also decelerated to provide additional space, the LCV was still forced to reduce its speed to avoid a potential collision because the deceleration of the TFV was insufficient, resulting in a minimum TTC of only 1.24 s. At t = 1.1 s, the LCV began to accelerate to complete the LC after the TFV had continuously decelerated and created sufficient space. Between t = 2 s and t = 2.4 s, the LCV accelerated again to compensate for the previous speed loss caused by inappropriate LC timing.
In contrast, in the simulated trajectory, the LCV delayed the initiation of lane crossing until t = 0.8 s. Furthermore, the LCV entered the target lane with nearly uniform acceleration rather than sudden acceleration or deceleration, thereby providing a more comfortable riding experience for passengers. At t = 2.6 s, the LCV stabilized in the target lane and completed the lane-changing maneuver. In addition, the fluctuation of the original and simulated speed profiles was compared using the mean absolute deviation (MAD). The results showed that the simulated speed profile was substantially smoother, with an MAD valueless than one-fifth of the original speed profile.
Top-view snapshots of the simulation at key time points are presented in Figure 10 and provide a direct illustration of the interaction process. The yellow vehicle represents the TFV, whereas the blue vehicle represents the LCV. The green lines indicate the optimal strategy, while the red lines represent unfavorable actions for the LCV according to the Stackelberg game framework. At t = 0.4 s, the TFV had not yet stabilized within the center of the lane because it had just merged from the left lane, whereas by t = 0.8 s, it had reached a stable position in the target lane. Therefore, initiating the lane-crossing maneuver at t = 0.8 s rather than at t = 0.4 s was a more reasonable decision.
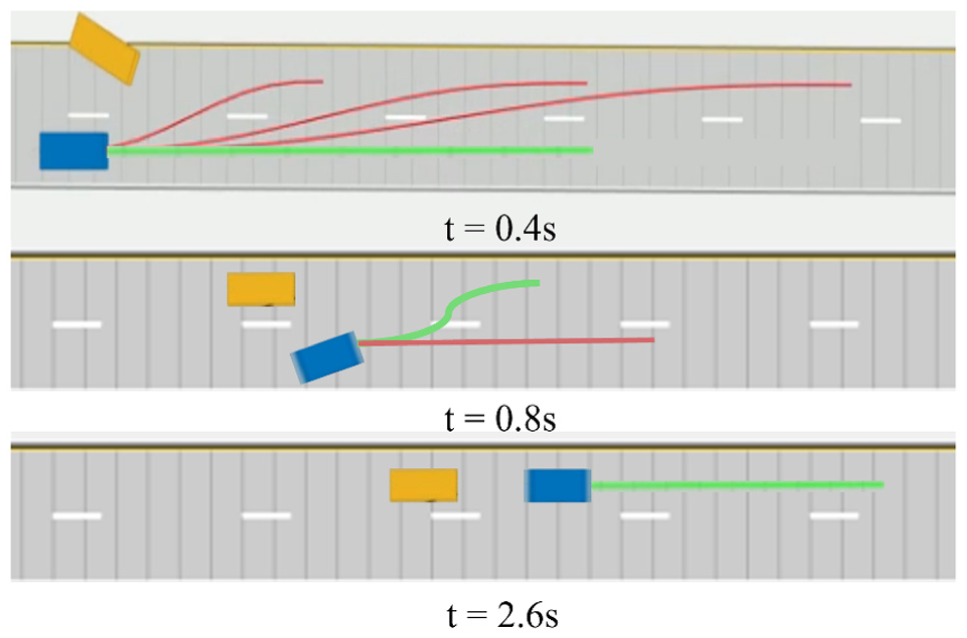
Top-view snapshots of the simulation at key time points.
Conclusions
This study proposed a game theory–based LC decision model for AVs. The total payoff function incorporated three aspects: safety, efficiency, and comfort. In addition, a dynamic parameter, referred to as driving preference, was introduced to better determine the weighting relationship between the safety payoff and efficiency payoff. Microscopic simulation were conducted to validate the effectiveness of the proposed model.
LC events were extracted from the SH-NDS database, and potential conflicting LC events were selected for simulation instead of relying on commonly used numerical data. Because of the sensors and cameras installed on the experimental vehicles in the SH-NDS, detailed trajectory information, including speed, acceleration, and relative distance in both longitudinal and lateral directions, was available for analysis.
To provide more reasonable decision-making for AVs during the LC process, the proposed model considered the total payoff from the perspectives of safety, efficiency, and comfort. The safety payoff was represented using the safety surrogate indicator MTTC, whereas the efficiency payoff was associated with deviations from the desired speed. The comfort component was formulated as a penalty term based on vehicle acceleration within the total payoff function. Furthermore, driving preference was incorporated to enable AVs to better interact with different types of human-driven vehicles.
A total of 81 potential conflicting LC events were simulated in Simulink. In the simulations, the original trajectories of the LCVs were replaced by AVs controlled by the proposed model. The results showed that all vehicles successfully changed lanes within a limited time. In addition, comparisons of minimum TTC and LC duration between the original and simulated trajectories indicated that the proposed model was capable of alleviating conflict severity to some extent while avoiding overly conservative strategies. A typical cut-in event was further analyzed to illustrate the simulation process in greater detail.
Several issues remain for future investigation. One potential extension of this research is to develop a multiplayer game framework, as leading vehicles in both the original and target lanes may also influence LC decision-making. In addition, future studies could further investigate the performance differences of the proposed model under various LC scenarios.
Footnotes
Author Contributions
The authors confirm contribution to the paper as follows: study conception and design: Shikun Liu and Xuesong Wang; data collection: Shikun Liu and Xuesong Wang; analysis and interpretation of results: Shikun Liu, Xuesong Wang, Junyi Zhang, Xiaolei Zhu, and Daiheng Ni; draft manuscript preparation: Shikun Liu, Xuesong Wang, Junyi Zhang and Fengchun Yang. All authors reviewed the results and approved the final version of the manuscript.
Declaration of Conflicting Interests
The authors declared the following potential conflicts of interest with respect to the research, authorship, and/or publication of this article: Xuesong Wang is a member of Transportation Research Record’s Editorial Board.
Funding
The authors disclosed receipt of the following financial support for the research, authorship, and/or publication of this article: This study was sponsored by the National Key R&D Program of China (2024YFE0115400).