
Abstract
Freight transportation is an important research topic in the transportation domain of high-income countries, but middle-income and low-income countries lack quality research on this, especially for heterogeneous roadway freight movement on narrower rural roads. This study addresses this issue in northern Bangladesh, analyzing the volume of five dedicated freight vehicle types across 1,162 roadway segments. A negative binomial generalized linear model (NB-GLM), along with a supporting negative binomial generalized additive model (NB-GAM), was found suitable to better explain the interrelation between freight volume and different predictors like area, population, household size, solvency rate, crest width, embankment height, and international roughness index. Freight movement was notably higher on market days. The NB-GLM highlighted significant linear effects of socioeconomic attributes, whereas the NB-GAM revealed strong nonlinear influences of roadway and spatial characteristics. Distinct variations were observed for predictor significance in statistical terms across different vehicle classes. These findings serve as a decision-support tool for policy makers wanting to implement targeted interventions, including temporal zoning, last-mile surface funds, and village freight consolidation hubs. The results provide a robust framework for predicting freight movements in regions with similar economic conditions, aiding in sustainable road network development and maintenance planning.
Keywords
Introduction
Freight transportation is a critical component of both national and global economies, playing a significant role in economic development, trade, and sustainability. It accounts for approximately 9.5% of the U.S. gross domestic product (GDP) and supports the import and export of about $3.6 trillion in international trade ( 1 ). The sector is also a major contributor to greenhouse gas emissions, responsible for about 8% of emissions in the United States and 41% of total transport emissions globally, necessitating efficient and sustainable management to meet environmental objectives ( 1 , 2 ). Freight transportation networks, characterized by their complexity and redundancy, are essential for ensuring resilience against disruptions, as demonstrated in studies of network redundancy and the impact of events like the COVID-19 pandemic ( 3 , 4 ). The design and operation of these networks require strategic decisions about service frequency, mode, and routing to maintain competitiveness and reliability in a highly competitive market ( 5 ). Furthermore, the development of logistics hubs and the consumption of industrial space are closely linked to freight activity, underscoring the importance of integrating transportation services with industrial planning ( 6 ). The future of freight transport is poised for transformation, driven by the need to reduce emissions and improve efficiency, with innovative concepts and technologies being explored to reconcile growth with environmental goals ( 7 ). Additionally, freight logistics can contribute to sustainability by internalizing externality costs, which may encourage shifts to more efficient modes like rail, potentially lowering overall freight costs ( 8 ). Overall, freight transportation is indispensable for economic growth and sustainability—not only in the Global North but also in low- and middle-income countries—requiring careful planning and innovation to address its environmental impact and enhance its efficiency and resilience ( 9 , 10 ). Although regional freight generation models can be found in academia in the context of emerging economic powerhouse like India ( 11 ), in the case of its neighbors, like Bangladesh, where the population is heavily dependent on the rural transportation system given its vast agricultural production zones, a research gap exists.
The study of rural roadway freight transportation is essential for understanding and enhancing the socioeconomic development of rural areas, particularly in low- and middle-income countries, where there are budget constraints. Rural roads are pivotal in improving access to local markets, which can significantly boost household incomes by facilitating the sale of agricultural products and the purchase of modern inputs such as modern agricultural tools and fertilizers, as demonstrated in studies from Ghana and Cambodia ( 12 , 13 ). These roads also play a vital role in achieving Sustainable Development Goals by linking rural communities to essential services such as education and healthcare, thereby contributing to broader socioeconomic benefits ( 14 ). The construction and maintenance of rural roads can lead to increased economic activity, as evidenced by the iRoad program in Sri Lanka, which showed enhanced local economic activity through improved road connectivity ( 15 ). However, the benefits of rural road investments are not uniformly distributed, often favoring those closer to the roads, which necessitates careful planning and optimization to ensure equitable access and benefits for remote populations ( 16 , 17 ). Furthermore, rural road infrastructure is integral to disaster resilience, as it reduces vulnerability to storm damage and facilitates efficient disaster relief efforts ( 18 ). In China, rural infrastructure, including roads, has been shown to drive economic development through improved living environment governance, highlighting the multifaceted impact of such investments ( 19 ). Despite these benefits, challenges remain, such as the need for sustainable maintenance practices and the integration of alternative fuels to mitigate the impact of fluctuating fuel prices on transportation costs ( 12 , 20 ). As freight vehicles contribute to heavy loadings of these roads, studies on freight vehicle demand and the number of vehicles counted on the roads can be particularly beneficial, especially for middle- or low-income countries, where budget constraints are a significant challenge.
By analyzing freight movements, particularly in rural areas, stakeholders can identify inefficiencies, enhance service delivery, and support policy making aimed at fostering sustainable rural development ( 21 ). Modeling freight counts plays a particularly crucial role in supporting targeted infrastructural developments in rural areas by providing insights into transportation patterns and optimizing resource allocation. For instance, the integration of weight-categorized truck flow data can identify high-demand zones for freight movement, thereby informing infrastructure investments that enhance connectivity and reduce inefficiencies, such as empty or partially loaded truck trips ( 22 ). Additionally, rural road optimization models, which consider both vehicular and walking access, ensure that even the most remote populations benefit from improved road networks, thus fostering economic growth and resilience ( 23 ). By integrating passenger and freight transportation, as proposed in the demand-driven service model, rural areas can achieve better vehicle capacity utilization and cost efficiency, ultimately supporting sustainable development ( 24 ). Collectively, these modeling approaches facilitate informed decision making that targets infrastructural improvements effectively in rural contexts ( 15 ). Again, improved road infrastructure can significantly enhance access to markets, thereby increasing the value of farmland and benefiting poorer households, although it may not sufficiently address income inequality ( 16 ). Additionally, understanding the speed behavior of freight vehicles under various road–weather conditions can inform the development of weather-responsive traffic management strategies, improving safety on rural highways ( 25 ). The analysis of traffic collisions on rural roads also highlights the need for targeted safety measures, as truck driving is associated with high accident rates ( 26 ). Moreover, optimizing rural road planning through multimodal travel models ensures that even remote populations benefit from new infrastructure, enhancing overall accessibility and economic opportunities ( 17 ). Finally, temporal analysis of crash factors in rural settings provides insights into evolving safety risks, enabling the development of more effective measures to reduce large-truck crashes ( 27 ).
This research initiative was thus undertaken to explore the determinants of freight vehicle movement in the rural areas of a lower-/middle-income country. Bangladesh, located in South Asia, was selected as the case study location. As budget constraints in middle- and low-income countries call for careful consideration when investing in freight transport-related infrastructural development (e.g., geometry and structural design of both paved and earthen roads, access roads to ferry and cargo boat jetties, approach roads to bridges, stop/resting locations for trucks, refueling station locations, weighing stations, road signage and markings), a comprehensive freight vehicle count model would be extremely useful for a country like Bangladesh. The main objective was to understand the interrelation between different types of freight vehicle count and several socioeconomic, spatial, and roadway-related variables using a robust modeling technique. A little research was found on freight transportation in Bangladesh (shipping and port-related studies were not considered here). One study developed an origin–destination synthesis model with mode choice for Bangladesh as part of developing a freight demand model for the country ( 28 ). Another research initiative studied the efficiency of rail freight transport in the country ( 29 ). Finally, two studies provide a detailed description of a novel method to build freight models in data-scarce regions like Bangladesh by combining optimal sampling planning and smart data collection (surveys of businesses) with advanced modeling to estimate freight flows, mode choices, and even empty trips for better policy planning ( 30 , 31 ). No other studies focusing on freight transportation in Bangladesh could be found.
Literature Review
Literature researching the interrelation between vehicle count and different socioeconomic, spatial, temporal, and infrastructure-related variables is widely available. However, very few studies address particular count models for freight vehicles only. Predicting rural freight vehicle count involves a variety of variables, as highlighted across multiple studies. Spatial variables are notably significant, with road characteristics and spatial autocorrelation playing crucial roles in traffic volume prediction models. For instance, spatial variables were identified as the most significant group in a study using a random forest algorithm for truck traffic volume prediction on Florida’s interstate highways, demonstrating the importance of spatial data in forecasting models ( 32 ). Similarly, spatial autocorrelation was found to be significant in zero-inflated negative binomial models for freight trip generation, emphasizing the need to consider spatial interactions in predictive models ( 33 ). The use of segment-based regression kriging has shown improved accuracy in predicting heavy vehicle traffic volumes by accounting for spatial characteristics and the homogeneity of road segments, which are crucial for understanding the impact of heavy vehicles on road maintenance ( 34 ). Economic development levels and the presence of large freight traffic generators (LTGs) also influence freight vehicle counts, as these factors are associated with higher freight demand and significant truck trips, respectively ( 35 ). Furthermore, the integration of spatiotemporal data, as seen in the TripCFDM (Trip-based Collective Flow Diffusion Model), enhances the estimation of freight trip distribution by utilizing aggregate data along with trip data, thereby improving the accuracy of intrazonal freight trip predictions ( 36 ). These studies collectively underscore the importance of incorporating spatial, economic, and infrastructural variables in models to accurately predict freight vehicle counts.
Traditional continuous dependent variable assumed regression models can be misleading in finding out the underlying interrelations between an integer count data and different factors. Whereas generalized linear models (GLMs) and generalized additive models (GAMs) are particularly useful for vehicle count data owing to their ability to handle complex data characteristics such as spatial clustering, nonlinear relationships, and overdispersion, which are common in traffic data. The negative binomial GAM (NB-GAM) model, for instance, effectively addresses these issues by incorporating a smooth spatial trend surface to control for spatial unobserved heterogeneity, which is crucial for accurate vehicle count predictions in regions with varying traffic patterns ( 37 ). This model’s flexibility in capturing nonlinear effects is beneficial in traffic scenarios where the relationship between traffic density and vehicle counts is nonlinear, such as the diminishing returns of agglomeration economies in highly dense areas ( 37 ). Furthermore, GAMs can be integrated with other methodologies to enhance vehicle count accuracy. For example, the use of deep-learning models for real-time vehicle detection and counting, as seen in various studies, can complement GAMs by providing high-precision data inputs. These models, such as those using YOLO (You Only Look Once) and deep convolutional neural networks, offer robust detection capabilities even under challenging conditions like low illumination or occlusion ( 38 – 40 ). Furthermore, the integration of machine learning techniques with GAMs can improve the reliability of vehicle count estimates by leveraging inexpensive and scalable data sources, such as Bluetooth sensors and probe vehicle data, which are crucial for real-time traffic management ( 41 ). Overall, the adaptability of GLMs and GAMs in incorporating spatial and temporal variations, along with their ability to integrate advanced detection technologies, makes them powerful tools for analyzing and predicting vehicle count data in complex traffic environments.
This research is thus novel in several ways. Firstly, it explores freight vehicle movement in the rural regions of Bangladesh; secondly, it considers several socioeconomic and roadway characteristics in understanding the freight vehicle count of a low-/middle-income country. Thirdly, it incorporates a combined analysis of regression-based NB-GLMs and NB-GAMs to accurately capture the underlying relation between the dependent variable and predictors. The findings could be beneficial in predicting freight vehicle movements in other regions of Bangladesh and even other countries with similar economic conditions, which in turn could help formulate policies like rural and semiurban road network development, maintenance, and environmental conservation, as freight vehicle movement is directly linked with those issues. The following sections will cover the methods employed and the data collected, the formal data analysis, and will discuss the results, concluding with an overview on future research directions.
Methods
Study Location and Data
Bangladesh, a South Asian country covering 147,570 km2, is bordered by India and shares a minor border with Myanmar. It lies adjacent to the Bay of Bengal and is characterized as a low-lying delta formed by major rivers, making it highly fertile yet flood-prone. The administrative structure consists of 8 divisions, 64 districts, 495 subdistricts (upazilas), and 4,554 unions, alongside 12 city corporations and 330 municipalities ( 42 , 43 ). Being one of the most densely populated countries globally, it has a population of approximately 164 million people, resulting in a density of 1,142 people per square kilometer ( 44 ). The country’s economy is predominantly agricultural, with agriculture employing a large portion of the labor force and contributing significantly to the gross national product ( 45 ). Despite this, Bangladesh faces challenges in food security, exacerbated by climate change and natural disasters, which frequently disrupt agricultural productivity ( 44 , 45 ). The GDP per capita has seen growth, increasing steadily from USD 203 in 1975 to USD 641 in 2010 and presently is around USD 2,700, yet it remains low compared with global averages. The spatial distribution of the economy of the country can be understood from the poverty distribution map of the country in Figure 1. Key agricultural activities include rice and fish production, with Bangladesh ranking fourth and sixth globally in these sectors, respectively. Industrial activities are centered around textiles, food manufacturing, and emerging sectors like basic metals and machinery, which are crucial for economic growth ( 46 ). The agricultural sector, however, faces constraints such as inadequate irrigation, input shortages, and climate impacts, which hinder productivity, especially in lagging regions ( 47 ). Addressing these challenges through improved agricultural practices and policy support is essential for sustainable development and economic growth in Bangladesh ( 46 ).
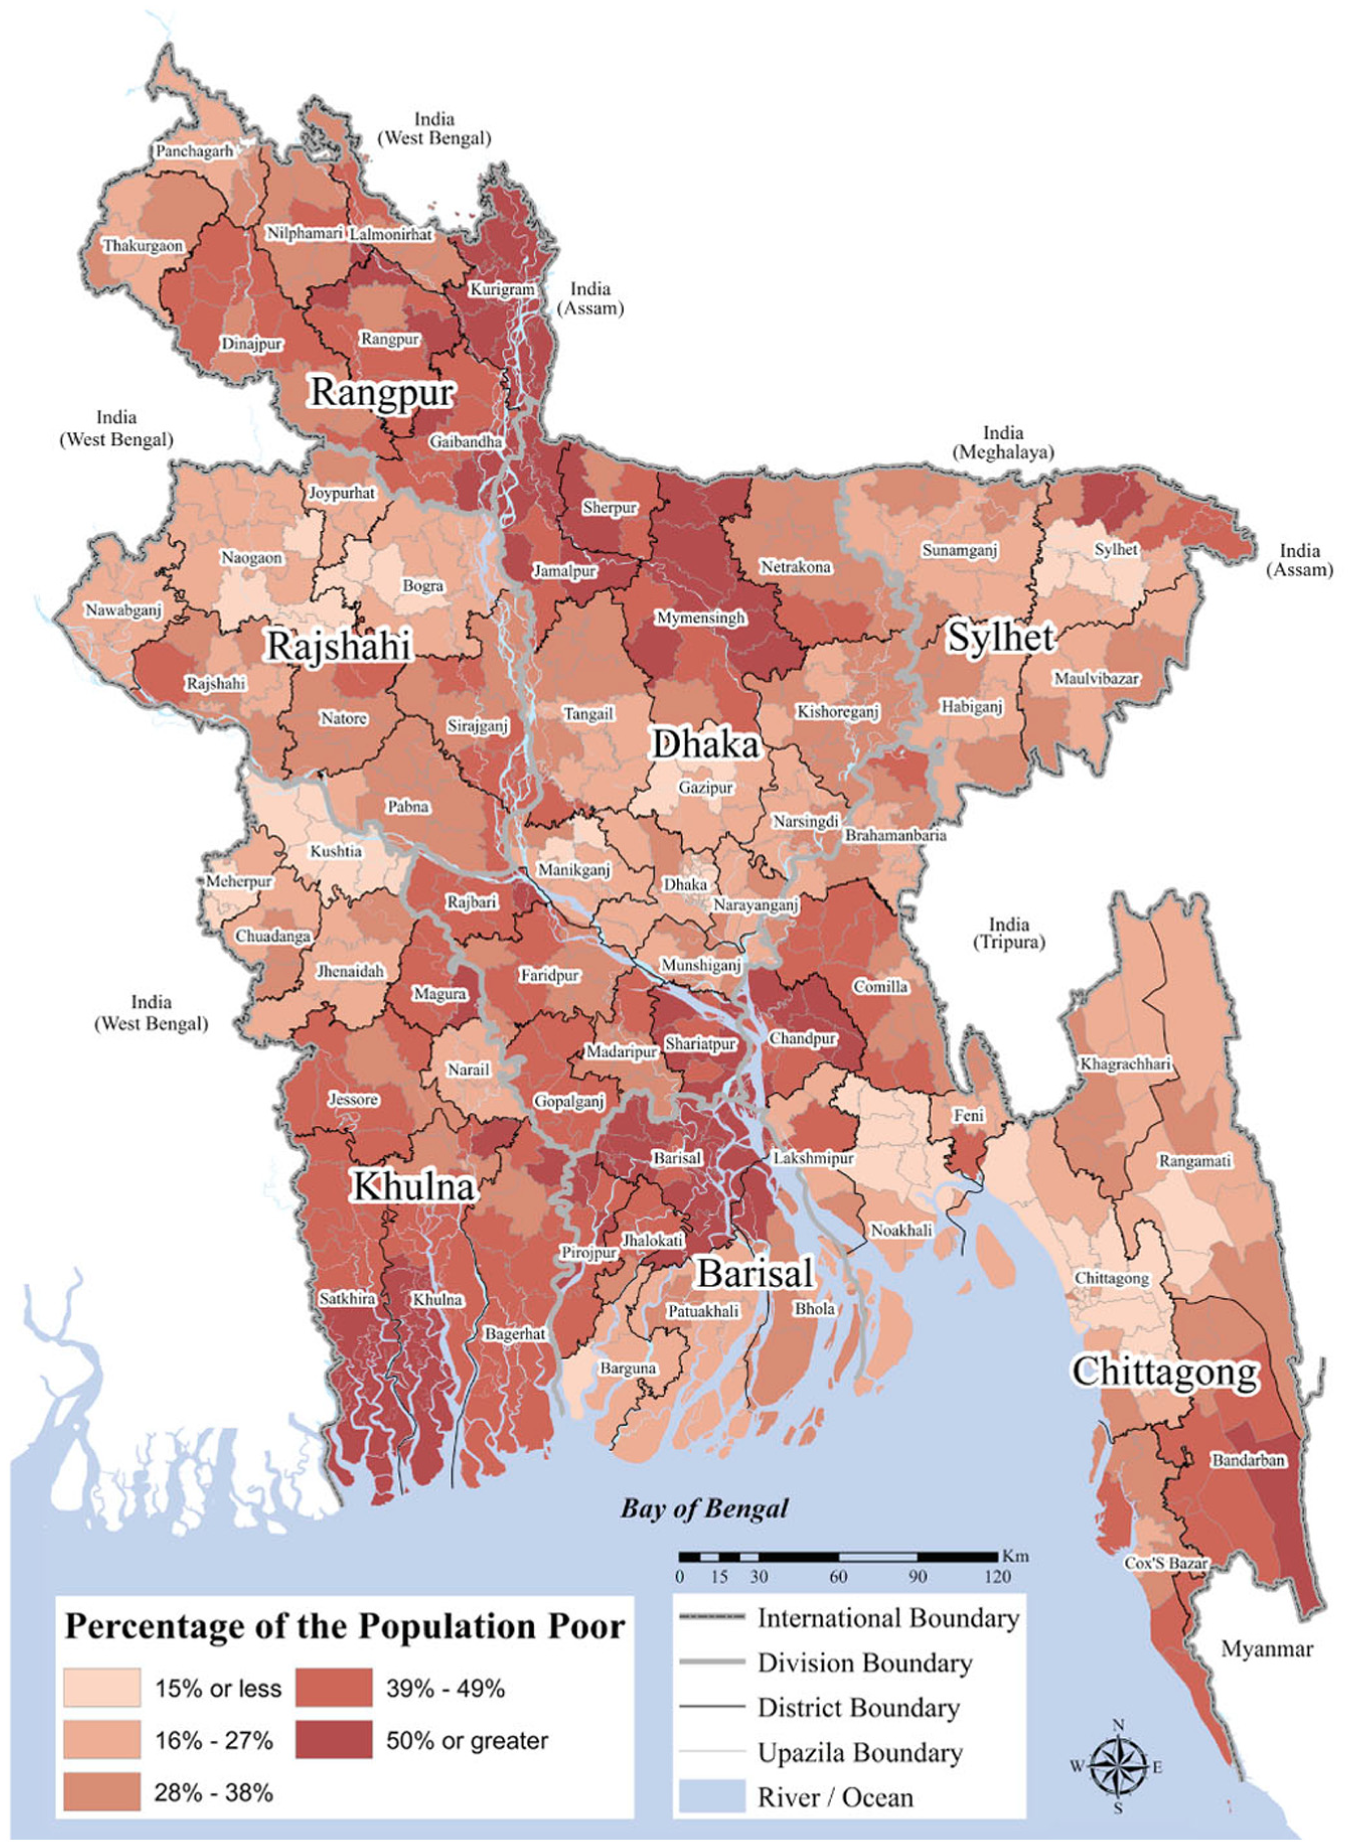
Poverty map of Bangladesh ( 48 ).
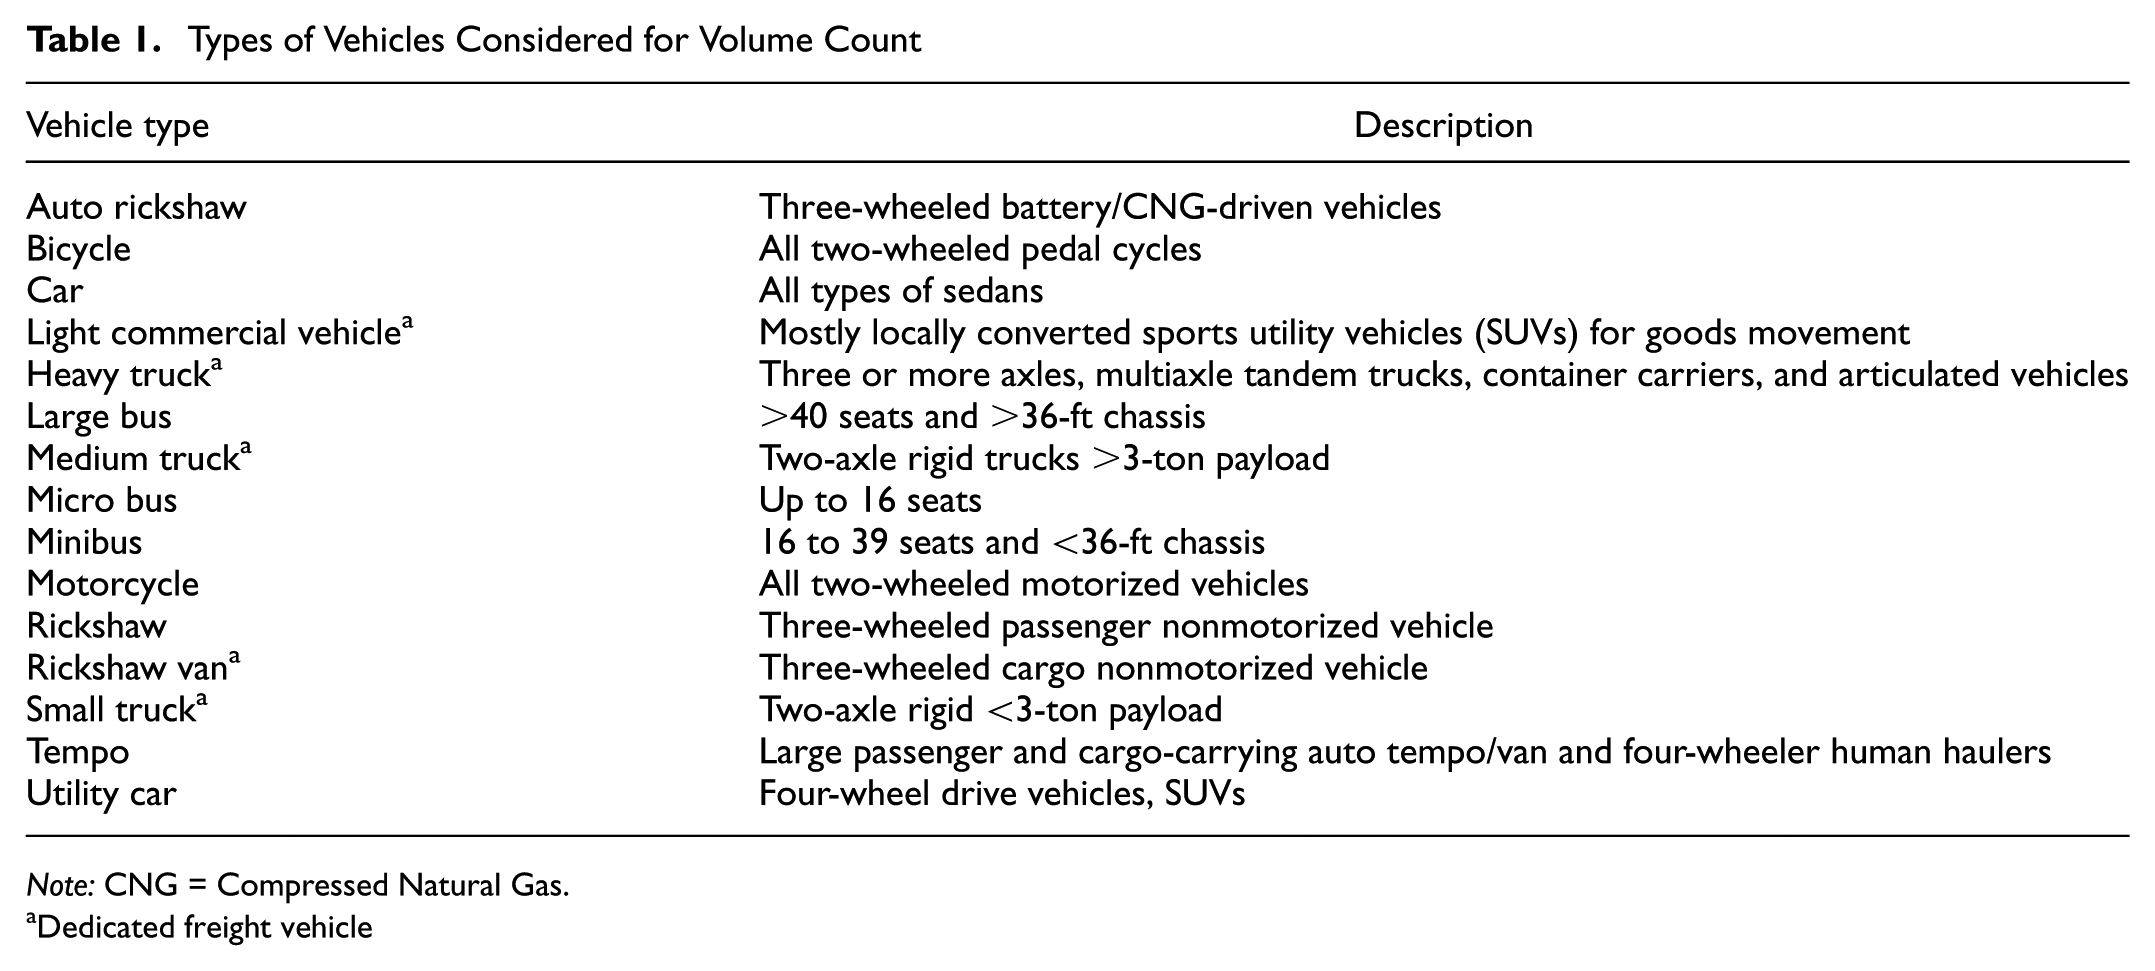
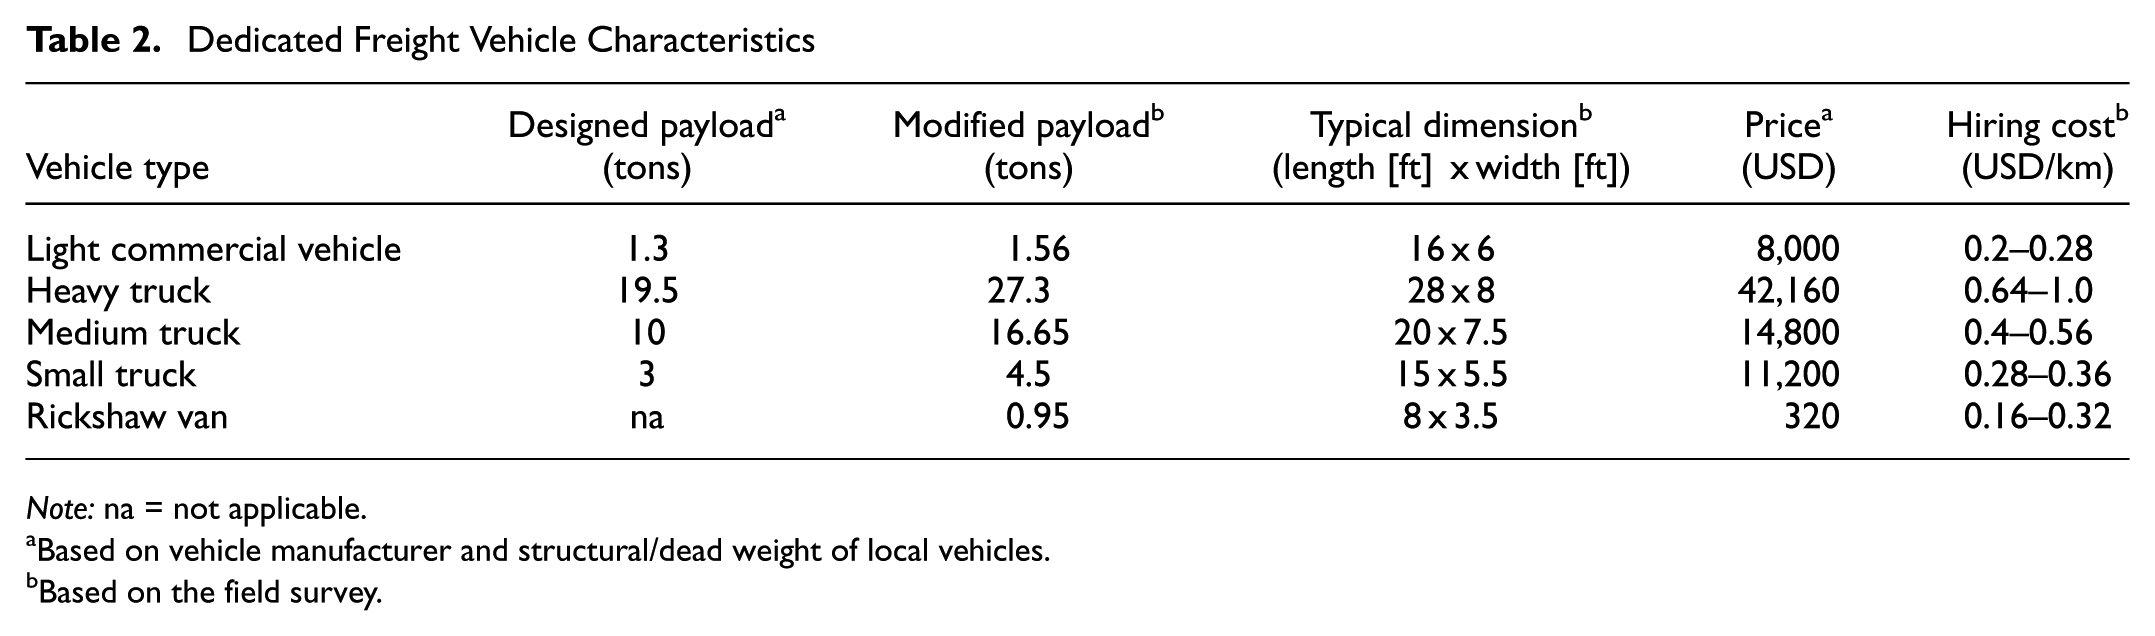
Bangladesh’s transportation system is a complex network that plays a crucial role in the country’s economic and social development. However, the system faces significant challenges, including congestion, inadequate infrastructure, and environmental concerns. Investments in the transportation sector have enhanced productivity and economic development, contributing significantly to GDP growth. The transport sector also plays a crucial role in enhancing exports, marketing agricultural goods, and boosting industrial production ( 49 ). Bangladesh faces severe transportation challenges as a result of rapid urbanization, high vehicular growth, and inadequate traffic management. These issues have led to significant congestion and environmental problems ( 50 ). The rural road network is predominantly administered by the Local Government Engineering Department (LGED). LGED oversees approximately 4,718 upazila roads (UZRs), which generally pass through and connect comparatively developed, dense rural areas, which have a wider crest width, that is the total top surface width of a roadway embankment, including driving lanes and shoulders (dimension not consistent for all UZRs, but the variations are minimal); 8,074 union roads (UNRs), which generally pass through and connect less dense rural areas that tend to be less economically developed and have a narrower crest width than UZRs (dimension not consistent for all UNRs but the variations are minimal); and 134,236 village roads (VRs). The vehicle count data utilized in this study were obtained from the Rural Connectivity Improvement Project of LGED, which is financially supported by the Asian Development Bank. An extensive analysis involving 30,000 road segments (UZRs, UNRs, and VRs), with a total span of 355,000 km, was performed as part of this project. The data collection process took place between 2023 and 2025. Classified vehicle count surveys at these segments were conducted manually, whereby enumerators recorded the presence of various vehicles from 7:00 a.m. to 7:00 p.m., on both market and nonmarket days. Market here refers to days of the week when, typically, vendors from the local and neighboring areas gather to sell their produce at wholesale and retail outlets. On these days, the market zones usually experience high vehicle traffic. The categories of vehicles surveyed, along with a brief description, are summarized in Table 1. Dedicated freight vehicle–related information can be found in Table 2 and a schematic illustration in Figure 2. The designed freight-vehicle payloads, dimensions, and purchasing costs in local markets of Bangladesh (including taxes) were obtained from the manufacturer’s manual and website. Modified payloads of all types of vehicles and the hiring cost of each class on a per-kilometer basis were determined by a field survey carried out at Tejgaon truck terminal. This survey included a short questionnaire (face-to-face) administered to three major freight service providers.
Types of Vehicles Considered for Volume Count
Note: CNG = Compressed Natural Gas.
Dedicated freight vehicle
Dedicated Freight Vehicle Characteristics
Note: na = not applicable.
Based on vehicle manufacturer and structural/dead weight of local vehicles.
Based on the field survey.

Dedicated freight vehicles.
The data acquisition process transpired between the years 2023 and 2025. Additional information incorporated variables such as the width of the roadway carriageway, the height of the embankment, and international roughness index (IRI) measurements. Given the extensive volume and heterogeneity of the data, northern Bangladesh was selected as the focal area for this investigation, specifically comprising one administrative division (Rangpur) out of the total eight divisions in the country (Figure 3). This geographical region is recognized for its significant productivity in agricultural and livestock outputs, thus enabling the research to derive insightful findings that can ultimately be contrasted with other regions across the nation. As per the LGED’s classification, this division is further partitioned into the Rangpur and Dinajpur regions. Within these two regions there are 8 districts and 57 Upazilas. For the purposes of this research, a total of 1,162 road segments with an aggregate length of 11,248 km were selected, based on their usability, of which 544 segments (with a total length of 4,186 km) are designated as UZRs, whereas 618 segments (with a total length of 3,331 km) are categorized as UNRs.
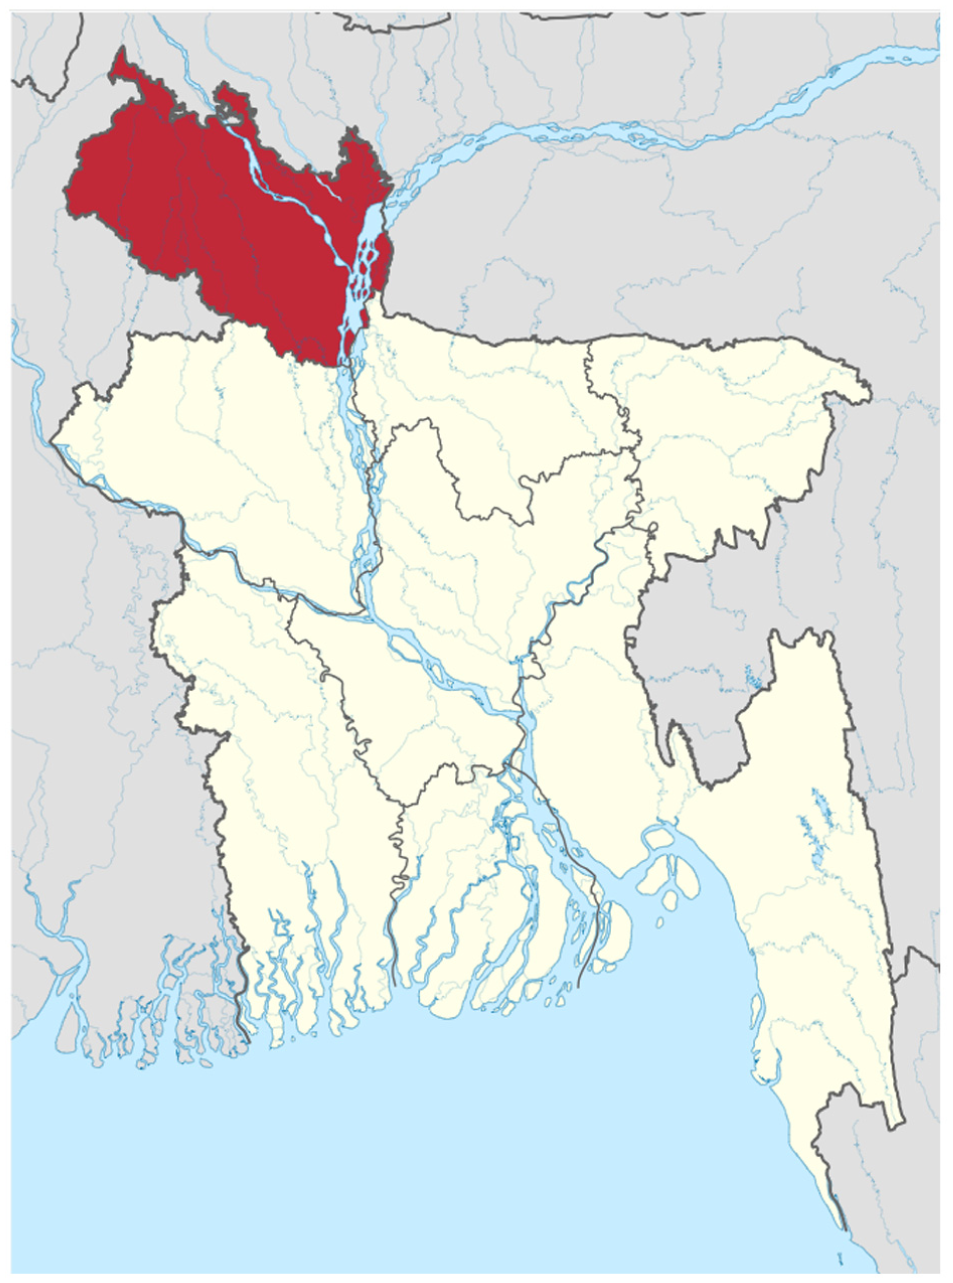
Study location (colored red within the map of Bangladesh) ( 51 ).
Model Structure
To understand the dynamics behind freight vehicle movement, several available variables were selected for testing. The predictor variables are listed in Table 3. Apart from LGED, several demographic, geographic, and economic data were collected from the Bangladesh Bureau of Statistics (a government agency responsible for surveying and storing national data of Bangladesh). The predicted variable or the vehicle count data per day is the number of vehicles passed through a selected roadway section on any given day in the study period. Data was collected on both market day and nonmarket day for the same roadway segments. The crest width (measured in meters and is the usable top width of roadway for vehicle movement and emergency stops) of the pavement can directly restrict access of wide-body vehicles and plays a crucial role in freight transportation; thus, it is included in the model. Embankment height (measured in meters) of roads in rural Bangladesh is associated with frequent upward and downward slopes, which prevent the usage of nonmotorized and heavily loaded freight vehicles in high roadway embankment-dominated areas. The variation of roadway embankment is high in Bangladesh in closely spaced areas because of the presence of many waterbodies compared to any other part of the world. The IRI value (the higher the value, the rougher the surface is) of the road indicates the roughness of the pavement surface, which in turn can indicate the extensive usage of heavy vehicles and unsuitable roads for lighter vehicles, especially nonmotorized ones. Market and nonmarket days show significant variations in roadway traffic in rural Bangladesh, which is why they are kept as a dummy variable in the model. As rural Bangladesh is dominated by two types of roadway standards according to LGED, the dummy UZR (Upazilla Road) variable is kept to check the variations in rural roadway freight traffic volume. In the context of predicting rural freight volume in Bangladesh at the Upazila level, several other geographic, demographic, and economic variables are essential because they collectively capture the region’s aggregate supply and demand dynamics, which are the core drivers of freight generation. Population (in numbers) and area (in square kilometers) are deliberately maintained as separate independent variables rather than combined into a density ratio (population per square kilometers) because they proxy for two fundamentally distinct economic drivers: population determines the scale of consumption demand (inbound freight for staples), whereas area, in a rural context, acts as a direct proxy for arable land availability and agricultural production capacity (outbound freight). Merging them into a density metric would conflate these effects and mathematically obscure the positive marginal impact of land size on freight generation. Complementing these, household size (number of people per family) is critical because large joint families in Bangladesh often function as consolidated economic production units, providing the labor force necessary to generate marketable agricultural surplus. Finally, Solvency and literacy rate serve as proxies for purchasing power and economic maturity; higher solvency drives can demand, for example, heavier non-food items like construction materials, while literacy correlates with the adoption of modern farming technologies, thereby increasing the density and commercial complexity of the freight network.
Variable Description
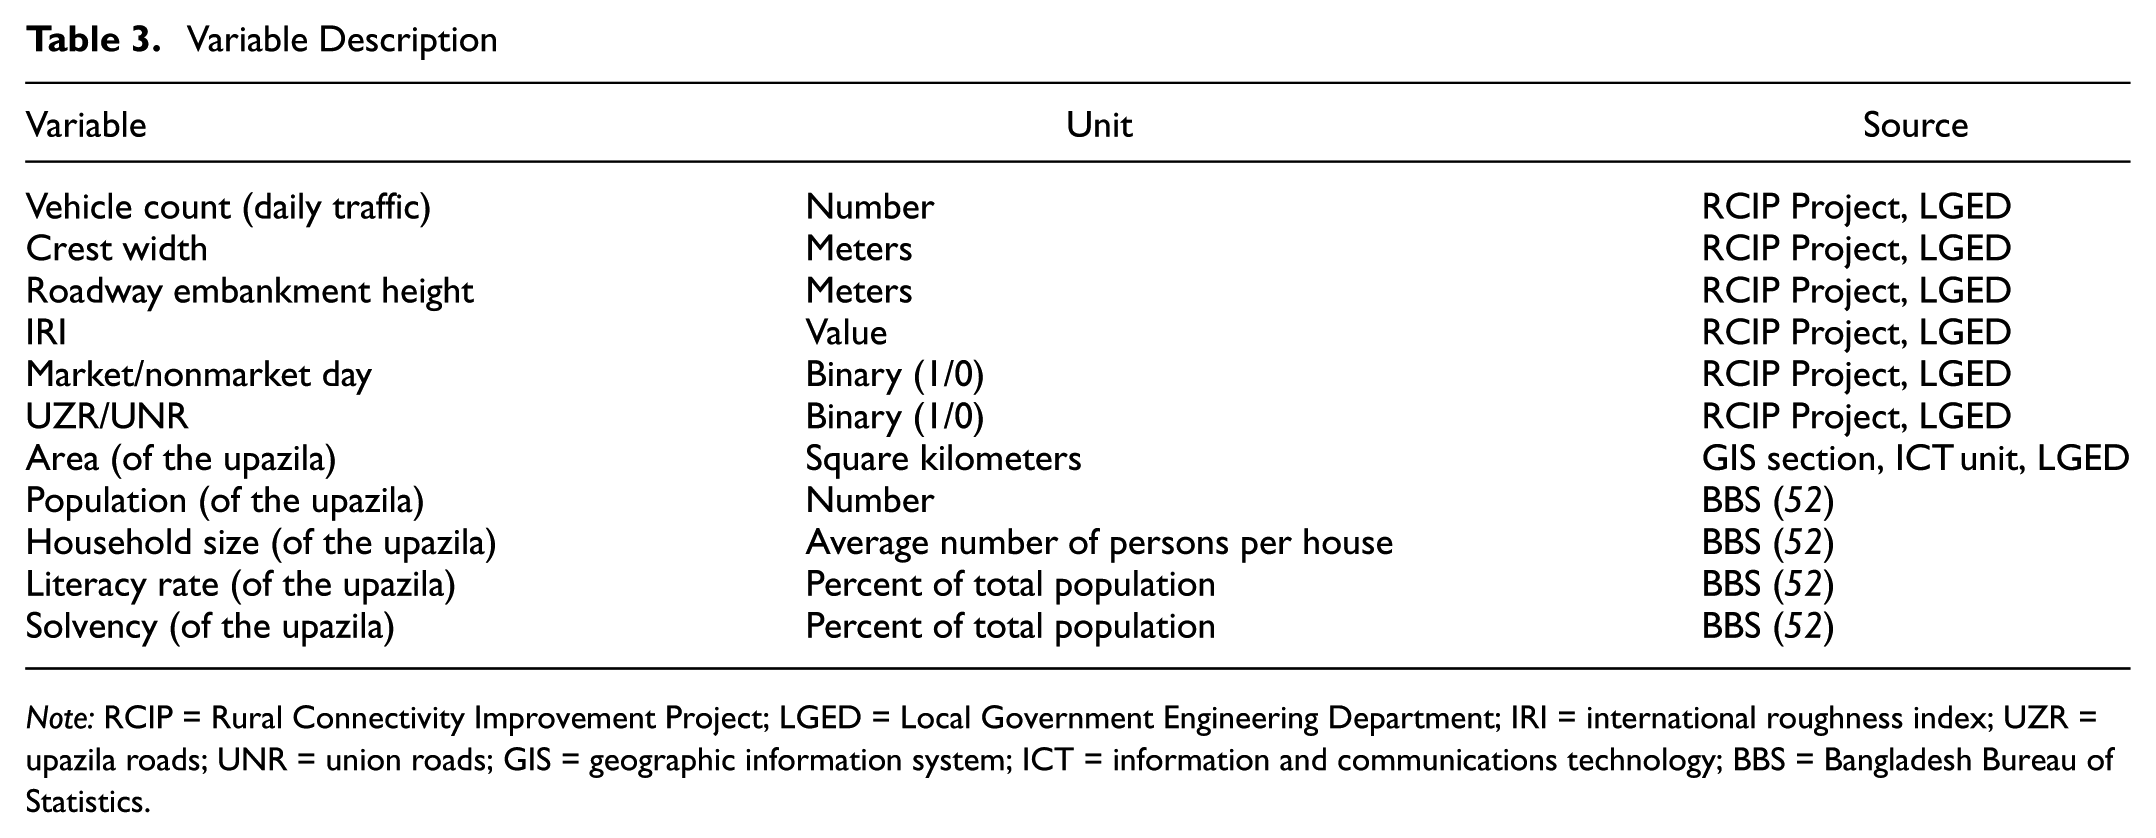
Note: RCIP = Rural Connectivity Improvement Project; LGED = Local Government Engineering Department; IRI = international roughness index; UZR = upazila roads; UNR = union roads; GIS = geographic information system; ICT = information and communications technology; BBS = Bangladesh Bureau of Statistics.
Vehicle counts were modeled separately using negative binomial GLMs (NB-GLMs) and NB-GAMs. Although multiple vehicle categories were observed on the same roadway segments, the counts were not compositional nor constrained to sum to a fixed total. Increases in one vehicle type did not automatically imply decreases in others, and multiple vehicle classes increased simultaneously in response to common demand factors. Shared influences were accounted for through common covariates, and the models assumed conditionally independent arrival processes. Therefore, separate count models were assumed to be methodologically appropriate and consistent. A multicollinearity analysis check was performed to strengthen this assumption and is shown in Figure S1 of the Appendix.
The modeling starts with testing the ordinary least squares (OLSs) regression. The general equation can be written as shown in Equation 1,

where
Market day/nonmarket day and UZR/UNR variables are coded as binary (market day = 1, UZR = 1, all else 0). Considering the count data type outcome variable, two different types of GLMs are considered. Firstly, the Poisson regression-based (with log link) and secondly, the negative binomial regression-based approach. The Poisson GLM for traffic counts of vehicle type,

where
Here, the log link function ensures that the linear predictor is mapped to a strictly positive expected count. The NB-GLM approach can be expressed by Equation 3 (basically, the main equation is the same as Equation 2),

where

where
Results
The summary statistics of the data can be found in Table 4. Considerable variation existed across districts, with Dinajpur reporting the longest network (1,787 km) and the highest traffic volumes, whereas Kurigram had the shortest network (644 km) and correspondingly lower volumes.
Summary Statistics of Data
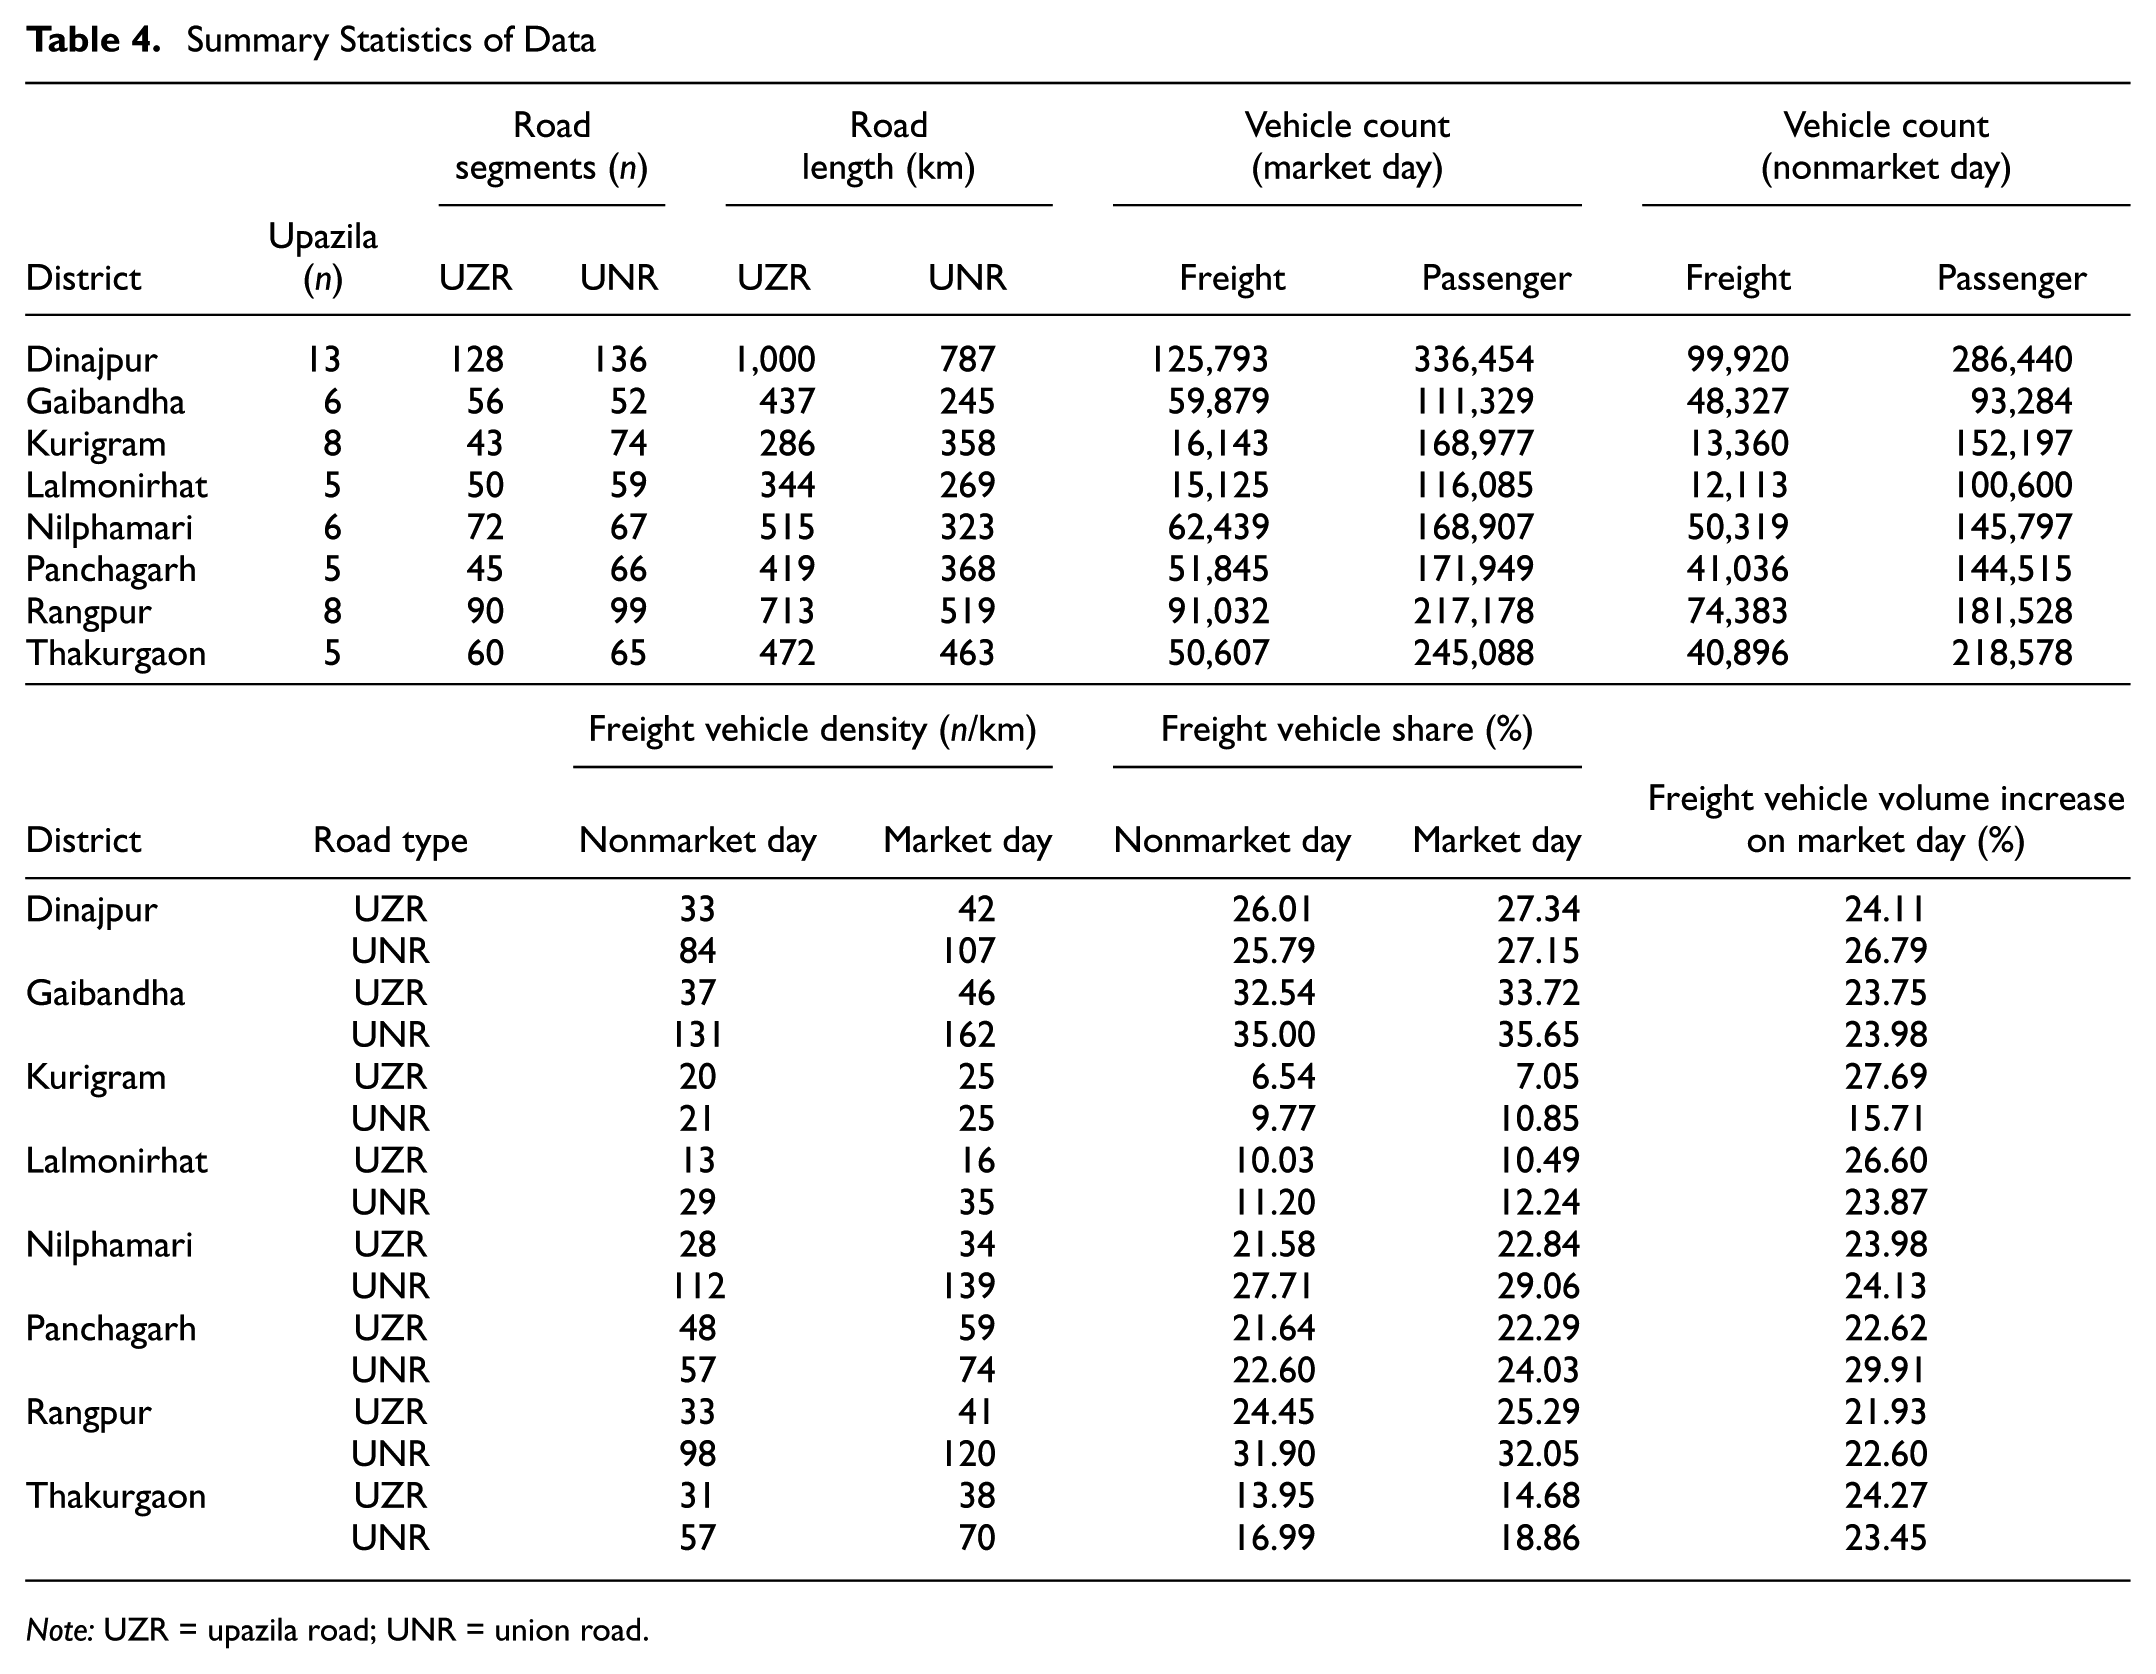
Note: UZR = upazila road; UNR = union road.
Traffic volumes, expressed as vehicle count per day, demonstrated a marked distinction between freight and passenger movement, and between market and nonmarket days. Passenger traffic dominated across all districts, with Dinajpur, Rangpur, and Thakurgaon showing the heaviest flows, often exceeding 200,000 passenger vehicles per day on market days. Freight traffic, although comparatively smaller, showed substantial sensitivity to market days. For instance, Dinajpur recorded nearly 126,000 freight vehicles on market days, compared with 99,920 on nonmarket days, reflecting a notable increase of around 24%. This pattern was consistent across districts, indicating that freight activity was significantly elevated during market days. The density and share of freight vehicles further highlighted spatial and temporal differences. On UZRs, freight vehicle density generally ranged between 13 and 48 vehicles per kilometer on nonmarket days and rose to between 16 and 59 vehicles per kilometer on market days. On UNRs, density was much higher, with several districts such as Gaibandha and Nilphamari exceeding 100 vehicles per kilometer. Correspondingly, freight share in total traffic was slightly higher on UNRs compared with UZRs across most districts.
Firstly, a correlation analysis was run to check for multicollinearity: area and population were found to be highly correlated (Figure 4). As a result, the population variable was removed (household size was kept as a proxy for this demographic characteristic). The counterintuitive results from the correlation matrix, such as in the pairing of literacy rate and solvency, reflected the decoupling of formal education from traditional rural wealth in Bangladesh. Although solvency is often derived from ancestral land ownership and agricultural output, higher literacy is frequently concentrated among younger generations transitioning into the service sector, who may not yet possess significant land-based assets. Again, the negative correlation between population and house size accurately captured the spatial demographic transition. High-population hubs and growth centers in rural Bangladesh typically favored nuclear family structures, whereas larger, extended families remained the norm in lower-population, remote agricultural zones to meet manual labor requirements for farming.
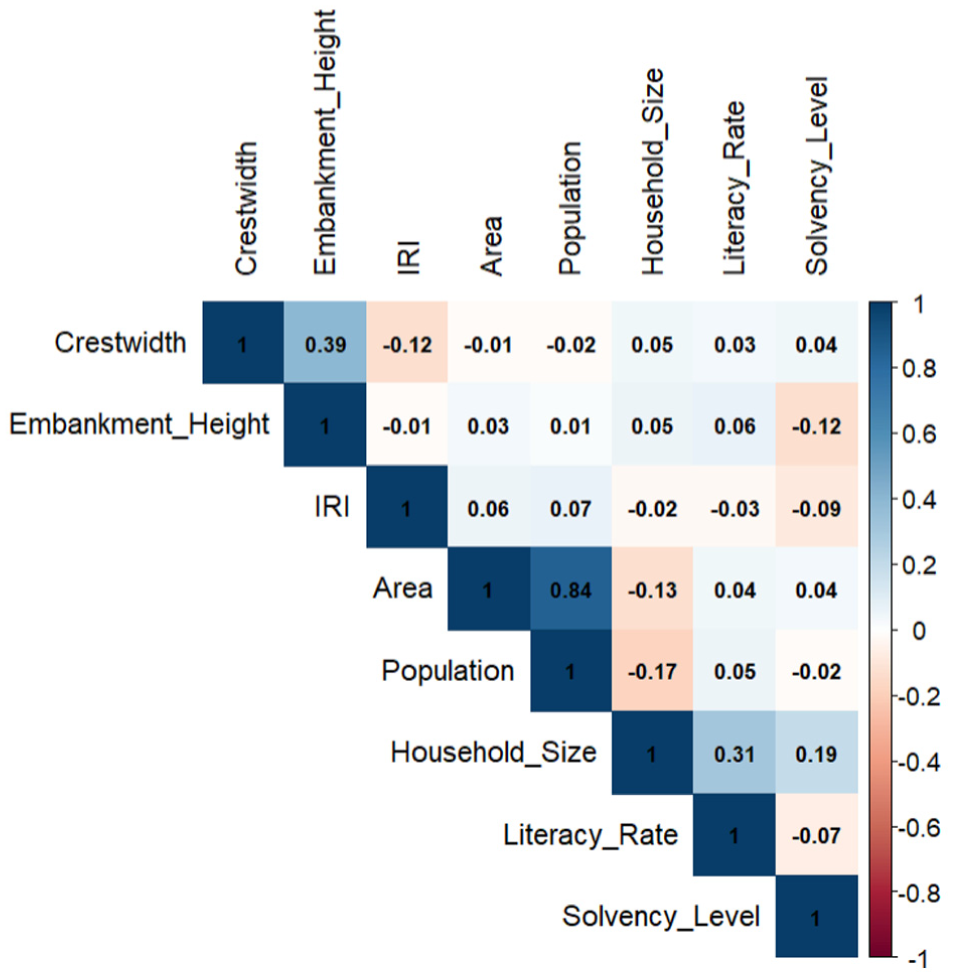
Correlation matrix.
Model comparison across OLSs, Poisson GLM, NB-GLM, and NB-GAM frameworks revealed a consistent advantage of NB-GAMs for all vehicle categories (Table 5). The Poisson GLMs, although producing relatively high pseudo-R2 and Nagelkerke values, were characterized by extreme overdispersion, with dispersion ratios exceeding acceptable limits (e.g., 49.97 for light commercial vehicles, 182.87 for rickshaw vans, and 50.96 for small trucks). This systematic inflation confirmed the unsuitability of the Poisson assumption given the overdispersed nature of the count data. OLS regressions achieved modest R2 values (0.12 to 0.20), but these models were not theoretically appropriate for discrete, skewed count outcomes and failed to provide dispersion metrics or explain deviance. NB-GLMs improved dispersion control (close to 1.0 across all vehicles), but they exhibited low explanatory power, with pseudo-R2 values near zero (0.02 to 0.04) and very limited deviance explained (≤0.22). By contrast, the NB-GAM consistently balanced goodness-of-fit and parsimony. AIC values were consistently lower than Poisson GLMs and comparable to or slightly better than NB-GLMs, while simultaneously yielding higher values for deviance explained (ranging from 0.28 for heavy trucks to 0.38 for rickshaw vans and 0.37 for light commercial vehicles). In addition, the use of smooth terms enabled NB-GAMs to capture nonlinear effects in infrastructural and socioeconomic predictors. Dispersion values across NB-GLMs and NB-GAMs remained close to unity, demonstrating a well-calibrated variance structure. Although pseudo-R2 values were occasionally negative (rickshaw van, small truck), this could be attributed to penalization effects and did not outweigh the consistently superior deviance explained and dispersion control. Taken together, the performance indicators justified the choice of NB-GAM as the most suitable framework for modeling vehicle counts. It successfully addressed the overdispersion problems inherent in Poisson GLMs, outperformed OLS in explanatory adequacy, and improved on NB-GLMs by accommodating nonlinearities while maintaining appropriate dispersion. Thus, NB-GAM offered the most reliable and interpretable balance of model fit, variance control, and explanatory capability across all vehicle categories. Observed versus predicted counts for different NB-GAMs can be found in Figure 5.
Model Performance Analysis
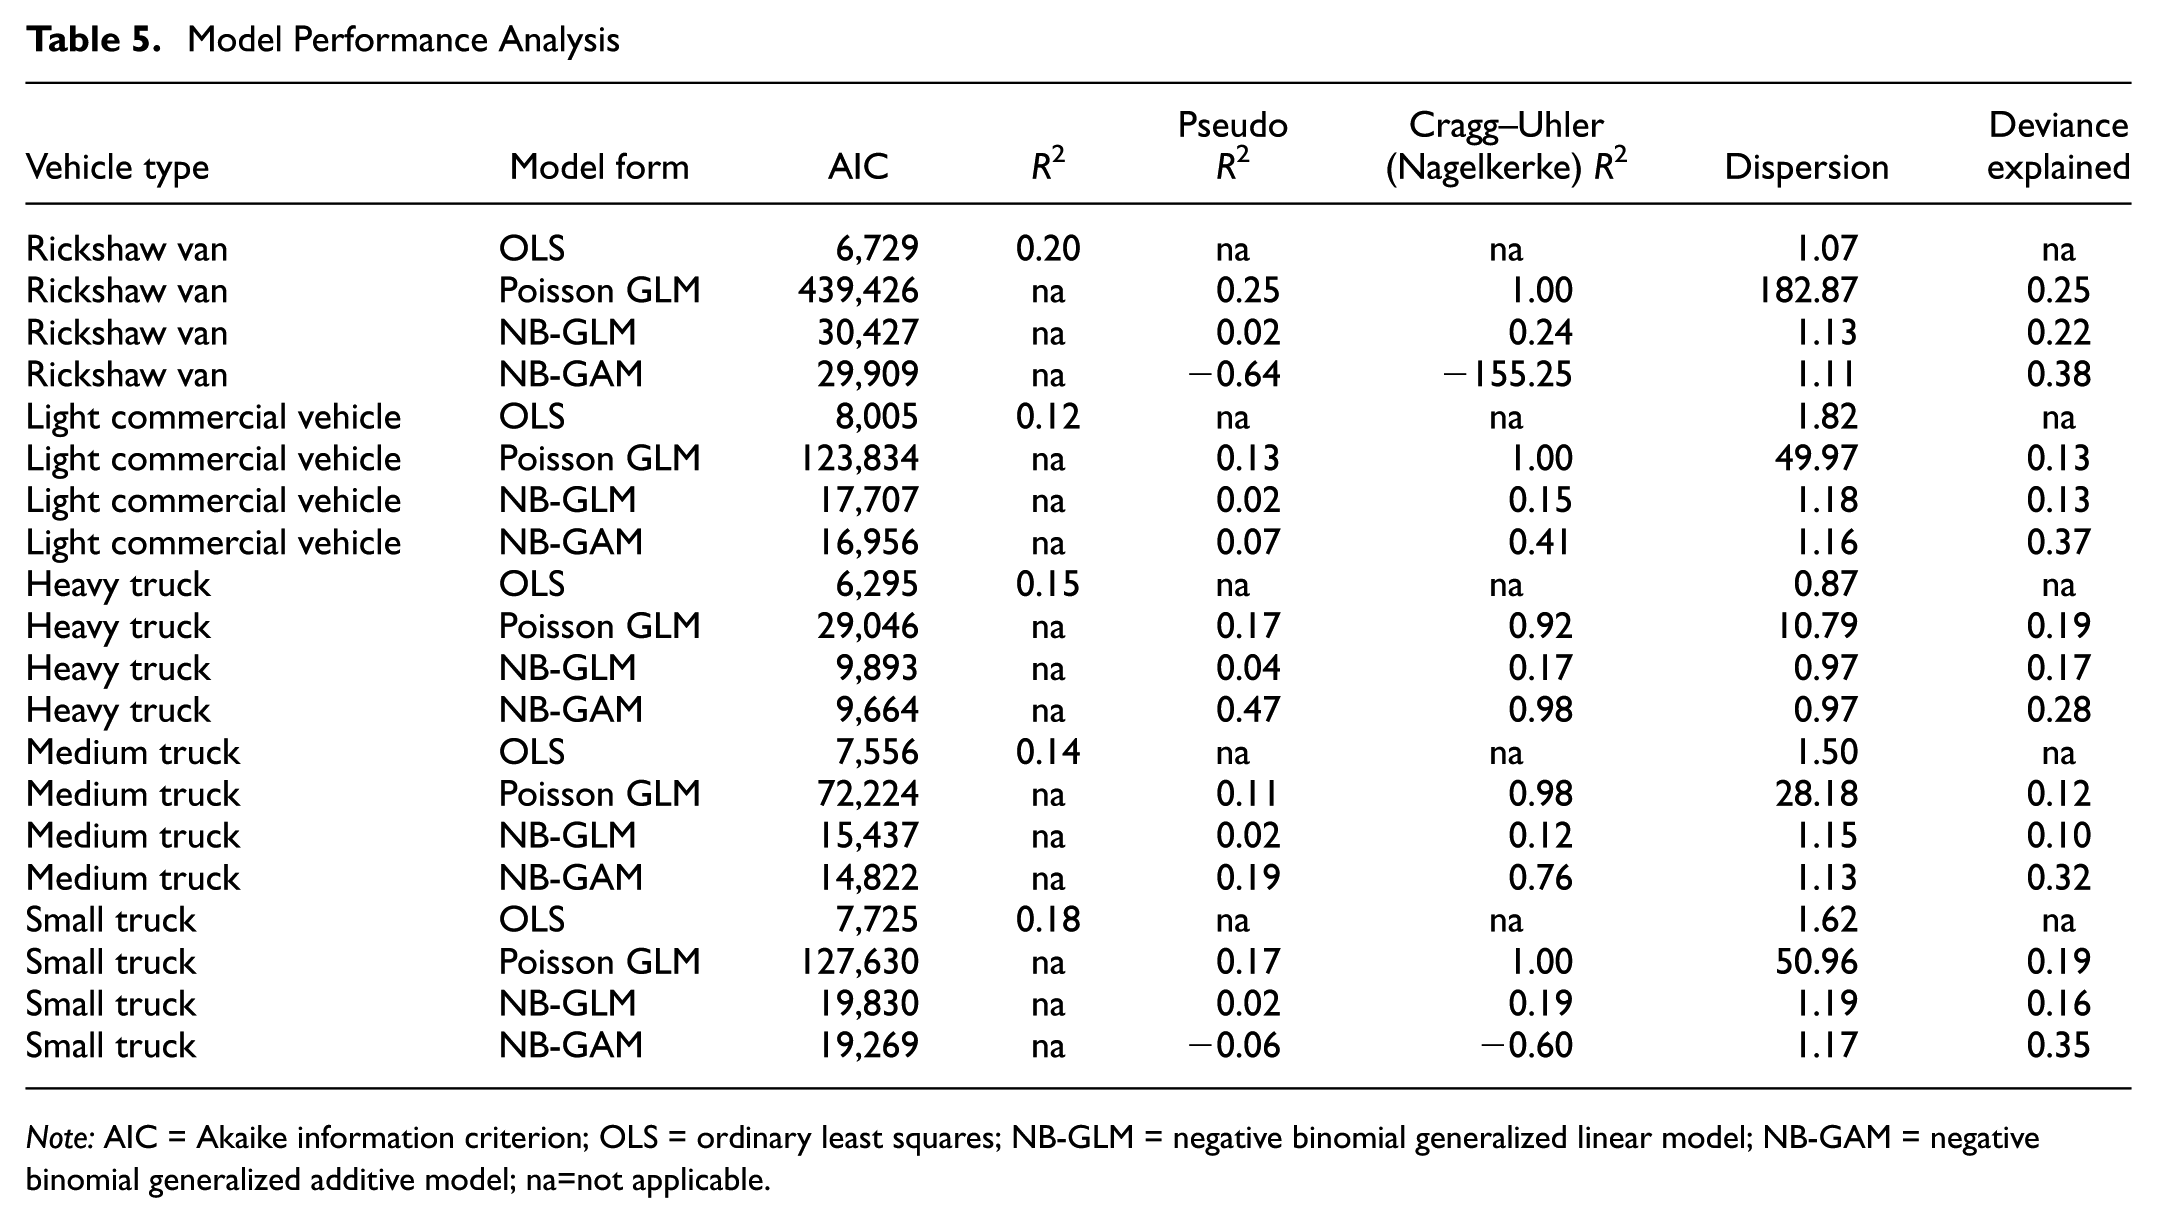
Note: AIC = Akaike information criterion; OLS = ordinary least squares; NB-GLM = negative binomial generalized linear model; NB-GAM = negative binomial generalized additive model; na=not applicable.
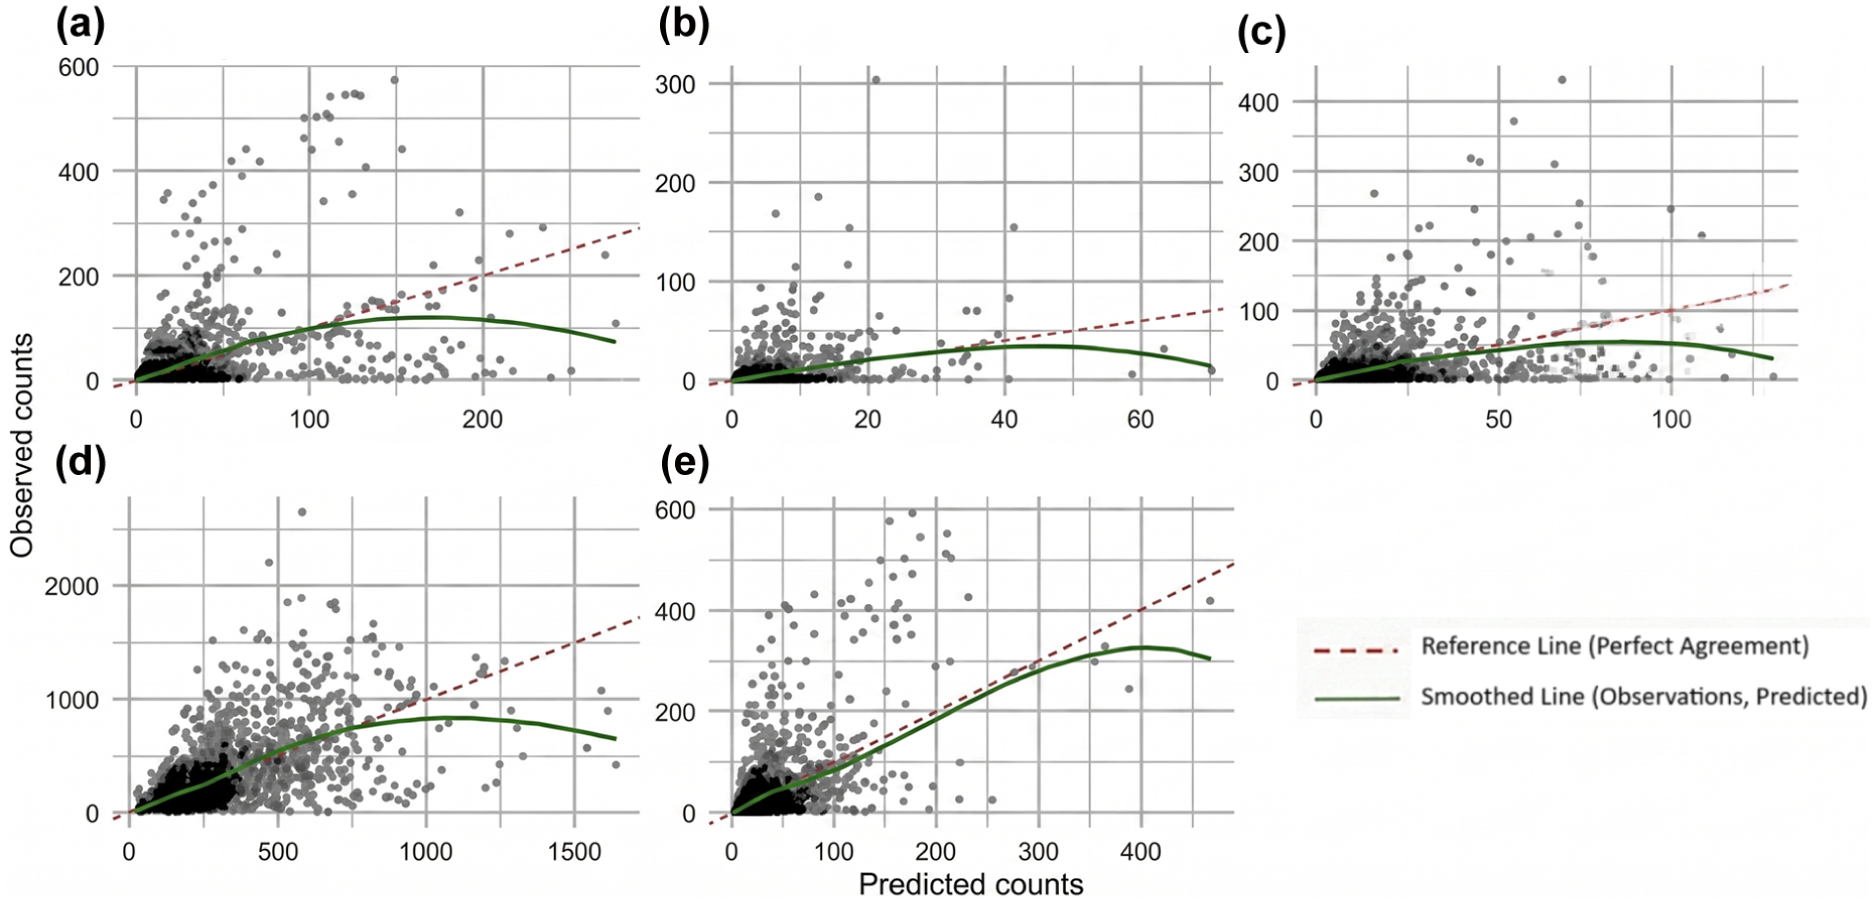
Observed versus predicted counts for different negative binomial generalized additive models: (a) light commercial vehicle, (b) heavy truck, (c) medium truck, (d) rickshaw van, and (e) small truck.
The model estimates for NB-GLM and NB-GAM are given in Tables 6 and 7, respectively. The NB-GLM can help understand the positive–negative trend of the variables used, whereas the NB-GAM can help understand the nonlinearity of continuous variables. Across all models, market day and UZR consistently demonstrated positive and statistically significant coefficients in the NB-GLM, indicating stable effects across vehicle classes. For light commercial vehicles, the NB-GLM identified significant negative effects of area and household size, with solvency level contributing positively. In contrast, crest width, embankment height, and IRI were nonsignificant in the linear form.
NB-GLM Estimates
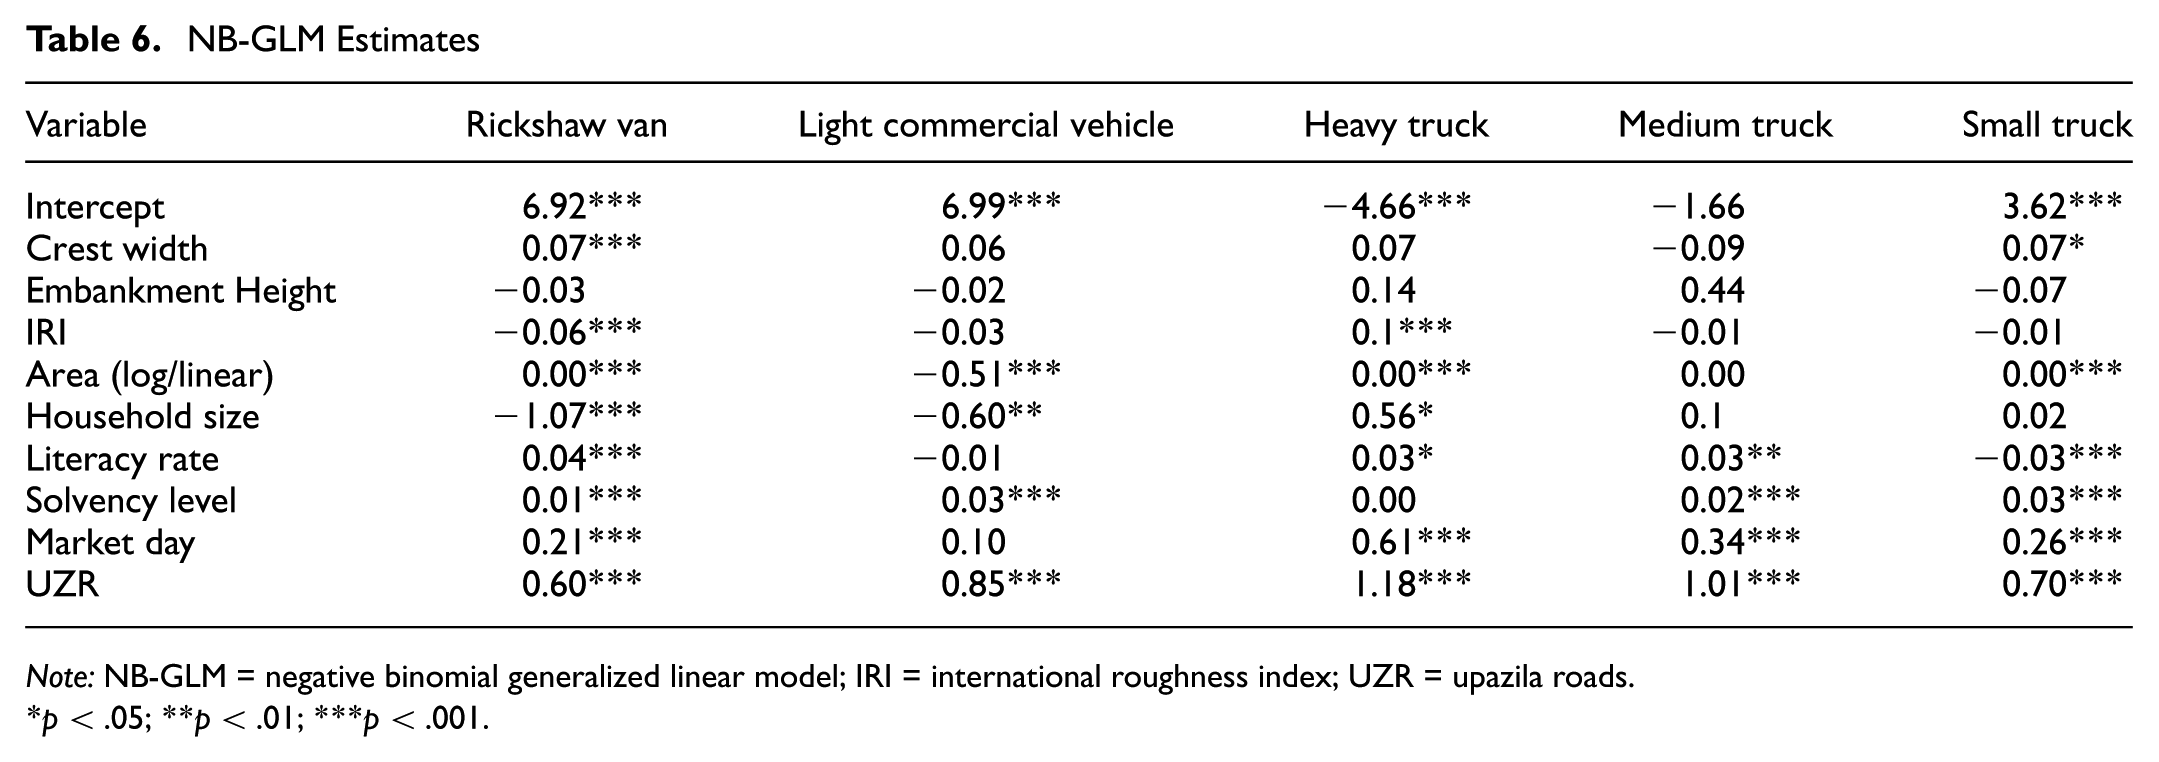
Note: NB-GLM = negative binomial generalized linear model; IRI = international roughness index; UZR = upazila roads.
p < .05; **p < .01; ***p < .001.
NB-GAM Estimates
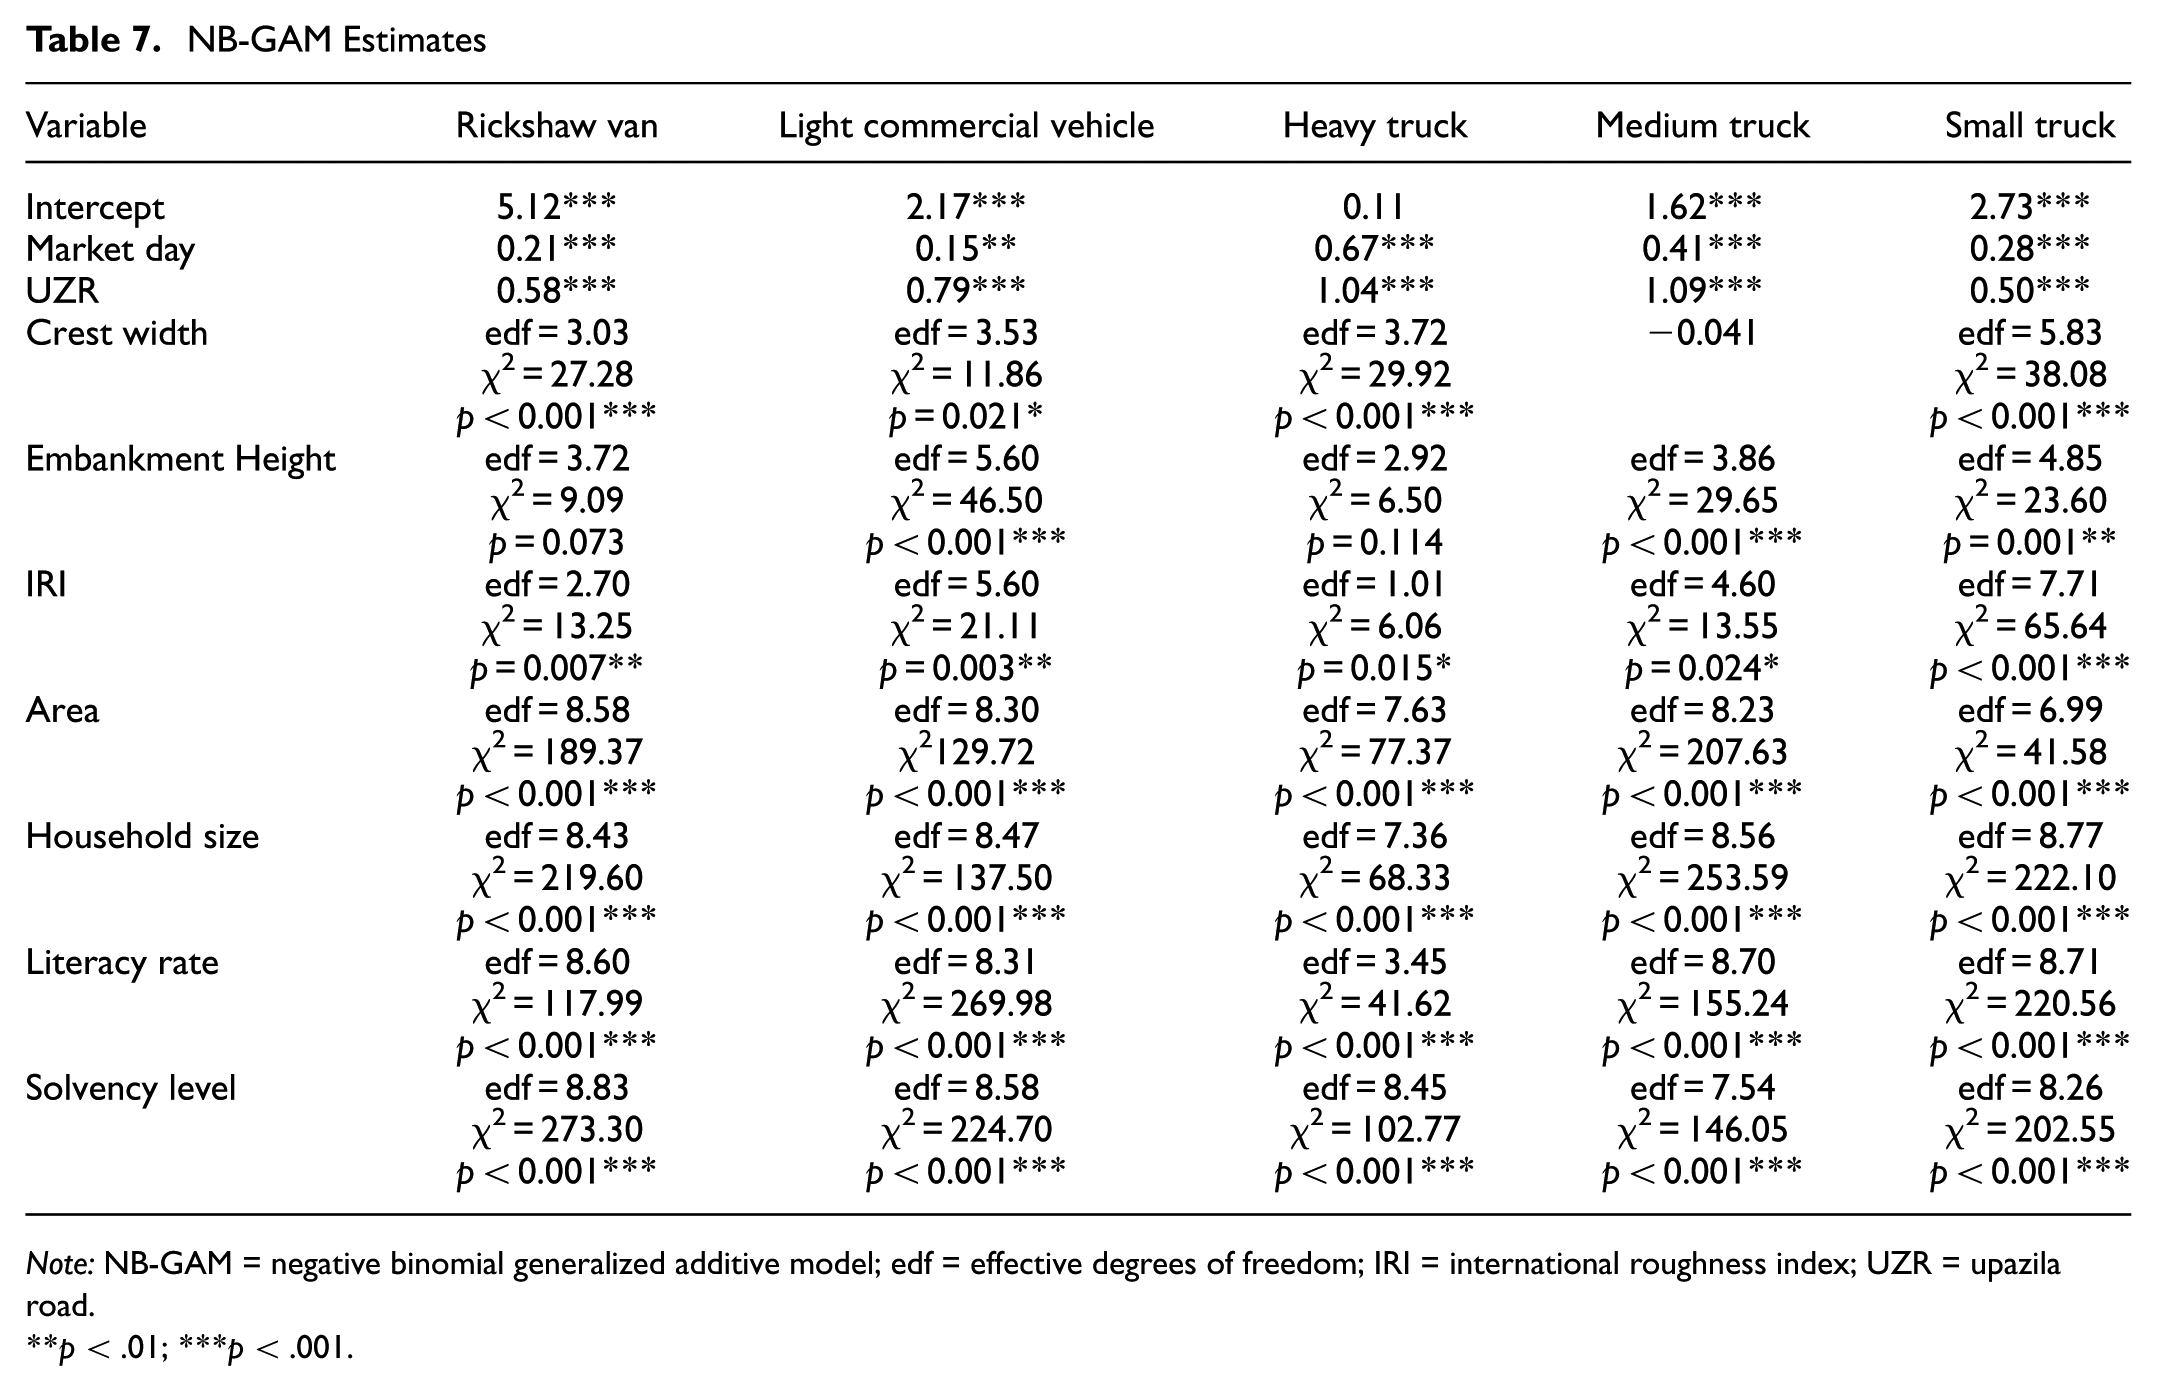
Note: NB-GAM = negative binomial generalized additive model; edf = effective degrees of freedom; IRI = international roughness index; UZR = upazila road.
p < .01; ***p < .001.
However, the NB-GAM highlighted strong nonlinear responses for crest width and embankment height, and highly flexible smooths for socioeconomic factors (area, household size, literacy rate, solvency level) with large effective degrees of freedom (edf) values (in general, an edf close to 1 suggests linearity), suggesting complex relationships. The heavy truck’s NB-GLM departed from that of light commercial vehicles by producing a negative intercept and significant positive coefficients for IRI, household size, and literacy rate. No other roadway-related predictors were influential. The NB-GAM added further nuance: crest width and embankment height showed nonlinear smooths, whereas IRI remained largely linear. Socioeconomic variables again displayed pronounced nonlinearity with edf values above 3. For medium trucks, the NB-GLM reported a strong positive effect of embankment height and a marginal negative role of crest width, whereas literacy rate and solvency level contributed positively. Other variables remained negligible in linear form. In the NB-GAM, both embankment height and IRI exhibited distinct nonlinearities, and the socioeconomic predictors revealed smooth structures with high edf values, underscoring nonlinear dependence. In the small-truck model, the NB-GLM highlighted significant contributions from crest width (positive), area (negative), and literacy rate (negative), with solvency level being positive. No other predictors were linearly important. The NB-GAM captured nonlinear influences of crest width, embankment height, and IRI, alongside highly curved patterns for all socioeconomic indicators. For rickshaw vans, the NB-GLM showed negative effects from IRI, area, and household size, contrasting with positive roles for literacy rate and solvency level. In the NB-GAM, crest width and IRI were strongly nonlinear, whereas embankment height was only marginally significant. Socioeconomic predictors again dominated with very high edf values, indicating complex nonlinear behavior.
To give an example, the estimated smooth functions for the heavy truck model (NB-GAM) are shown in Figure 6. Crest width displayed a relatively flat trend at lower values with broadening uncertainty, followed by a gradual increase at higher widths. Embankment height exhibited a concave relationship, remaining stable up to mid-range values and then declining at greater heights. The smooth for IRI transitioned to a steady positive trend beyond moderate roughness levels. Area demonstrated one of the most complex nonlinear effects, with multiple oscillations including local peaks around intermediate sizes and dips at larger areas, indicating that its influence was not monotonic. Household size remained largely flat across most of its range, but exhibited sharp, localized increases toward the upper end. Literacy rate was strongly nonlinear, beginning with a negative slope at lower values, flattening at mid-range, and then rising progressively at higher literacy levels. Collectively, the smooth functions confirmed that the effects of roadway and socioeconomic variables on freight vehicle counts could not be captured adequately by simple linear terms. The estimated edf reported in the model supported these patterns, with high values for area, household size, and literacy rate (edf > 7), indicating complex nonlinearity, whereas crest width and embankment height showed moderate nonlinearity (edf ∼3 to 5).
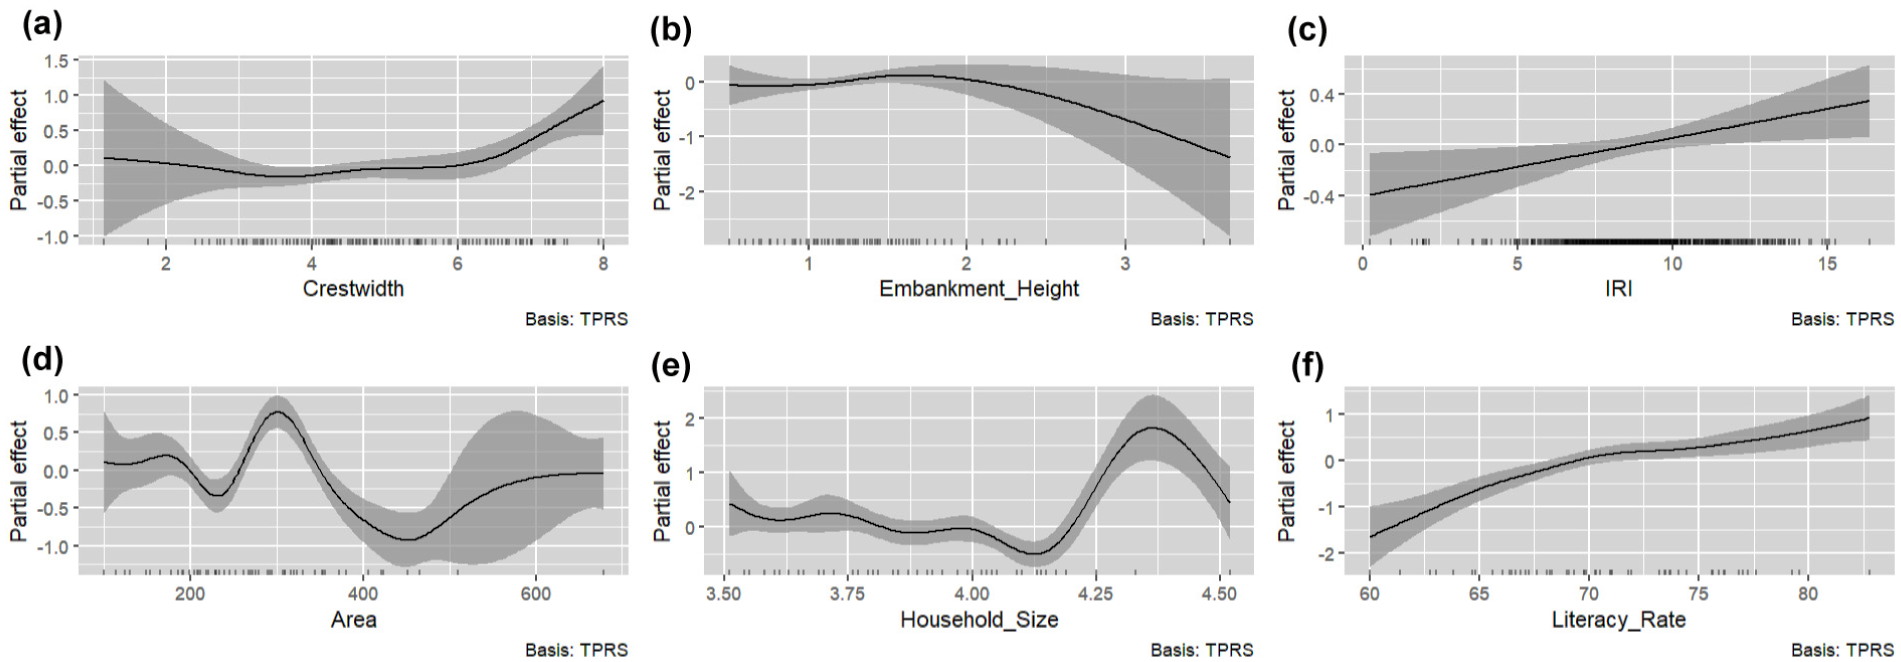
Smooth partial effects of continuous predictors on heavy truck counts from the NB-GAM, fitted using thin plate regression splines: (a) crest width, (b) embankment height, (c) international roughness index, (d) area, (e) household size, and (f) literacy rate.
Discussion
Model Interpretation
The modeling results revealed distinct associations between roadway, spatial, and socioeconomic attributes with rural freight vehicle movement in Bangladesh. Across all vehicle categories, market day and UZRs consistently exerted significant positive effects, underscoring the temporal and spatial concentration of freight flows. This reflects the market day or periodic market culture that is central to rural life in Bangladesh, where freight demand is not a steady daily stream but a rhythmic pulse. The notably higher sensitivity of heavy and medium trucks to market days compared with rickshaw vans and light commercial vehicles suggests that these cycles are the primary triggers for regional-scale logistics (longer trips) rather than just local neighborhood shopping (shorter trips). Although rickshaw vans handled daily local needs and smaller volumes, the larger motorized fleet, specifically heavy and medium trucks, was only fully utilized when the commercial volume generated on market days reached a peak. The reliance on UZRs further confirmed that these roads act as the essential corridors for all vehicles, though the impact was most pronounced for heavy trucks, confirming their role as the backbone of national/regional goods distribution. The nonlinear effects revealed in the models suggest that road attributes do not affect freight simply or gradually; instead, they operate on important threshold effects that vary by vehicle type. For instance, the significant nonlinearity for crest width across light commercial vehicles, heavy trucks, and small trucks suggests a physical unlocking point. A road may need to reach a specific width, likely broad enough for a truck to safely pass a nonmotorized vehicle, before a major shift from manual rickshaw vans to motorized trucks can occur. The embankment-height relationship reflected different needs: it was highly significant for light commercial vehicles and medium trucks, which often carry processed or perishable goods. In a country like Bangladesh, which is prone to flooding, once a road is built high enough to remain above the anticipated flood level, it becomes a reliable year-round asset for these commercial vehicles. With regard to road roughness (IRI), rickshaw vans were negatively affected by even minor increases in roughness, whereas trucks showed a more complex nonlinear relationship. This implies that although heavy trucks are forced to use rough roads owing to a lack of alternatives, there is a clear tipping point where the surface quality becomes too poor even for them, forcing a total stop or diversion to avoid vehicle damage and extra maintenance costs.
The way household size related to different vehicles provided a window into how the rural economy is changing at the family level. The finding that larger households were less likely to use rickshaw vans or light commercial vehicles but were significantly more likely to use heavy trucks suggests that these families often function as collective farming units or small enterprises. As a household grows, it likely moves away from supplying goods for small-scale, daily domestic shopping, which usually relies on rickshaws, and shifts toward industrial-scale agricultural production for export to larger cities. This bulk-buy and bulk-sell behavior is highly nonlinear for almost every vehicle type, meaning that transport choice changes drastically once a household reaches a certain size or has enough labor to produce at a commercial scale. Smaller households, by contrast, remained the primary users of rickshaw vans and light commercial vehicles for individual consumption and smaller-scale trade. Socioeconomic factors such as literacy and solvency also acted as vital catalysts, but they affected vehicle types differently. Higher solvency levels led to increased movement of medium and small trucks, likely because of the consumption of processed goods and modern building materials. Literacy rate had a strong positive association with rickshaw vans and heavy trucks, possibly suggesting that more educated rural residents are better integrated into both local retail markets and larger-scale commercial supply chains. These families were more likely to participate in modern, high-value industries like poultry or aquaculture, which require frequent and specialized motorized transport. The models showed that for all vehicle types, this shift was nonlinear, indicating a take-off point where a community’s combined wealth and education triggered a permanent move toward faster and more sophisticated transport modes.
Finally, the findings for the area variable suggested that freight thrives in compact clusters rather than spread-out regions. Light commercial vehicles were particularly sensitive to this, showing a negative relationship with larger areas, which implies they operate most efficiently in dense, localized environments. In the dense landscape of Bangladesh, logistics were most efficient for all motorized vehicles when households and markets were close together. Larger areas may hinder the logistic efficiency of trucks because of the long distances and lower volume of goods, which often forces reliance back onto localized rickshaw vans for basic transport. This suggests that the spatial concentration of activity is just as important as the quality of the roads themselves in determining which vehicles will be used.
Policy Applications and Implications
The insights derived from this study offer a strategic roadmap for LGED and other organizations to refine rural transport policy. By pivoting from uniform paving to targeted, threshold-based interventions, these recommendations address specific bottlenecks in crest width, embankment height, and maintenance prioritization. The following applications integrate infrastructural upgrades with regulatory and land-use strategies to modernize rural logistics and maximize economic returns on Bangladesh’s ongoing investments in rural education and infrastructure.
Critical Link Upgrade
The identification of specific threshold effects for road crest width and embankment height suggests that LGED should move away from uniform paving projects in favor of critical link upgrades, as crest width acts as an unlocking point for motorized trucks. Engineers/policy makers should prioritize widening specific bottleneck segments, such as narrow bridges or stretches passing through village markets, to a minimum standard that allows a medium truck to pass a rickshaw van without one vehicle leaving the pavement. This targeted widening would facilitate the bulk-buy and bulk-sell logistics of larger, more productive rural households.
Climate-Synchronized Design Standard
The nonlinear relationship between embankment height and light commercial vehicles requires a climate-synchronized design standard. Rather than a standard height for all roads, the modeling suggests that raising roads to a certain height above the highest local flood level would yield a disproportionate increase in year-round commercial vehicle reliability, specifically benefiting the delivery of perishable goods and e-commerce.
Last-Mile Surface Fund
Maintenance strategies should also be differentiated by vehicle sensitivity. Since rickshaw vans are disproportionately hindered by road roughness (IRI), a last-mile surface fund should be established to provide frequent bituminous carpeting or patching for minor UNRs that connect houses to markets. This would support the small-scale commerce of lower-income families.
Structural Axle-Load Capacity Focus
For the UZRs, where heavy trucks are concentrated, the focus must shift from surface smoothness to structural axle-load capacity. This would ensure that the backbone of the regional freight network does not suffer from structural failure during the peak harvest periods or during market-day surges.
Temporal Zoning of the Rural Road Network
On the regulatory side, the rhythmic pulse of market-day freight calls for temporal zoning of the rural road network. Local authorities could implement a freight priority window on market days, where heavy and medium trucks are encouraged to move during specific early-morning or late-evening hours to minimize conflict with the rickshaws and light commercial vehicles used for domestic shopping.
Village Freight Microhubs
To further support the rising literacy and solvency levels of rural residents who drive the demand for motorized trucks, the government should incentivize the creation of village freight consolidation points. These microhubs, located near dense household clusters, would allow for the grouping of small agricultural surpluses into single heavy-truck loads, reducing the number of half-full or empty trips and lowering overall transport costs for rural entrepreneurs.
Nucleated Market Hubs and Land-Use Policies
The consistently negative relationship between area and motorized freight movement, particularly for light commercial vehicles, suggests that expansive spatial extent acts as a barrier to logistic efficiency. In the context of rural Bangladesh, this finding implies that land-use policies should actively discourage ribbon developments—where residential and commercial structures are spread thinly along road stretches—because such patterns increase travel times and reduce the profitability of motorized transport. Instead, policy makers should promote nucleated market hubs that concentrate larger population clusters and commercial activities into smaller, manageable areas. By reducing the physical area over which goods must be distributed, the logistics network can better support the bulk-buy and bulk-sell behaviors of larger households and the high-value supply chain needs of more solvent and literate residents.
This strategy of spatial concentration, combined with the unlocking of infrastructure thresholds like crest width and embankment height, allows for a more cost-effective transition from slow, manual transport to a modern, motorized freight system that rewards a low-/medium-income country’s rural education and economic investment, which are basically the backbone of these types of economies.
Conclusion
The analysis of rural freight vehicle movements across northern Bangladesh demonstrates the complex interplay between roadway characteristics, socioeconomic characteristics, and temporal variations in travel demand. By employing both NB-GLMs and NB-GAMs, the study revealed that although certain correlates, such as market day effects and the importance of UZRs roads, are consistently significant across vehicle types, the strength and form of these relationships vary substantially. The GLM results highlighted a set of key linear associations, indicating that household size, area, literacy, and solvency systematically influence freight activity. However, the additive modeling provided deeper insights by capturing nonlinear dependencies, particularly for road geometry, pavement condition, and socioeconomic indicators, which could not be adequately represented by linear models. Taken together, these findings suggest that rural freight demand is not only a function of road network attributes but also shaped by underlying demographic and economic contexts. The presence of strong nonlinear effects emphasizes the necessity of flexible modeling frameworks to better reflect real-world transport dynamics. The outcomes contribute to a more nuanced understanding of rural freight flows in Bangladesh and point to the need for integrated planning approaches that address both physical infrastructure and socioeconomic development to sustain and enhance rural mobility.
Supplemental Material
sj-docx-1-trr-10.1177_03611981261454272 – Supplemental material for Factors Influencing Rural Freight Transport in Bangladesh: Insights from Generalized Linear and Additive Models
Supplemental material, sj-docx-1-trr-10.1177_03611981261454272 for Factors Influencing Rural Freight Transport in Bangladesh: Insights from Generalized Linear and Additive Models by Md. Amin Al Noor and Sadia Mehanaz in Transportation Research Record
Footnotes
Acknowledgements
The authors gratefully acknowledge the assistance of the Rural Connectivity Improvement Project of the Local Government Engineering Department of Bangladesh in providing the necessary data required to conduct this research.
Author Contributions
The authors confirm contribution to the paper as follows: study conception and design: Md. A. Al Noor; data collection: S. Mehanaz, Md. A. Al Noor; analysis and interpretation of results: Md. A. Al Noor, S. Mehanaz; draft manuscript preparation: Md. A. Al Noor, S. Mehanaz. All authors reviewed the results and approved the final version of the manuscript.
Declaration of Conflicting Interests
The authors declared no potential conflicts of interest with respect to the research, authorship, and/or publication of this article.
Funding
The authors received no financial support for the research, authorship, and/or publication of this article.
Supplemental Material
Supplemental material for this article is available online.
References
Supplementary Material
Please find the following supplemental material available below.
For Open Access articles published under a Creative Commons License, all supplemental material carries the same license as the article it is associated with.
For non-Open Access articles published, all supplemental material carries a non-exclusive license, and permission requests for re-use of supplemental material or any part of supplemental material shall be sent directly to the copyright owner as specified in the copyright notice associated with the article.