
Abstract
Traffic roundabouts are generally associated with improved safety because of reduced conflict points and lower operating speeds; however, their performance under mixed traffic conditions in low- and middle-income countries remains inadequately understood. Safety assessment in such environments is constrained by heterogeneous traffic and limited availability of reliable crash data. Although surrogate measures of safety based on traffic conflicts provide a viable alternative, conflict severity is often defined using arbitrary thresholds. This study presents a data-driven framework to classify and predict conflict severity at urban roundabouts operating under mixed traffic conditions. Entry–circulating vehicle interactions were extracted from videographic data, and conflict severity was classified using k-means clustering based on post-encroachment time, entry speed, and circulating speed. The derived severity labels were used to develop a random forest model incorporating behavioral, traffic, and geometric variables. The model achieved an accuracy of 87.8% and an area under the receiver operating characteristic curve of 0.91. Entry speed and circulating speed emerged as the most influential predictors, followed by gap acceptance. The framework avoids predefined severity thresholds and supports proactive safety assessment within a Safe System perspective.
Introduction
Traffic roundabouts are widely recognized as a safer form of intersection because of their ability to reduce conflict points and operating speeds. However, their safety performance under mixed traffic conditions, which is prevalent in low- and middle-income countries (LMICs), cannot be reliably inferred from experiences from the studies conducted in high-income countries. According to the World Health Organization, over 90% of road traffic deaths occur in LMICs and upper-middle-income countries combined ( 1 ). In response, the United Nations has incorporated road safety into the 2030 Agenda for Sustainable Development, specifically through Sustainable Development Goal target 3.6, which aims to halve the number of global deaths and injuries from road traffic crashes by 2030 ( 2 ). Road traffic accidents also impose enormous economic costs on societies, accounting for 1%–3% of gross domestic product and, in some cases, up to 6% ( 3 ). In India, roundabouts contribute to roughly 14% of total intersection accidents annually as per the Ministry of Road Transport and Highways ( 4 ).
The crash data in LMICs is underreported or lacks adequate details to support pre-emptive safety assessment and, because of this, many near-miss incidents and dangerous driving behaviors go unrecorded, which affects the ability to fully interpret the factors that lead to safety problems at roundabouts ( 5 ). Surrogate measures of safety (SMoS) based on traffic conflicts have gained increasing attention as an alternative means of evaluating safety performance ( 6 ). The most widely used SMoS indicators are post-encroachment time (PET) and time-to-collision (TTC). Measures such as PET provide understanding of temporal proximity of interactions and have been widely used to identify potential conflict scenarios ( 7 ).
PET and TTC are majorly interpreted by using fixed threshold values that decide whether an interaction is safe or unsafe. Such threshold-based approaches may not adequately capture the complexity of mixed traffic conditions at urban roundabouts, where diverse vehicle types, varying speeds, and improper lane discipline affect the nature of conflicts. Furthermore, overdependence on fixed threshold values risks simplifying conflict severity and can result in interpretations of safety that may not be dependable. To overcome this limitation, the current study adopts a data-driven approach to classify conflict severity using k-means clustering, integrating PET, entry speed, and circulating speed. By integrating temporal proximity with speed characteristics, the clustering framework can identify distinct conflict patterns without relying on fixed thresholds of conflict severity. The resultant clusters are interpreted with reference to relative conflict severity and are further utilized as outcome labels for the development of a random forest (RF) model.
The main contributions of this study are:
To develop a data-driven framework for classifying entry–circulating conflict severity at urban roundabouts by applying unsupervised clustering to PET and speed characteristics, thereby avoiding the use of predefined conflict severity thresholds under mixed traffic conditions.
To model and predict conflict severity using supervised machine learning by developing and validating an RF classifier that incorporates behavioral, traffic exposure, and geometric variables.
To identify the key behavioral and operational factors influencing severe conflicts at roundabouts through variable importance analysis, supporting proactive safety assessment within a Safe System perspective in data-scarce environments.
While this study provides critical insights into entry–circulating conflict dynamics, the extent to which these findings generalize to other contexts—including variations in international traffic regulations, diverse vehicle mixes in different regions, and specific roundabout geometric configurations—warrants further comparative investigation. For example, interactions between motorized two-wheelers and heavy vehicles will vary significantly between regions (South Asia versus Western Europe), which affects observed PET distributions. Also, inscribed central island diameter and entry/exit widths may directly dictate speed profiles of the entering vehicles. Smaller inscribed central island diameter lowers the speeds and alters threshold for “high conflict severity” conflicts. Similarly, gap acceptance behavior and decelerations rates, which have been used in this study for classifying conflict severity, are culturally dependent and influenced by local enforcement and right-of-way rules.
Literature Review
Surrogate Measures of Safety (SMoS)
SMoS play an important role in proactive traffic safety assessment; they make it possible to analyze vehicle interactions and conflicts to assess crash risk without relying on historical accident data alone ( 8 ). The most commonly used SMoS include TTC, which calculates the time remaining until a collision occurs if both vehicles continue on the same course and at the same speed, PET, which measures the temporal proximity between the conflicting vehicles, and deceleration rate to avoid crash (DRAC), which is the deceleration needed to prevent the collision. These measures have considerable value because of the rarity of the crash events and the long observation periods required by traditional safety analysis before meaningful conclusions can be drawn from them ( 9 ). Studies have shown that these SMoS have differing strengths and weaknesses; for example, modified TTC performs much better than standard TTC and DRAC in statistical modeling applications ( 10 ). However, comprehensive evaluations reveal that no single measure outperforms in all the performance dimensions, including prediction accuracy, timeliness, robustness, and computational efficiency of use ( 11 ).
Several studies refer to PET as a reliable surrogate for measuring entry–circulating conflicts at roundabouts. For example, Shawky et al. used drone footage to measure PET at roundabouts and identified critical conflicts where PET values fell below 1.5 s ( 12 ). Maji et al. developed conflict-based safety functions for Indian urban roundabouts and incorporated PET into the modeling of crash risk resulting from heterogeneous traffic conditions ( 13 ). Earlier, Giuffrè et al. used micro-simulation to assess PET in roundabouts, demonstrating improved PET values with optimized geometries ( 14 ). Pinnow et al. reviewed naturalistic data and confirmed the usefulness of PET for roundabout geometries, in spite of challenges in multi-lane circulating paths ( 15 ).
Beyond conventional intersection safety analysis, the contributions of PETs in connected and automated vehicle safety modeling makes them increasingly important for both current traffic management and future transportation systems ( 8 , 16 ). These findings collectively suggest that, while PET is well suited for capturing temporal proximity at roundabouts, its effectiveness in conflict severity discrimination is limited when used in isolation, motivating the integration of speed-related variables in the present study.
Conflicts at Roundabouts
Roundabouts vary from conventional intersections, because vehicles entering the roundabout should yield to the circulating vehicles and then follow a continuous curved path once inside. These unique geometric features and priority rules give rise to a distinctive set of collision types that are rarely observed at signalized or stop-controlled junctions.
Mandavilli et al. examined police-reported crashes at 39 modern roundabouts in Maryland, U.S., and grouped them into eight categories ranging from single-vehicle run-off-road incidents to collisions involving pedestrians and cyclists ( 17 ). Their analysis revealed that the most frequent type, by a considerable margin (45% of all crashes), was the entering circulating collision in which a driver joining the roundabout failed to give way to a vehicle already traveling around the central island. Sideswipe collisions within the circulatory roadway came second (19%) followed by crashes between circulating and exiting vehicles (12%). Studies conducted in Europe have sometimes adopted broader groupings, yet still arrive at very similar conclusions. For example, Polders et al. reduced most roundabout crashes to three main classes (i.e., run-off-road, loss of control, and wrong-way driving) but emphasized that the overwhelming majority still involved interactions between entering and circulating vehicles ( 18 ). More recently, Pinnow et al. reviewed crash records from eight different locations and, again, identified entry–circulating and rear-end collisions as the two dominant categories ( 15 ). Among all the collision types, entry–circulating collisions stand out for several reasons and, therefore, justify closer examination.
Machine Learning Applications in Conflict Analysis
Machine learning approaches have increasingly been applied in traffic safety analysis because of their ability to model complex nonlinear relationships between traffic variables and safety outcomes. Abdel-Aty and Haleem demonstrated that machine learning models such as multivariate adaptive regression splines outperform traditional statistical models in predicting angle crashes at unsignalized intersections ( 19 ). Similarly, Kuşkapan et al. showed that ensemble learning algorithms such as RF and gradient boosting significantly improve the prediction of pedestrian crashes at signalized intersections ( 20 ). Recent studies have also integrated machine learning with SMoS and trajectory data for conflict severity assessment. For example, Zhao et al. ( 21 ) applied k-means clustering and XGBoost to classify traffic conflicts into severity levels, while Das and Paul used clustering combined with RF and support vector machines to predict rear-end conflicts at high-speed intersections ( 22 ). Fu et al. further demonstrated that machine learning models can support real-time conflict prediction using high-resolution trajectory data ( 23 ). These studies collectively highlight the growing potential of machine learning techniques for modeling complex traffic interactions and predicting safety outcomes beyond traditional regression approaches. Gore et al. developed a framework for real-time traffic conflict assessment using macroscopic traffic flow variables (e.g., speed, density, volume) ( 24 ).
Among several ML models, RF emerged as the best performer, enabling proactive safety monitoring in heterogeneous traffic conditions. The RF algorithm’s effectiveness in predictive modeling is well-established, as Polders et al. demonstrated that RF achieved the best performance in 70% of applications across multiple studies, outperforming other machine learning techniques ( 18 ). This superior performance can be attributed to RF’s key characteristics as a decision-tree-based classifier that utilizes voting mechanisms and features such as a variable importance feature and out-of-bag error estimation (25, 26). Additionally, Diwakar and Ravishankar investigated entering driver path change behavior at roundabouts using a binary logit model along with machine learning approaches, including RF ( 27 ).
While machine learning has been widely applied in the analysis of signalized and unsignalized intersections, its application to roundabout safety remains comparatively limited. Unlike signalized intersections, where driver behavior is regulated by traffic signals, roundabouts rely primarily on driver gap-acceptance decisions and continuous merging maneuvers. These interactions generate complex nonlinear relationships between traffic flow, vehicle speeds, and conflict severity that are difficult to capture using traditional statistical models. Machine learning techniques are particularly suitable for modeling such dynamics because they can capture nonlinear interactions among behavioral, traffic exposure, and geometric variables. Furthermore, in heterogeneous traffic environments commonly observed in LMICs, the variability in vehicle types and driving behavior increases the complexity of conflict patterns.
Methodology
Figure 1 illustrates the methodological framework adopted in this study for assessing entry–circulating conflict severity at urban roundabouts operating under mixed traffic conditions. Videographic data were collected at selected roundabouts during peak traffic periods using fixed traffic surveillance cameras. Vehicle trajectories corresponding to entry–circulating interactions were extracted through semi-manual tracking after camera calibration using reference grid alignment.
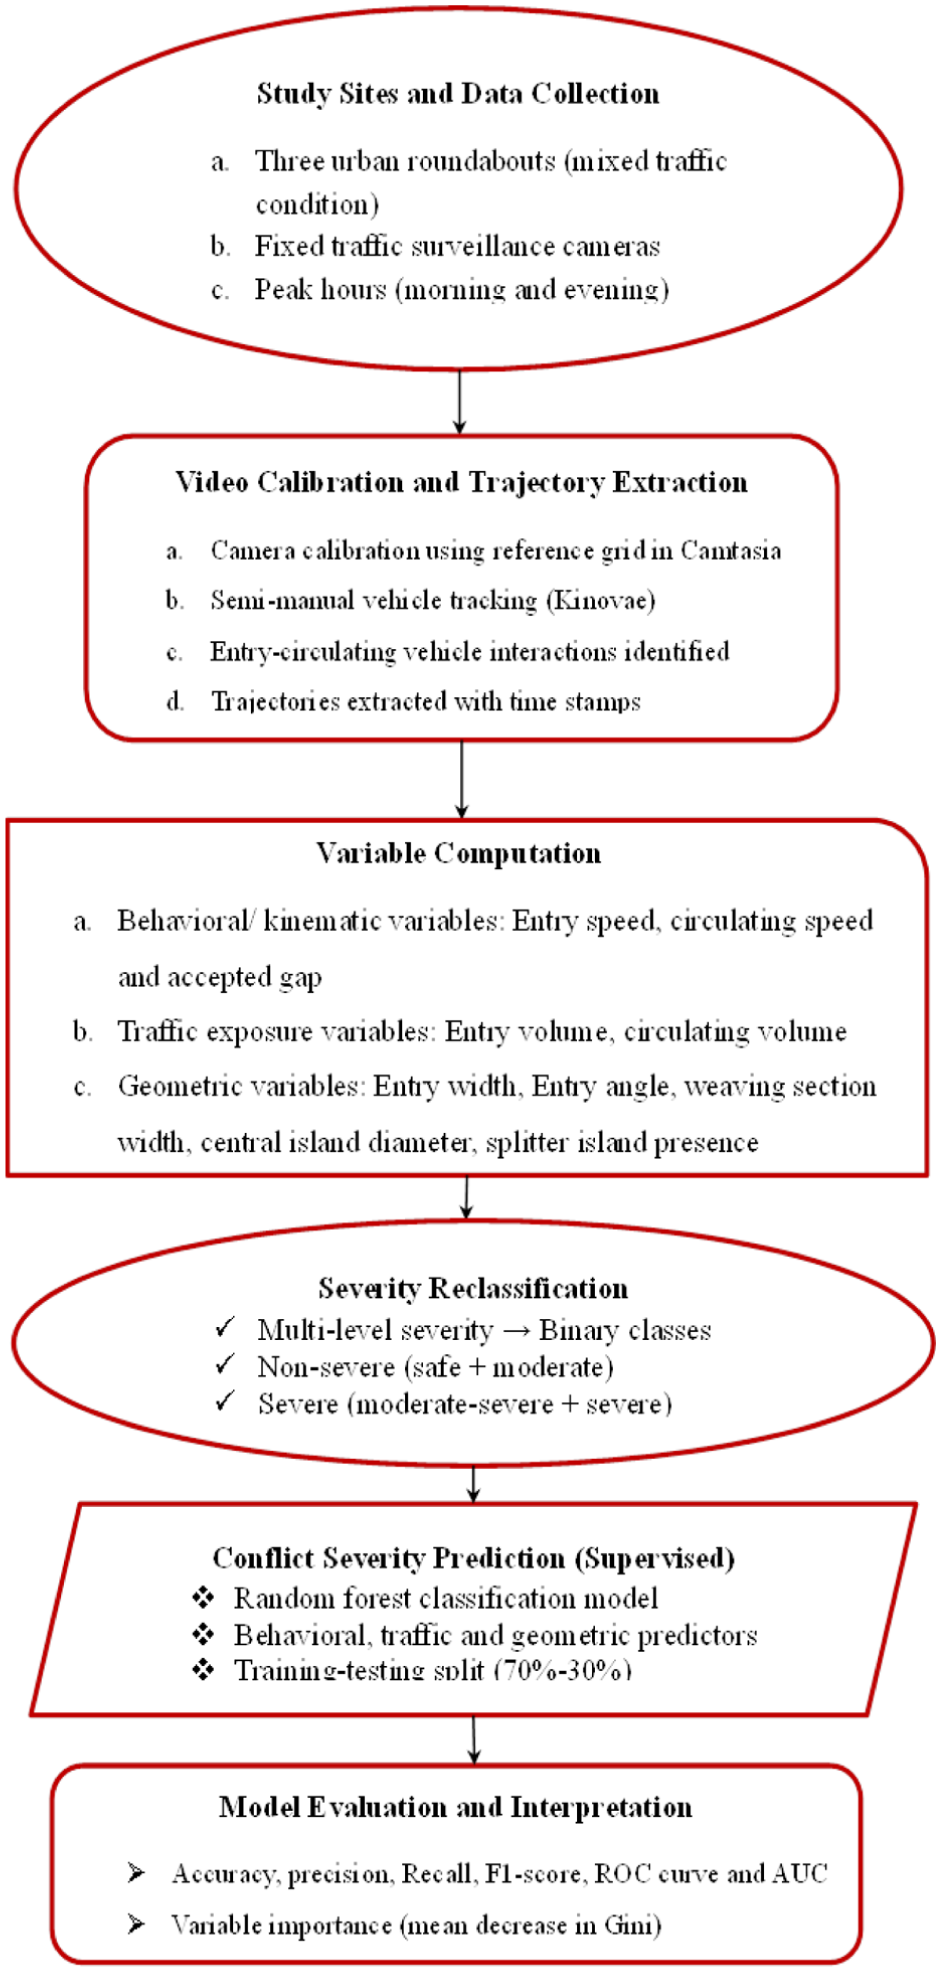
Methodological framework for assessing entry–circulating conflict severity at urban roundabouts under mixed traffic conditions.
From the extracted trajectories, surrogate safety and kinematic parameters, including PET, entry speed, and circulating speed, were computed. Traffic exposure variables (i.e., entry and circulating volumes) and geometric characteristics (i.e., entry width, entry angle, weaving section width, central island diameter, and presence of splitter islands) were compiled for each interaction. All continuous variables were standardized before analysis.
An unsupervised k-means clustering approach was then applied to PET and speed variables to identify distinct conflict patterns without predefined conflict severity thresholds. The optimal number of clusters was determined using the elbow method and silhouette analysis. Based on cluster centroids, conflicts were interpreted and categorized into conflict severity levels.
Subsequently, the derived conflict severity labels were used as the dependent variable in a supervised FR classification model. Behavioral, traffic, and geometric variables served as predictors.
The dataset was partitioned into training and testing subsets, and model performance was evaluated using accuracy, precision, recall, F1-score, and the area under the curve (AUC). Variable importance analysis was conducted to identify the key factors influencing conflict severity.
To ensure reproducibility of the machine learning analysis, the RF model was implemented in R using the randomForest package with 500 trees and bootstrap aggregation. At each split, a random subset of predictors was selected according to the default √p rule, where p represents the total number of predictor variables. Model performance was evaluated using stratified training–testing partitioning (70–30 split), and the random seed was fixed during model training to ensure replicability of results. The proposed framework integrates unsupervised learning and supervised machine learning. First, k-means clustering is used to identify conflict severity patterns based on PET and speed variables without predefined thresholds. The resulting conflict severity labels are then used to train a RF classifier that predicts severe conflicts using behavioral, traffic, and geometric predictors.
Study Area and Data Collection
Videographic data were collected at three urban roundabouts in Bhopal, India, representing 4-lane and 6-lane roundabout configurations with 4–6 entry legs each. The roundabouts are located in plain terrain and have different geometrical features, as shown in Table 1.
Geometric Characteristics of the Studied Roundabouts Used for Trajectory Extraction and Conflict Severity Analysis
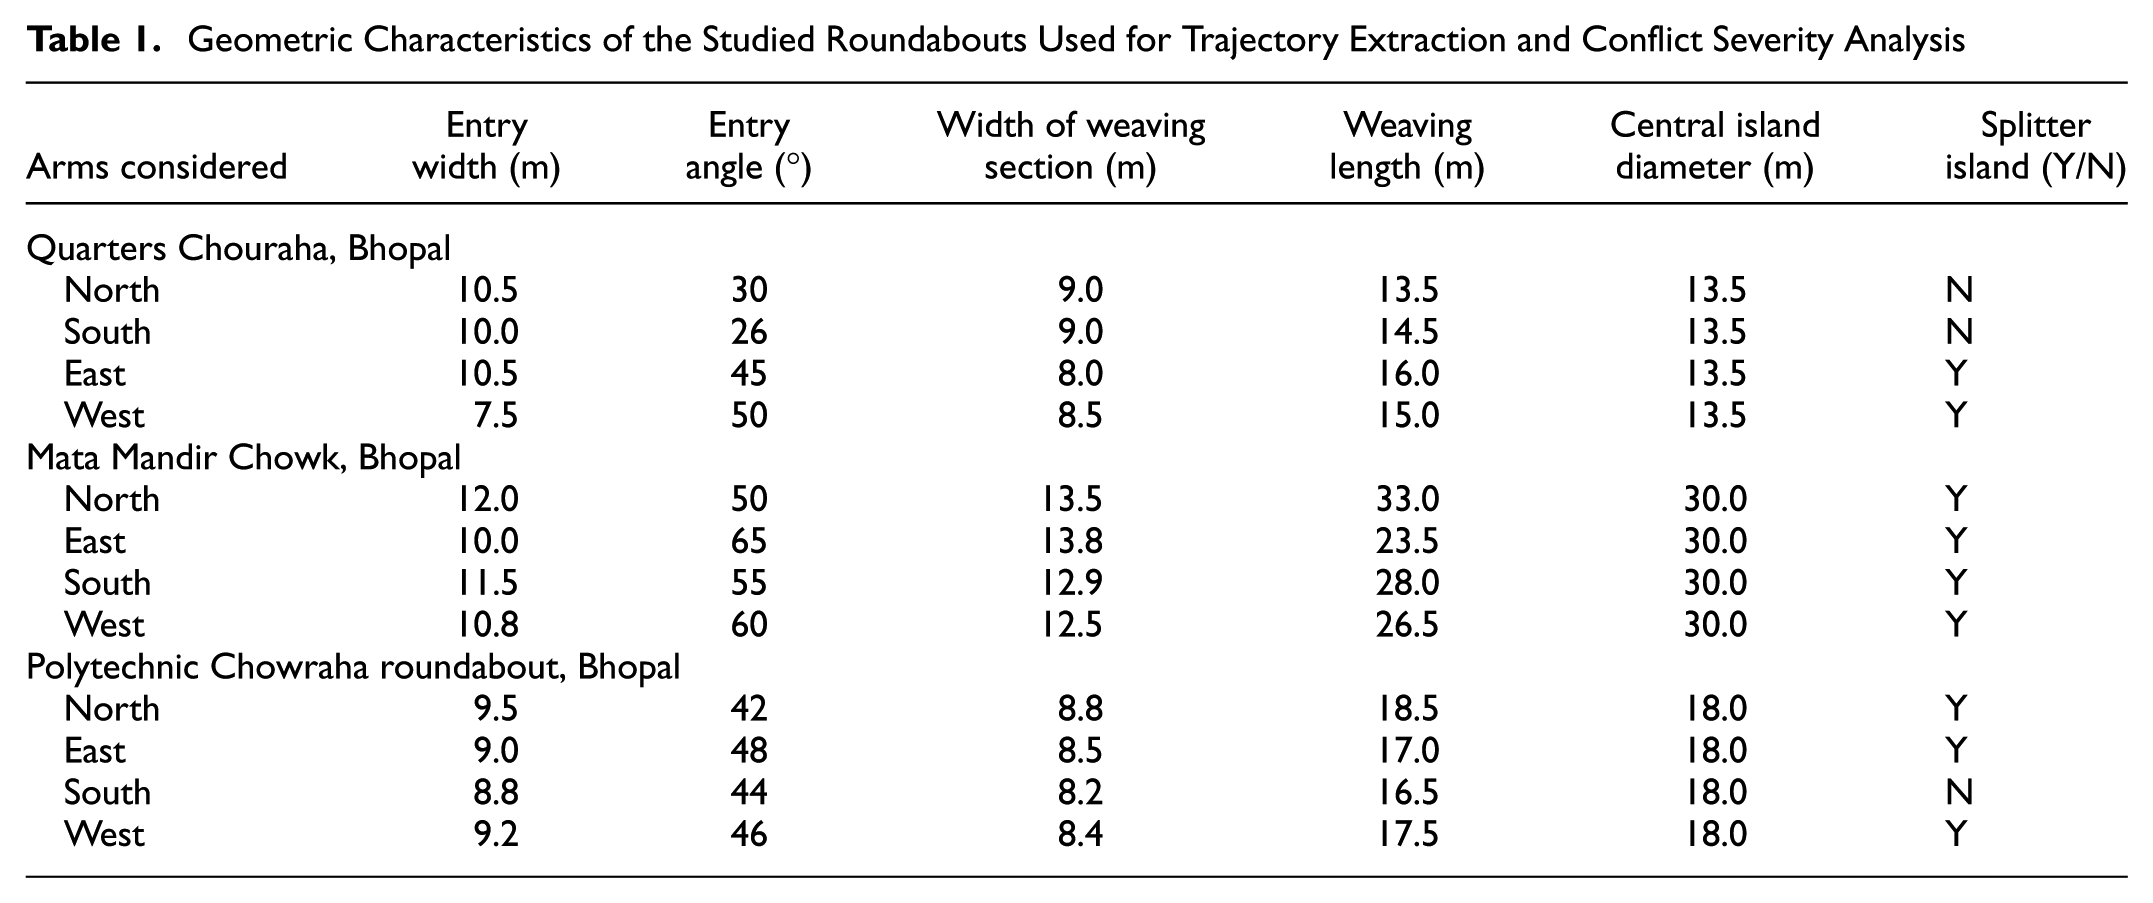
Observations were conducted leg-wise to capture entry–circulating vehicle interactions under varying traffic conditions. Data collection was carried out on typical weekdays in November, 2023, to avoid abnormal traffic patterns associated with holidays or special events. Each entry leg was monitored during morning and evening peak traffic periods, with observation durations ranging between 3 and 4 h per leg depending on camera coverage and traffic conditions. Overall, approximately 15 entry legs were monitored across the three roundabouts, resulting in a total observation effort of about 48 h of video recordings. The video data were obtained from existing traffic surveillance cameras operating at frame rates ranging from 24 to 30 frames per second (fps), providing a temporal resolution of 0.03–0.04 s suitable for trajectory tracking and surrogate safety analysis. From these recordings, 1,995 entry–circulating vehicle interactions were identified and extracted for further analysis. The combination of multi-site observations, leg-wise sampling, and high-temporal-resolution video data ensured that the dataset adequately captured the heterogeneous traffic conditions and driver interactions typical of urban roundabouts in mixed traffic environments.
Data Extraction
Vehicle trajectories corresponding to entry–circulating interactions were extracted from the videographic recordings using Kinovea version 2025.1 motion-tracking software. Before trajectory extraction, camera calibration was performed using a grid-based calibration method. A known reference distance (i.e., lane width measured in the field) was used to establish the spatial scale within the video frame, and a perspective grid was aligned with the road surface to correct for perspective distortion. A grid-based calibration was applied using Kinovea’s calibration tool, where a known reference distance, such as lane width, was set, and a perspective grid was drawn and aligned with the road surface to maintain accuracy. This calibration enabled precise tracking of vehicle trajectories and was useful in the extraction of key parameters such as entry speed, circulating speed and time-to-conflict point. Vehicle movements were tracked using the Track Path function in Kinovea. For each interaction, a tracking point was defined at either the front bumper or centroid of the vehicle, and the position of this reference point was recorded frame-by-frame using the forward-click method. Since the videos were recorded at 25 fps, the temporal resolution of trajectory tracking was 0.04 s per frame. To ensure data quality, interactions with partial occlusion, incomplete trajectories, or ambiguous conflict locations were excluded.
Vehicle interactions were tracked post-calibration by identifying potential conflict scenarios between entry–circulating vehicles. Once a potential conflict was identified, vehicles associated with the conflict were selected using the Track Path function in Kinovea. This feature allows the user to select a tracking point, which is located either at the front bumper or centroid of the vehicle, and to monitor the vehicle’s location throughout the entire video. The Track Path tool records the spatial coordinates and corresponding timestamps, enabling reasonably accurate reconstruction of the vehicle’s path. The forward-click method was employed during this process to manually track the vehicles, one frame at a time, while marking the position of the selected vehicle in each frame to calculate the PET values, as illustrated in Figure 2. This approach ensures reasonably accurate tracking, particularly in mixed traffic conditions where automatic tracking algorithms may fail because of frequent obstructions. Approximately 3,000 vehicle interactions were identified from the raw video footages. Subsequently, interactions with partial occlusion, incomplete trajectories, or ambiguous conflict points were excluded, resulting in a final dataset of 1,995 entry–circulating vehicle interactions.
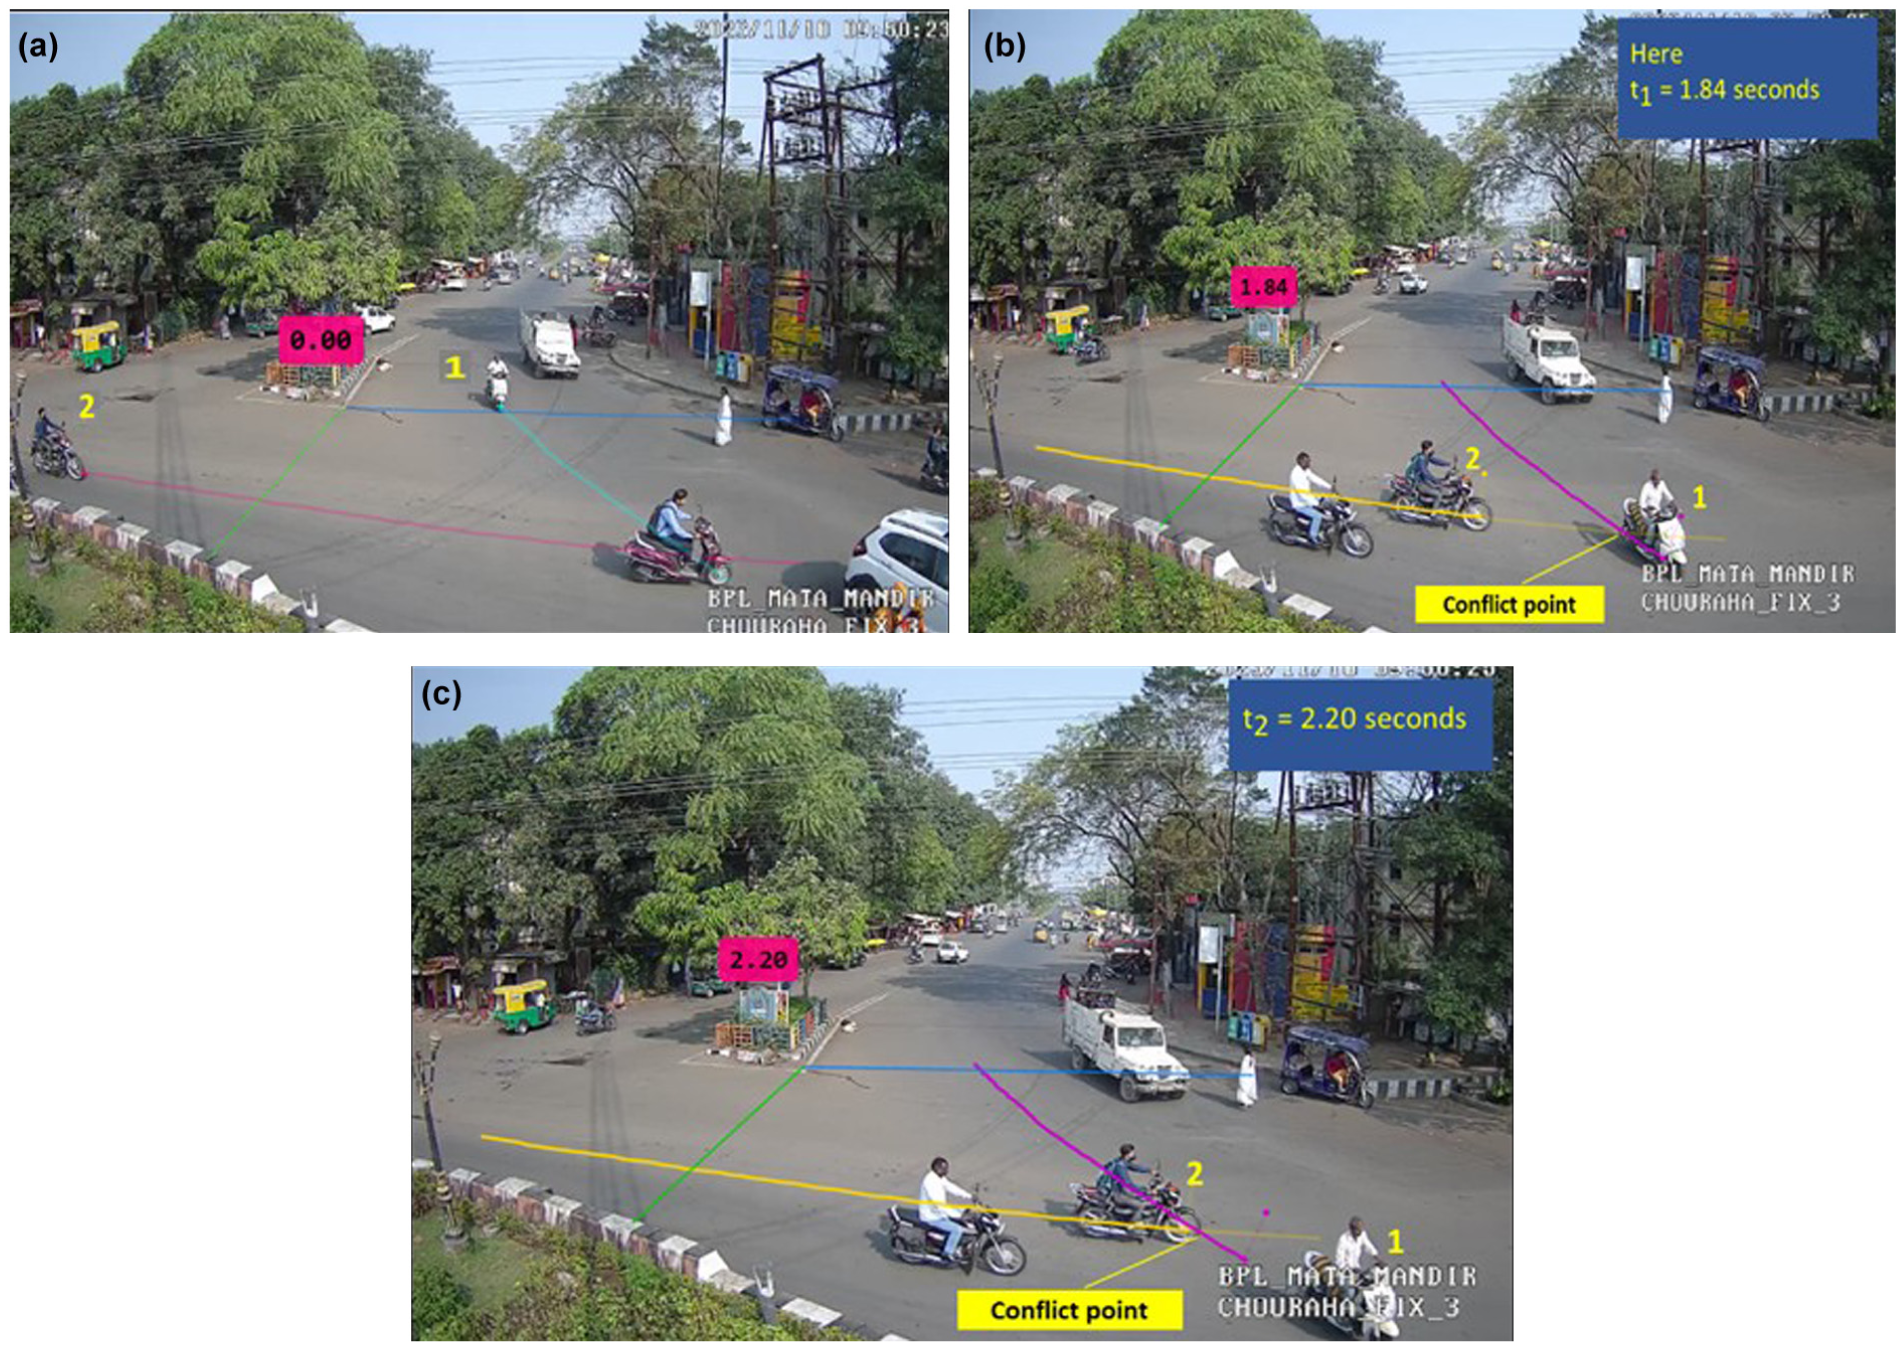
Camtasia based conflciting vehicle motion tracking signifying: (a) Subject two-wheeler (white coloured scooty) entry from minor road pre-PET calculation; (b) Subject two-wheeler (white coloured scooty) leaving point of PET conflict calculation on weaving section; (c) Circulating two-wheeler (black coloured bike) arriving at the point of PET conflict calculation on weaving sectionNote: pink lines = circulating vehicle trajectory; yellow lines = entering vehicle trajectory.
PET was calculated as the temporal difference between the moment the first vehicle exited the conflict zone and the moment the second vehicle entered the same zone. The conflict point was defined as the location of minimum spatial separation between the trajectories of the entering and circulating vehicles, as shown in Equation 1:

where
To account for vehicle dimensions and potential tracking uncertainty, a fixed spatial buffer around the conflict point was applied during PET computation. The buffer radius was approximated as half of the average passenger car width, ensuring consistent identification of entry and exit times across interactions. A vehicle was considered to have entered the conflict zone when its tracked reference point crossed the buffer boundary and exited when the reference point completely cleared the buffered region. PET values were then computed using the timestamps extracted from the trajectory data.
In addition to PET, entry speed and circulating speed were extracted to capture the dynamic characteristics of interactions. Traffic exposure variables included entry volume and circulating volume, while geometric variables included entry width, entry angle, and width of the weaving section, central island diameter, and presence of a splitter island. These variables collectively represent behavioral, operational, and geometric influences on conflict formation and conflict severity.
Corresponding to every entry–circulating vehicle interaction, conflict zones were delineated as the geometric conjunction of the observed vehicle trajectories within the roundabout merging area. The conflict point corresponds to the location of minimum spatial separation between the entering and circulating paths. PET was calculated using the entry and exit times of the vehicles at this location. A fixed spatial buffer was applied around the conflict point to account for the vehicle dimensions and tracking uncertainty under mixed traffic. An approximate buffer radius limiting to half the average passenger car width was fixed. A vehicle was considered to have entered the conflict zone when its tracked reference point (i.e., front bumper or centroid) crossed the buffer boundary, and to have exited when it fully cleared the buffered area. Consistency among videos and enumerators in the laboratory was maintained using standardized extraction protocol, and all enumerators were trained using common sample footage. Uniform rules (e.g., conflict identification, reference point selection, and PET estimation) were followed. A random sub-set of interactions was cross-checked to verify the consistency and discrepancies, which were jointly resolved.
Conflict Severity Classification Using K-Means Clustering
Conflict severity classification was performed using an unsupervised k-means clustering algorithm applied to three standardized variables: PET, entry speed, and circulating speed. Before clustering, all variables were standardized using z-score normalization to remove scale differences and ensure equal contribution of each variable to the clustering process. The clustering analysis was conducted in R using the kmeans() function from the stats package, with cluster validation and visualization supported by the cluster and factoextra packages. Euclidean distance was used as the similarity metric, and multiple random initializations (nstart = 50) were applied to minimize the risk of convergence to local minima. The optimal number of clusters was determined through a combination of elbow method and silhouette analysis. The elbow method evaluated the reduction in total within-cluster sum of squares (WSS) across different values of k, while silhouette analysis assessed the average silhouette width to measure cluster cohesion and separation. Based on these criteria, k = 4 was selected as the optimal clustering solution. Following clustering approach, resulting clusters were interpreted post hoc as relative conflict severity levels. Conflict severity labels were assigned based on ordered centroid characteristics, where clusters with lower mean PET combined with higher entry and circulating speeds were interpreted as more severe, and clusters with higher PET and lower speeds were interpreted as less severe.
Random Forest (RF) Model Development
An RF classification model was developed to predict conflict severity using behavioral, traffic, and geometric variables. The model was implemented in R using the randomForest package. The dataset was divided into training (70%) and testing (30%) subsets using stratified random sampling to preserve the distribution of conflict severity classes.
The RF model consisted of 500 decision trees, each constructed using bootstrap samples of the training dataset. At each node split, a random subset of predictor variables was selected following the default √p rule, where p represents the total number of predictor variables. Node impurity was minimized using the Gini index, and final predictions were obtained through majority voting across all trees. Model performance was evaluated using accuracy, precision, recall, F1-score, and the AUC on the independent test dataset. Variable importance was assessed using the mean decrease in Gini index, which measures the cumulative reduction in node impurity contributed by each predictor variable across the forest.
Analysis and Results
The analysis focused on entry–circulating vehicle conflicts, because these interactions represent the dominant crash type at roundabouts, particularly in LMICs, where yielding non-compliance and heterogeneous vehicle behavior are prevalent.
Descriptive Statistics
Table 2 presents the descriptive statistics of the variables used in the analysis, based on 1,995 observed vehicle interactions at urban roundabouts operating under mixed traffic conditions.
Descriptive Statistics
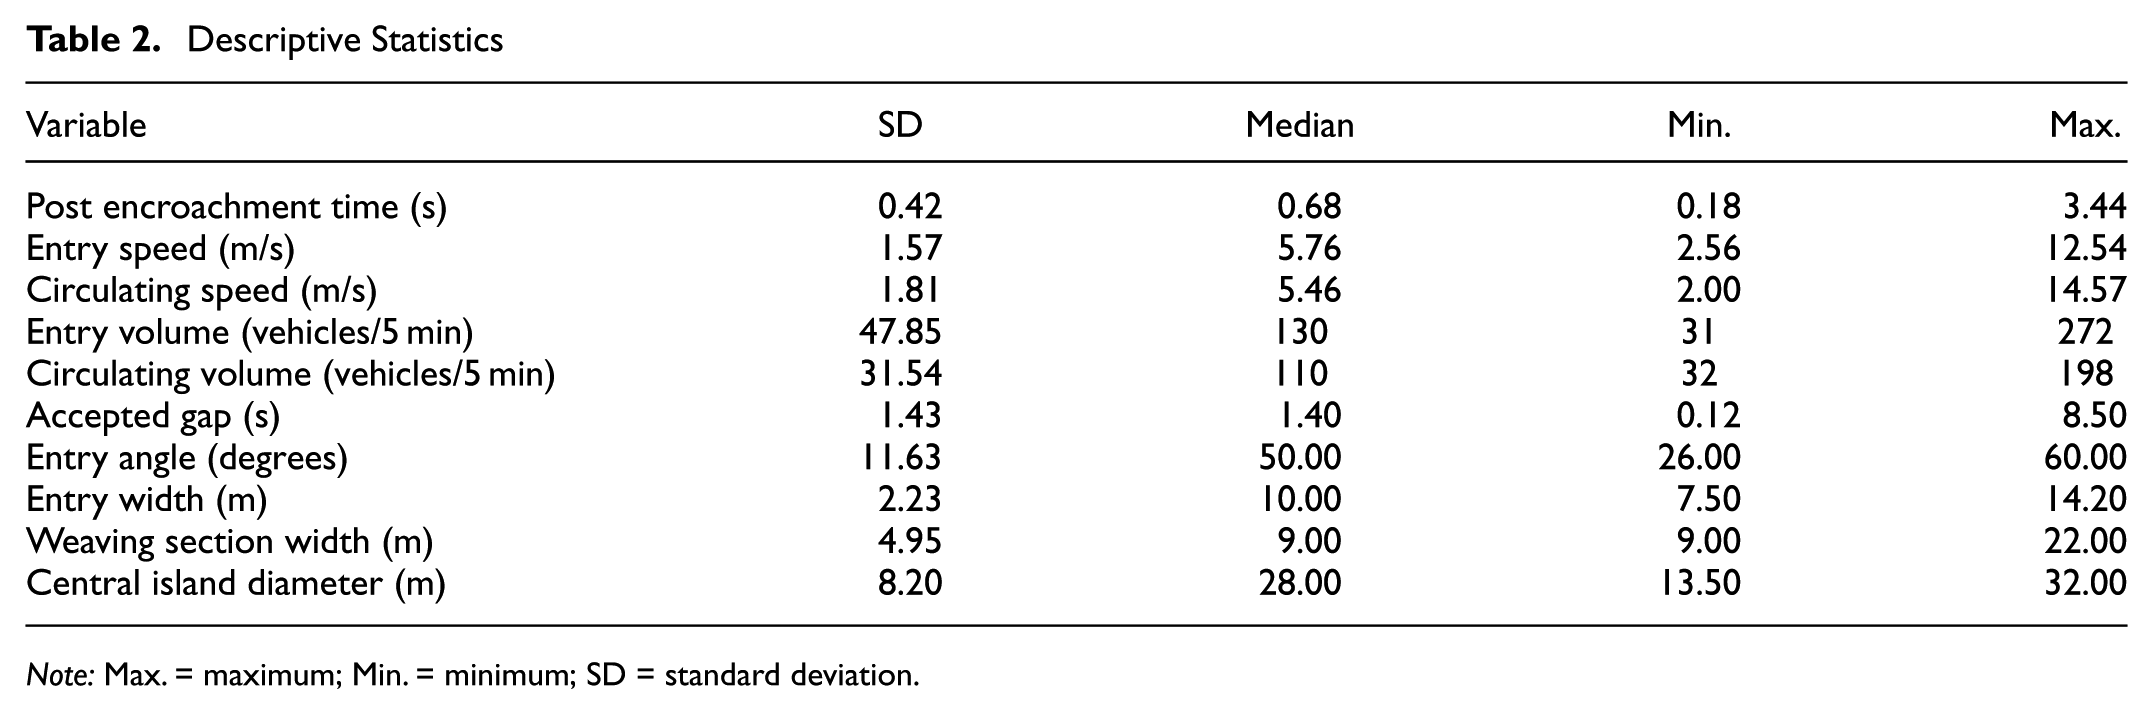
Note: Max. = maximum; Min. = minimum; SD = standard deviation.
Descriptive statistics of the variables used in the analysis indicate substantial variability in PET, speed, traffic volume, and geometric characteristics across observed interactions. PET values ranged from 0.18 to 3.44 s, reflecting a wide range of temporal proximity conditions. Entry and circulating speeds exhibited moderate dispersion, while traffic volumes varied considerably across sites, highlighting heterogeneous operating conditions. Overall, the descriptive statistics highlight the heterogeneous nature of traffic, behavioral, and geometric conditions at the studied roundabouts and provide a strong empirical foundation for the subsequent clustering and machine-learning-based conflict severity analysis.
Clustering Analysis and Conflict Severity Classification
To determine the optimum number of clusters for the classification of conflict severity, an unsupervised k-means clustering method was used in this study. Two commonly used validation methods—the elbow method and silhouette analysis—were applied to determine the optimum number of clusters.
The elbow method measures how much variation is reduced in the total WSS as the number of clusters (k) increases. As shown in Figure 3, WSS decreases rapidly when k increases from 1 to 4, signifying major improvements in cluster compactness. Beyond k = 4, the reduction of WSS starts to slow down, and the curve begins to flatten out. This inflection point, commonly referred to as the “elbow,” suggests that increasing the number of clusters beyond four yields diminishing returns in explaining data variability. Therefore, k = 4 represents a suitable balance between model complexity and cluster compactness.
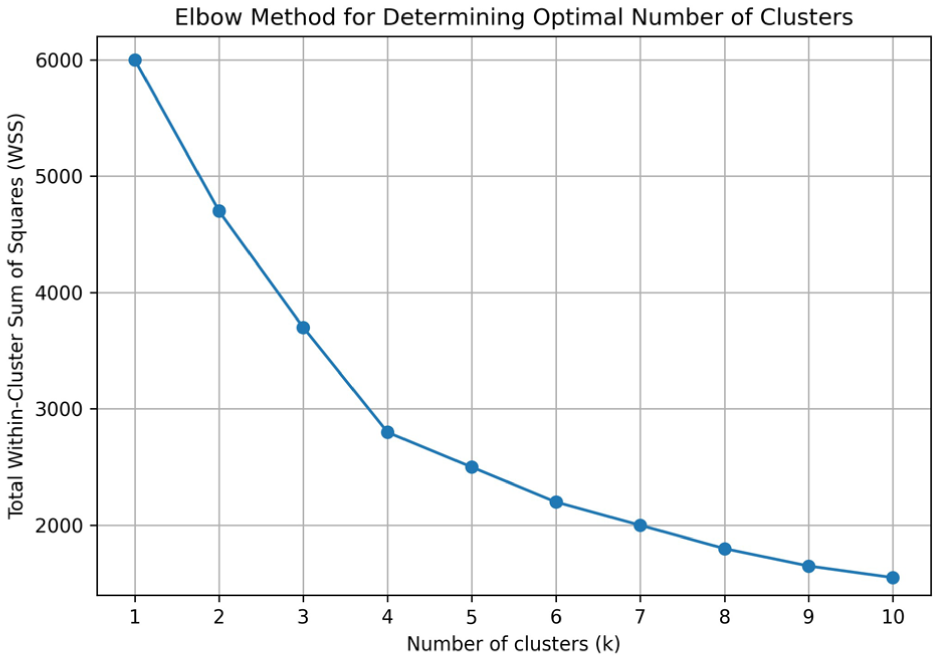
Elbow method for determining the optimal number of clusters in k-means clustering.
To further validate the selection of k, silhouette analysis was performed. The silhouette width measures how similar an observation is to its own cluster compared with other clusters. The larger the silhouette value, the more cohesive the cluster is internally and the more separated it is externally from the other clusters.
As shown in Figure 4, the average silhouette width reaches its highest value for a k = 4 grouping. This indicates that clusters formed with four groups have the highest amount of internal cohesion and external separation relative to other values of k. Although very similar values have been observed for larger k values, no significant improvement has been found in the cohesion/separation after k = 4. The elbow method confirms that four clusters sufficiently capture the inherent structure of the data, while silhouette analysis demonstrates that this configuration provides the most distinct and well-separated clusters. Therefore, four clusters were adopted for subsequent classification and interpretation of conflict severity levels.
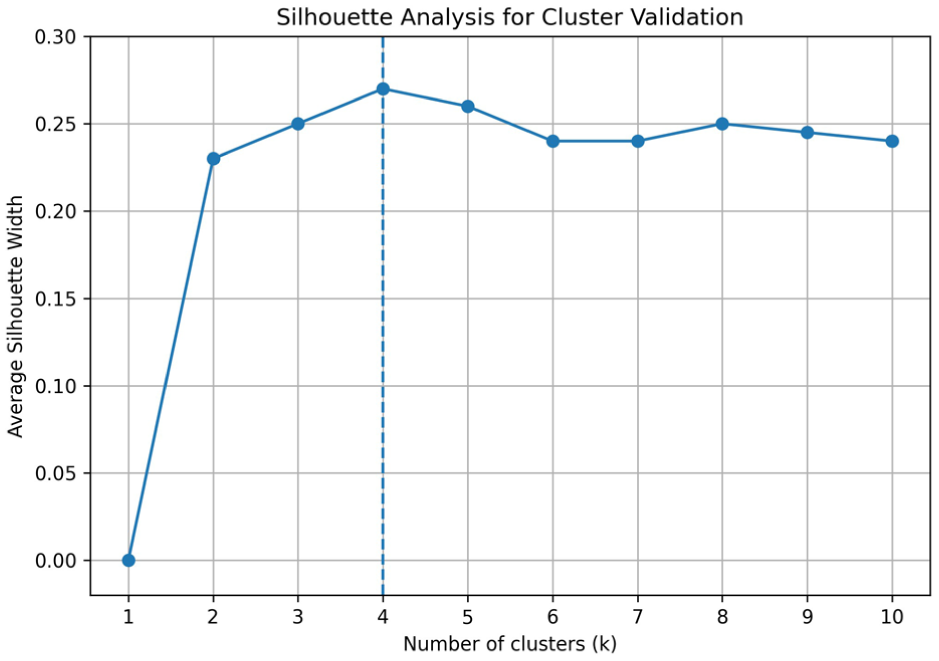
Silhouette analysis for cluster validation in k-means clustering.
The spatial distribution of the identified clusters was further examined using scatter plots in PET–entry speed and PET–circulating speed space, as shown in Figures 5 and 6, respectively. These visualizations reveal clear separation between clusters, with severe interactions concentrated in regions characterized by low PET combined with higher speeds, while safer interactions occupy regions with larger PET values and moderate speeds. Clustering analysis identified four clear clusters of vehicle interactions based on the unique combination of PET and speed variables. The characteristics of the clusters were determined using their centroids, which represent the average values of PET, entry speed, and circulating speed for each cluster. Centroid values are summarized in Table 3.
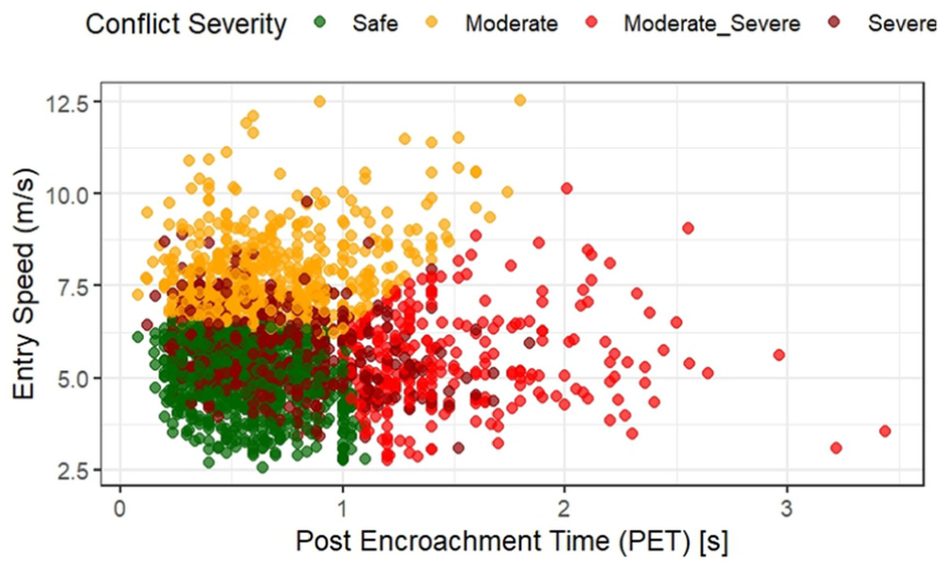
Scatter distribution of vehicle interactions in post-encroachment time (PET)–entry speed space showing the clustering-based conflict severity categories.
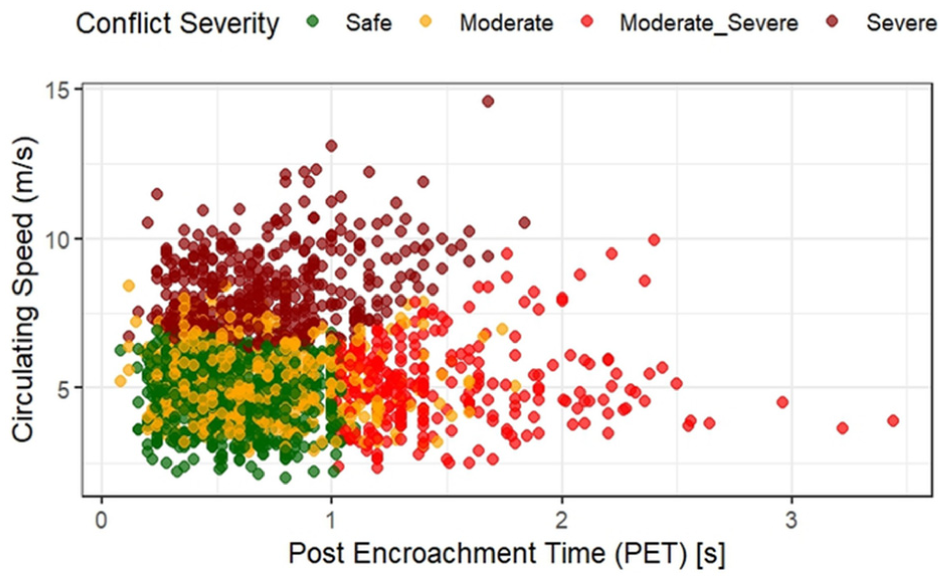
Scatter distribution of vehicle interactions in post-encroachment time (PET)–circulating speed space illustrating the separation of conflict severity clusters derived from k-means clustering.
Centroid Values of the Clusters
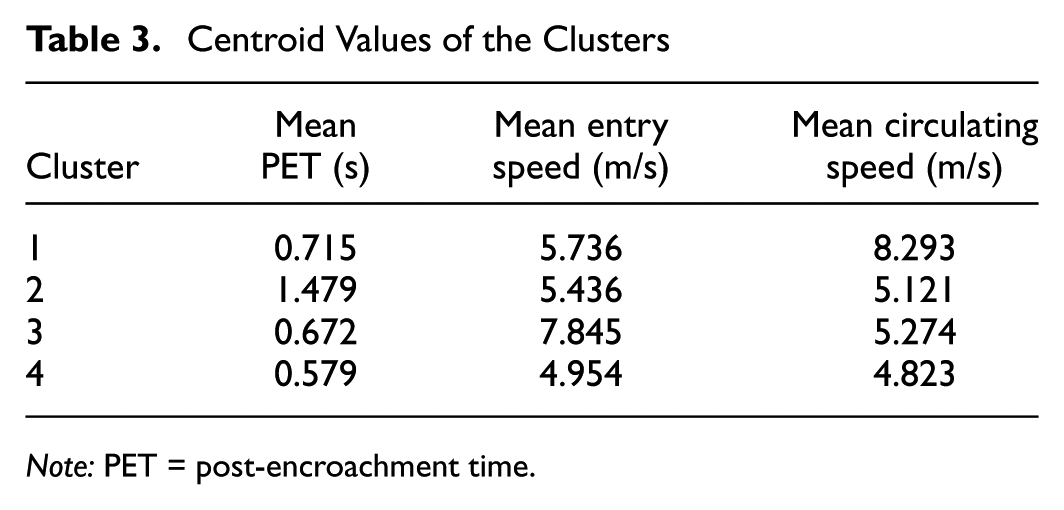
Note: PET = post-encroachment time.
Cluster 2 was classified as safe because of its highest mean PET values. Cluster 4 was rated as moderate, considering its low PET value with relatively lower values of entry and circulating speed. Low PET values for clusters 3 and 1 were combined with high entry speed and high circulating speed, which resulted in the classification of these clusters as moderate–severe and severe, respectively. This output of clustering implies that the conflict severity of conflicts at roundabouts is determined based on a combination of temporal proximity and speed-related behavioral factors, rather than PET alone. Interactions with similar PET values can exhibit substantially different conflict severity levels, depending on entry and circulating speeds.
Although four distinct clusters were identified through the unsupervised clustering analysis, the clusters were subsequently consolidated into two broader conflict severity categories for the purpose of predictive modeling. The clusters labeled “safe” and “moderate” exhibited relatively higher PET values and comparatively lower entry and circulating speeds, indicating interactions that generally represent normal operational conditions with limited crash risk. In contrast, the moderate-severe and severe clusters were characterized by lower PET values combined with higher entry or circulating speeds, reflecting interactions with a substantially greater potential for collision. Therefore, to facilitate a clear distinction between lower-risk and higher-risk interactions, the clusters were grouped into non-severe (safe and moderate) and severe (moderate-severe and severe) categories. This grouping also reduces class fragmentation and improves the stability of the subsequent supervised learning model.
Random Forest (RF) Model Performance
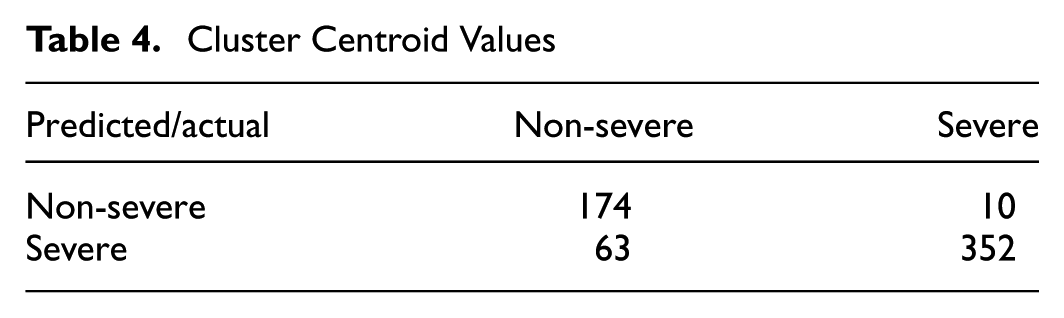
An RF classification model was developed to predict conflict severity using behavioral, traffic, and geometric variables. The four clusters identified through k-means clustering were consolidated into a binary outcome to distinguish between lower-risk and higher-risk interactions. Specifically, the safe and moderate clusters were grouped as non-severe conflicts, whereas the moderate-severe and severe clusters were grouped as severe conflicts. This binary classification structure enables the model to focus on identifying interactions with elevated crash potential while reducing class imbalance and improving classification robustness. The dataset was divided into training (70%) and testing (30%) subsets using stratified random sampling to preserve the distribution of conflict severity classes. The RF model demonstrated strong classification performance on the independent test dataset. The confusion matrix indicated that 526 out of 599 interactions were correctly classified, corresponding to an overall accuracy of 87.8%. The confusion matrix is shown in Table 4.
Cluster Centroid Values
The model achieved a precision of 0.85, indicating that a high proportion of interactions predicted as severe were, indeed, severe. The recall value of 0.97 shows the strong capability of the model in identifying severe conflicts. The corresponding F1-score of 0.91 reflects the robust balance between precision and recall. These results point toward the excellent ability of the model in capturing severe conflict situations, with only a very small number of severe conflicts misclassified as non-severe.
The receiver operating characteristic (ROC) curve, showing class probabilities and created for further evaluation of the RF model, is presented in Figure 7. The model achieved an AUC of 0.91, showing that the RF model can effectively distinguish between severe and non-severe conflicts. This AUC value, being greater than 0.90, signifies that, over a wide range of decision thresholds, the RF model can distinguish between severe conflicts with high accuracy. Thus, it verifies the strength of the conflict severity classification framework proposed in this study.
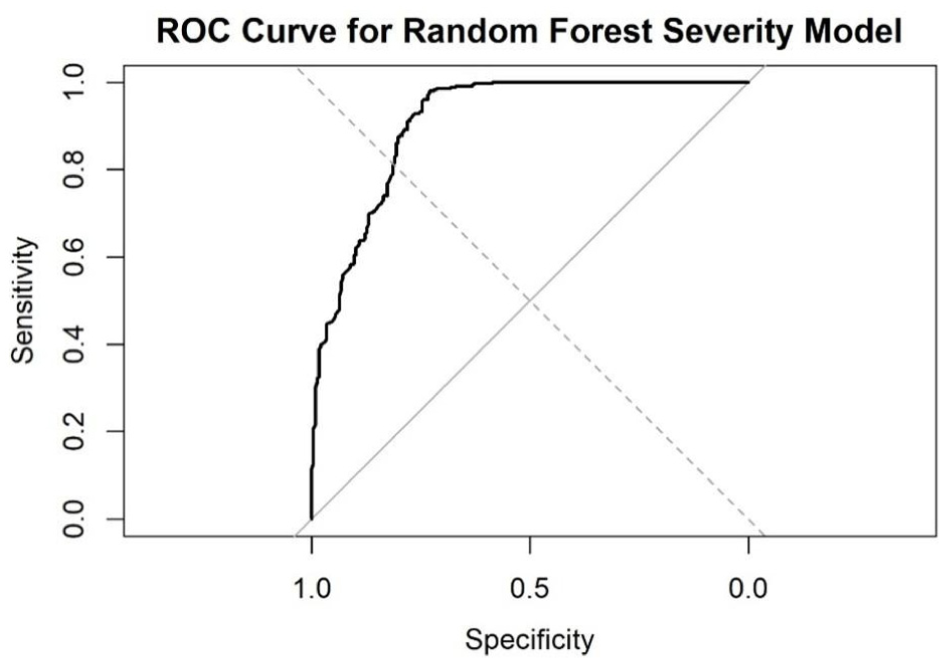
Receiver operating characteristic (ROC) curve evaluating the performance of the random forest classifier in distinguishing severe and non-severe conflicts.
A variable importance plot was constructed by applying the mean decrease in Gini index, using the sum of the reduction of node impurity over all trees in the forest for every predictor. The higher mean decrease in Gini for a variable, the stronger its contribution to the classification of conflict severity. Figure 8 shows the variable importance plot of the RF model according to the mean decrease in Gini index.
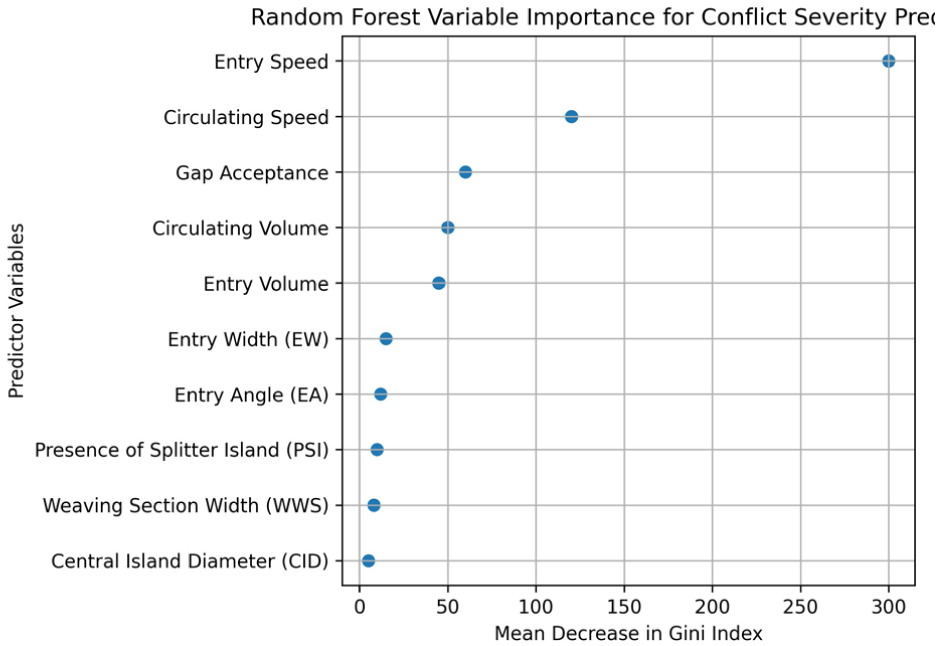
Variable importance plot for the random forest model based on mean decrease in Gini index.
Entry speed was the strongest predictor of conflict severity, followed by circulating speed. This highlights the role of speed-related behavioral factors in determining the conflict severity of interactions at roundabouts. The next most important variable was gap acceptance, underlining the contribution of driver decision-making during merging maneuvers. Traffic exposure variables (e.g., entry and circulating volumes) showed moderate importance reflecting increased interaction opportunities under higher demand conditions. Geometric parameters (e.g., entry width, entry angle, weaving width, and central island diameter) resulted in comparatively lower importance.
Shapley additive explanations (SHAP) were used to quantify the contribution of each predictor variable to the model predictions. SHAP values represent the marginal contribution of a variable to the predicted probability of severe conflicts while accounting for interactions among predictors. The SHAP analysis confirmed the dominant role of entry speed and circulating speed in determining conflict severity. Higher entry speeds consistently produced positive SHAP values, indicating an increased probability of severe conflicts (Figure 9). Similarly, higher circulating speeds also contributed positively to the likelihood of severe interactions.
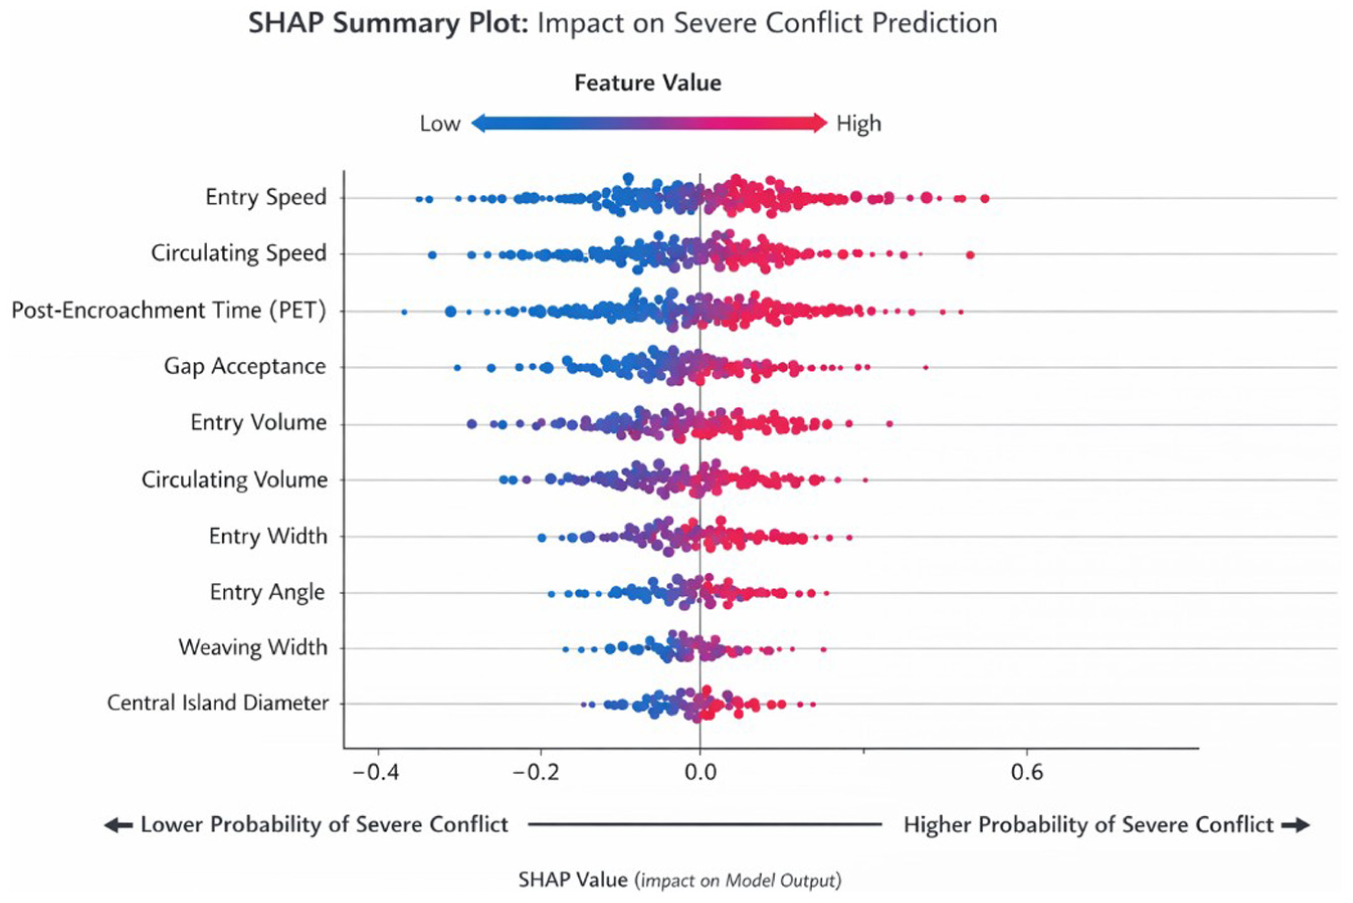
Shapley additive explanations (SHAP) summary plot illustrating the global contribution of predictor variables to severe conflict prediction.
Conversely, larger PET values resulted in negative SHAP contributions, reflecting a reduced probability of severe conflicts because of greater temporal separation between interacting vehicles. Gap acceptance also exhibited a meaningful effect on conflict severity prediction. Smaller accepted gaps increased the likelihood of severe conflicts, highlighting the role of driver decision-making during entry maneuvers. Traffic exposure variables (e.g., entry and circulating volumes) demonstrated moderate positive contributions, suggesting that higher traffic demand increases interaction opportunities and conflict risk. Geometric variables (e.g., entry width, entry angle, weaving section width, and central island diameter) exhibited comparatively smaller SHAP magnitudes, indicating weaker direct influence on conflict severity relative to behavioral factors.
Discussion
Previous studies on roundabout safety have largely focused on identifying crash patterns, analyzing traffic conflicts using SMoS, or evaluating the effects of geometric design and driver behavior on safety performance. Mandavilli et al. and Polders et al. identified entering–circulating interactions as the most dominant crash mechanism at roundabouts, emphasizing that failures to yield and driver misjudgment during entry are major contributors to collision risk ( 17 , 18 ). The present study supports these observations by focusing specifically on entry–circulating conflicts and analyzing 1,995 vehicle interactions extracted from trajectory data. The findings reinforce earlier crash-based studies by demonstrating that these interactions remain the most critical safety concern at roundabouts, particularly under heterogeneous traffic conditions. However, unlike earlier studies that relied on historical crash data, the present research uses trajectory-based surrogate safety analysis, enabling the identification of near-miss interactions and behavioral dynamics that are often absent in crash databases.
Research employing SMoS has also demonstrated the importance of temporal proximity indicators such as PET for evaluating roundabout safety. For example, Shawky et al. and Hasanvand et al. used trajectory-based conflict analysis and reported that lower PET values are associated with higher conflict risk ( 12 , 28 ). The findings of the present study are consistent with these observations, as interactions with lower PET values were generally associated with more severe conflicts. However, the results further show that PET alone is insufficient to distinguish conflict severity levels, since interactions with similar PET values may exhibit different risk levels depending on vehicle speeds. The clustering analysis revealed that conflicts with low PET combined with high entry or circulating speeds correspond to severe interactions, whereas higher PET values combined with moderate speeds represent safer interactions. This finding extends previous research by demonstrating that conflict severity is determined by the joint influence of temporal proximity and speed characteristics rather than PET alone.
Despite these similarities, the present study introduces several methodological and analytical advancements over existing research. Previous studies often relied on fixed threshold values of PET or TTC to classify conflict severity, which can oversimplify safety interpretation in heterogeneous traffic environments. In contrast, the present research introduces a data-driven conflict severity classification framework based on unsupervised k-means clustering, allowing conflict severity levels to emerge directly from observed trajectory data without predefined thresholds. The descriptive statistics show considerable variability in traffic interactions, with PET values ranging from 0.18 to 3.44 s, while entry speeds varied between 2.56 and 12.54 m/s and circulating speeds varied between 2.00 and 14.57 m/s. This variability reflects the heterogeneous operating conditions typical of roundabouts in LMICs and highlights the limitations of relying solely on fixed surrogate safety thresholds for conflict severity assessment. The clustering analysis identified four distinct conflict patterns, where the safest cluster exhibited the highest mean PET (1.479 s) and relatively lower speeds, while clusters with lower PET values (0.579–0.715 s) combined with higher entry or circulating speeds corresponded to moderate-severe and severe interactions. These results indicate that interactions with similar PET values may exhibit significantly different risk levels depending on vehicle speeds, reinforcing the need to integrate speed-based indicators into conflict severity analysis. The clustering analysis identified four distinct conflict patterns—safe, moderate, moderate-severe, and severe—based on combinations of PET and vehicle speeds, revealing more nuanced distinctions between interaction types than threshold-based methods.
Another important contribution of the study lies in the integration of unsupervised learning and supervised machine learning for conflict severity prediction. While previous studies have used machine learning models for traffic safety analysis, they typically rely on predefined conflict severity labels or simulated data. In contrast, the present study first derives conflict severity categories through clustering and then uses these categories to train a RF classifier incorporating behavioral, traffic, and geometric variables. The model achieved an overall classification accuracy of 87.8% and an AUC value of 0.91, demonstrating strong predictive capability for identifying severe conflicts. This combined clustering–machine learning framework provides a robust and interpretable approach for proactive safety assessment in environments where reliable crash data are limited.
Conclusions
This study examined the factors contributing to the conflict severity of entry–circulating vehicle conflicts at roundabouts in India. The conflicts were estimated using PET (an SMoS). Earlier studies have proposed a fixed PET threshold value to differentiate severe conflicts and non-severe conflicts, leading to inadequate conclusions. In view of this, the present study integrates unsupervised clustering with explainable machine learning; the framework avoids arbitrary conflict severity thresholds while providing interpretable insights into the factors influencing severe conflicts. For this purpose, entry–circulating vehicle conflicts were observed at eight arms from three roundabouts using PET.
To identify the appropriate number of clusters for classifying conflict severity, an unsupervised k-means clustering approach was adopted. Two widely accepted validation techniques—the elbow method and silhouette analysis—were employed to determine the optimal value of k. The clustering analysis resulted in four distinct groups of vehicle interactions, each characterized by unique combinations of PET and speed variables. Observed PET values ranged from 0.18 to 3.44 s, while entry and circulating speeds ranged from 2.56 to 12.54 m/s and 2.00 to 14.57 m/s, respectively. The four clusters were classified as safe, moderate, moderate–severe, and severe conflicts. For further model development using RF these clusters were grouped into two categories for the purpose of binary classification: the safe and moderate conflicts were categorized as “non-severe” conflicts, and moderate–severe and severe conflicts were categorized as “severe” conflicts. An RF classification model was developed to predict conflict severity using behavioral, traffic, and geometric variables, by dividing the dataset into training (70%) and testing (30%). The RF model demonstrated strong classification performance on the independent test dataset, achieving an accuracy of 87.8%. The RF model with an AUC value of 0.91 clearly distinguishes severe and non-severe conflicts.
From the variable importance plot, entry speed emerged as the top predictor of conflict severity, followed by circulating speed. Gap acceptance was identified as the next most important variable, highlighting the contribution of entering drivers’ decision-making during merging maneuvers. These findings highlight the central role of speed and behavioral factors in conflict severity and support the use of SMoS for proactive safety evaluation in regions where crash data are limited. The variable importance plot clearly identifies the relative contribution of predictors to conflict severity, but it does not provide information on the direction or nature of their effects.
Despite these contributions, several limitations should be acknowledged. The data collection and study design involve several limitations that should be considered when interpreting the results. The dataset was derived from videographic observations at three urban roundabouts in Bhopal, India, covering 15 entry legs, which may limit the spatial generalizability of the findings to other regions with different traffic compositions or geometric configurations. Data were collected during weekday peak periods (09:00–12:00 and 15:00–18:00) on Tuesday–Thursday in November, 2023, and, therefore, variations in driver behavior during weekends, off-peak periods, or night-time conditions were not captured. The dataset consisted of approximately 48 h of video recordings, with 3–4 h of observation per entry leg. Videos were recorded using surveillance cameras operating at 24–30 fps (0.03–0.04 s temporal resolution), which may introduce minor timing uncertainties in PET estimation. Mixed traffic conditions occasionally caused occlusion effects, and, from roughly 3,000 identified interactions, 1,995 complete interactions were retained for analysis.
Footnotes
Acknowledgements
The authors would like to express sincere gratitude to the Department of Traffic Police, Bhopal, for providing video data for this study.
Author Contributions
The authors confirm contribution to the paper as follows: study conception and design: S. Datta; data collection: S Datta; analysis and interpretation of results: S. Datta, S. Marik; draft manuscript preparation: S. Datta, S. Marik. All authors reviewed the results and approved the final version of the manuscript.
Declaration of Conflicting Interests
The authors declared no potential conflicts of interest with respect to the research, authorship, and/or publication of this article.
Funding
The authors received no financial support for the research, authorship, and/or publication of this article.