






Abstract
Although autonomous vehicles leverage perceptual information to execute downstream tasks such as prediction and control to enhance driving safety, they are vulnerable to cyberattacks. Attackers can manipulate model outputs by tampering with inputs. This study proposes a Counterfactual Generation Trend Attack (CGTA) framework for predicting rear-end collision risk. It manipulates inputs within the Key Feature Region using an optimization algorithm, aiming to either elevate (increase attack) or degrade (decrease attack) the predicted driving safety. Furthermore, considering scenarios involving partial knowledge stealing where model parameters are inaccessible, an attack scheme based on model distillation is proposed. After processing trajectory data and quantifying rear-end collision risk, experiments were conducted on three mainstream prediction models. The results demonstrate that: (1) CGTA can effectively execute real time targeted attacks. Simultaneously, the resistance to attack varies under attack directions and models. The deviation of model outputs from ground truth was from 2.87% to 54.75% under increased attacks and from −3.29% to −86.62% under decreased attacks; (2) the multi-head attention (MHA) exhibited superior attack resistance. The attack effects of the prediction models reduced by 41.69% to 86.10% after incorporating MHA; and (3) although the attack effectiveness under partial knowledge stealing decreased, it realized the target attack trend. In addition, this study provides a detailed sensitivity analysis of the parameters and verifies the generalization of the CGTA. The findings reveal the feasibility and effect mechanisms of targeted cyberattacks on autonomous driving systems, while offering theoretical support for defense against such attacks.
Introduction
The onboard system of autonomous vehicles (AVs) integrates modules for perception, prediction, and decision-making. After sensing the motion of surrounding vehicles using sensors such as cameras and radars, the information is used for tasks such as trajectory and driving risk prediction, and the vehicle’s control is optimized ( 1 ). Previous studies have demonstrated that AVs generally outperform human-driven vehicles (HVs) for safety, efficiency, and comfort ( 2 , 3 ). However, an AV is potentially vulnerable to malicious cyberattacks ( 4 – 7 ). Tampering with perceptual data can affect the functionality of other modules in autonomous driving, leading to cascading failure ( 8 ). Prediction serves as the bridge connecting perception with decision-making and control, and is simultaneously a primary target for hacker attacks. By analyzing the feature-mapping relationships of the prediction model, attackers can manipulate model outputs using targeted input tampering, affecting driving safety ( 9 ). Rear-end collisions during car-following are among the most prevalent types of accidents ( 10 ). Furthermore, because of the angular limitations of sensor signal reception, car-following carries a higher risk of being attacked ( 11 , 12 ). This study will investigate the effect of targeted cyberattacks on rear-end collision risk prediction and discuss attack mitigation strategies.
The onboard system contains numerous electronic control units (ECUs) that record and transmit data. The Controller Area Network (CAN) protocol enables coordinated control of vehicles via multiple ECUs. As the broadcast transmission, ID-based priority scheme, and available interface characteristics of the CAN protocol in AVs, AVs are vulnerable to malicious attacks ( 13 ), which will affect the application of AV’s artificial intelligence (AI) models. Grosse et al. classified AI model attacks into three types ( 14 ): (1) poisoning attacks. Malicious samples with specific labels are injected during the training phase, ultimately degrading the model’s overall performance or its performance on specific samples; (2) model stealing. By stealing model parameters or the inputs and outputs, the goal of stealing the model’s knowledge mapping information is achieved; and (3) evasion attacks. By tampering with model inputs to change model outputs, which can be divided into random attack and targeted attack. Random attacks add random noise to inputs, which can degrade model performance, but cannot control outputs. A targeted attack modifies specific inputs to obtain a desired output by analyzing model information (model stealing).
Among these, evasion attacks directly affect model outputs and are highly operable, making it a current research focus in cybersecurity. Adding noise with a specific distribution to perceptual data is a common approach in modeling cyberattacks ( 15 ). For instance, Li et al. examined the effects of slight cyberattacks on longitudinal safety using the California Partners for Advanced Transit and Highways (PATH) Connected and Automated Vehicle (CAV) model, introducing random perturbations from 0.1% to 20% in perceived speed and position ( 16 ). Similar to cyberattacks, they also add noise of varying intensity and form to the lane-change intention prediction model, analyzing the effects of perturbations on different input features on prediction results and the robustness of the models ( 17 ). Furthermore, some studies have designed targeted attack targets. For example, Wang constructed a strategic malicious tampering attack framework based on mathematical car-following models, deteriorating traffic flow dynamics and energy efficiency while maintaining attack stealthiness ( 18 ). Zhang et al. generated perturbed trajectories by maximizing the error in predicted trajectories at the attack time steps, and employed data augmentation and trajectory smoothing techniques to mitigate the effect of attacks ( 19 ).
The defensive strategies against malicious attacks are generally developed from the following two aspects: (1) improving the information transmission protocol. For example, Nilsson et al. proposed a delayed data authentication strategy using compound message authentication codes (MACs), dividing the 64-bit MAC into four 16-bit blocks and transmitting them in four frames ( 20 ). This strategy can detect and resist injection and modification attacks. Woo et al. demonstrated the feasibility of conducting long-range wireless attacks on connected vehicles and designed a security protocol through optimizing authentication delay and communication load ( 21 ). Ullah et al. introduced a blockchain-based trust management system for Vehicular Ad Hoc Networks (VANETs) that leverages blockchain technologies to enhance privacy during in-vehicle information transmission ( 22 ). Chen et al. also designed an authentication protocol based on blockchain technology to enhance the security of data transmission in intelligent transportation systems, and verified its lightweight and robustness ( 23 ); and (2) designing intrusion detection systems (IDS) to detect attacks. Classical deep learning algorithms, such as convolutional neural networks (CNNs) ( 24 ), Long Short-Term Memory (LSTM) ( 25 ), convolutional neural networks–Long Short-Term Memory (CNN–LSTM) ( 26 ), and Transformer ( 27 ), have been widely applied in this domain. Simultaneously, the ensemble-based frameworks are proposed to detect attacks. For instance, Ullah et al. used multiple machine learning models to construct the IDS and compared the effectiveness of three ensemble techniques: (1) stacking; (2) bagging; and (3) voting ( 28 ). Meanwhile, the construction of the IDS has matured, and the detection rate for various attack types on mainstream data sets has approached 100% ( 29 , 30 ).
Because of the scarcity of traffic accidents, Surrogate Safety Measures (SSMs) are widely employed to quantify driving risk ( 31 ). According to model outputs, there are two primary prediction forms: (1) risk status prediction; and (2) risk sequence prediction. Risk status prediction outputs a discrete safety level, with safety thresholds determined using clustering algorithms or empirical values ( 32 , 33 ) (2). Considering the evolutionary nature of driving risk ( 34 , 35 ), sequence prediction outputs continuous driving risk over prediction horizons. Experimental results demonstrated that sequence prediction outperforms status prediction in precision and informational richness ( 36 , 37 ).
In the practice of end-to-end autonomous driving architecture, driving safety control relies on the predicted information, and accurate driving risk prediction is crucial for ensuring driving safety ( 38 , 39 ). As mentioned previously, attackers can manipulate inputs to obtain specific outputs, affecting driving safety. For instance, misleading the model into predicting safe status during hazardous conditions may cause a collision. Simultaneously, false danger signals can induce AVs to execute nonessential braking ( 40 ).
Although cyberattacks and driving safety prediction have been widely studied, the following three research gaps remain: (1) although there have been many studies on cyberattacks in car-following, most are based on random attacks and mathematical car-following models. The attack framework of targeted attacks on end-to-end rear-end collision risk prediction models remains to be explored. Meanwhile, the resistance of different prediction models to cyberattacks also needs to be analyzed; (2) different input regions exert varying influences on the outputs. Although previous studies have analyzed the effect of perturbations across input features for end-to-end prediction models, they have not developed more refined algorithms for identifying critical input regions ( 17 ). Meanwhile, the practical effect of critical features identification algorithms in cyberattacks remains to be verified; and (3) since autonomous driving systems exhibit potential differences in their resistance to cyberattacks, differences exist in the accessibility of attackers to obtain model information ( 41 ). However, current cyberattack research typically assumes complete model information availability, neglecting scenarios with limited model stealing.
Addressing the aforementioned research gaps, this study makes the following three key contributions: (1) a Counterfactual Generation Trend Attack (CGTA) framework is proposed to analyze the effect of targeted cyberattacks on rear-end collision risk prediction, which can target increasing or decreasing the outputs of the risk prediction model. Experimental results and sensitivity analyses demonstrate that MHA is highly resilient against cyberattacks; (2) Key Feature Region (KFR) retrieval is proposed to identify critical regions within input features that significantly influence prediction outputs. By setting attack features and time step parameters, adjustable attack effectiveness is achieved; and (3) model information accessibility is comprehensively considered by the analysis and implementation of cyberattack strategies under both full knowledge stealing (FKS) and partial knowledge stealing (PKS). In PKS, the attacker can obtain external inputs and outputs, but cannot access the model’s internal parameter information. Meanwhile, a distillation-based attack strategy in PKS was designed, and the experimental results verified the effectiveness of CGTA in FKS and PKS.
The framework of this study is shown in Figure 1. First, car-following samples of AVs following HVs are extracted from the trajectory data set, with car-following safety quantified and a prediction format established. Then, the prediction model and attack environment are constructed. Three mainstream prediction models are selected, and the Shapley Additive exPlanations (SHAP) is employed to identify the KFRs exerting significant influence on the outputs. The attack strategies under both FKS and PKS are proposed. Then, a counterfactual generation optimization algorithm is used to manipulate input features, achieving targeted attacks that increase or decrease the predicted driving safety sequence. Finally, detailed discussions are conducted on attack effectiveness, parameter sensitivity, and mitigation strategies.
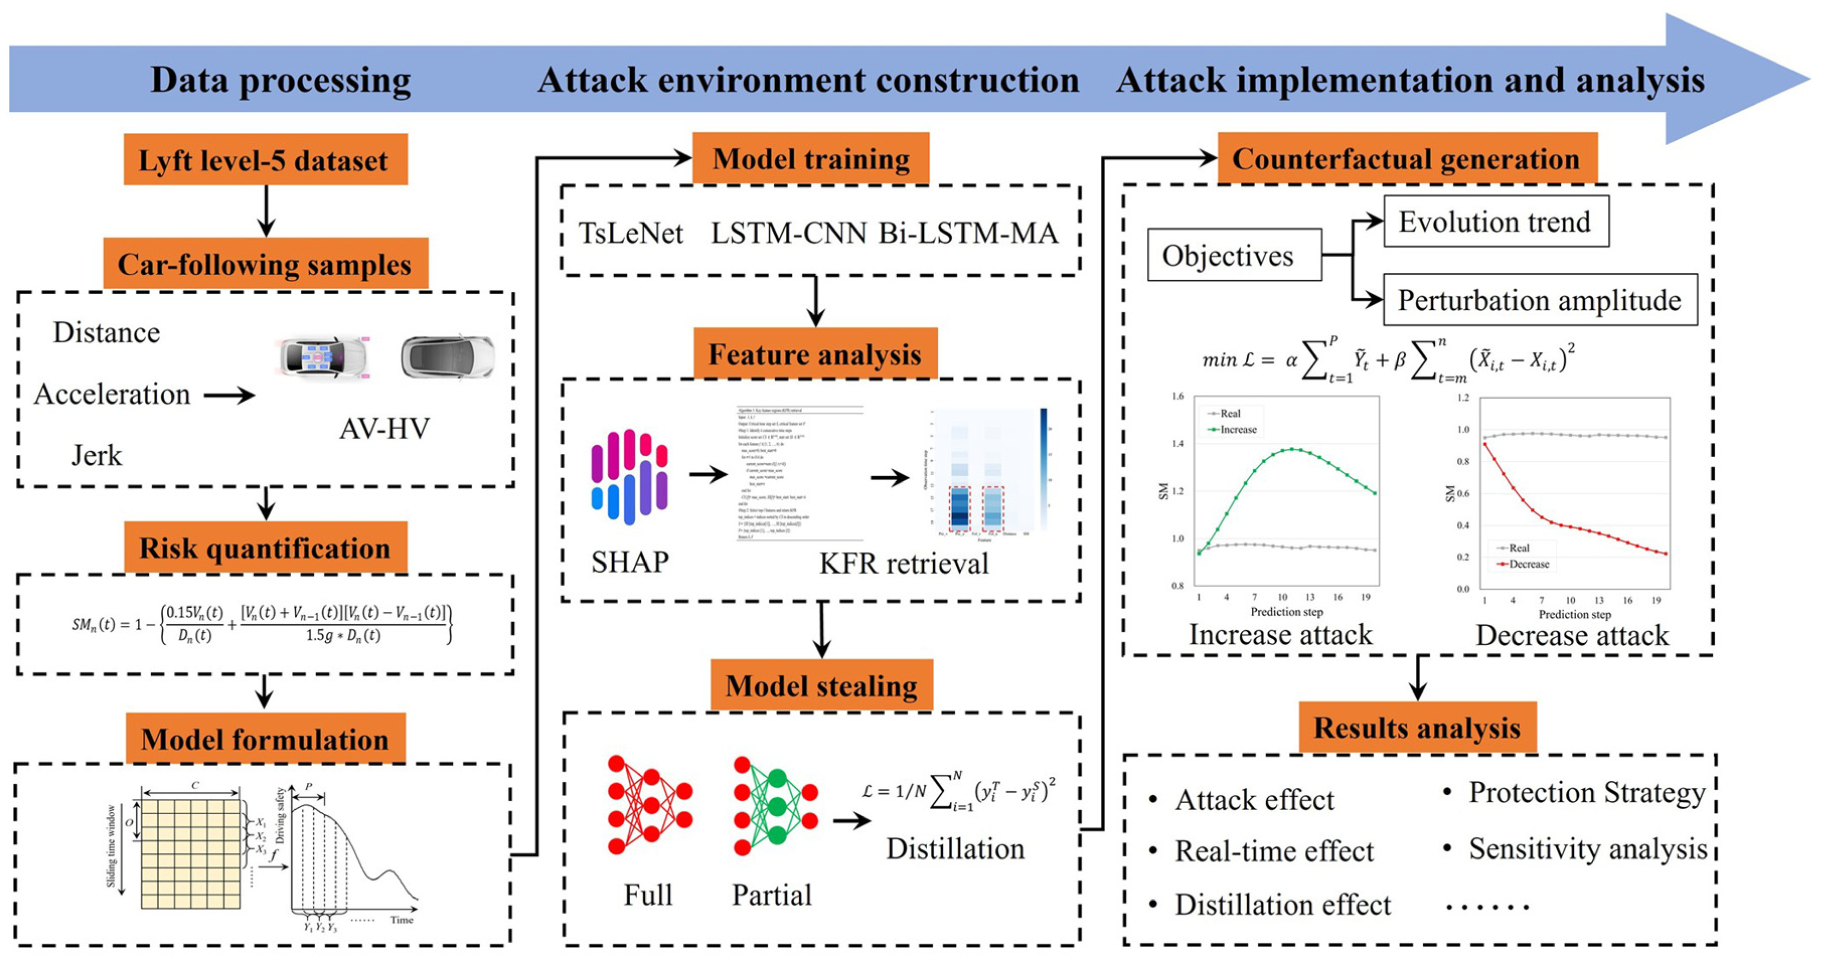
Research framework.
Problem Formulation
Rear-End Collision Risk Prediction
As shown in Equation 1, the rear-end collision risk prediction can be formulated as a regression problem, where

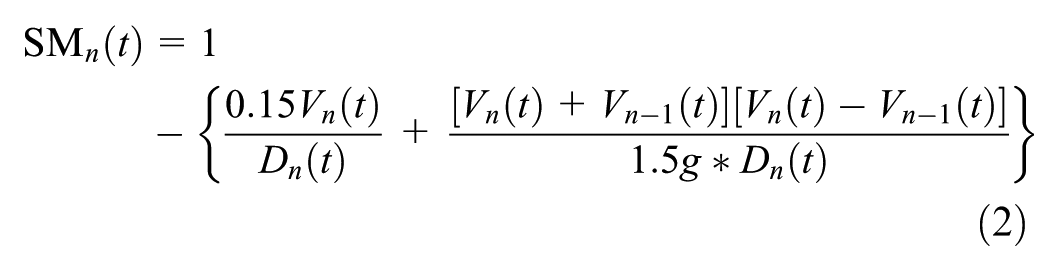
Referencing previous research in car-following behavior modeling ( 42 ), the leading vehicle velocity (Pre_v), leading vehicle acceleration (Pre_a), following vehicle velocity (Fol_v), following vehicle acceleration (Fol_a), car-following distance (Distance), and rear-end collision risk are selected as inputs. Meanwhile, the safety margin (SM) was applied to quantify rear-end collision risk ( 43 ), and experiments demonstrated its superior performance in quantifying forward collision risk compared with other SSMs ( 44 ). The SM calculation follows Equation 2, where V n and Vn−1 represent the following and preceding vehicle velocities, respectively, D n represents the car-following distance, and g represents the gravitational acceleration (9.8 m/s2). Higher SM values indicate greater operational margin during hazardous situations, thereby enhancing driving safety. Considering input information redundancy and the prediction timeliness, both O and P are set to 4 s ( 37 ).
This study adopts deep learning-based data-driven models to construct a mapping relationship from a historical sequence of six input features to a future rear-end collision risk sequence. Although there is inevitably a correlation between input features, data-driven models possess the nonlinear fitting capability to capture interactive relationships among multiple features. Therefore, data-driven prediction models omit the feature correlation analysis, avoiding the potential dilemma of feature selection.
CGTA Framework
Because of the AV system’s potential vulnerability, attackers can steal information from prediction models. By analyzing the input–output mapping relationship f, they can achieve intended attack objectives using input tampering. The CGTA framework primarily consists of three steps: (1) model stealing; (2) feature analysis; and (3) counterfactual generation.
Model Stealing
Given potential variations in model information accessibility, this study categorizes model stealing into FKS (full model information, including inputs, outputs, and internal parameters) and PKS (only obtaining inputs and outputs). Under FKS, attackers can directly perform feature analysis and counterfactual generation using the onboard prediction model. Under PKS, a student model fs is trained via model distillation using inputs and outputs from the onboard prediction model, and feature analysis and input optimization are conducted based on fs.
Feature Analysis
In time series prediction tasks, features at different time steps generally exhibit varying degrees of influence on outputs ( 37 ). Minor modifications to critical features at key time steps can significantly affect prediction results. To standardize feature tampering, the gradient-based model interpretability technique is employed to analyze feature importance in both the onboard prediction model and the distilled model. Tampering is restricted to important features at critical time steps, with the feature region size serving as an adjustable parameter to control the attack process.
Counterfactual Generation
Risk prediction influences the planning and control of autonomous driving. For instance, when models predict hazardous driving status, braking measures are implemented to ensure safety, whereas a predicted safe status prompts reduced braking restrictions to maintain efficiency. Aligned with this application logic for rear-end collision risk prediction, the increase and decrease attacks are proposed. The increase attack elevates predicted driving safety using input manipulation, while the decrease attack reduces it. Given the desired attack direction, optimization algorithms reconstruct the input, as detailed in subsequent sections.
Methodology
Identification of Key Feature Region
SHAP is widely used to interpret data-driven models ( 45 ). The gradient interpreter within SHAP serves as a feature attribution tool for differentiable models, effectively capturing the marginal contributions of inputs to predictions via gradient information while mitigating single-reference-value bias using background distribution sampling ( 46 ).
Assuming a data set with N samples, an SHAP value matrix
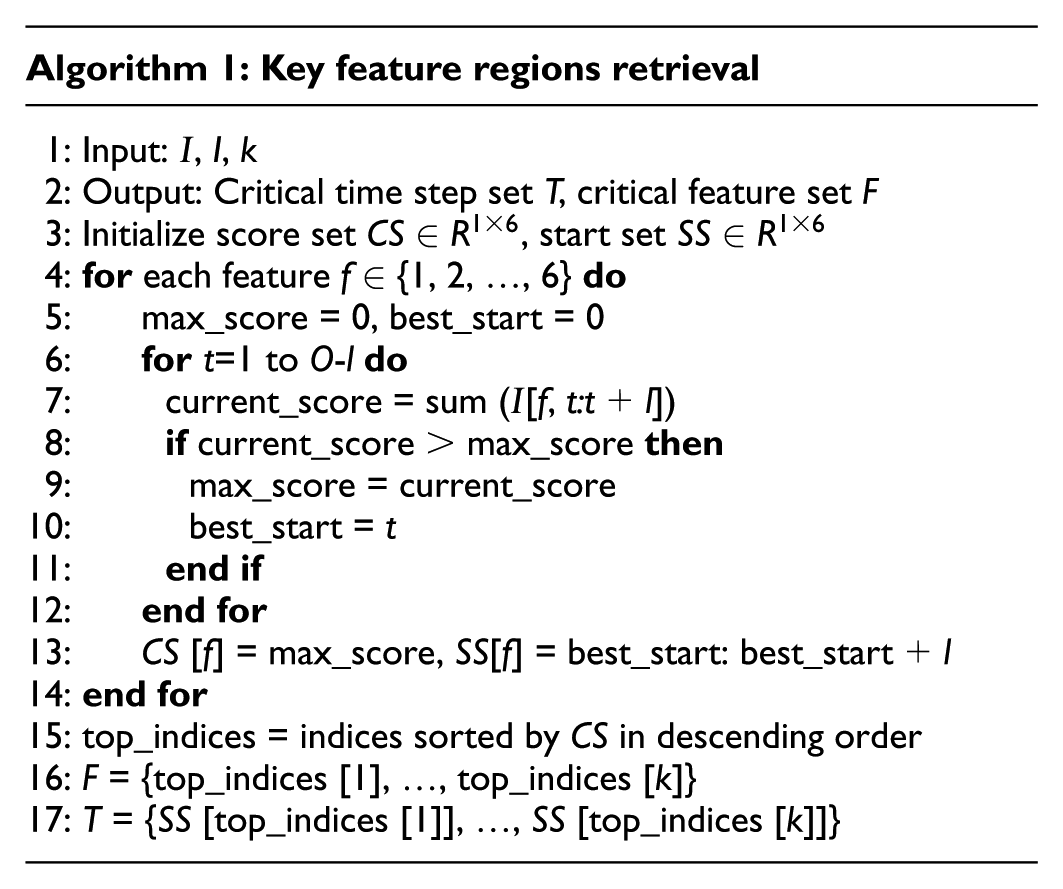
Notably, the KFR refers to the input region that significantly affects the output, regardless of the direction of influence. Based on identifying the KFR, the optimization algorithm can adaptively adjust the inputs within it. Although the SHAP value can indicate the direction of the input’s influence on the output, the complex risk-mapping relationship may lead to inconsistent signs of SHAP values for the same input region across different samples. The offset between positive and negative SHAP values can impede the identification of the KFR. Therefore, this study only employs the absolute SHAP value in the KFR identification process.
Counterfactual Generation Trend Attack
AV’s control algorithm typically operates based on fuzzy risk trends rather than detailed risk trajectories ( 32 , 39 ). Simultaneously, unlike previous studies that meticulously optimized outputs at each time step by modifying all features ( 9 ), CGTA achieves targeted trend attack by modifying only input features within KFR.
Assuming the KFR retrieval algorithm identifies the time steps m to n in the feature i as KFR, the optimization objective becomes obtaining an output sequence

As shown in Equation 4, the gradient descent-based algorithm is applied to optimize

Model Distillation
Model distillation is employed to extract the risk-mapping knowledge of the prediction model when the internal model parameter is inaccessible in PKS. Model distillation is a classical deep learning technique for model compression, aiming to train a smaller student model fs to learn the teacher model’s mapping knowledge f t while preserving comparable performance ( 47 ). Assuming attackers can obtain sufficient input–output data after invading the autonomous driving system, the student model is trained to fit these data, extracting as much knowledge as possible from the risk prediction model.
Attackers may lack access to ground truth labels during student model training; therefore, the training loss depends on the discrepancy between student and teacher model predictions (Equation 5), where

Prediction Models
To evaluate the effectiveness of CGTA, three mainstream prediction models are applied for attack experiments.
TsLeNet ( 37 ): Predicts a sequence of rear-end collision risks using a convolutional network backbone (Time-series LeNet) with an attention mechanism, outperforming mainstream models, such as Sequence to sequence attention (S2S-Att) and Transformer, in timeliness and precision.
LSTM–CNN ( 48 ): Employs separate LSTM and CNN encoders for feature extraction. After concatenating encoder outputs, it decodes predicted risk sequences. This parallel model fusion approach achieves optimal performance in the crash risk prediction task.
Bi-LSTM-MA ( 17 ): Processes driving feature sequences with an encoder–decoder Bi-directional LSTM (Bi-LSTM) architecture. After encoder feature extraction, an MHA ( 49 ) performs feature enhancement. This model demonstrates superior robustness to random noise in the lane-changing intention prediction task.
Data Set and Experiment Description
Mixed Driving Data Set and Car-Following Samples
Because of the advantages in sample size, duration length, and data quality, this study selects Lyft Level-5 for rear-end collision risk prediction research ( 50 ). Lyft Level-5 contains approximately 170,000 scenes, each lasting about 25 s at a 10 Hz, which satisfies the requirements for real time driving risk prediction. The data set documents the position and motion information of the AV and its surrounding vehicles. Based on constraints on lateral distance, heading angle, and velocity, Li et al. extracted various car-following pairs from Lyft Level-5 ( 51 ). Meanwhile, they adopted techniques such as imputation, Kalman filtering, and wavelet denoising to process the raw data and published the processed data (https://github.com/RomainLITUD/Car-Following-Dataset-HV-versus-AV). To compress data and eliminate data-recording bias, car-following samples extracted by Li et al. were further processed: (1) the mean filtering is applied to compress and smooth data to 5 Hz, referring to the trajectory data processing paradigm ( 52 ); (2) the thresholds for acceleration ([−8, 5] m/s2), jerk ([−15, 15] m/s3), and distance (> 7 m) are applied to filter samples ( 53 ). Finally, 4,701 AV–HV samples were selected from Lyft Level-5.
Experiments Setting
The data processing and model construction were implemented using Python 3.11 and PyTorch 2.2.1 framework on an Intel Core i7-14700KF CPU and NVIDIA GeForce RTX 4070 Ti SUPER GPU. Samples were divided into training, validation, and test sets at an 8:1:1 ratio. All models were trained for 100 epochs, with mean squared error used as the training loss, and Adam optimized network parameters. The model parameters from the epoch with the minimum validation loss were saved during training, and the final performance was evaluated on the test set. Grid search was applied to optimize the training parameters, with learning rates [0.01, 0.005, 0.001] and batch sizes [128, 256, 512]. Model structural parameters were configured referencing previous research.
TsLeNet: Convolutional kernel sizes set to 3 × 3 and 4 × 4 for two layers, with channel counts 16 and 32, respectively. The feature attention mechanism reduction coefficient was set to 16, and the loss attention mechanism was configured with an exponential decay coefficient of 100.
LSTM–CNN: The LSTM hidden layer dimension was set to 16 with two layers. The CNN parameters are identical to TsLeNet’s convolutional layers.
Bi-LSTM-MA: The hidden dimensions of the encoder and decoder were set to 16, with one layer. The attention head of MHA was set to 2.
LSTM served as the student model in model distillation, trained using the teacher model’s inputs and corresponding outputs from the training and validation sets. The LSTM parameter settings are consistent with those in LSTM–CNN. Training environments for the student model followed the aforementioned parameter configurations.
For attack algorithm parameters: the KFR retrieval time step l = 7 and feature number k = 2. Optimization epochs = 30,
Evaluation Metrics
As shown in Equation 6, the root mean square error (RMSE) was applied to evaluate the precision of rear-end collision risk prediction. Where y i , real and y i , pre represent the ground truth and predicted risk values at the ith output time step, respectively, and P represents the prediction time steps. Higher RMSE values indicate greater deviation between predicted and actual sequences, indicating poorer performance. The mean percentage error (MPE) provides an intuitive assessment of the direction and magnitude of prediction bias relative to ground truth (Equation 7), directly reflecting CGTA effectiveness.


Results and Discussion
Attack Effect in FKS
The KFR retrieval results are shown in Figure 2, a–c. Preceding and following vehicle accelerations consistently emerge as the two most important features across all models. For TsLeNet and LSTM–CNN, critical time steps are from 14 to 20, while Bi-LSTM-MA exhibits critical time steps from 10 to 16. Although the SHAP value distribution shows that the acceleration changes of the preceding and following vehicles play a dominant role in the prediction results, this does not necessarily mean that other features can be excluded from the input. Given the model’s feature requirement, LSTM models with six and two input features (the accelerations of the preceding and following vehicles) were applied to further analyze the influence of the features on prediction performance. The results show that the RMSE of the LSTM with six input features is 0.015, whereas that of the LSTM with two input features is 0.029. In fact, there exist obvious correlations among the input features. For instance, acceleration can derived from the velocity, and the SM can be calculated from other input features. Data-driven models can capture feature–temporal interactions and their mapping patterns with prediction during training, omitting the traditional procedures of correlation analysis and feature elimination.
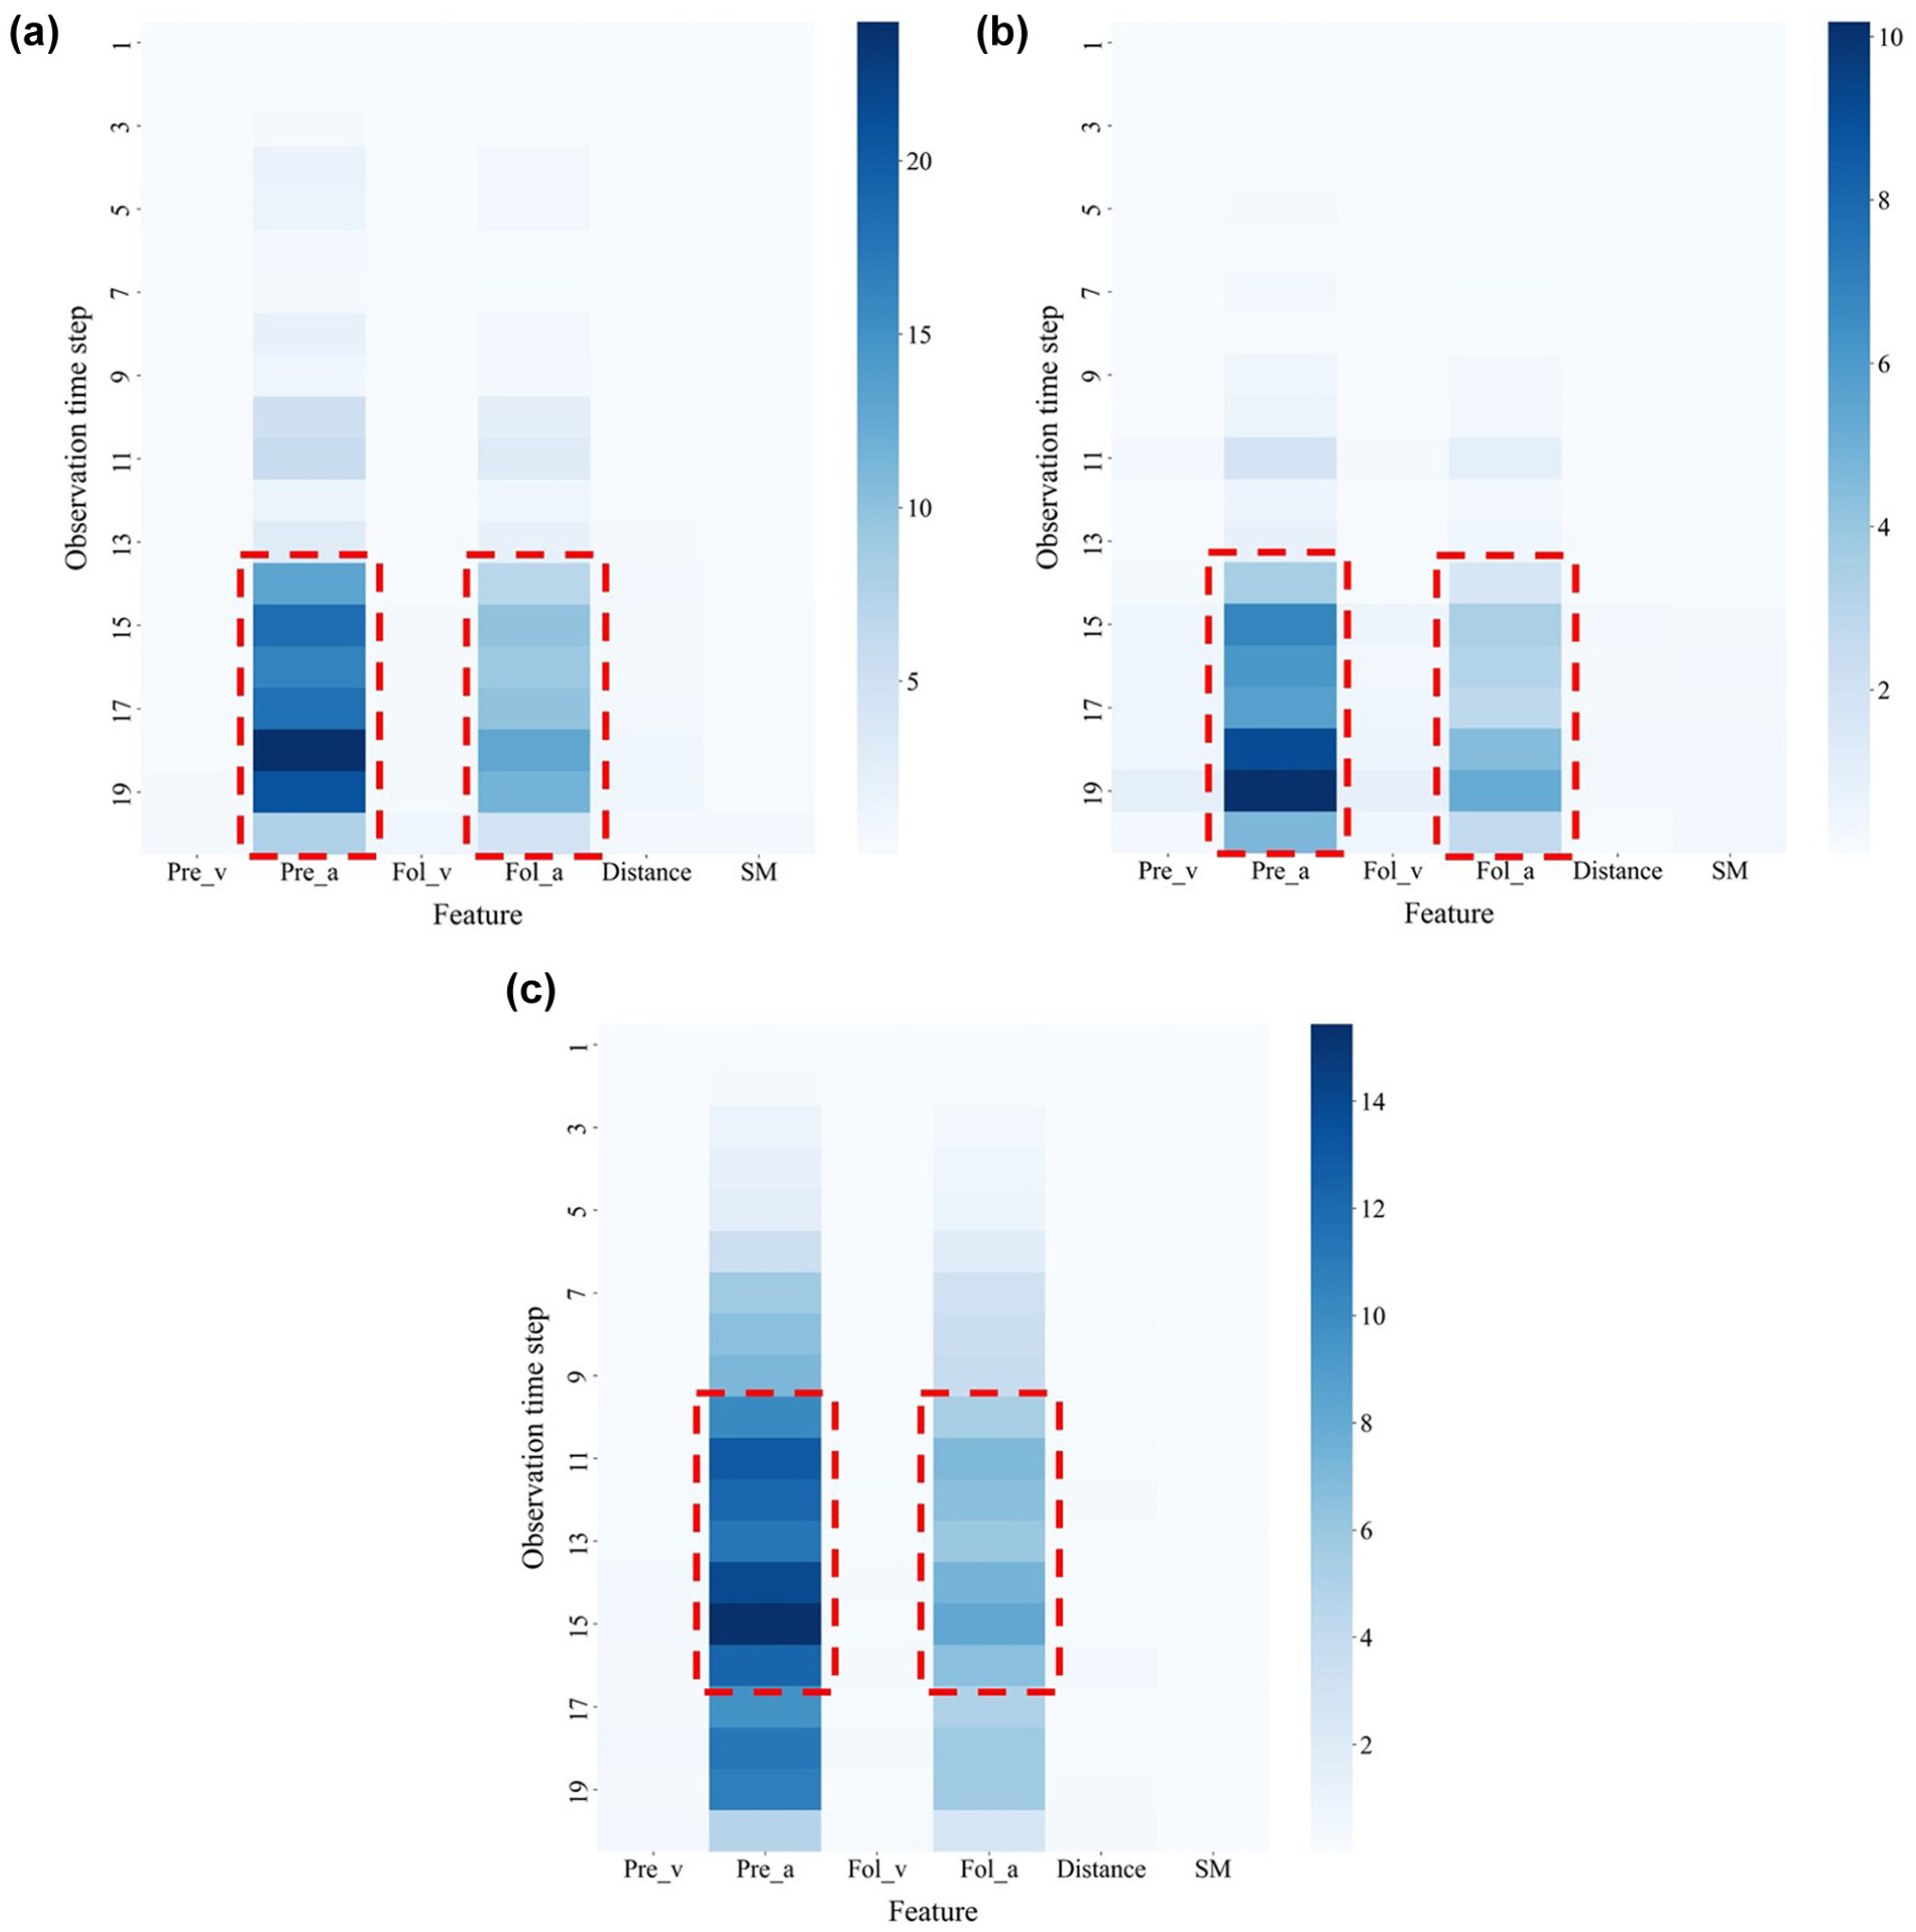
Retrieval results of KFR: (a) TsLeNet; (b) LSTM–CNN; and (c) Bi-LSTM-MA.
The GCTA was applied to the risk prediction models, and the prediction results are presented in Table 1. Three principal findings can be obtained from the results.
1. The CGTA effectively achieved targeted cyberattacks. Across all models, the non-attack state basically shows no directional bias, with MPE values near zero. In increase attacks, the MPE consistently exceeds zero, while under decrease attacks, MPE is below zero. This demonstrates the CGTA’s capability to control outputs toward specified directions. Figure 3, a and b , shows a prediction case under different attack states in TsLeNet. The prediction model achieves satisfactory performance in the absence of an attack, with actual and predicted risk sequences showing stable variation trends. Prediction sequence alterations align with attack objectives, as evidenced by the MPE values reaching 0.2794 for increase attack and −0.5426 for decrease attack. Meanwhile, both the original acceleration and the SM curve are smooth, reflecting that the aforementioned data processing steps can eliminate potential data noise and ensure the accuracy of risk prediction modeling.
Notably, compared with the original input, increase and decrease attacks exhibit symmetric patterns in feature manipulation. For instance, in attack samples, the increase attack significantly elevates the preceding vehicle’s acceleration at the final time step while reducing the following vehicle’s acceleration relative to the original value. In driving safety contexts, such modifications enhance driving safety. In contrast, the decrease attack displays opposite perturbation trends. At a specific input time step, increasing or decreasing feature values may have divergent effects on model outputs. Based on stolen risk-mapping knowledge, attackers can employ optimization algorithms to adjust KFR features, achieving targeted attack objectives adaptively.
2. Models exhibit heterogeneity in attack resistance. The CGTA successfully steers model outputs toward intended directions, but attack effectiveness varies significantly. LSTM–CNN shows the highest vulnerability, exhibiting MPE values of 0.5475 and −0.8662 under increase and decrease attacks, respectively. In contrast, Bi-LSTM-MA demonstrates minimal susceptibility with corresponding MPE values of 0.0287 and −0.0329, respectively. This disparity probably stems from Bi-LSTM-MA’s MHA mechanism, which globally fuses feature information. Meanwhile, TsLeNet uses squeeze-and-excitation blocks to weight feature dimensions, demonstrating superior robustness compared with LSTM–CNN. Therefore, incorporating feature fusion technologies may enhance model robustness against cyberattacks, and the effectiveness of MHA will be validated in the subsequent section.
3. Decrease attacks consistently outperform increase attacks. In TsLeNet, LSTM–CNN, and Bi-LSTM-MA, average MPE magnitudes for decrease attacks exceed those for increase attacks by 101.61%, 58.21%, and 14.63%, respectively. As shown in Figure 4, the average MPE magnitudes at each time step (the mean MPE across all samples at the corresponding time step) during decrease attacks also generally exceed those during increase attacks. Furthermore, output sequence modifications exhibit boundary effects. For instance, during increase attacks in TsLeNet and LSTM–CNN, the MPE magnitudes initially rise, then decline or stabilize. Similar patterns occur during LSTM–CNNs’ decrease attacks. This arises because driving safety rarely undergoes monotonic extreme increases or decreases. In general, driving safety either rebounds after deteriorating to critical thresholds ( 36 , 37 ) or declines after reaching peak values.
Spearman correlation analysis reveals that RMSE and MPE exhibit a strong correlation, with a correlation coefficient of 1 (p < 0.01). This correlation pattern confirms the alignment in evaluation metrics. The MPE can simultaneously represent the attack direction and intensity; subsequent sections primarily utilize the MPE for discussion.
Prediction Results under Different Attack States
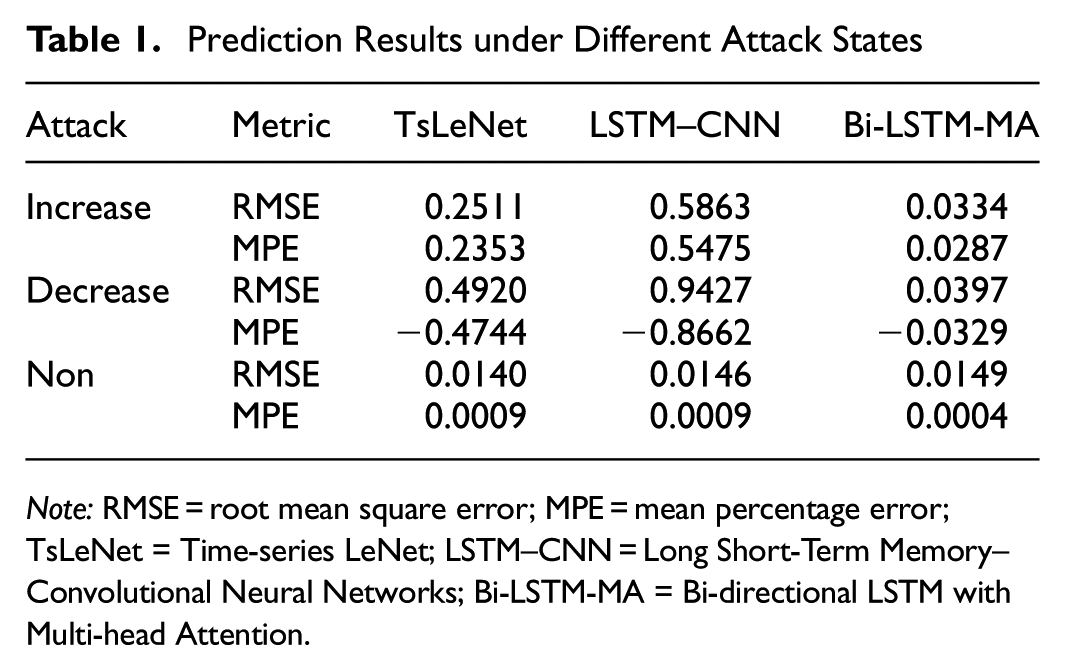
Note: RMSE = root mean square error; MPE = mean percentage error; TsLeNet = Time-series LeNet; LSTM–CNN = Long Short-Term Memory–Convolutional Neural Networks; Bi-LSTM-MA = Bi-directional LSTM with Multi-head Attention.
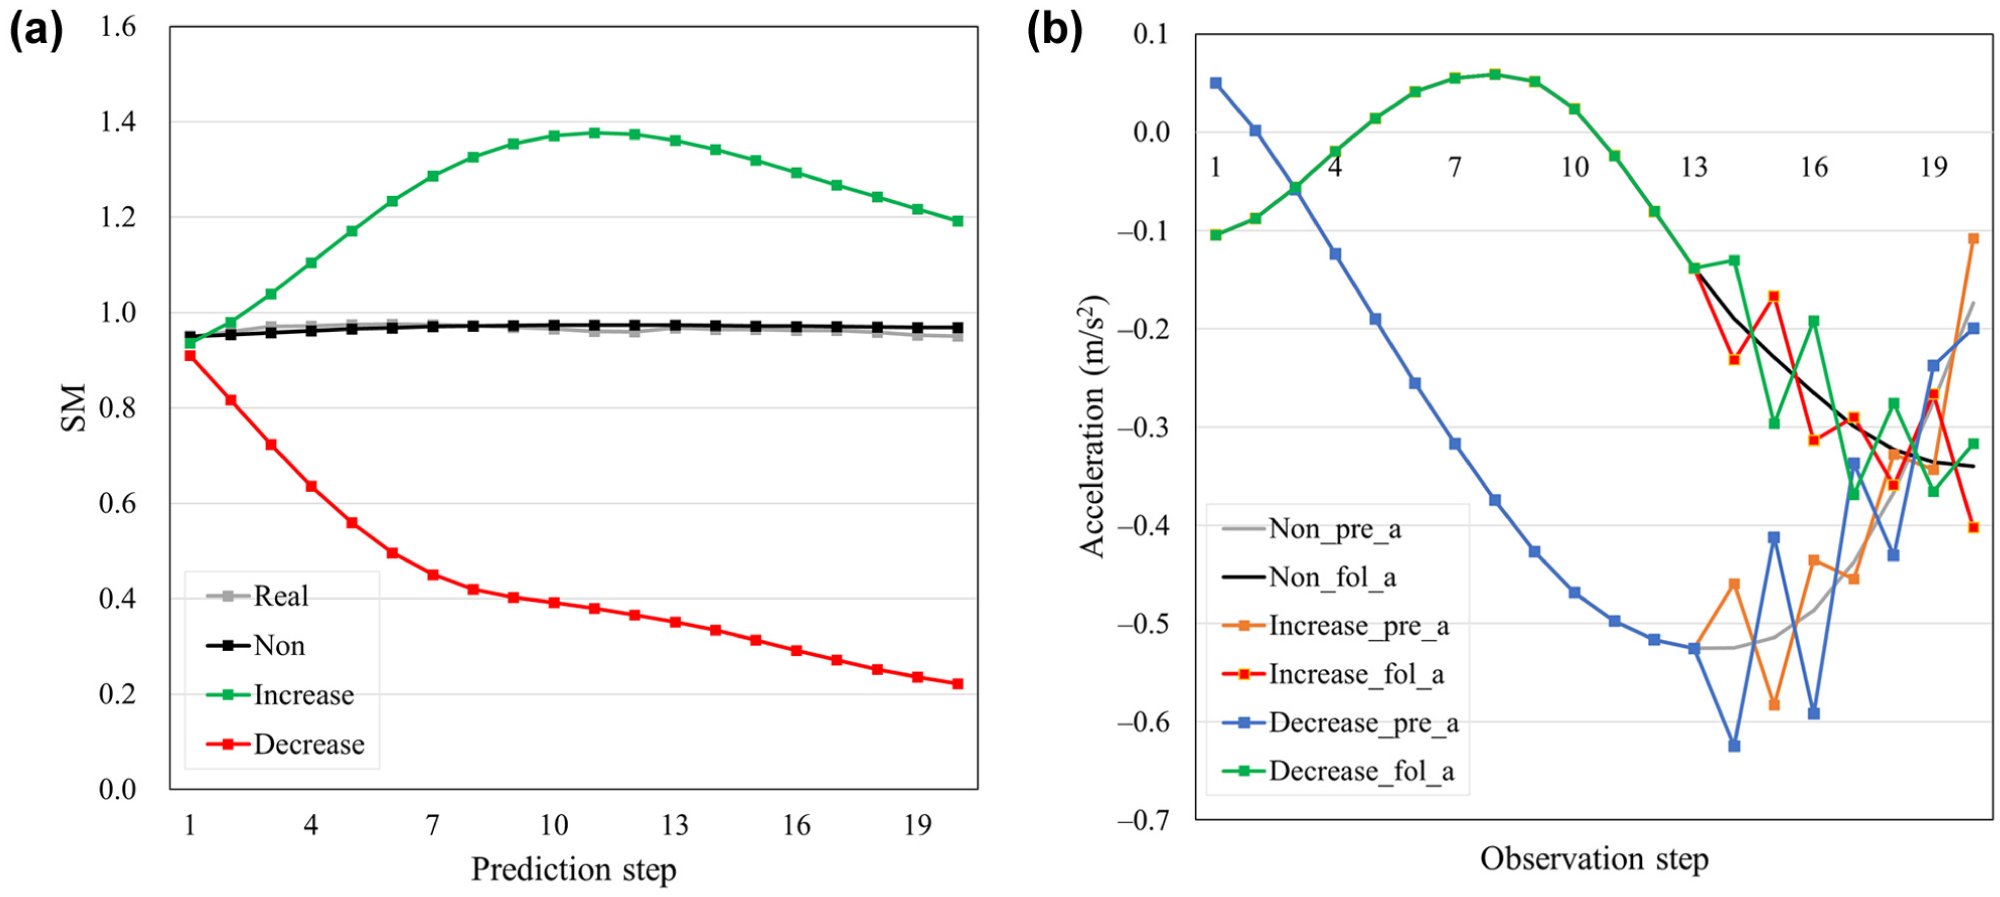
Prediction case: (a) risk prediction value and (b) input feature.
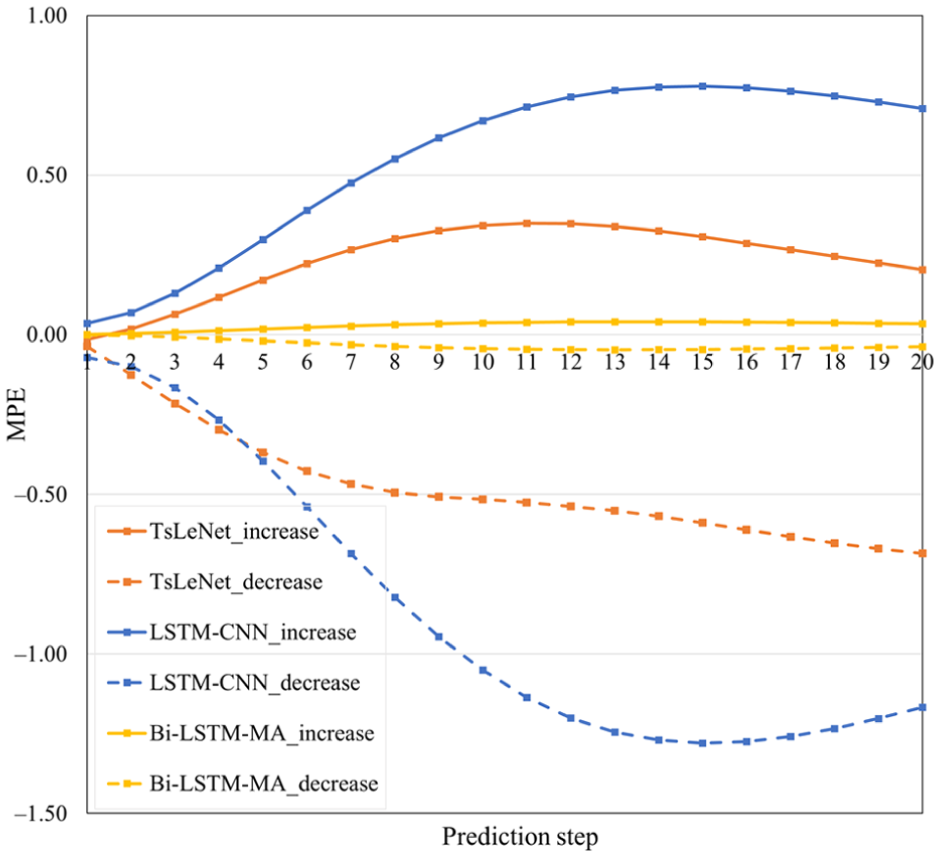
Average MPE in each time step.
Sensitivity Analysis of CGTA Parameters
There are many adjustable parameters in the CGTA framework, mainly including the training epochs and the constraint weight β in the optimization algorithm, and the modified time step l and feature number k in KFR retrieval. Concurrently, experimental results reveal significant variations in model resilience against attacks. This section further examines the influence of parameter and model architecture on attack effectiveness.
Training Epochs and β
Figure 5, a and b , shows attack effects for TsLeNet across different training epochs and β value combinations. Elevating β values drives optimization toward the second loss term, strengthening feature modification constraints and limiting attack effectiveness. Distinct curve separation emerges across β values, with the MPE magnitude decreasing systematically as β increases. Meanwhile, the trend in attack effectiveness across varying training epochs is modulated by β values. When β = 0, the MPE magnitude grows nearly linearly with increasing training epochs. Increase and decrease attacks generate MPE values of 0.1754 and −0.2927 under 10 training epochs with β = 0, whereas 50 training epochs significantly raise the MPE to 0.3956 and −0.8460. This phenomenon arises because β = 0 imposes no constraints on perturbation magnitude within the CGTA framework, allowing inputs to be iteratively optimized toward the attack objective without restriction. In contrast, when β > 200, additional training epochs have a minimal effect on attack effectiveness and may even trigger adverse optimization effects. For instance, in the increase attack with β = 1,000, the MPE progressively declines as the number of training epochs increases from 10 to 20, and further from 20 to 30. In practice, attackers can leverage the β parameter to control the attack process. For models demonstrating robust adversarial resistance (e.g., Bi-LSTM-MA), setting β = 0 is advisable to maximize attack effect. In contrast, for models with weaker resistance (e.g., TsLeNet and LSTM–CNN), using higher β values limits attack effectiveness within a controllable range.
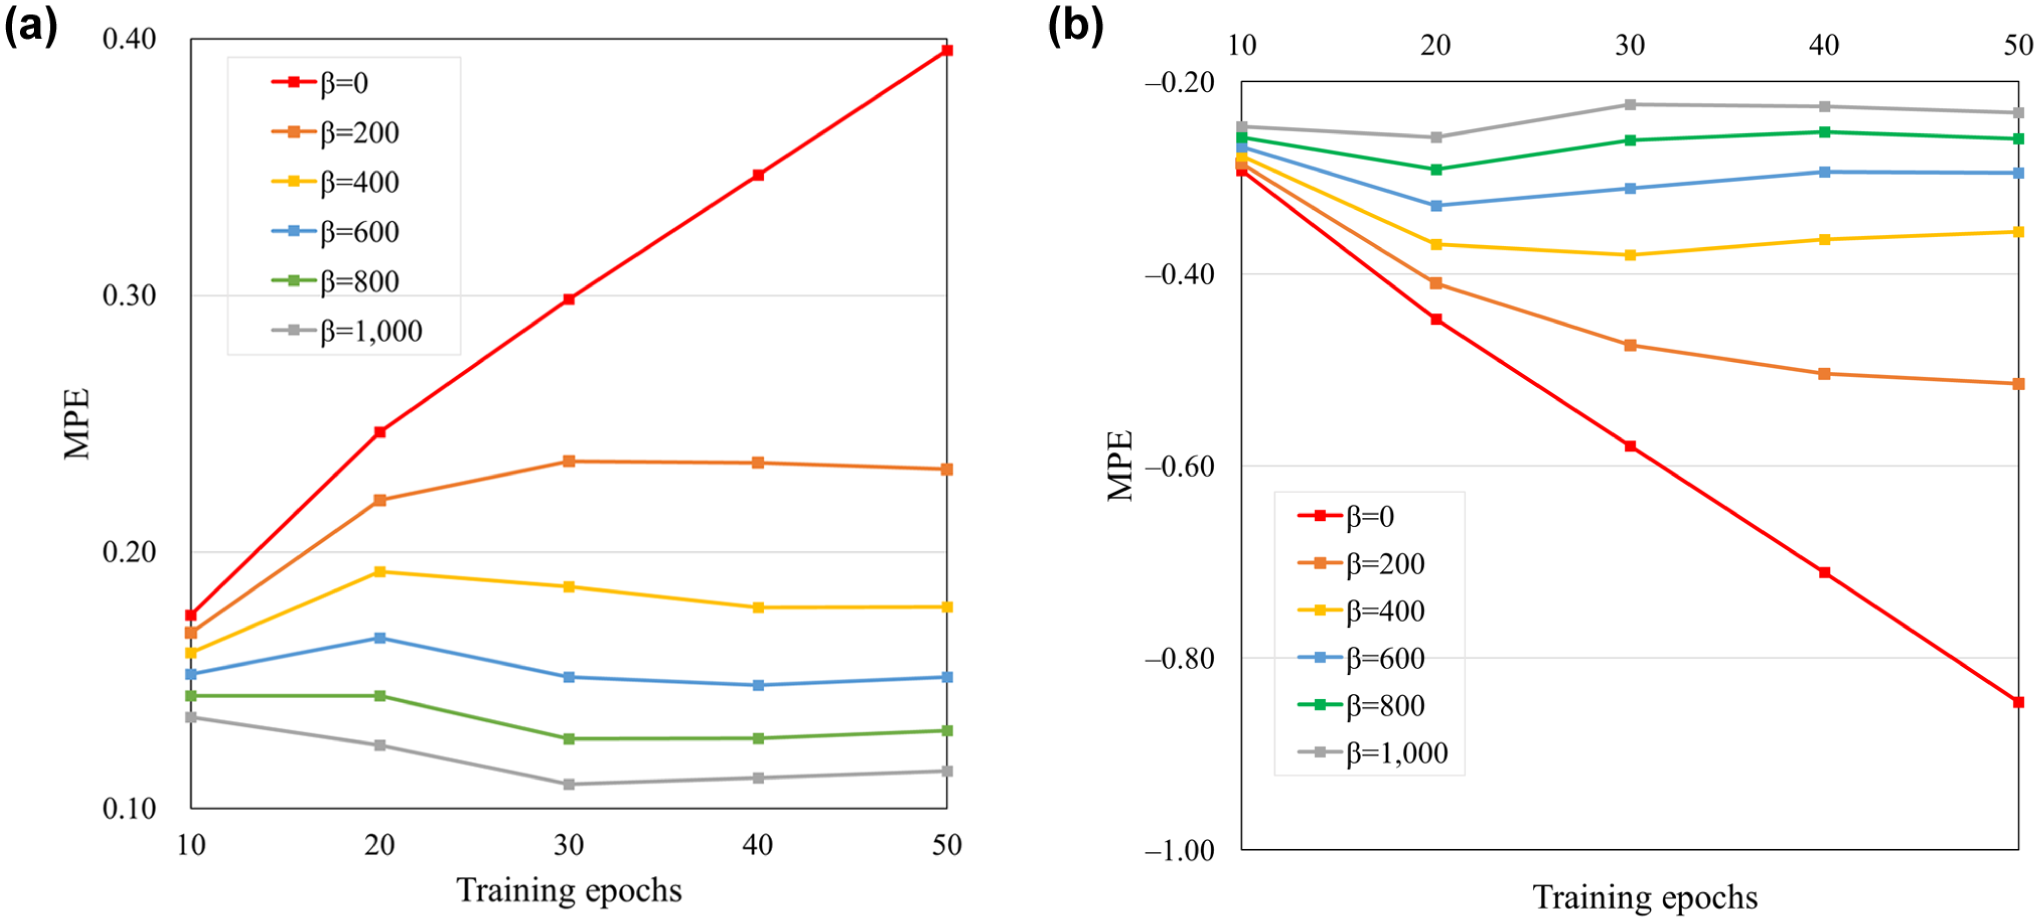
Attack effects under different β and training epochs: (a) increase attack and (b) decrease attack.
Figure 6 shows the variation in Loss terms 1 and 2 during optimization for an attack sample under β = 200 and β = 1,000 conditions. When β = 200, the optimization algorithm imposes weaker constraints on the magnitude of input modifications. Loss 1 stabilizes after decreasing to approximately −80, while Loss 2 reaches its peak around the 25th optimization epoch before declining. These trends occur because during initial optimization epochs, the difference between tampered and original input sequences is minimal, causing the solver to prioritize reducing Loss 1 while relaxing constraints on Loss 2. As optimization progresses, greater feature modification magnitudes direct the algorithm to focus more on Loss 2, leading to its subsequent decrease. When β = 1,000, Loss 1 decreases and Loss 2 increases during the initial optimization phases. However, Loss 1 ultimately stabilizes around −60, whereas Loss 2 is significantly lower than β = 200. Concurrently, Loss 2 decline initiates earlier at approximately epoch 15, and this reduction drives an increase in Loss 1, demonstrating the effectiveness of β in controlling loss terms.
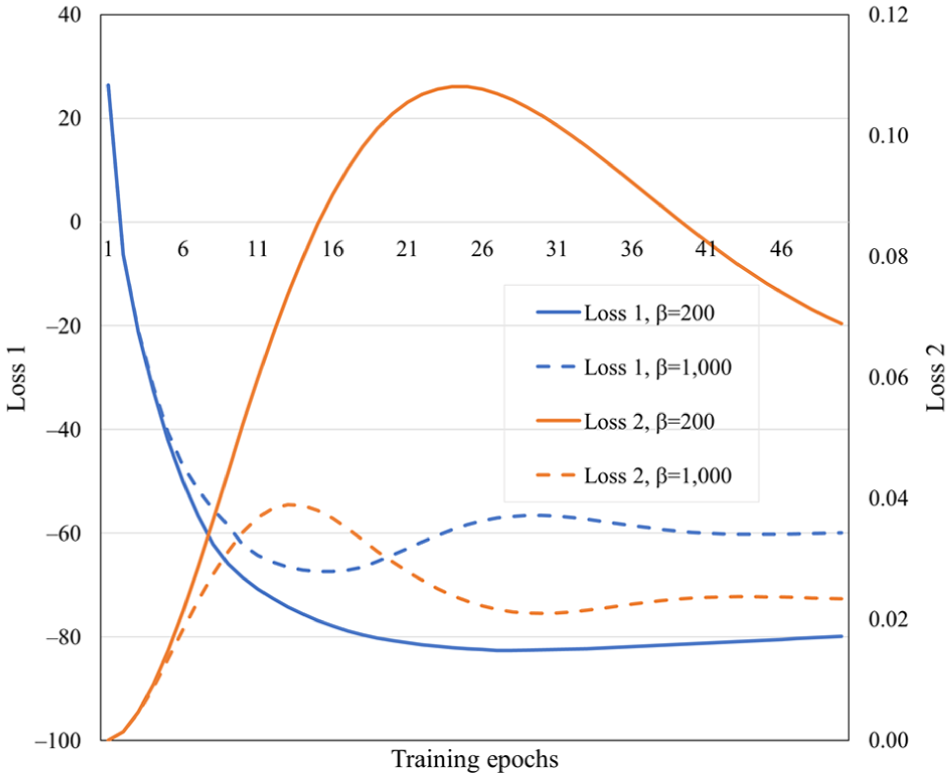
Training loss change under different β values.
Optimization timeliness is critical for real time cyberattacks. Although increasing training epochs under a loose β constraint can improve attack effectiveness, it also increases computational time. Since perception data enters prediction models as real time streams, optimized inputs lose practicality if optimization requires excessive time. Frames per second (FPS) measures the samples the optimization algorithm can process per second, with higher FPS indicating superior timeliness. Figure 7 shows the FPS during input optimization across prediction models at different training epochs. The average FPS reached 69 under 10 training epochs, while it gradually degrades to 15 when training epochs increase to 50. Although FPS degrade significantly with the increase in training epochs, the 15 FPS still exceeds the data record frequency, which ensures the real-time efficiency of the CGTA.
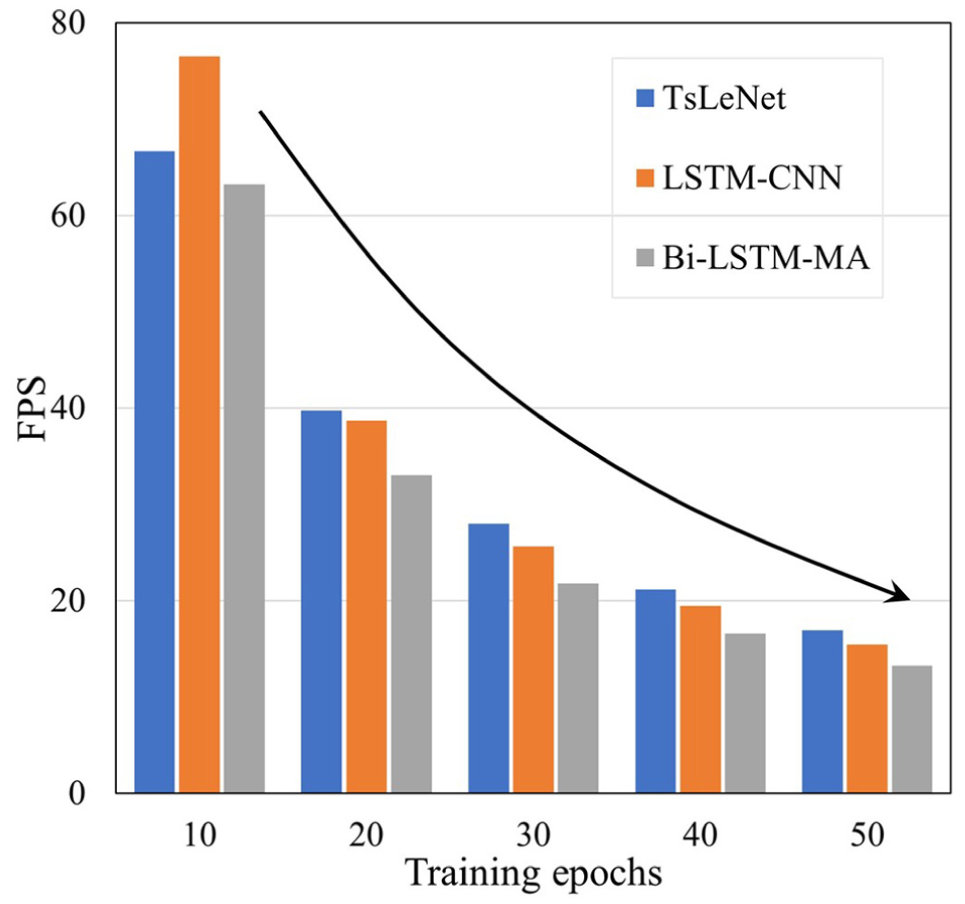
FPS under different training epochs.
Parameters of KFR Retrieval
KFR retrieval achieves parametric control over the attack region by identifying the significance of input features, encompassing both the number of features k and the span of temporal steps l. To validate the efficacy of KFR retrieval and assess the effect of parameter variations on attack performance, five distinct feature perturbation regions were designed based on the TsLeNet: (1) R0 (time steps 14–20 of preceding and following vehicle velocities); (2) KFR1 (k = 1, l = 7); (3) KFR2 (k = 2, l = 7, the default configuration); (4) KFR3 (k = 2, l = 20); and (5) KFR4 (k = 6, l = 20). As indicated by the KFR retrieval results (Figure 2a), preceding and following vehicle velocities exhibit relatively low importance. Therefore, comparing R0 with KFR2 (both covering two features and seven time steps) serves to verify whether KFR retrieval can accurately pinpoint effective attack regions. Furthermore, the parameter scope expands progressively from KFR1 to KFR4.
With training epochs fixed at 30, the attack outcomes under varying β values (0, 400, 1,000) are shown in Figure 8. Notably, even when the attack region size is identical, the attack effectiveness of R0 is substantially inferior to that of KFR2, particularly under a constrained β setting. Under increase and decrease attacks, R0 yields average MPE values of 0.0434 and −0.0668, respectively. In contrast, KFR2 achieves significantly higher magnitudes of 0.1544 and −0.2493. When β = 1,000, the MPE for the increase attack based on R0 drops to 0.0175, whereas KFR 2 still attains 0.1134. Similarly, in the decrease attack with β = 1,000, the MPE amplitude in KFR2 is 7.61 times greater than that of R0. These results demonstrate that KFR retrieval effectively identifies critical attack regions, where input perturbations more efficiently facilitate the attainment of attack objectives.
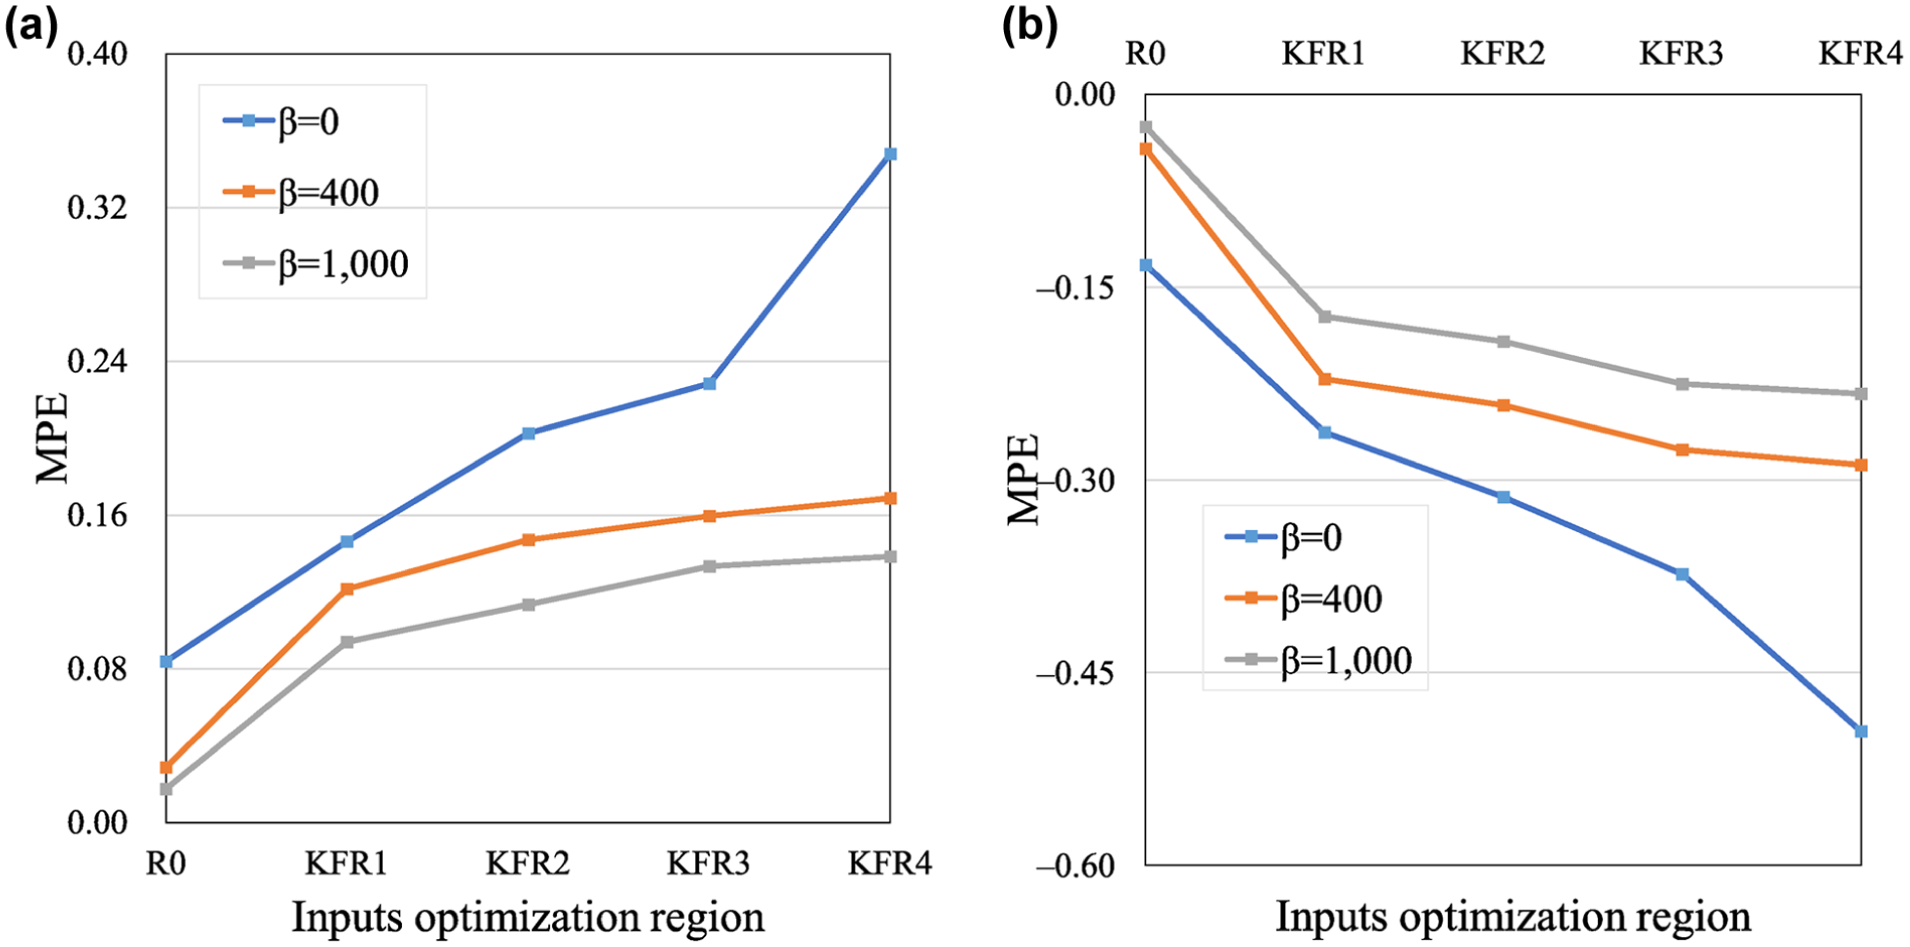
Validation and effect of KFR retrieval: (a) increase attack and (b) decrease attack.
As the feature modification region expands from KFR1 to KFR4, the attack performance of both increase attack and decrease attack enhanced, which aligns with the consensus that a wider input feature modification range corresponds to stronger attack performance. The benefits of increasing the number of modified features (comparing KFR1 and KFR2) and extending the temporal span (comparing KFR2 and KFR3) are empirically validated. Furthermore, the β parameter modulates the influence of KFR retrieval settings on attack performance. For instance, when β = 400 and β = 1,000, the attack effectiveness shows a slight increase as KFR expands. However, when β = 0, modifying all input features yields a significant boost in MPE. This observation further corroborates previous findings that higher β values constrain both the magnitude of attack effects and their growth potential.
Model Structure
As previously discussed, this resistance in Bi-LSTM-MA is probably because of the MHA, which performs global fusion of sequential information. This section constructs TsLeNet with Multi-head Attention (TsLeNet-MA), LSTM-CNN with Multi-head Attention (LSTM–CNN–MA), and Bi-LSTM, analyzing the effect of MHA on attack effectiveness. TsLeNet-MA replaces the SE block in TsLeNet with an MHA module. LSTM–CNN–MA applies MHA separately to the LSTM and CNN outputs. Bi-LSTM removes MHA from Bi-LSTM-MA.
The KFR for TsLeNet-MA and LSTM–CNN–MA covers time steps 14–20 for leading and following vehicle accelerations, while Bi-LSTM’s KFR spans time steps 13–19 for the same features. Figure 9 shows the RMSE and MPE values predicted by each model under non-attack and increase attack conditions (k = 2, l = 7, and training epochs = 30). Although incorporating MHA has a negligible effect on prediction results in non-attack scenarios, it significantly enhances the model’s resistance against CGTA. Compared with models without MHA, LSTM–CNN–MA, Bi-LSTM-MA, and TsLeNet-MA reduce the MPE by 86.1%, 41.69%, and 74.94% under increase attack, respectively, while the differences in RMSE under non-attack do not exceed 1.3%.
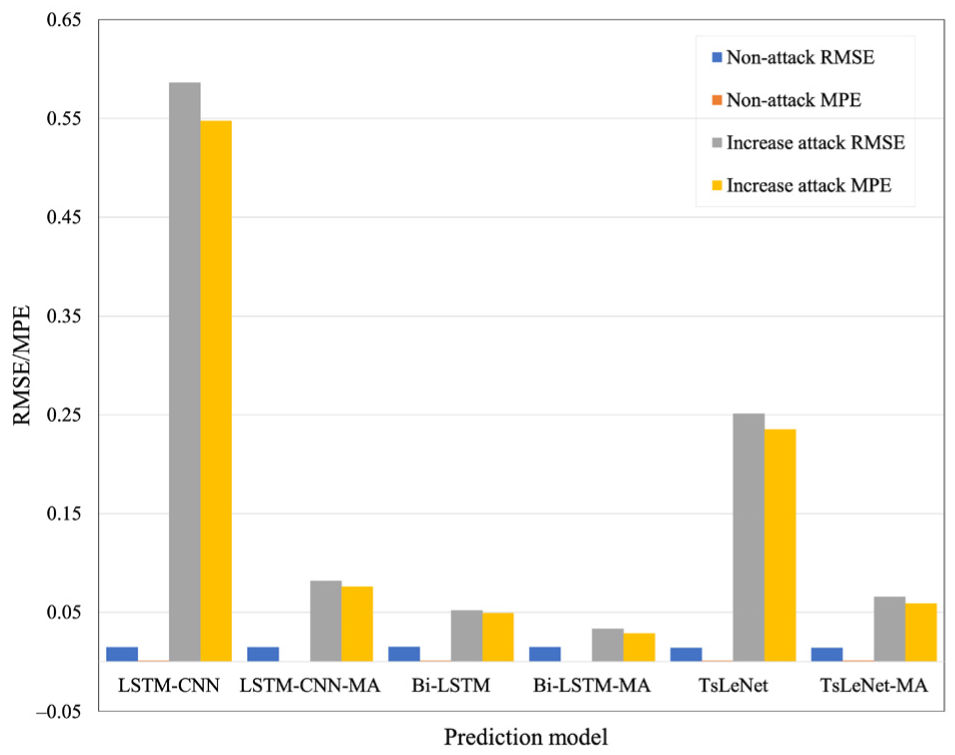
Influence of model structure on prediction results.
Attack Effect in PKS
The student model of TsLeNet was trained via model distillation, achieving a prediction RMSE of 0.0149, which is 6.43% higher than the 0.0140 RMSE of the original teacher model, because of unavoidable information loss during model distillation. Under the PKS attack targeting TsLeNet within KFR2, the KFR identified by the student model matches that in FKS. The attack effectiveness across different combinations of training epochs and β values is shown in Figure 10, a and b . First, CGTA successfully achieves its directional objectives even under the PKS condition. In increase attacks, the MPE is from 0.0634 to 0.2461, while in decrease attacks it is from −0.2753 to −0.0738. Second, the attack performance under PKS is markedly inferior to that under FKS. For increase attacks, the absolute average MPE values under PKS at β values of 0, 400, and 1,000 decreased by 23.23%, 51.48%, and 42.10%, respectively, compared with FKS. These degradations are even more pronounced in decrease attacks, reaching 51.11%, 71.56%, and 65.97%, respectively.
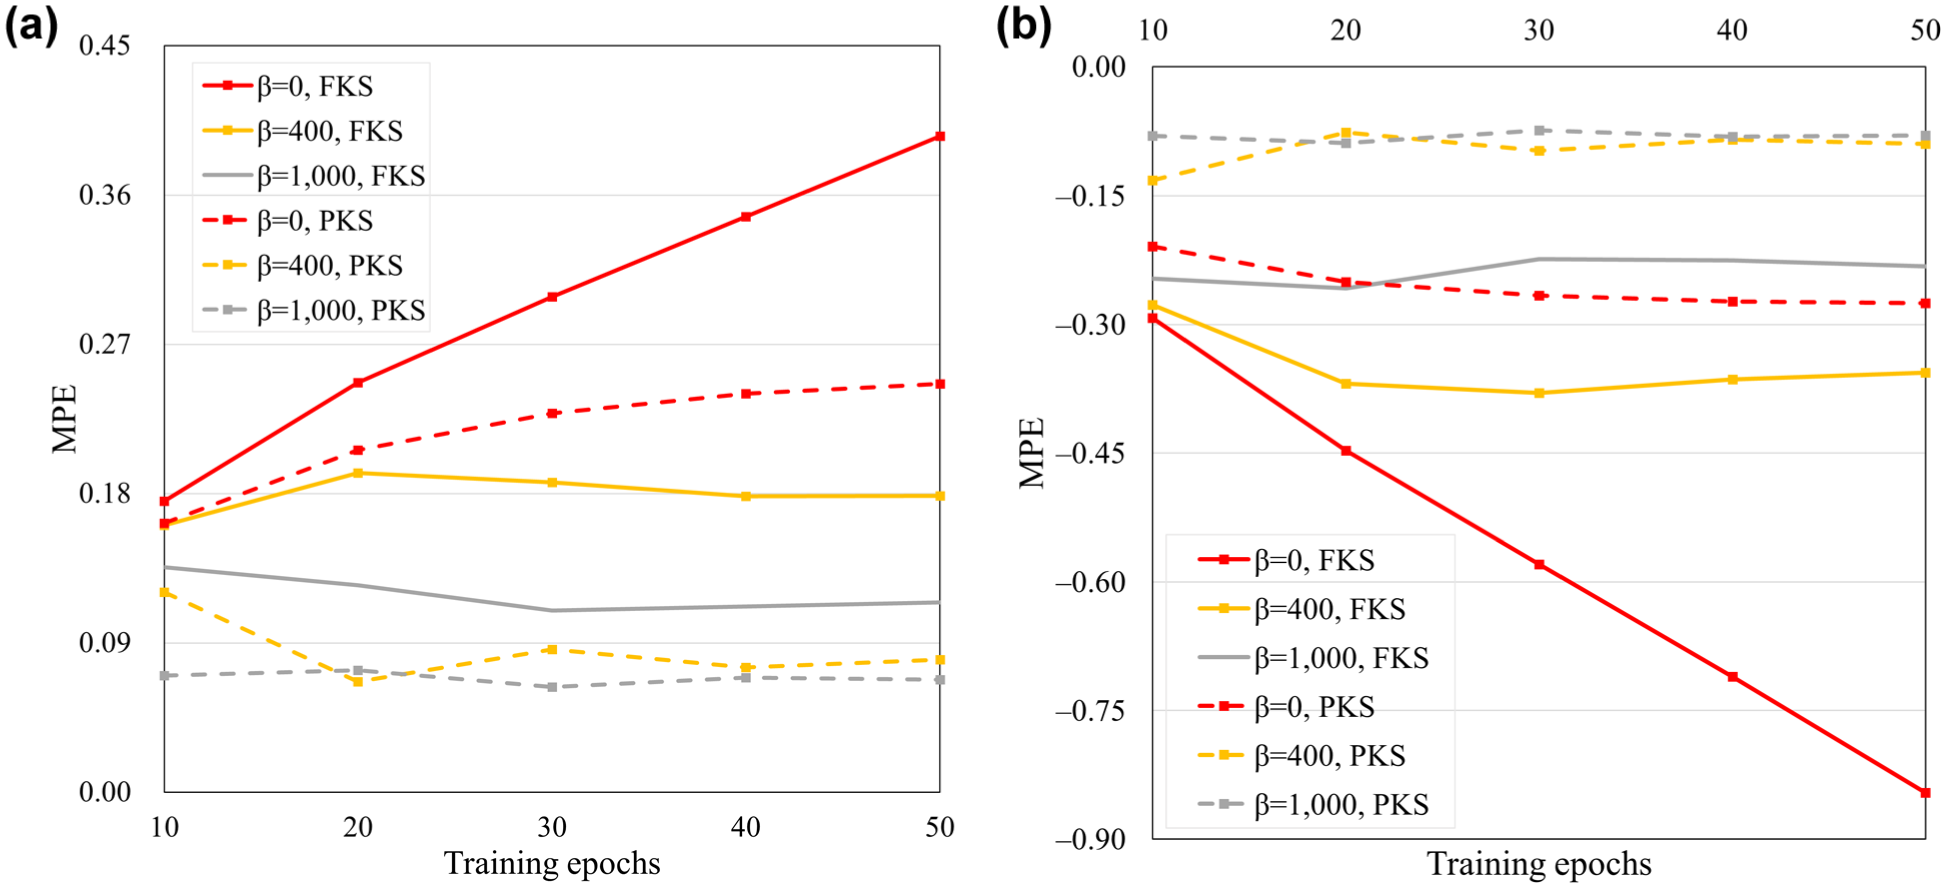
Attack results in TsLeNet under PKS and FKS: (a) increase attack and (b) decrease attack.
Simultaneously, the β parameter continues to exert a regulatory influence on attacks under the PKS scenario. When β = 0, the MPE under PKS strengthens as training epochs increase, although this gain is less pronounced compared to the FKS scenario. However, when β = 400 and β = 1,000, constraints on the magnitude of input perturbations hinder the optimization of inputs toward the attack objective. For instance, when the number of training epochs increases from 10 to 20 with β = 400, the absolute values of MPE decrease in both attacks in PKS.
The Bi-LSTM-MA demonstrates superior attack resistance in FKS, and its performance in PKS was also analyzed. For the Bi-LSTM-MA student model, the KFR2 was identified as time steps 14–20 for the acceleration of both the preceding and following vehicles. The results of the increase attack are shown in Figure 11. Consistent with the findings for TsLeNet, the MPE under PKS in Bi-LSTM-MA is significantly inferior to that under FKS, except under the extreme constraint of β = 1,000. Furthermore, Bi-LSTM-MA exhibits robust resistance to attacks across various parameter settings. Of note, even under PKS conditions with β = 0 and 50 training epochs, the MPE for Bi-LSTM-MA was 0.0421, substantially lower than the 0.2461 observed for TsLeNet under the same scenario. To further investigate the boundaries of Bi-LSTM-MA’s resistance, increase attacks were tested under more aggressive conditions: 50 training epochs and an expanded KFR4 region. The results showed MPE values of 0.1066 for FKS and 0.1000 for PKS, indicating that the model maintains strong defensive capabilities even under broader feature modifications and extended training iterations.
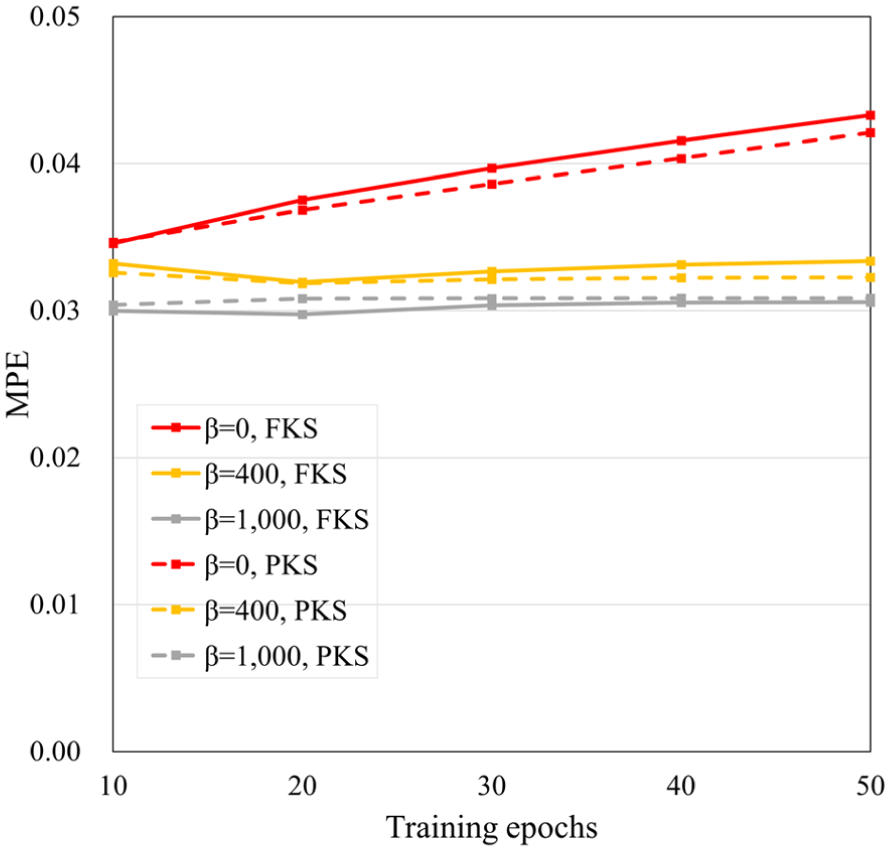
Increase attack in Bi-LSTM-MA under PKS and FKS.
To further analyze the effect of model distillation and differences in attack resistance on input tampering, Equation 8 was applied to calculate the Input Feature Differences (IFD) between the original and tampered inputs within the KFR, where x t represents the features tampered by CGTA, x0 represents the original input features, c represents the index of the identified KFR features, and o represents the time step. Setting the attack region to KFR2 with β = 0, the IFD in increase attack is shown in Figure 12. In TsLeNet, the IFD under FKS consistently exceeds that under PKS across all training epochs. This indicates that the magnitude of feature tampering is smaller in PKS than in FKS, aligning with the consensus that larger perturbations yield more significant attack effects. Notably, while Bi-LSTM-MA exhibits a higher MPE under FKS compared to PKS (as shown in Figure 11), its IFD under PKS is markedly higher than under FKS. This counterintuitive result is primarily attributed to the architecture of the student model used in this study, which is based on LSTM and lacks attack resistance modules such as MHA. Therefore, when applying CGTA to the student model, the input features undergo more extensive tampering. However, since the risk prediction mapping knowledge acquired by the student model is less comprehensive and differs from that of the teacher model, the adversarial perturbations optimized by the student model do not fully translate their effect to the actually deployed teacher model. The RMSE of the Bi-LSTM-MA student model reached 0.0152, which is 2.01% higher than the teacher model’s 0.0149.

The aforementioned results indicate that TsLeNet exhibits higher MPE than Bi-LSTM-MA under both FKS and PKS increase attacks, and its prediction accuracy and IFD are higher than those of Bi-LSTM-MA. These findings reveal that substantial input optimization targeting high-precision models is pivotal for achieving attack objectives.
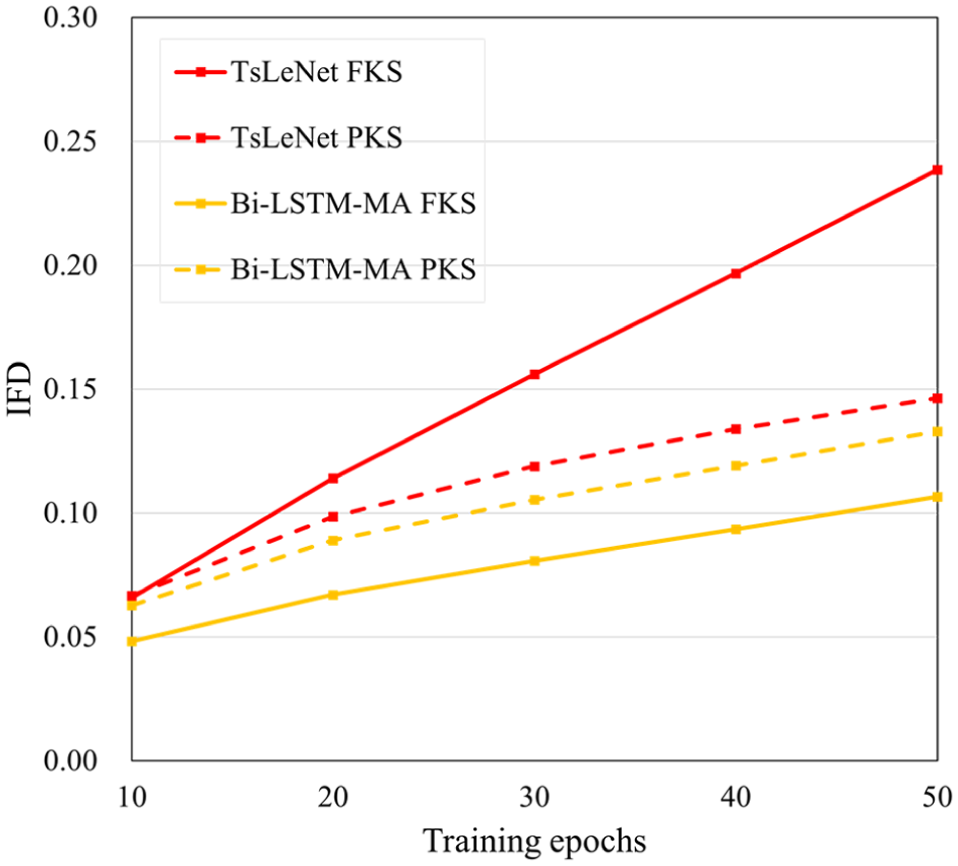
Input feature differences (IFD) under increase attack.
Analysis of Attack Stealthiness
The autoencoder assessed the magnitude of input tampering by reconstructing the inputs using its encoder–decoder architecture, and it is widely used in anomaly detection ( 54 ). The potential attack is identified when the reconstruction error exceeds a predefined threshold. Although previous experiments demonstrate that increasing the number of training epochs, reducing the β value, and expanding the KFR can enhance attack effect, these modifications may concurrently amplify input feature perturbation, compromising attack stealthiness. Therefore, this section further investigates the effect of attack parameters on reconstruction errors.
The encoder and decoder of the autoencoder were constructed based on a basic LSTM, trained on inputs from the training and validation sets. Training environments and the LSTM structure followed the aforementioned experiment setting. As shown in Equation 9, the mean input reconstruction error (MIRE) was applied to evaluate the autoencoder input reconstruction error, where x r represents the reconstructed input, and x0 represents the original input. Different from IFD, the evaluation scope of MIRE is not confined to the KFR, and the combinations of C and O encompass the input space.

To facilitate the evaluation and comparison of attack efficacy, set the recommended KFR intervals of KFR2 and KFR4, along with recommended β values of 0 and 400 (based on previous results). This yields four Recommended Parameter Combinations (RPCs): (1) RPC1 (KFR2, β = 0); (2) RPC2 (KFR2, β = 400); (3) RPC3 (KFR4, β = 0); and (4) RPC4 (KFR4, β = 400). To ensure computational efficiency, the number of training epochs was set to 30. Figure 13 shows the distribution of MIRE for TsLeNet and Bi-LSTM-MA under increase attacks across different RPCs. Although the minimum MIRE values for RPC3 reached the 87.46th and 87.26th percentiles of the original data distribution for TsLeNet and Bi-LSTM-MA, respectively, it struggles to distinguish reconstruction errors induced by other RPC-based attacks. For TsLeNet, the minimum MIRE values for RPC1, RPC2, and RPC4 correspond to the 23.12th, 1.64th, and 0.87th percentiles of the original distribution, respectively. For Bi-LSTM-MA, these values are at 1.28th, 1.73rd, and 0.00th percentiles, respectively. As shown in Figure 8a, although RPC3 achieves the highest MPE of 0.3481 in TsLeNet, RPC1, RPC2, and RPC4 still demonstrate significant attack effect, with MPEs of 0.2025, 0.1473, and 0.1689, respectively. These findings indicate that within the CGTA framework, flexibly adjusting the KFR and β parameter enables a tunable trade-off between attack intensity and stealthiness, which is crucial for adapting diverse car-following risk prediction models and varying attack detection systems.
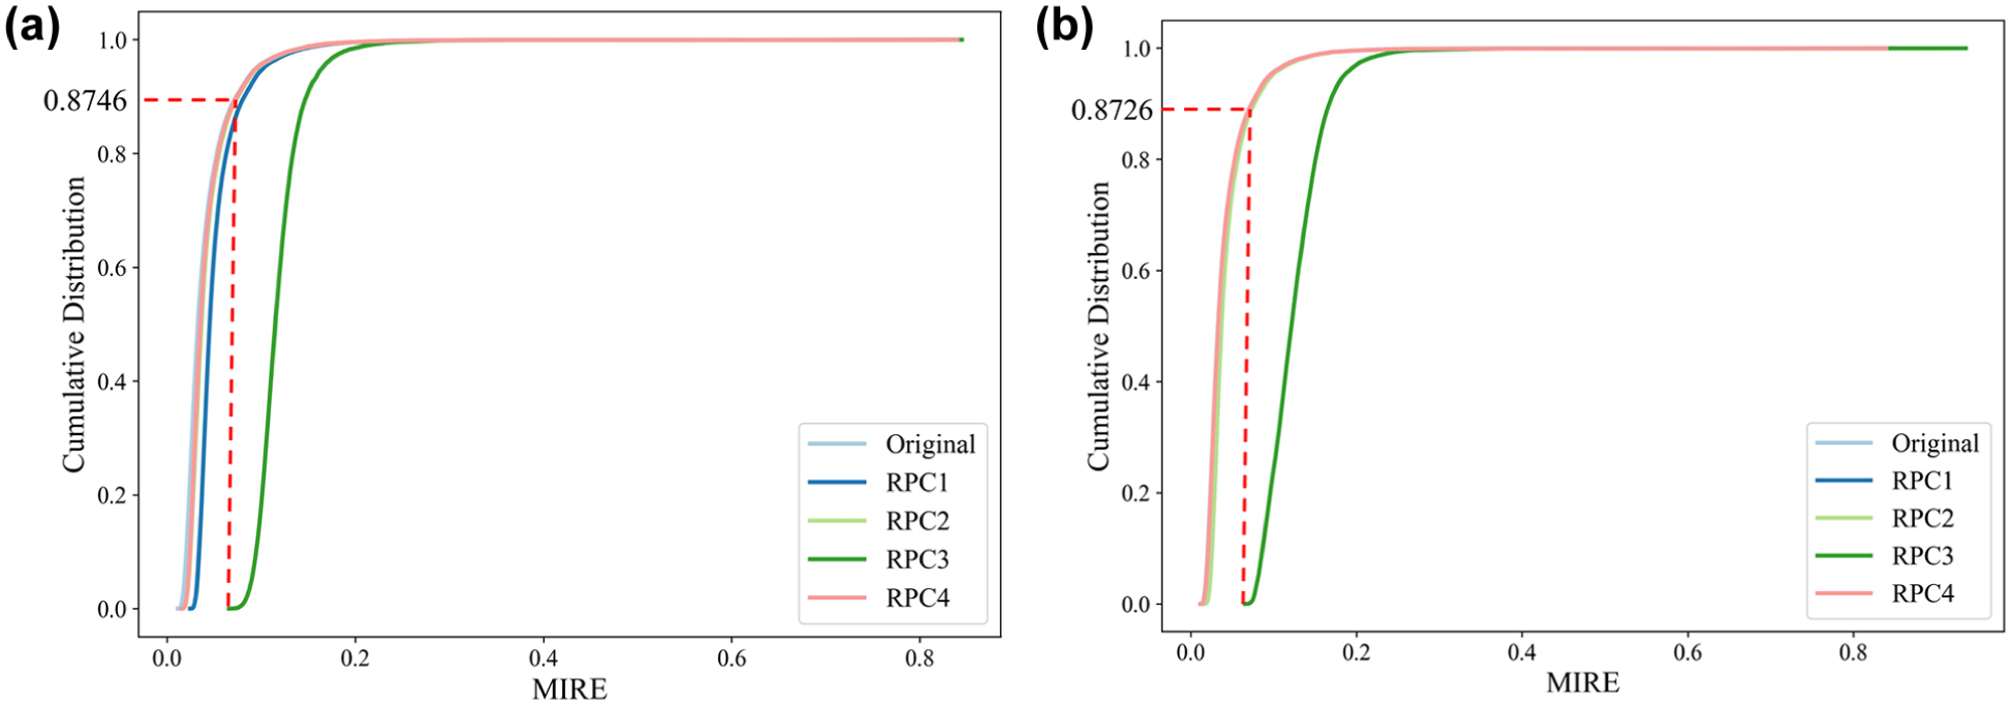
MIRE under different RPC conditions: (a) TsLeNet and (b) Bi-LSTM-MA.
The physical plausibility serves as a critical metric for the quality of trajectory data. Referring to established criteria for car-following sample selection and data quality validation, four physical constraints were defined: (1) following distance > 0 m; (2) velocities of both preceding and following vehicles > 0 m/s; (3) accelerations of both vehicles within [−8, 5] m/s2; and (4) jerks of both vehicles within [−15, 15] m/s3. If the tampered input does not meet any of the constraint conditions, it is deemed physically implausible. The test results indicate that the tampered inputs for TsLeNet and Bi LSTM-MA under all RPCs satisfy four physical constraints, further demonstrating the stealthiness of the proposed CGTA framework.
Generalization of CGTA
To further validate the generalization performance of the CGTA framework, attack experiments were conducted on the Argoverse 2 data set and the time headway (THW) rear-end collision risk metric. First, the Argoverse 2 data set is widely adopted in autonomous driving research. Its motion forecasting subset consists of 250,000 scenarios, each approximately 11 s duration with a recording frequency of 10 Hz ( 55 ). Zhou et al. extracted car-following samples from this data set and made the experimental data publicly available ( 56 ) (https://github.com/CATS-Lab/Filed-Experiment-Data-ULTra-AV). Following the data processing pipeline established by Li et al. ( 51 ), Kalman filtering was applied to the velocity data and wavelet denoising to the acceleration data provided by Zhou et al., and subsequently aggregated the data to 5 Hz. After filtering for scenarios with durations less than 10 s that satisfied the aforementioned acceleration and jerk constraints, 6,925 car-following samples were identified. Second, the THW is widely used as a rear-end collision risk metric in practice ( 57 ). The calculation of THW is shown in Equation 10, where D n represents the car-following distance and V n represents the velocity of the following vehicle. Referring to the defined rear-end collision risk prediction modeling paradigm, the SM in the original inputs and outputs was replaced with the THW.

The increase attack results for TsLeNet and Bi-LSTM-MA on the Lyft Level-5 and Argoverse 2 data sets are shown in Figure 14. The CGTA demonstrates targeted attack efficacy in THW prediction on both data sets, especially in RPC1 and RPC3 without β constraints. In these scenarios, the MPE distribution of attacked samples deviates significantly from the original samples and remains predominantly positive. The Kolmogorov–Smirnov (K–S) test was applied to quantify the divergence between the MPE distributions of attacked and original samples. The differences in MPE distribution were significant across all models and PCRs. Except for the RPC2 and RPC4 of Bi-LSTM-MA on Argoverse 2, all K–S tests’D values were greater than 0.1. Therefore, it can be statistically determined that CGTA can achieve the target attack effect and validate its generalization capability.
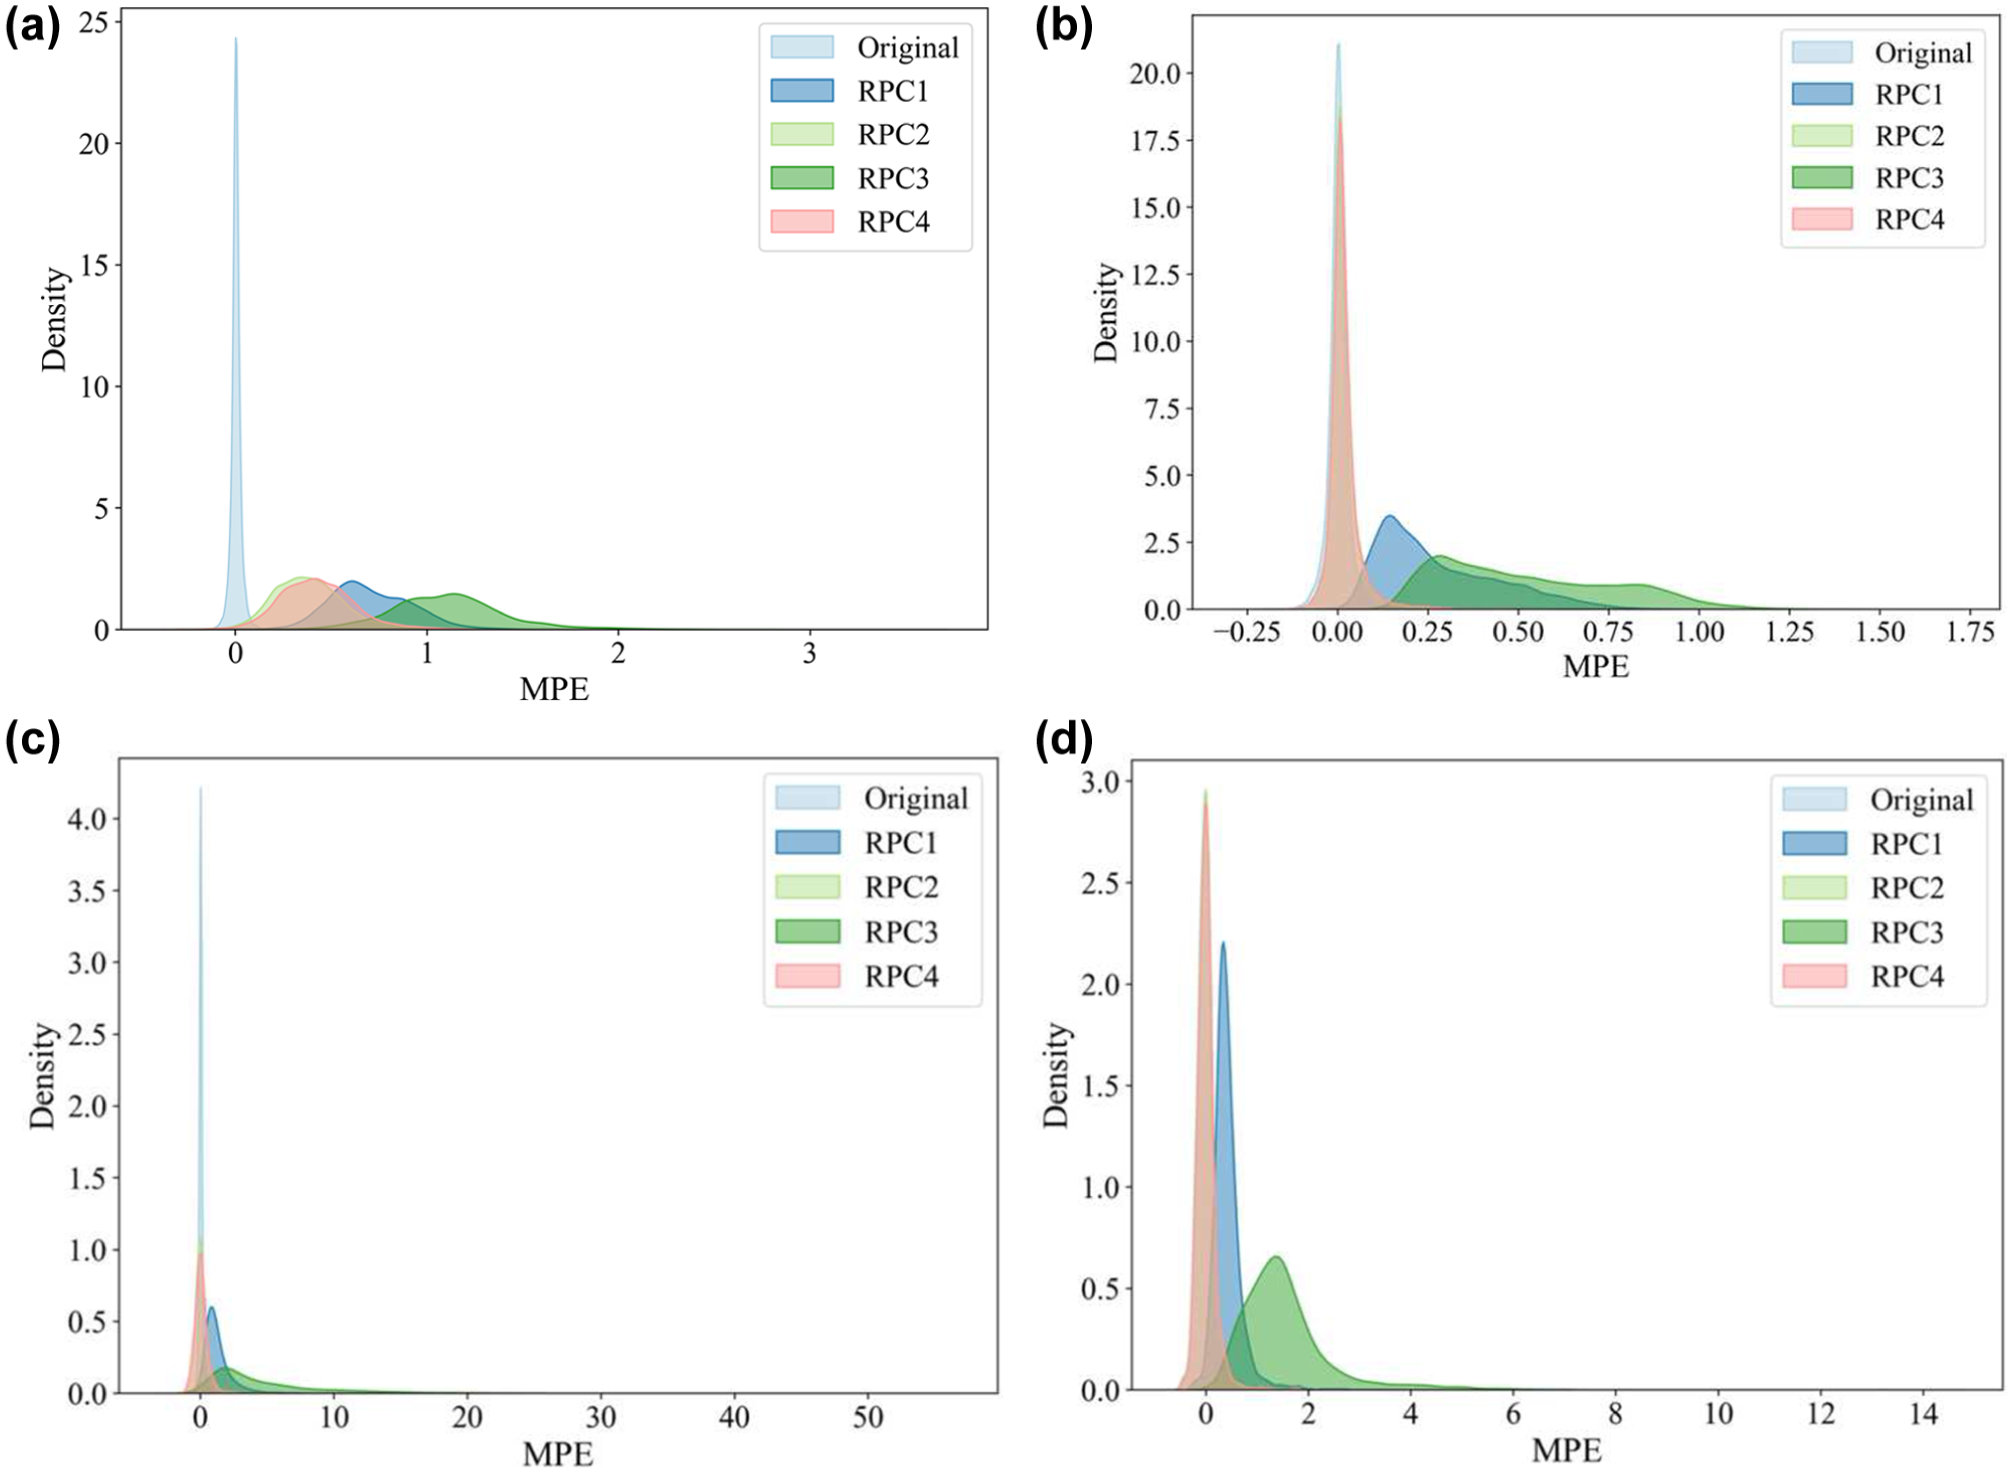
Attack effectiveness of THW prediction on different datasets: (a) TsLeNet in Lyft Level-5; (b) Bi-LSTM-MA in Lyft Level-5; (c) TsLeNet in Argoverse 2; and (d) Bi-LSTM-MA in Argoverse 2.
The attack’s efficacy on Argoverse 2 significantly surpasses that on Lyft Level-5, and the analysis of predictions on original inputs reveals substantially higher prediction errors on Argoverse 2 than on Lyft Level-5. The TsLeNet achieves RMSE values of 0.1042 and 0.3496 on Lyft Level-5 and Argoverse 2, respectively, while Bi-LSTM-MA yields 0.1168 and 0.4168. These discrepancies primarily stem from differences in scene heterogeneity and data quality between the data sets.
Lyft Level-5 scenarios are confined to a single fixed urban block route, whereas Argoverse 2 encompasses road segments across six cities spanning over 2,000 km. While such diversity robustly validates model generalization, increased sample heterogeneity inherently elevates prediction difficulty, thereby contributing to higher RMSE on Argoverse 2. Meanwhile, models trained on Argoverse 2 incorporate broader risk-mapping patterns, potentially enhancing the optimization of counterfactual inputs.
Inherent variations in data quality across datasets influence risk modeling. As shown in Equation 11, the second-order difference (SOD) norm quantifies local perturbation within a data sequence of length n, and higher SOD values indicate more pronounced local perturbations. Despite using the same data processing techniques, the SOD values for the acceleration of the preceding and following vehicles in Argoverse 2 were 0.1610 and 0.1108, respectively, while in Lyft Level-5, they were 0.0311 and 0.0193, respectively. The disturbance in the inputs is similar to noise, which increases the difficulty of model fitting. Therefore, the prediction error in Argoverse 2 is higher than that of Lyft Level-5.
Of note, the SOD of the preceding vehicle acceleration is higher than that of the following vehicle. This is mainly because all the following vehicles in this study are AVs, and their motion data is derived from internal system logs. In contrast, the acquisition of preceding vehicle data relies on perception algorithms, and the perception accuracy is susceptible to complex factors such as environmental conditions and algorithm stability. The discrepancy in data acquisition naturally leads to greater perturbation in the motion information of preceding vehicles than of following vehicles.

Mitigation Strategies for CGTA
Analysis of the attack process and experimental results suggests three main mitigation strategies against cyberattacks: (1) incorporate global feature fusion mechanisms in models. While MHA implementation shows a slight effect on prediction precision under non-attack conditions, it significantly reduces the MPE compared with CGTA. Therefore, integrating global attention mechanisms such as MHA at appropriate positions during the design of the prediction model can enhance the model’s inherent robustness against attacks; (2) strengthen privacy protection for models and input variables information. Although the distillation-based optimization strategy achieves the attack direction, the overall attack effect remains substantially inferior to FKS. Concurrently, verifying the physical relationships among input variables may effectively detect attacks. Without understanding variable semantics, attackers cannot maintain physical consistency between tampered inputs; and (3) monitor time elapsed from perception data generation to model input. Although previous analyses confirm CGTA’s timeliness, its input optimization inherently requires repeated prediction model calls, and increasing the number of training epochs also extends perception-to-input latency.
Conclusion
This study proposes a CGTA framework for predicting rear-end collision risk. By manipulating inputs, it achieves targeted trend attack objectives. Attack experiments were conducted on three mainstream prediction models using AV–HV samples from the Lyft Level-5 data set. The results demonstrate that the CGTA achieves targeted attack objectives under FKS and PKS. Analysis of the CGTA parameters reveals that relaxing modification constraints, extending the attack region, and increasing the number of training epochs enhance attack effectiveness. The generalization of CGTA has been validated in the Argoverse 2 data set and the THW metric. Of note, structural analysis indicates that MHA significantly enhances resistance against the CGTA, while privacy protection and input timing monitoring defense strategies are discussed based on attack workflows.
Although experimental results confirm CGTA’s effectiveness for targeted attacks, two main limitations persist: (1) this study only verifies that the CGTA can effectively control the output of rear-end collision risk prediction models, but does not analyze the final effect of CGTA on car-following safety within a predict–control framework; and (2) although the effectiveness and stealthiness of CGTA was validated and mitigation strategies were discussed, a concrete attack detection framework has not been further developed.
In future research, a predict–control framework will be incorporated to analyze the ultimate effect of the CGTA on driving safety in closed-loop scenarios, and revise and validate the objective function with different safety control logics to expand the application scenarios of the CGTA framework. For instance, when risk judgment is based on extreme values, constraints on predicted extremes should be added to the objective function. In addition, robust model design, attack detection algorithms, and autonomous driving data transmission protocols will be integrated to develop a comprehensive framework for resisting attacks.
Footnotes
Authors’ Note
The authors would like to acknowledge the support provided by the Qwen language model in improving the clarity and grammatical accuracy of this manuscript. The model assisted in identifying potential grammatical errors and refining the expression of certain sections; the authors retain full responsibility for the content, interpretations, and conclusions presented.
Author Contributions
The authors confirm contribution to the paper as follows: study conception and design: Huansong Zhang, Qiong Bao, Yongjun Shen; data collection: Huansong Zhang; analysis and interpretation of results: Huansong Zhang, Haihua Liao, Minghao Gao, Yongjun Shen; draft manuscript preparation: Huansong Zhang, Haihua Liao. All authors reviewed the results and approved the final version of the manuscript.
Declaration of Conflicting Interests
The authors declared no potential conflicts of interest with respect to the research, authorship, and/or publication of this article.
Funding
The authors disclosed receipt of the following financial support for the research, authorship, and/or publication of this article: This research is supported by the National Key Research and Development Project (Grant No. 2023YFB4302701) and the National Natural Science Foundation of China (Grant No. 52372324).

Data Accessibility Statement
Data will be made available on reasonable request.