
Abstract
As cities work to develop safer, more connected multimodal transportation networks, prioritizing bicyclist safety has become increasingly critical. Transportation agencies traditionally focus their bicycling safety resources on corridors with high crash numbers. However, this method may overlook streets with fewer crashes but higher risk per bicyclist. Exposure-based safety metrics consider the relative level of bicycling and might offer a more comprehensive understanding of safety. Although standard practice for vehicle road safety work, few cities collect the bicyclist count data needed for similar assessments. This research compared the safety of two corridors: one identified by a hot-spot analysis with a high number of bicyclist–vehicle crashes; and a major arterial in the city’s High Injury Network (HIN), but one that is seemingly safer for bicyclists given the relative scarcity of bicyclist–vehicle crashes. Findings suggest that the HIN corridor, despite fewer bicyclist–vehicle crashes, presented a significantly higher relative risk to bicyclists—when accounting for bicyclist exposure—than the corridor identified via hot-spot analysis. We then examined routes parallel to the HIN corridor to gauge whether bicyclists were avoiding such streets and if collecting additional exposure data on the adjacent streets further enhanced our understanding of safety. Results suggest that bicyclists were avoiding the HIN corridor and that it may be more dangerous than crash-count-focused analyses would reveal. This research underscores the importance of expanding data collection efforts to include exposure metrics for bicyclists, to enhance safety evaluations, guide infrastructural improvements, and support public health by promoting safer, active transportation.
Keywords
Introduction
In many cities around the world, identifying and improving bicyclist safety is a pressing challenge. Traditional safety assessments prioritize corridors or intersections with high crash counts and direct resources to those locations. Although this approach has its merits, it may overlook roadways with fewer crashes but significantly higher risks per bicyclist. For instance, a street with 100 crashes among 10,000 bicyclists is safer per exposure than one with 10 crashes among 50 bicyclists ( 1 ).
Road safety experts use exposure data to normalize raw crash numbers and better understand relative risk. Exposure data in bicyclist safety refers to the time, distance, or number of trips spent riding bicycles in environments where they may be at risk of injury or death. Such methods are standard practice in motor vehicle safety evaluations but are rarely applied to bicyclists (or pedestrians). As a result, most cities rely primarily on raw crash counts to inform their decisions, potentially missing key safety issues that are hidden beneath the surface.
The goal of this research was to assess the potential impact of incorporating exposure data into bicyclist safety assessments. To study this, we sought to compare a city’s most dangerous corridor for bicyclists in relation to crash counts with another corridor of the same functional classification within that same city with relatively few crashes involving bicyclists but nonetheless dangerous for other modes. By assessing the impact of including exposure in bicyclist safety analyses, we sought to determine the extent to which incorporating exposure data is worthwhile, or whether cities can continue focusing on crash hot spots alone. This study addresses a significant gap in current research, in which much of the literature on bicyclist safety relies solely on crash data, without accounting for the exposure of bicyclists to risk ( 1 , 2 ).
The following sections outline the methods used to assess both bicyclist exposure and relative safety. We then present the results and discuss the broader implications of this approach for cities aiming to better allocate resources and improve bicyclist safety.
Data and Methods
Site Selection
To explore the potential of incorporating exposure data into bicyclist safety assessments, we selected two corridors with distinct safety concerns. More specifically, the intent was to compare the corridor that seemed to be the most dangerous for bicyclists in relation to crash counts with one of the same functional classification that was seemingly safer for bicyclists but considered dangerous for other modes.
We selected Denver, CO, as a case study site owing to its ongoing investments in protected bike infrastructure amid a still largely car-dominated street network. This created a natural laboratory in which to study bicyclist crash rates and safety in a city that may be more relatable to a broad spectrum of U.S. cities given its relative size and history.
In Denver’s Bicycle Crash Analysis: Understanding and Reducing Bicycle and Motor Vehicle Crashes report, which highlighted corridors with elevated bicycle–vehicle crash frequencies and patterns of conflict in the downtown area, 15th Street was identified as the top high-crash corridor for bicyclists. 15th Street is a key north–south corridor characterized by high traffic volumes and complex intersections. This street is also directly connected to the South Platte River Trail and terminates at Union Station, a major multimodal transportation hub, further increasing its relevance to urban bicyclists.
In contrast, Federal Boulevard is a major arterial roadway with relatively fewer reported bicyclist–vehicle crashes, but is recognized as Denver’s highest risk corridor for road users overall. Federal Boulevard was therefore included in Tier 1 of Denver’s High Injury Network (HIN), which is considered the highest risk tier within the city’s HIN framework ( 3 ). Despite its overall risk, Federal Boulevard has relatively fewer reported bicyclist-involved crashes, providing an opportunity to assess bicyclist safety conditions in a high-risk traffic environment that might appear safer for bicyclists based on crash data alone. Accordingly, Federal Boulevard has not received the same level of safety improvements for bicyclists. Similar to 15th Street, Federal Boulevard provides access to the South Platte River Trail and important transit hubs, such as Federal-Decatur station.
Although this study focuses on crash patterns and bicyclist exposure, operating speeds on urban arterials such as Federal Boulevard typically vary by time of day, with slower speeds during peak congestion periods and higher speeds during off-peak periods. Future research could incorporate observed speed data to better understand how speed variations might influence bicyclist safety on these corridors.
For this analysis, we selected a 1.75-mi segment of Federal Boulevard, from West 23rd Avenue to West 6th Avenue, chosen to align with 15th Street in relation to length and shared characteristics, including proximity to key transit access points and the broader bicycling network, as shown in Figure 1. Figure 2, a to c , presents typical cross-sections for both study corridors. Although each roadway includes minor variations along its length, the cross-sections shown represent the general configurations. Along 15th Street, the segment from Colfax Avenue to Wazee Street operates as a one-way street heading northeast (Figure 2a). From Wazee Street to 29th Avenue, 15th Street transitions to a two-way facility, with the corresponding typical cross-sections (Figure 2b).
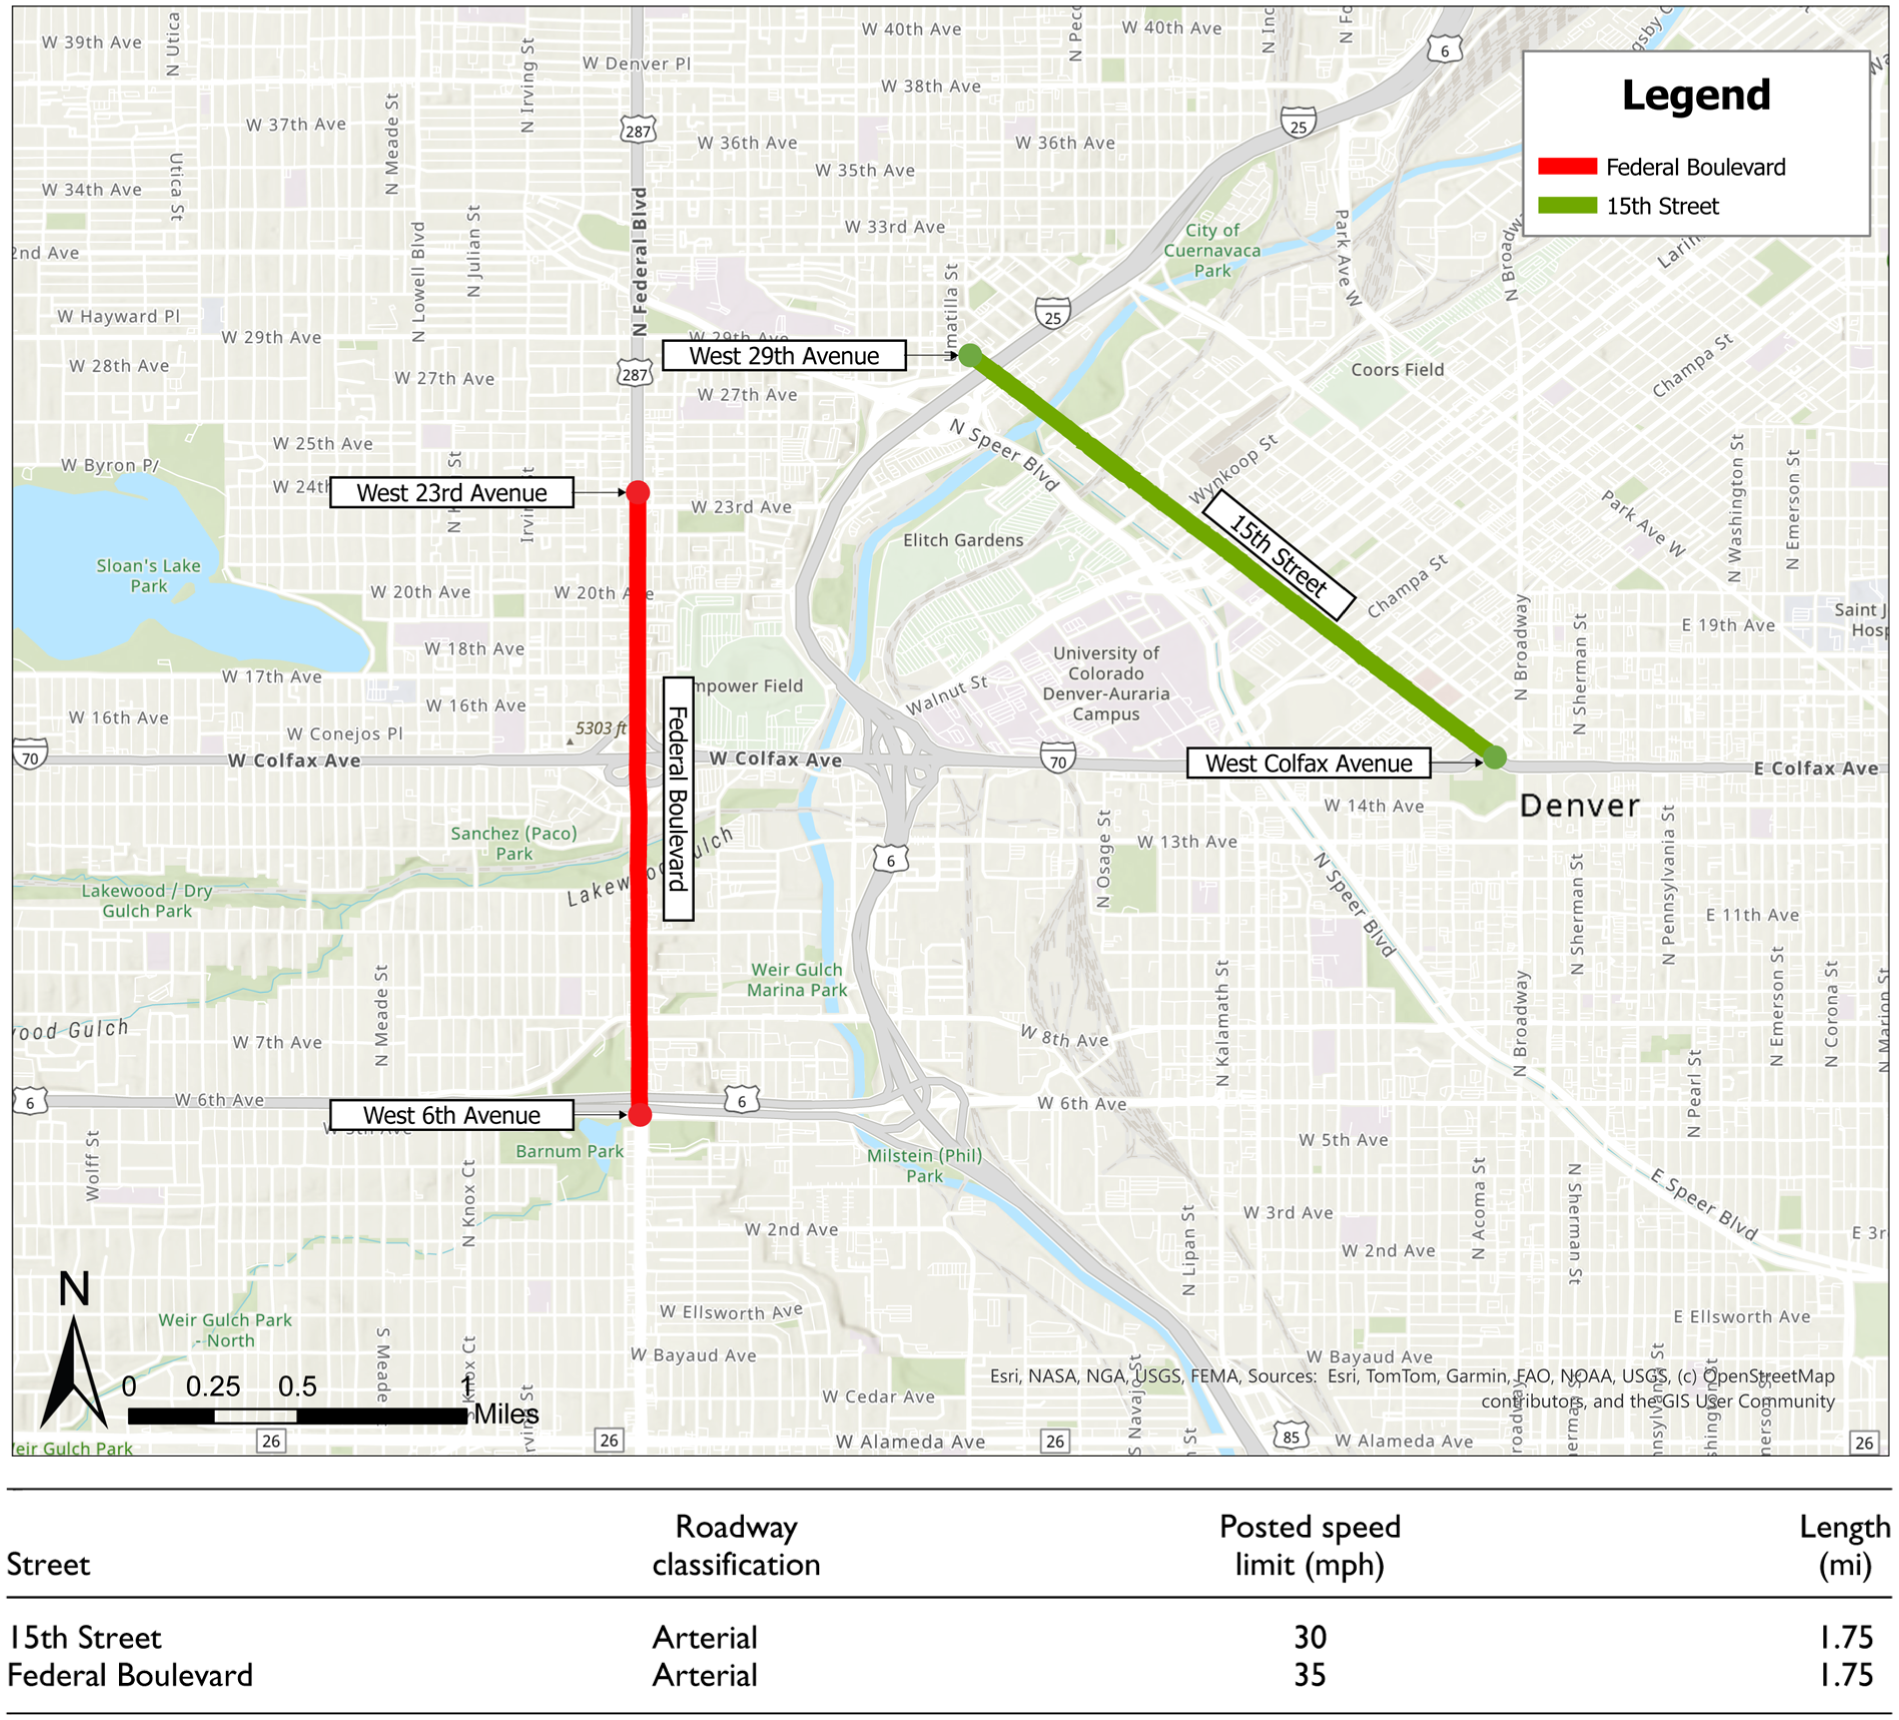
Preliminary analysis aerial map and roadway overview.
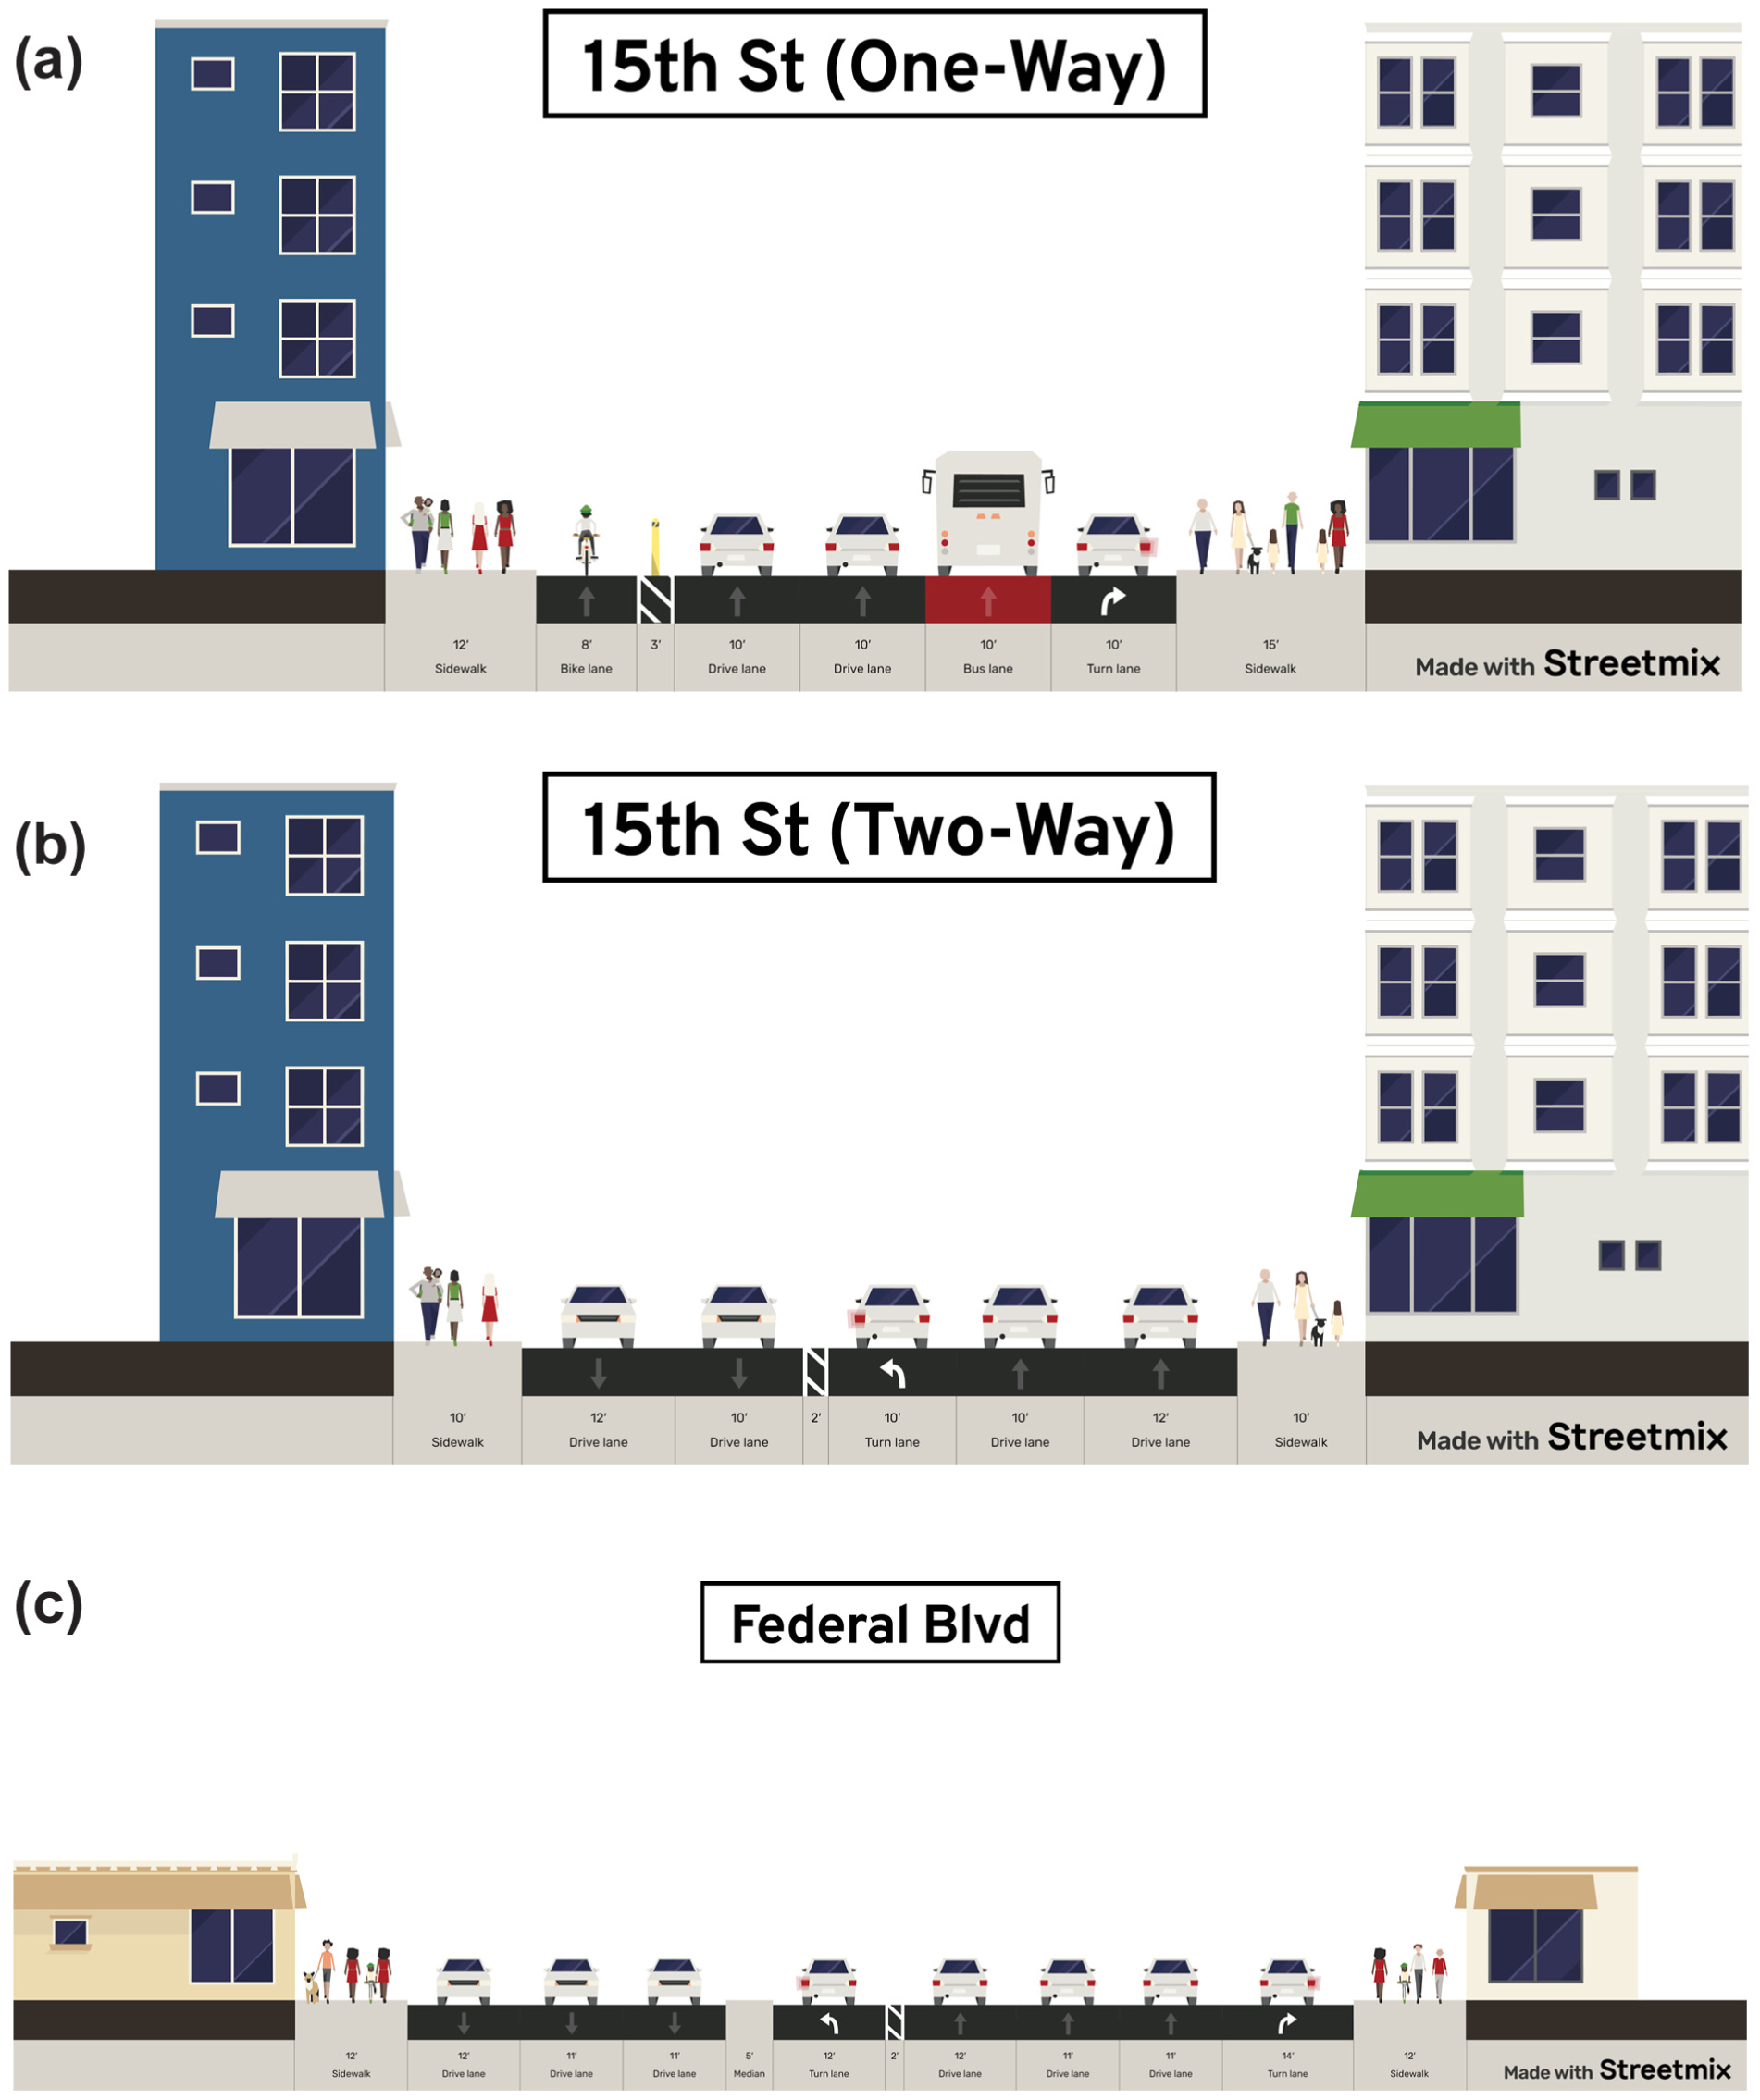
15th Street and Federal Boulevard roadway cross-sections: (a) 15th Street one-way, (b) 15th Street two-way, and (c) Federal Boulevard.
Selecting these two corridors allowed us to compare safety outcomes for bicyclists under contrasting conditions: a high-exposure, high-crash downtown corridor and a high-risk arterial roadway with comparatively lower bicyclist crash numbers. Although these corridors are situated in Denver, the methodology employed is applicable to any city seeking to improve its understanding of bicyclist safety.
Crash Data
We downloaded geocoded crash data from the Denver Open Data Catalog. Our analysis included 4 years of police-reported crash data (2019 to 2022), filtered to include only bicyclist–vehicle crashes. Each crash was reviewed to determine the direction of travel of all involved road users, ensuring a comprehensive understanding of the incident dynamics.
Exposure Data
Bicycle counts, often represented as the (annual) average daily bicyclist traffic, are commonly used to estimate annual bicycle traffic volumes for a facility ( 4 ). Cities have historically relied on short-term manual counts to capture bicyclist volumes. However, these methods are limited by their temporal scope and inability to account for seasonal or daily fluctuations in bicycle activity ( 4 ). Permanent continuous counters, which could capture year-round bicyclist activity, offer a more comprehensive solution, but they are costly and typically limited to single locations on a few individual facilities ( 2 ). Given the absence of continuous counters within our study area, we explored emerging data sources, such as big data from crowdsourced platforms, as alternatives to capture more accurate and widespread exposure data for bicyclists ( 5 ).
Crowdsourced platforms like Strava Metro have gained increasing recognition as valuable tools for understanding bicyclist behavior and exposure. Strava Metro uses real-time GPS data from the millions of users of its fitness app to track bicycling activity, providing continuous spatial and temporal data that have been increasingly applied to analyze bicyclist safety ( 5 , 6 ). Strava’s global database, which spans more than 30 million segments, captures data on route choices, activity patterns, and relative bicyclist traffic flows across roadway segments, making it a powerful resource for urban transportation analysis. Although Strava’s user base skews younger and male ( 7 ), studies have shown that its data correlate well with other transportation data, such as American Community Survey metrics, which confirms it usefulness for understanding urban bicycling patterns ( 8 ).
In this study, Strava Metro data were used as a proxy for bicyclist exposure rather than as a measure of absolute bicyclist volumes. Since the dataset captures only trips recorded by Strava users, it does not represent the full bicycling population. Accordingly, the analysis focused on relative exposure comparisons across corridors rather than estimating absolute bicyclist volumes. This approach allowed the study to assess differences in relative safety conditions between roadways based on the distribution of bicyclist activity.
Watkins et al. studied the relationship between actual bicyclist ridership and crowdsourced Strava data in Atlanta, GA ( 6 ). The study suggested that although the data represented a small percentage of all bicyclists, it proved useful in relation to relative counts as well as route choice. One notable issue was that the Strava data skewed toward younger, male cyclists, but they also reported that such data can be used to assess which roadways bicyclists avoid and changes in ridership dependent on available infrastructure or bicycle facilities ( 6 ). In other words, the literature suggests Strava bicyclists utilize similar routes to other bicyclists and exhibit similar ridership patterns ( 5 ).
Alternative sources of exposure data, such as StreetLight, also leverage location-based services to estimate bicyclist and pedestrian counts. However, these platforms have been shown to misclassify micromobility users, such as electric scooters, as bicyclists, which may introduce inaccuracies into the analysis ( 9 ). To avoid such misclassification, our study selected Strava Metro, despite the inherent limitation of its self-reported activity, which represents only a subset of the total bicycling population.
To match the crash data, Strava data from 2019 to 2022 were integrated into ArcGIS (geographic information system software), where they were spatially joined with street centerlines and crash data. This allowed us to estimate annual bicyclist volumes and examine route choices within the study area. Future analyses should aim to incorporate continuous counter-based bicycle data.
Exposure Metrics
Metrics like the bicycle–vehicle crash rate (BCR) and bicycle–vehicle segment crash rate (BSCR) have been discussed in the literature as useful tools for incorporating exposure into safety assessments ( 10 , 11 ). By factoring in both bicycle volumes and trip lengths, these metrics provide a more comprehensive assessment of relative safety across different corridors, offering insights that crash data alone may miss. For example, two roads may experience similar crash totals, but one may have much higher exposure as a result of greater bicyclist traffic or longer trip lengths. In other words, exposure metrics such as BCR and BSCR may help cities identify corridors that are disproportionately risky for bicyclists, even if their crash totals are relatively low ( 10 , 11 ).
To assess relative safety in this study, we calculated the BCR to quantify the number of bicyclist–vehicle crashes per unit of bicyclist activity, without considering trip length. The BCR was calculated for each crash severity during the 4-year study period for all study area streets using Equation 1,

where
BCR is bicycle–vehicle crash rate per 10,000 bicyclists,
C is total number of bicyclist–vehicle crashes within the study period,
V is average number of bicyclists per year (bidirectional) for the study period.
We also calculated the BSCR with Equation 2, which accounted for both traffic volumes and roadway mileage. The BSCR is calculated as follows:

where BSCR is bicycle–vehicle crash rate for roadway segment expressed in bicyclist–vehicle crashes per million bicycle-miles traveled, and L is roadway length in miles.
BSCR may also help identify whether high-traffic roads are inherently riskier or if specific segments of a corridor pose unique dangers ( 12 ).
It is possible to conceptualize bicyclist safety as a function of motor vehicle exposure, since bicycle–vehicle crashes occur only when both road users are present in the same location at the same time. In this sense, higher motor vehicle volumes may increase the potential for conflict between bicyclists and motorists. Some studies have examined crash risk using both bicyclist and motor vehicle exposure measures to better understand interactions between the modes. However, the primary objective of this study was to evaluate safety from the perspective of the bicyclist by examining crash rates relative to bicyclist exposure. This approach is commonly used in bicyclist safety research because it reflects the level of risk experienced by an individual bicyclist when traveling on a given facility ( 13 ).
Temporal variation in bicyclist and motor vehicle activity may also influence exposure to risk. Bicyclist–vehicle crashes occur only when both road users are present simultaneously on the roadway, meaning that differences in time-of-day, day-of-week, or seasonal travel patterns may affect the likelihood of conflicts. Examining these temporal dynamics was beyond the scope of the present study, which focuses on corridor-level risk per bicyclist using aggregate exposure estimates. Future research could incorporate time-resolved bicycle and motor vehicle volume data to better understand how temporal patterns influence crash risk across different roadway environments.
Results
In this section, we first present the raw crash data, including the total number of crashes and the distribution of crashes between those occurring along the main roadway and those occurring when bicyclists were crossing the roadway at intersections. This analysis provides a baseline for understanding crash patterns; however, the impact of exposure data will be explored in subsequent sections to provide a more nuanced understanding of safety on these corridors.
Crash Data
Table 1 presents the number of bicyclist–vehicle crashes recorded on 15th Street and Federal Boulevard between 2019 and 2022 without accounting for road user exposure. The data are categorized by total bicyclist–vehicle crashes, as well as crashes involving bicyclists traveling along the main roadway and those involving bicyclists crossing the main roadway from a cross street.
Number of Bicycle–Vehicle Crashes per Bicyclist Movement Approach for 2019 to 2022
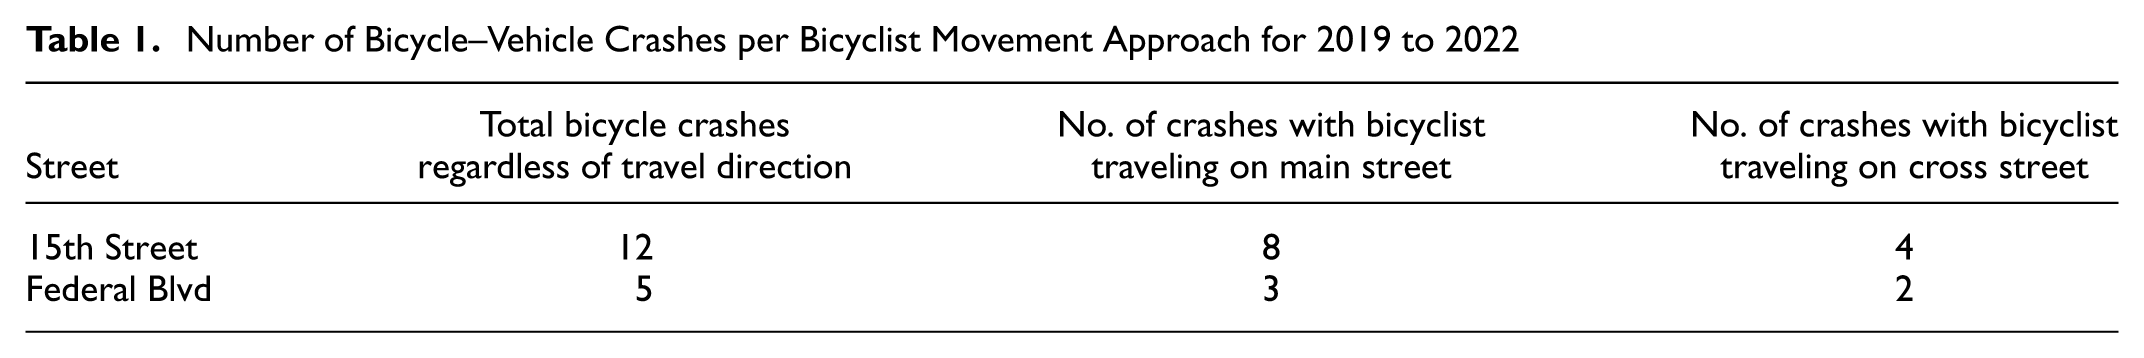
On 15th Street, a total of 12 bicyclist–vehicle crashes were recorded during the study period, with the majority of these crashes occurring while bicyclists were traveling along the main roadway. This finding aligns with the street’s well-documented status as a high-risk corridor for bicyclists ( 14 ). In contrast, Federal Boulevard recorded five bicyclist–vehicle crashes, but a slightly higher proportion of these crashes, three of the five, occurred when bicyclists were crossing the main roadway at intersections, compared with just two crashes occurring while bicyclists were traveling along the main roadway.
Bicyclist Counts
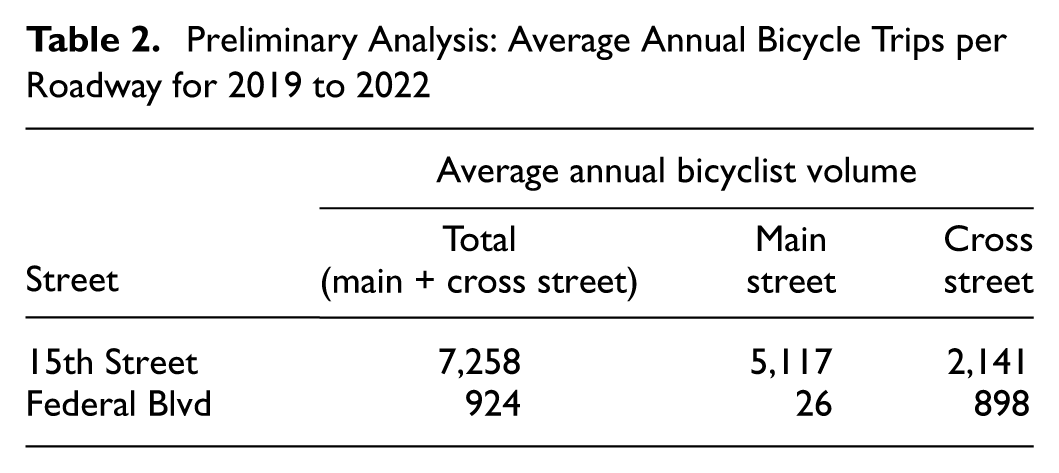
Table 2 compares the average annual bicyclist volume on 15th Street and Federal Boulevard from 2019 to 2022. 15th Street recorded a total of 7,258 bicyclist trips per year, far exceeding the volumes on Federal Boulevard of only 924 bicyclists per year.
Preliminary Analysis: Average Annual Bicycle Trips per Roadway for 2019 to 2022
Bicycle Safety Metrics
Table 3 presents a comparison of bicycle safety metrics between Federal Boulevard and 15th Street, considering all directions of bicycle travel. This table integrates BSCR, BCR, and raw bicyclist–vehicle crash totals and ratios, without distinguishing the direction the bicyclists were traveling.
Preliminary Comparative Bicycle Safety Metrics between Federal Boulevard and 15th Street Regardless of Direction of Bicycle Travel (2019 to 2022)
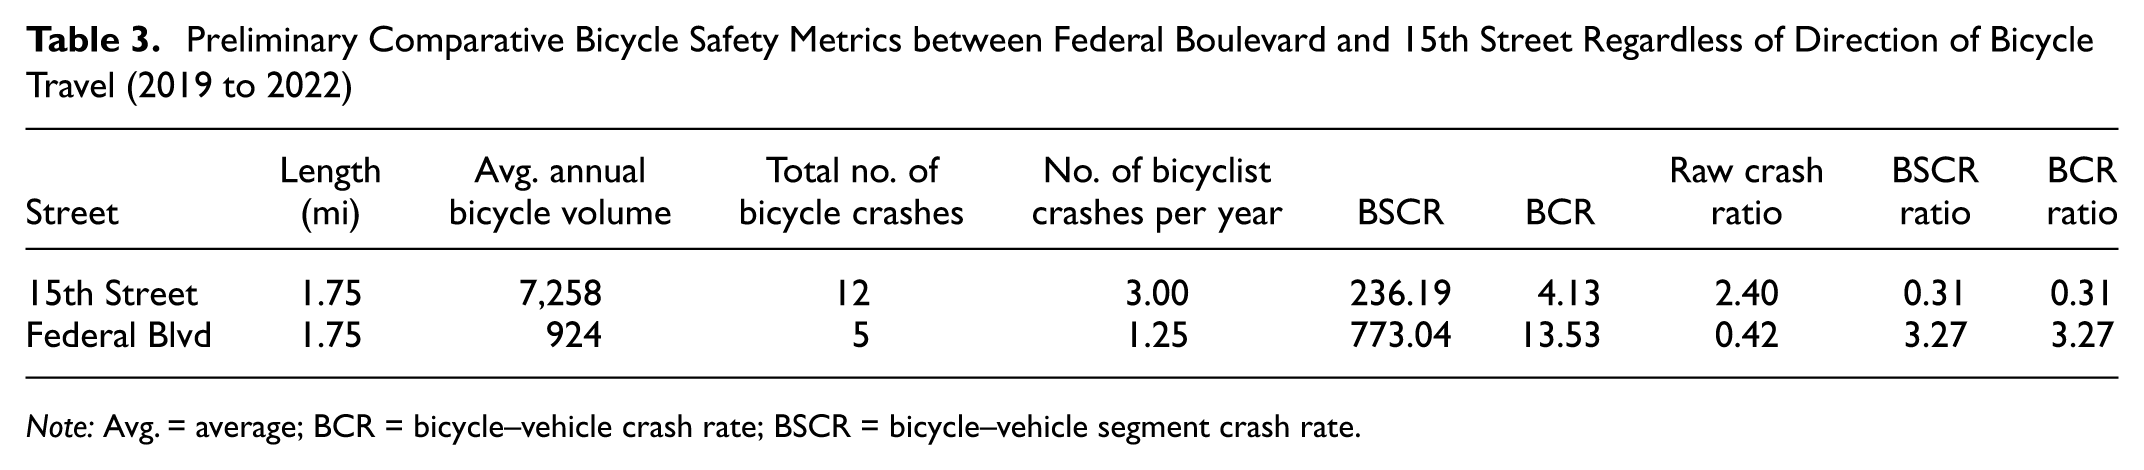
Note: Avg. = average; BCR = bicycle–vehicle crash rate; BSCR = bicycle–vehicle segment crash rate.
Over the study period from 2019 to 2022, 15th Street recorded 12 bicyclist–vehicle crashes, whereas Federal Boulevard had five bicyclist–vehicle crashes regardless of the direction of bicycle travel. When comparing the raw bicycle–vehicle crash ratios between 15th Street and Federal Boulevard, 15th Street had 2.40 times more bicycle–vehicle crashes than Federal Boulevard. This suggests that 15th Street might be a riskier corridor for bicyclists.
However, having incorporated exposure metrics, different trends emerged. Federal Boulevard’s BSCR was 773.04 crashes per million bicycle-miles, three times higher than 15th Street’s 236.19. Federal Boulevard’s BCR of 13.53 crashes per 10,000 bicyclists was three times higher than 15th Street’s 4.13.
Table 4 shifts the focus to bicycle volumes and crashes that occur when bicyclists travel specifically along the main streets of Federal Boulevard and 15th Street. This table offers a more focused analysis of the risks associated with main street bicycle travel, providing important insights into how infrastructure and traffic patterns affect bicycling safety.
Preliminary Comparative Bicycle Safety Metrics between Federal Boulevard and 15th Street for Main Street Direction of Bicycle Travel (2019 to 2022)
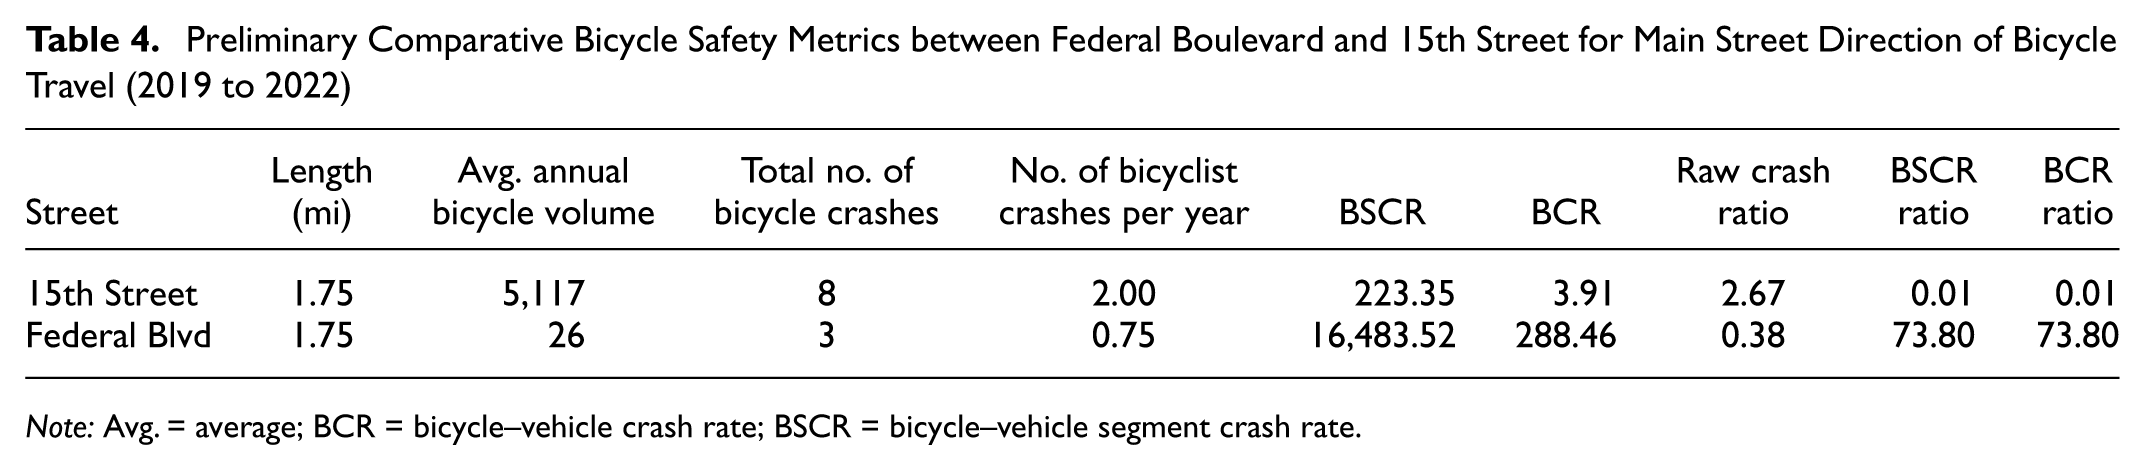
Note: Avg. = average; BCR = bicycle–vehicle crash rate; BSCR = bicycle–vehicle segment crash rate.
For bicyclist travel specifically along the main streets of Federal Boulevard and 15th Street, 15th Street again showed a higher bicycle–vehicle crash count with eight bicyclist–vehicle crashes, compared with three bicyclist–vehicle crashes for Federal Boulevard. However, when considering exposure, Federal Boulevard’s BSCR rose dramatically to 16,483.52, making it over 70 times riskier than 15th Street’s BSCR of 223.35. Similarly, Federal Boulevard’s BCR skyrocketed to 288.46, making it 70 times riskier than 15th Street’s BCR of 3.91.
These findings should also be interpreted in the context of very small exposure levels. When even a single crash occurs on a roadway segment with very small bicyclist volumes, rate-based metrics such as BCR and BSCR can become highly sensitive and produce relatively large values. As a result, locations with small exposure estimates may benefit from additional data collection, such as permanent or long-term bicycle counts, to better understand bicyclist activity levels before prioritizing infrastructural investments.
Table 5 narrows the analysis further by examining bicyclist safety at intersections where cross streets meet the main roadways. This table captures the safety dynamics encountered by bicyclists crossing the main streets, offering insights into the specific risks present at these critical points of intersection.
Preliminary Comparative Bicycle Safety Metrics between Federal Boulevard and 15th Street for Cross-Street Direction of Bicycle Travel (2019 to 2022)
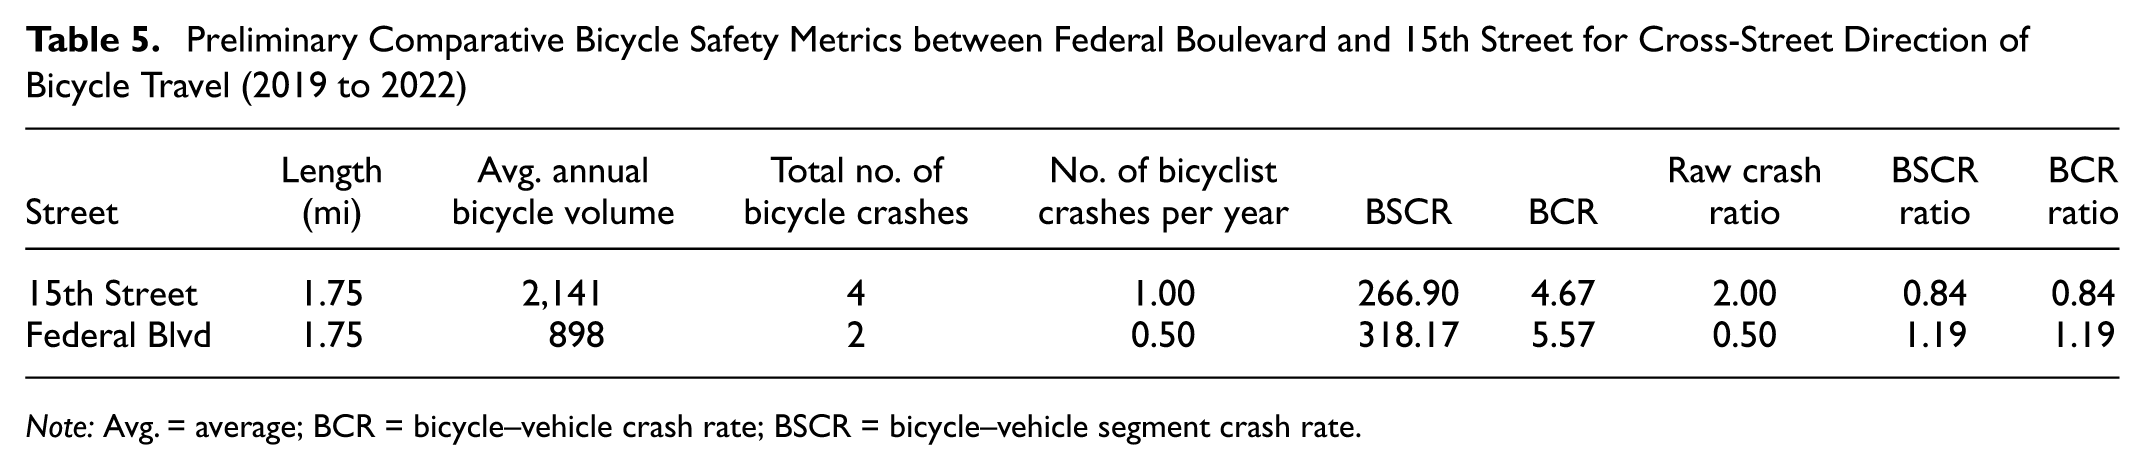
Note: Avg. = average; BCR = bicycle–vehicle crash rate; BSCR = bicycle–vehicle segment crash rate.
For cross-street travel, Federal Boulevard recorded two bicyclist–vehicle crashes compared with four bicyclist–vehicle crashes on 15th Street, half the number of bicycle–vehicle crashes. However, when accounting for exposure in cross-street travel, Federal Boulevard’s BSCR was 318.17, slightly higher than 15th Street’s 266.90. Federal Boulevard’s BCR was 5.57, slightly higher than 15th Street’s 4.67.
These results suggest that relying solely on raw bicyclist–vehicle crash totals to guide bicycle safety improvements can misrepresent the level of risk for bicyclists. Incorporating exposure metrics revealed that Federal Boulevard, despite having fewer crashes, presents a much higher relative risk than previously understood. Although 15th Street experiences more crashes overall, Federal Boulevard’s lower bicycle usage, combined with its considerable crash rates, showed an increased risk to individual bicyclists.
Implications for Further Investigation
These findings also raise the question of whether the relatively lower usage of Federal Boulevard is a result of bicyclists actively avoiding it owing to its perceived risks. Bicyclists may choose alternative routes or opt for other modes of transportation, which could lead to increased safety concerns on parallel streets. The potential for such avoidance behaviors warranted further investigation to understand the broader implications of a lack of safety on Federal Boulevard. As a result, in a secondary analysis, we compared bicycle–vehicle crashes and crash rates in Federal Boulevard with those of nearby local streets.
Secondary Analysis
Study Area Overview
Figure 3 illustrates the expanded study area, which includes Federal Boulevard and eight adjacent, parallel local roads. The surrounding local streets, although typically quieter and more comfortable for bicycling, serve as alternative routes for bicyclists looking to avoid the high traffic flow on arterials like Federal Boulevard. However, local streets alone do not always provide the necessary access to key destinations or serve as the most direct route to transit hubs or commercial areas. As a result, bicyclists may still be required to navigate Federal Boulevard, or cross it, to reach their destinations, perhaps highlighting the importance of understanding safety at the network level. Denver also recently updated its speed limit policy for local roads. Any local road without a posted speed limit sign now defaults to 20 mph, whereas local roads that have posted 25-mph signs retain their existing speed limit ( 15 ). Within the study area, Decatur Street and Knox Court have posted 25-mph signs, and therefore remain at 25 mph, whereas the other local streets operate under the new 20-mph default.
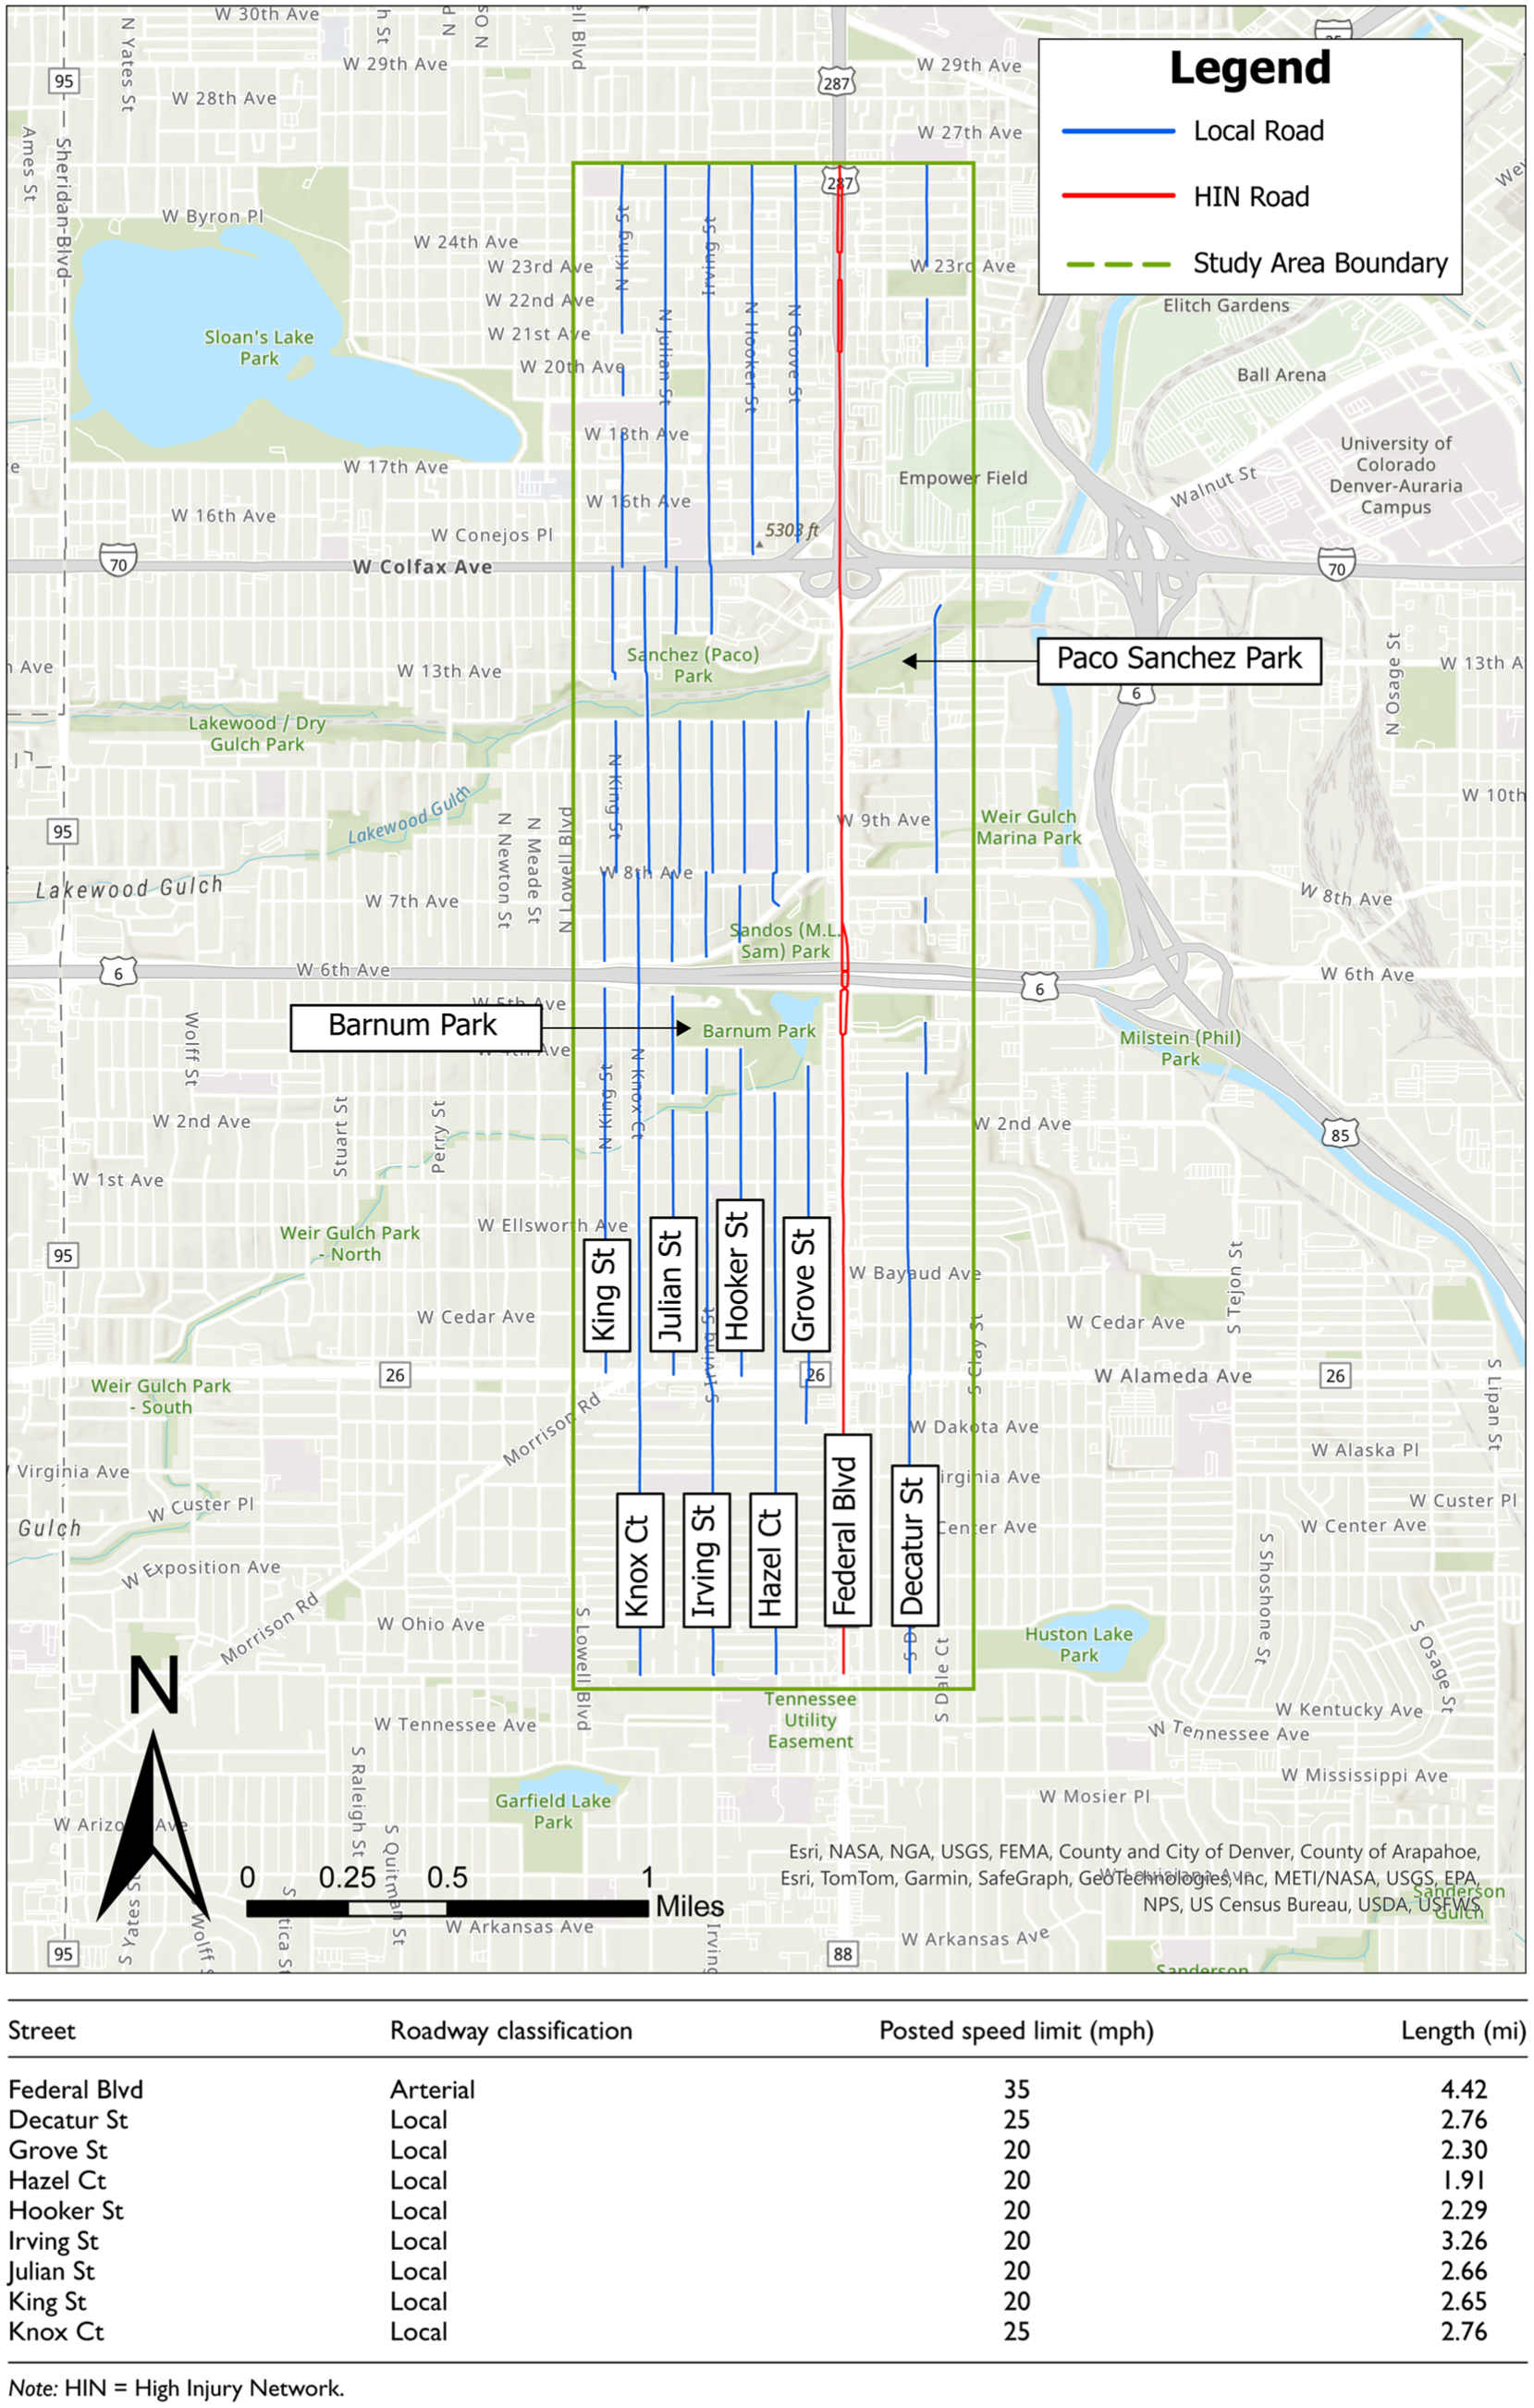
Secondary analysis study area aerial map and roadway overview.
Federal Boulevard’s roadway stretches further than the surrounding local roads, which also vary in length. To enable a balanced comparison between the arterial and local streets, we selected a study area boundary that included a segment of Federal Boulevard, ensuring consistent safety assessments across different road types. This study area was chosen not only for its mix of arterial and local streets but also because it illustrates real-world bicycling conditions. Understanding how bicyclists navigate both Federal Boulevard and the adjacent local streets, as well as the risks they face on each, may provide a more comprehensive overview of bicycling safety.
Crash Data
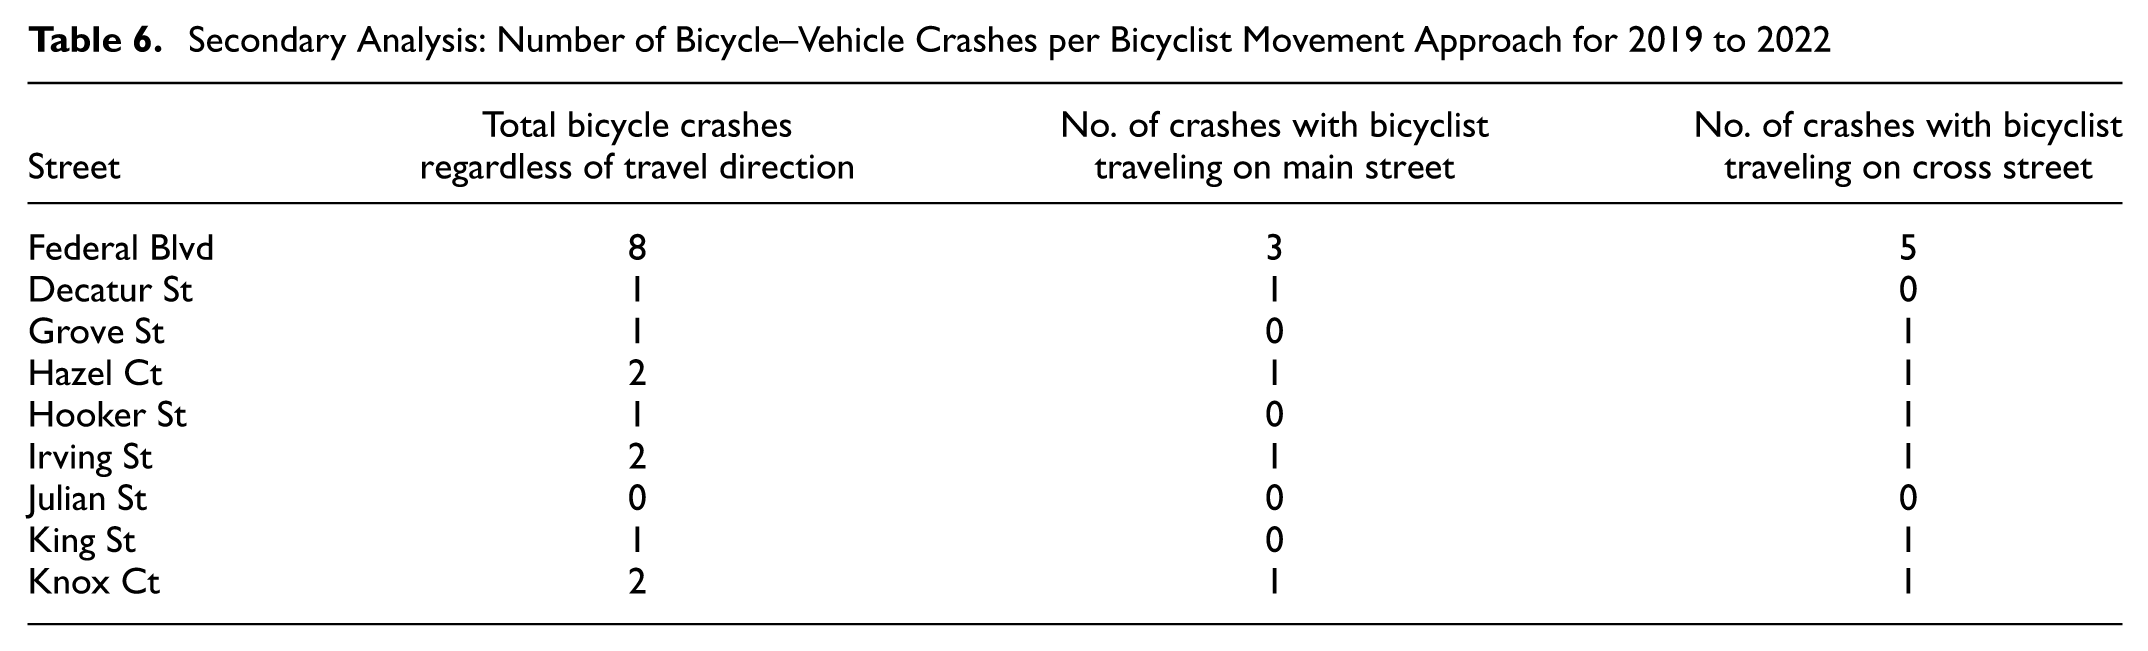
Table 6 presents the distribution of bicyclist–vehicle crashes on Federal Boulevard and the adjacent local streets from 2019 to 2022. Federal Boulevard recorded a total of eight bicyclist–vehicle crashes, with the majority occurring when bicyclists were crossing the street at intersections. In contrast, the local streets in the study area reported fewer crashes: Decatur Street, Hazel Court, Irving Street, and Knox Court each had two crashes; Grove Street, Hooker Street, and King Street each recorded 1 crash; and Julian Street reported no crashes during this period.
Secondary Analysis: Number of Bicycle–Vehicle Crashes per Bicyclist Movement Approach for 2019 to 2022
Exposure Data
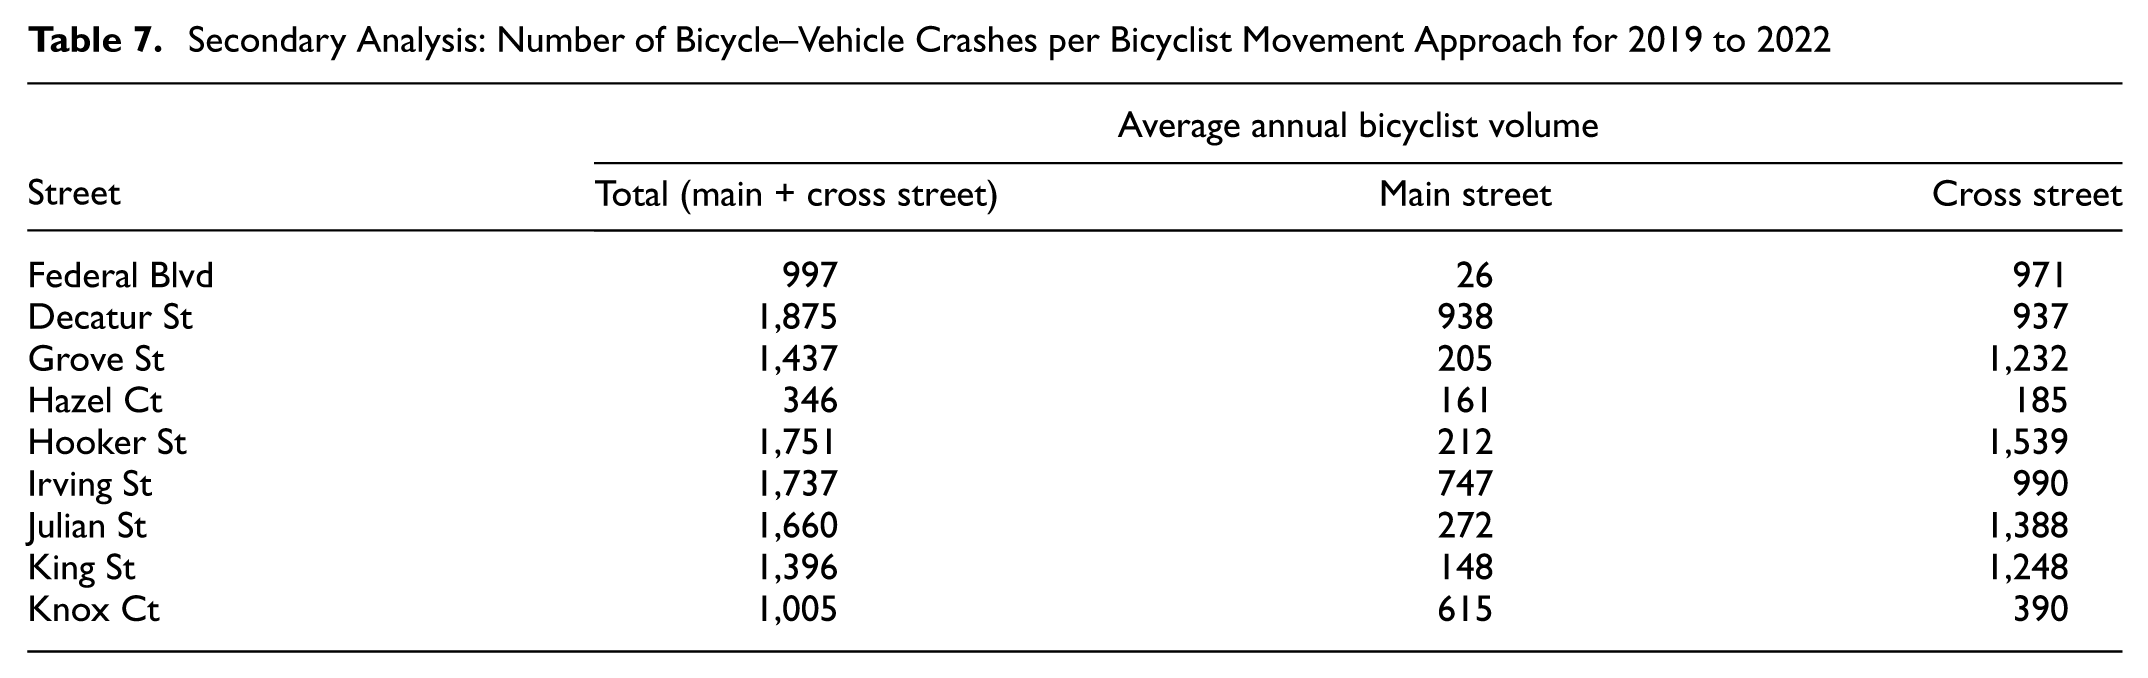
Table 7 illustrates that the local roads in the study area experienced significantly higher bicyclist ridership compared with Federal Boulevard. Among the local streets, Decatur Street had the highest bicyclist activity, with an average annual volume of 1,875 bicyclists, nearly double the 997 bicyclists recorded on Federal Boulevard. Although Federal Boulevard, as a major arterial, supports higher vehicle traffic volumes, local streets, which are typically quieter and more conducive to bicycling, attracted more bicyclists.
Secondary Analysis: Number of Bicycle–Vehicle Crashes per Bicyclist Movement Approach for 2019 to 2022
Bicycle Safety Metrics
Table 8 presents the BSCR and BCR for the study area. When exposure data were factored in through the BSCR, the risks for bicyclists on Federal Boulevard became much clearer. With a BSCR of 453.85, Federal Boulevard was nearly 10 times riskier to individual bicyclists than local streets like Decatur Street, which had a BSCR of 48.31. Other local streets, such as Grove Street and Irving Street, had even lower BSCRs.
Comparative Bicycle Safety Metrics Across Study Area Roadway Regardless of Direction of Bicycle Travel (2019 to 2022)
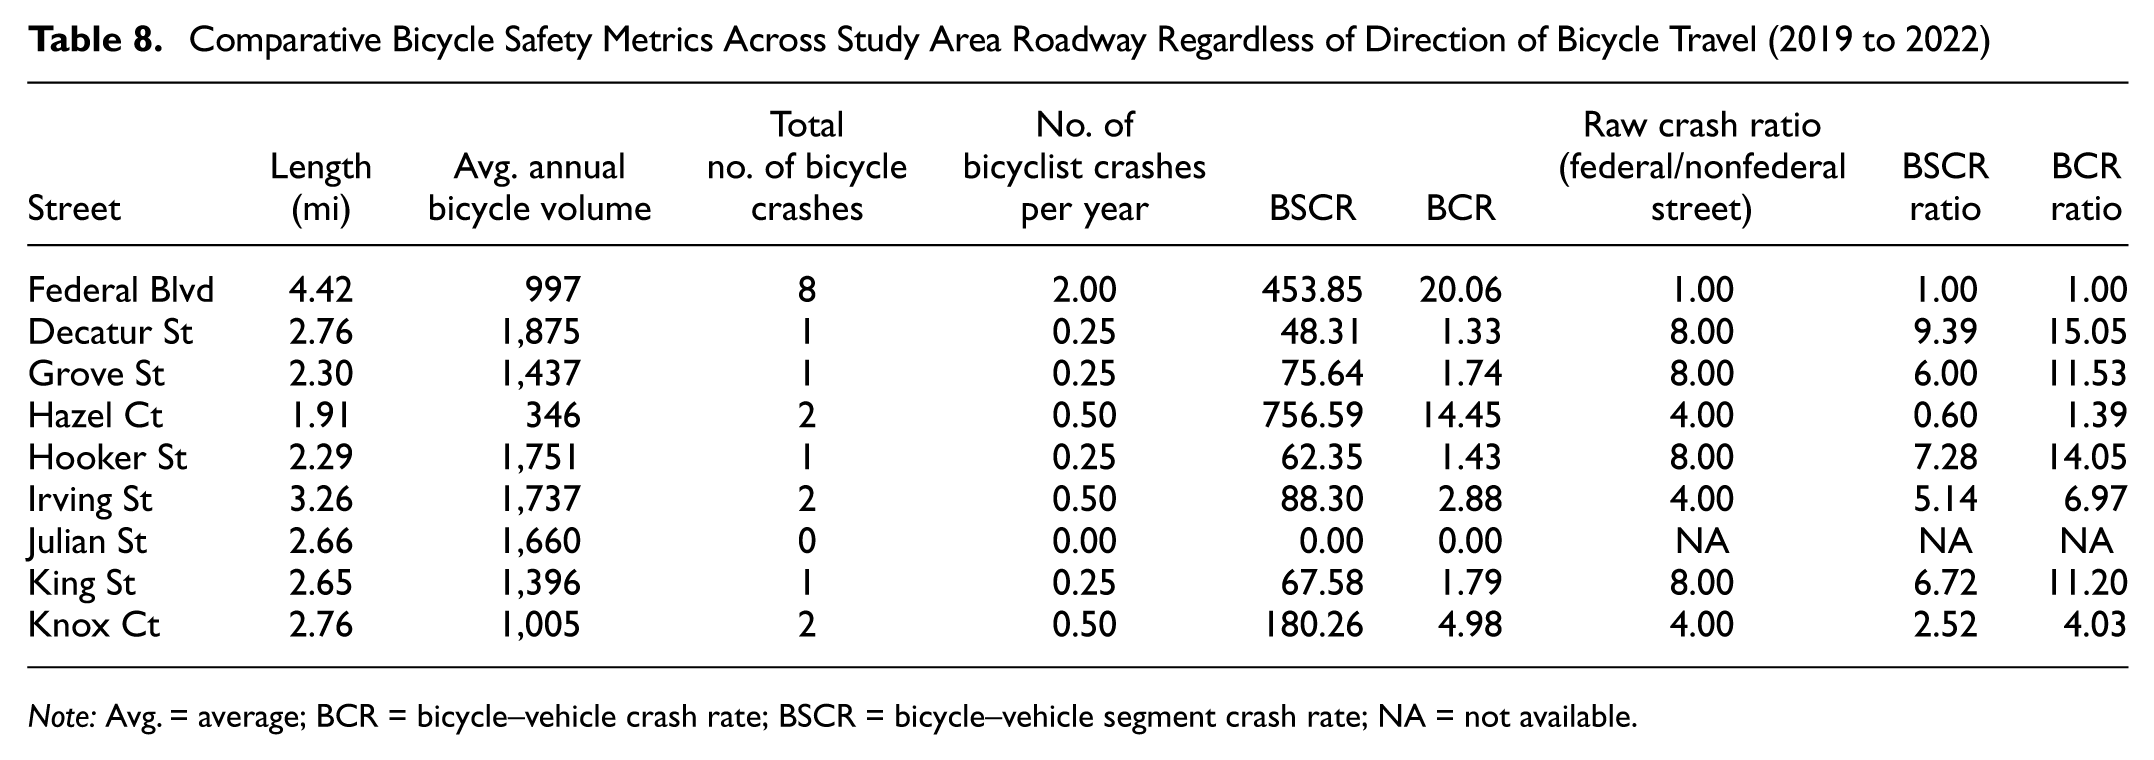
Note: Avg. = average; BCR = bicycle–vehicle crash rate; BSCR = bicycle–vehicle segment crash rate; NA = not available.
The BCR further refined our understanding by incorporating bicyclist volume. Federal Boulevard’s BCR of 20.06 was significantly higher than that of local roads such as Knox Court (4.98), making it roughly four times riskier. In comparison, local streets like Decatur Street (1.33) and Grove Street (1.74) showed much lower BCRs.
Table 9 isolates bicyclist travel along the main roads, focusing specifically on the longitudinal travel risks on Federal Boulevard and the surrounding streets. This more detailed examination highlights a stark disparity in safety when exposure is considered. Federal Boulevard’s BSCR increased dramatically to 6,526.28, making it 68 times riskier than Decatur Street’s BSCR of 96.57. Similarly, the BCR for Federal Boulevard rose to 288.46, nearly 110 times higher than Decatur Street’s BCR of 2.67.
Comparative Bicycle Safety Metrics for Main Street Bicycle Travel (2019 to 2022)
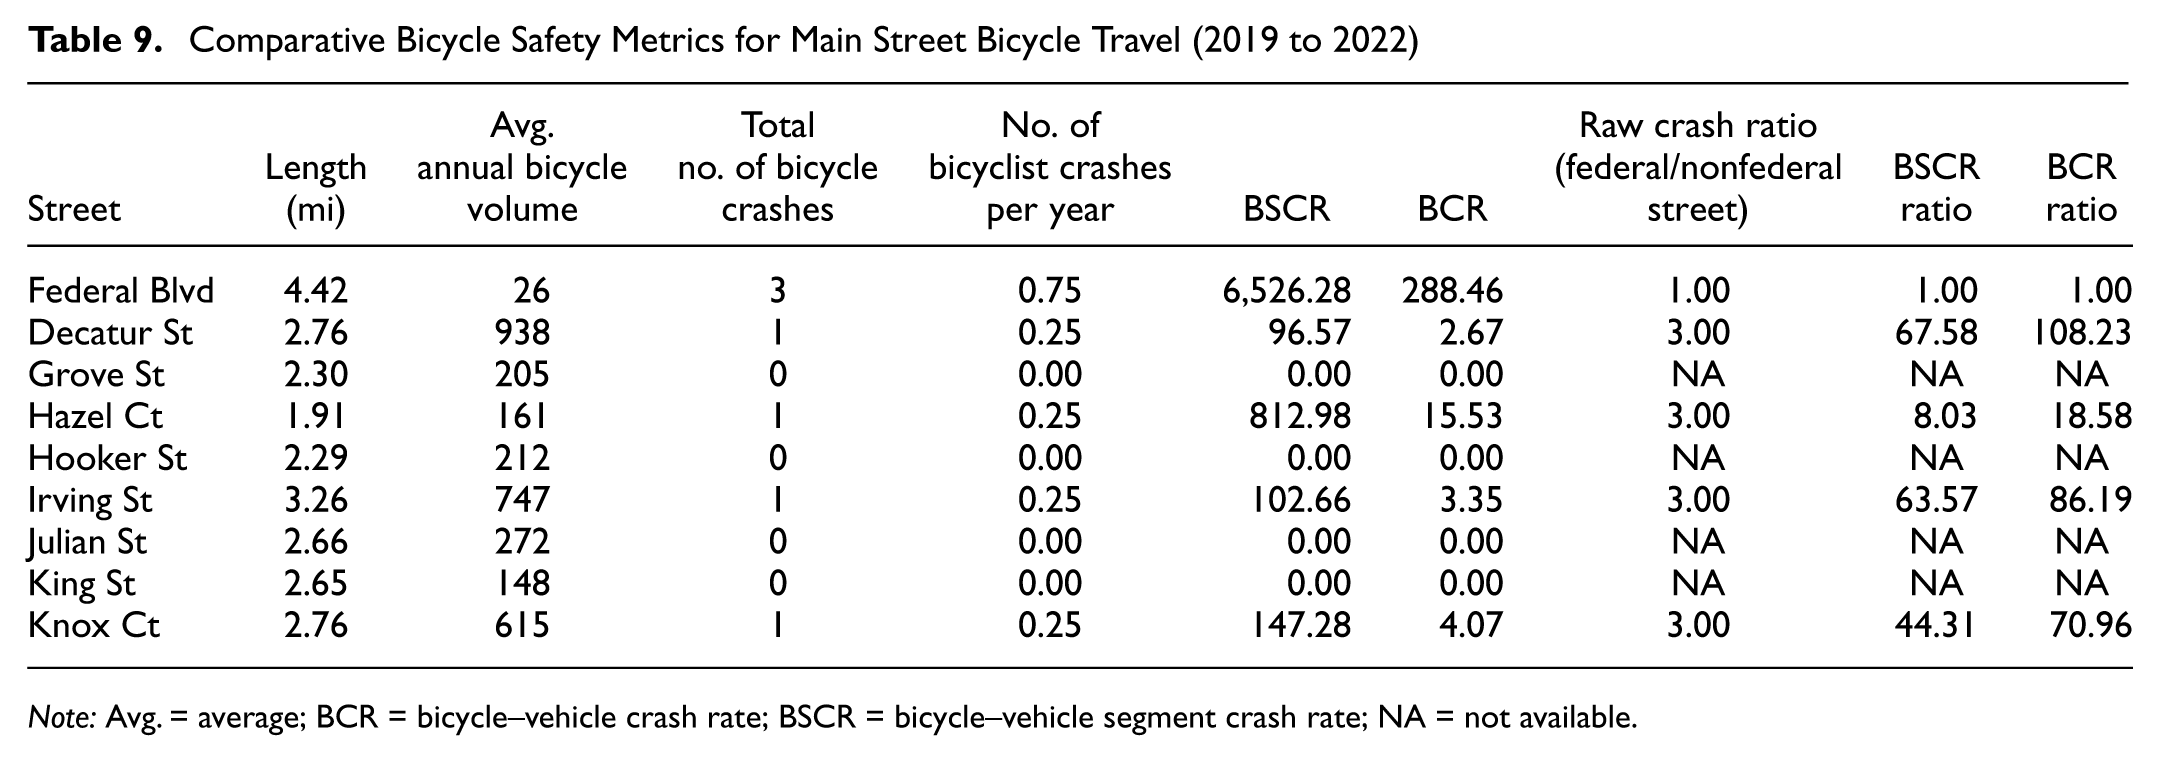
Note: Avg. = average; BCR = bicycle–vehicle crash rate; BSCR = bicycle–vehicle segment crash rate; NA = not available.
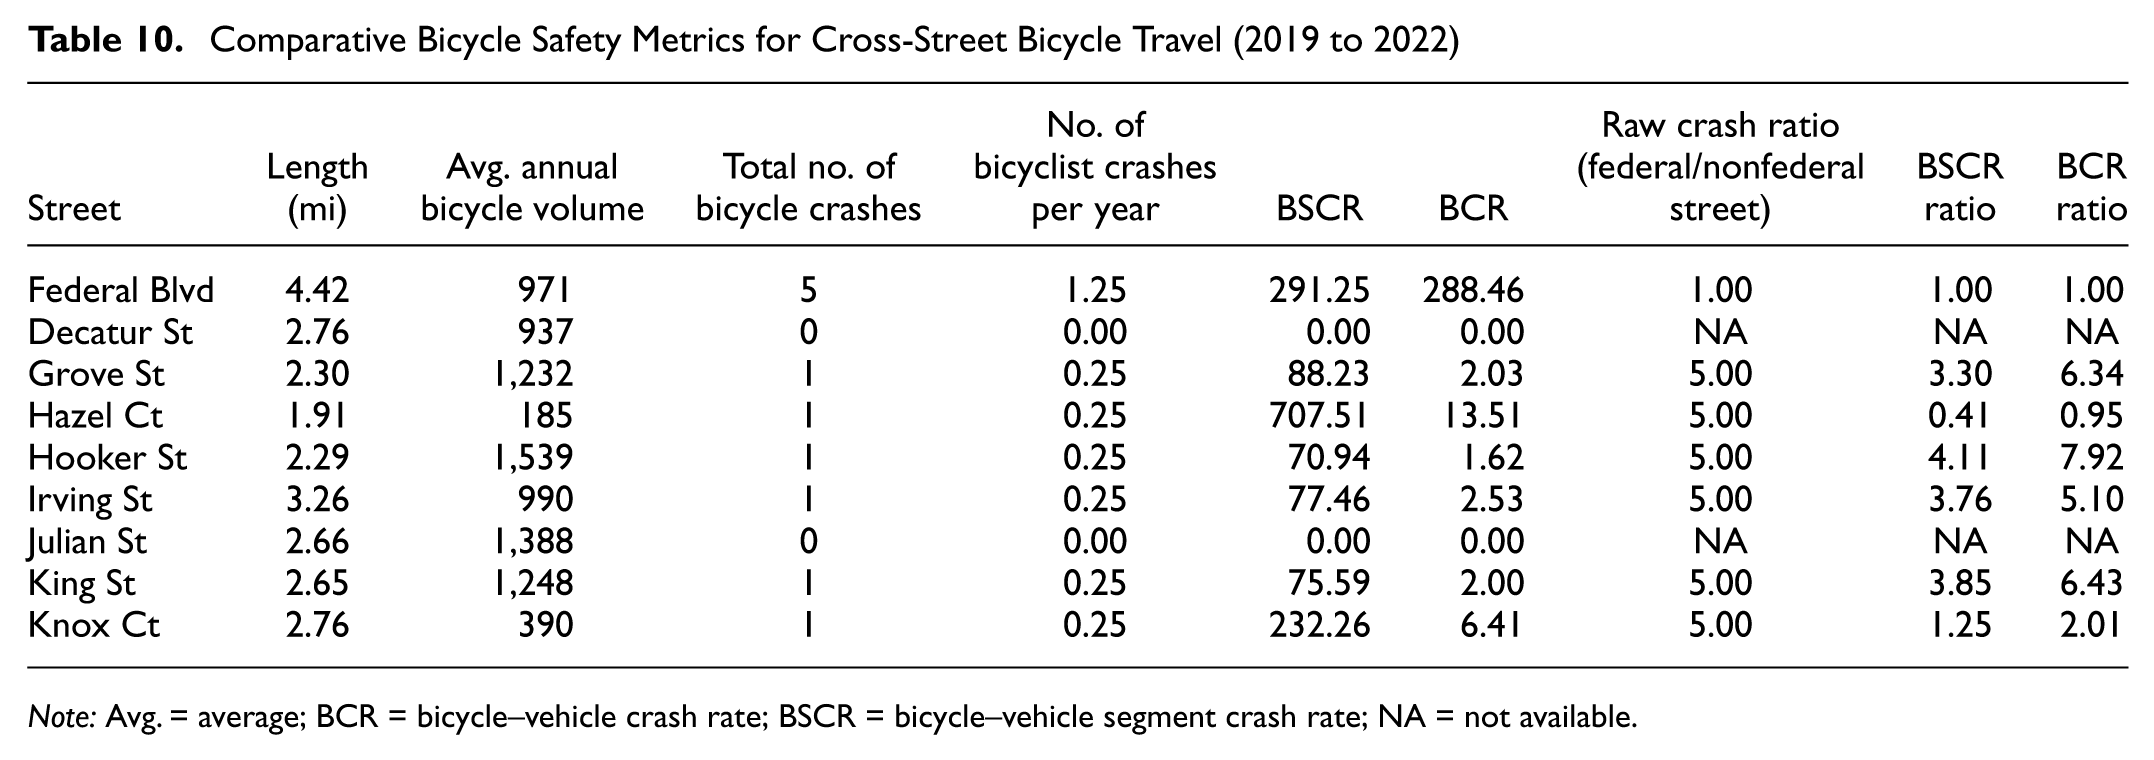
Table 10 shifts the focus to intersection safety, examining the risks associated with crossing Federal Boulevard and other main roads. At intersections, where bicyclists on cross streets meet the longitudinal traffic of arterial roads, our results suggest that the risks remained elevated. Although Federal Boulevard’s BSCR of 291.25 was high, Hazel Court had a higher cross-street BSCR of 707.51. Moreover, Federal Boulevard’s BCR of 12.87 remained substantially higher than those of most local streets, except for Hazel Court again, which had a BCR of 13.51.
Comparative Bicycle Safety Metrics for Cross-Street Bicycle Travel (2019 to 2022)
Note: Avg. = average; BCR = bicycle–vehicle crash rate; BSCR = bicycle–vehicle segment crash rate; NA = not available.
This distribution of crash data underscores the variability in safety challenges faced by bicyclists depending on their route choices and the type of roadway they are traveling on. The data highlighted that intersection safety is a key concern, particularly for bicyclists navigating more heavily trafficked roads like Federal Boulevard, and emphasized the need to consider not just crash totals but also the specific risks associated with different types of roads and bicyclist behaviors.
Although the analysis of parallel neighborhood routes showed that many bicyclists already choose local streets instead of Federal Boulevard, the findings did not imply that improving these parallel routes alone would resolve the area’s safety challenges. Denver already encourages people to bike on neighborhood streets, and the existence of these alternatives is precisely why the parallel-routes analysis matters. In other words, it helps us understand whether bicyclists are exposed to Federal Boulevard because they “choose” it or because they cannot avoid it.
Despite the availability of parallel routes, many key destinations within this locale—including transit stations, commercial areas, and schools—require bicyclists to cross or travel along Federal Boulevard. The highest risks occur at these unavoidable crossing points, not on the parallel routes themselves. Thus, the analysis does not merely show that Federal Boulevard is more dangerous than it seems, it also highlights where exposure is concentrated and why some riders remain at risk even when they prefer or attempt to use safer neighborhood streets.
This type of analysis can be used in a practical way. For example, a city might identify which parallel routes could serve as strong, low-stress connectors and which specific Federal Boulevard intersections still require protected crossings or signal improvements because they function as bottlenecks for people biking. In this sense, parallel-route analysis helps cities decide where improving neighborhood streets will meaningfully shift bicycle travel and where targeted safety investments on the arterial are still necessary because exposure cannot be eliminated. Therefore, although parallel routes are valuable, our results suggest that they cannot substitute for addressing dangerous crossing locations—in this case, on Federal Boulevard.
Conclusions
Conventional bicyclist safety evaluations have traditionally relied on raw crash data, focusing on the number and severity of bicyclist–vehicle collisions. This study assessed the importance of integrating bicyclist exposure data into safety evaluations to assess risk. The results suggest that before incorporating exposure data, Federal Boulevard was not considered to be a high-risk roadway for bicyclists. However, when exposure data were included in the analysis, the safety outcomes changed significantly. We found that Federal Boulevard, despite having far fewer bicyclist-related crashes than 15th Street, posed a much higher relative risk than previously understood. This shift highlights the role that exposure data could play in better assessing bicyclist safety.
By expanding the study area to include surrounding local streets, this research also shed light on how bicyclists might be avoiding certain streets or intersections that they perceive to be high risk, even if those areas do not show high crash totals. This finding challenges the assumption that low crash numbers necessarily equate to safe roads.
By combining bicyclist crash data with bicyclist exposure metrics, cities could potentially uncover hidden risks on roadways that may not appear hazardous based on crash totals alone ( 2 , 16 ). Federal Boulevard serves as a prime example of how exposure data can shift perceptions of risk level. This methodology is not unique to this study area; other cities around the world may have similar roadways that are perceived to be low risk but may actually pose significant dangers to bicyclists when exposure is considered.
Moving forward, the results suggest that it would be useful for cities to incorporate exposure-based bicyclist safety evaluations alongside traditional crash analyses. Doing so would enable a more nuanced understanding of the risks that bicyclists face, and provide additional information to support safety planning and infrastructural decisions, leading to better-targeted safety interventions and resource allocation.
Beyond these findings, this study also illustrates why the distinction between crash frequency and crash rate matters in practice. Whereas a corridor such as 15th Street may experience more crashes simply because many more bicyclists use it, a corridor such as Federal Boulevard poses much higher per-rider risk. These findings do not suggest that exposure-based metrics should replace traditional crash-frequency analyses in safety planning. Locations with higher crash totals may still represent opportunities to prevent a greater number of crashes when infrastructural improvements are implemented. Instead, exposure-based metrics provide additional context by highlighting corridors where the risk to individual bicyclists may be disproportionately high despite relatively low crash totals. In practice, combining crash frequency and exposure-based measures provides decision makers with more comprehensive information when evaluating safety conditions and prioritizing investment.
This difference has two practical implications. First, locations with high crash rates often offer the greatest potential for crash reduction because even modest safety improvements could reduce the risk for every person exposed. Second, evaluating safety through the lens of exposure is useful when the goal is to identify dangerous corridors and, for example, recommend where bicyclists should avoid or exercise extra caution until safety improvements can be implemented. Such applications also underscore the need for continuous and robust bicycle count data, which would allow cities to conduct stronger exposure-based analyses and make more informed decisions about policy, priorities, and future projects.
More broadly, the analytical approach presented in this study could be applied in other cities seeking to better understand bicyclist safety conditions. The key requirement for replicating this type of analysis is the availability of bicyclist exposure data that allow comparisons of relative bicycling activity across corridors. As more cities expand their bicycle counting programs and as emerging data sources such as crowdsourced mobility platforms become more widely available, practitioners may be better equipped to conduct exposure-based safety analyses. In practice, combining data from permanent bicycle counters with broader spatial datasets from sources such as Strava Metro may provide a practical pathway for cities to replicate and expand on this type of analysis.
This study has several limitations related to both the crash data and exposure estimates used in the analysis, such as the crash data relying on police-reported bicycle–vehicle crashes, which are known to underrepresent the true number of bicyclist crashes. Many bicycle–vehicle crashes are never reported to the police, particularly those involving minor injuries or property damage only. As a result, the crash rates presented in this study should be interpreted as indicative measures of relative risk rather than precise estimates of total crash risk.
In addition, the exposure estimates were derived from Strava Metro data, which represent only a subset of bicyclists who use the Strava application to record their trips. Although prior research suggests that Strava data can reasonably represent relative ridership patterns, the data do not capture all bicyclists and therefore likely underestimate total bicyclist volumes. Consequently, the exposure measures used in this study should also be interpreted as approximate indicators of relative bicyclist activity rather than exact counts. Despite these limitations, combining crash data with available exposure information can still provide valuable insights into relative safety conditions and help identify corridors where bicyclists may face disproportionately high risks. The validity of this approach relies on the assumption that Strava users exhibit route-choice behavior similar to the broader bicycling population. Prior research comparing Strava data with observed bicyclist counts suggests that whereas Strava represents only a subset of riders, it often reflects similar spatial patterns of bicycling activity, making it useful for understanding relative ridership and route selection ( 5 , 6 ).
Footnotes
Author Contributions
The authors confirm contribution to the paper as follows: study conception and design: W. Marshall; data collection: I. La; analysis and interpretation of results: I. La, W. Marshall; draft manuscript preparation: I. La, W. Marshall. All authors reviewed the results and approved the final version of the manuscript.
Declaration of Conflicting Interests
The authors declared no potential conflicts of interest with respect to the research, authorship, and/or publication of this article.
Funding
The authors disclosed receipt of the following financial support for the research, authorship, and/or publication of this article: The work presented in this study was conducted with support from the University of Colorado Denver and the Center for Transformative Infrastructure Preservation and Sustainability, a University Transportation Center funded by the U.S. Department of Transportation.
The contents of this study reflect the views of the authors, who are responsible for the facts and accuracy of the information presented.