
Abstract
Dynamic stress is a general mechanics term denoting time-varying stress. In this study, dynamic stress refers to the time-varying internal stress that develops and accumulates within the soil skeleton under cyclic loading, which is distinct from the externally applied cyclic stress in conventional unit-cell tests such as triaxial loading. It plays a critical role in soil deformation under cyclic loading, yet its cumulative characteristics have been insufficiently studied. This paper focuses on granite residual soil, examining the dynamic stress–strain curve’s variation and its cumulative relationship through systematic laboratory cyclic load tests and road model tests. Shakedown theory was applied to quantitatively evaluate subgrade soil stability using the critical stress level (SL). Laboratory cyclic load tests reveal that with increasing cyclic loading, hysteresis loops transition from sparse to dense, potentially overlapping, with a progressive reduction in area and shape transformation. The soil exhibits elastic deformation when the hysteresis curve fully closes at the end of a loading cycle. The phase relationship between internal dynamic stress and strain is initially characterized by the strain leading the stress; however, this relationship becomes more complex as the number of cycles increases. A strong linear correlation is observed between dynamic stress amplitude and elastic strain. Road model tests indicate that vehicle speed has minimal influence on residual dynamic stress accumulation, whereas subgrade depth plays a significant role. When the SL is below 40%, the subgrade soil structure remains stable. This study provides valuable insights for road structure design and traffic management planning.
Introduction
Dynamic stress in soil (referred to as dynamic stress) is a type of internal structural stress within the soil, and refers to the axial stress transmitted into the soil mass under external dynamic loading, distinct from external loads applied in unit-cell tests (e.g., triaxial tests). In a triaxial test the applied stress acts directly on the specimen boundary. On unloading of the applied stress, the stress at the specimen boundary returns to zero, whereas only a portion of the internally generated vertical dynamic stress can dissipate rapidly. Therefore, under cyclic loading, as a result of the soil’s plastic mechanical behavior, the vertical dynamic stress generated in the first cycle is not fully released during unloading; when the second loading cycle is applied, it superimposes on the unreleased component from the first cycle, leading to the accumulation of dynamic stress.
The cumulative phenomenon of dynamic stress response in soil is one of the significant characteristics of soil’s dynamic behavior under cyclic loading, and it influences the deformation behavior of the soil ( 1 – 3 ). An accurate understanding of this dynamic stress accumulation is therefore essential for predicting subgrade settlement and ensuring road infrastructure durability.
In the unit-cell tests, the applied external load is considered as the stress of the soil. In this case, after complete unloading, the internal stress of the soil mass is considered to be zero, implying no residual stress in the soil. However, extensive experiments have demonstrated that residual dynamic stresses commonly persist during soil unloading ( 4 ). Under traffic cyclic loads, these residual dynamic stresses accumulate and add to subsequent dynamic stress responses, leading to an increase in the cumulative residual dynamic stress within the soil ( 5 ).
Internationally, the investigation of soil behavior under cyclic loading has progressed along several parallel fronts. Foundational work by Seed and Idriss ( 6 ) established the strain-dependent nature of these properties, which remains a cornerstone of soil dynamics. Research on dynamic elastic modulus, for instance, has been critical. The work of Ling et al. ( 7 ) established a key hyperbolic model showing the degradation of modulus with increasing strain amplitude, while Akmaz et al. ( 8 ) further refined this by incorporating the effects of loading cycles and soil plasticity. Concurrently, the damping ratio has been characterized. Mog et al. ( 9 ) demonstrated that the damping ratio increases with cyclic shear strain, providing a framework to quantify energy dissipation, which was later expanded by Gao et al. ( 10 ) to include the influence of frequency and confining pressure. Beyond the stiffness and damping characteristics, understanding permanent deformation is crucial. Studies on pore pressure generation by Polito et al. ( 11 ) and Lei et al. ( 12 ) have provided essential models for predicting liquefaction potential and effective stress reduction, which directly govern the onset of large-scale strain accumulation. These collective findings provide the essential theoretical and empirical basis for our investigation into shakedown behavior, which synthesizes both the dynamic response (modulus, damping) and the long-term plastic deformation. However, element tests are limited by simplified stress paths and their inability to capture system-level effects such as stress redistribution in a layered pavement structure.
To overcome these limitations, numerical simulation methods, such as the finite element method (FEM) and the discrete element method (DEM), have become powerful tools. FEM allows for the analysis of complex boundary value problems, simulating the response of the entire pavement–subgrade system ( 13 , 14 ). DEM, on the other hand, provides invaluable insights into micromechanical behaviors such as particle rearrangement and force chain evolution, which are the fundamental drivers of macroscopic phenomena such as modulus degradation and energy dissipation ( 15 , 16 ). While powerful, the predictive accuracy of these models is heavily dependent on the calibration of complex constitutive laws, which themselves require robust experimental data.
A third approach, physical modeling, offers a direct means of observing system-level behavior. This ranges from full-scale instrumented test tracks ( 17 ), which provide the most realistic data but are prohibitively expensive, to more manageable scaled model tests ( 18 ). When properly designed based on principles of dynamic similarity, scaled models can effectively replicate key field mechanisms, such as the effects of moving wheel loads, and serve as a crucial bridge between simplified element tests and complex field conditions ( 19 ). Despite the significant engineering implications of these studies, the hysteretic characteristics of dynamic stress accumulation and its interaction with dynamic strain remain poorly understood.
A specific gap remains in the integrated understanding of internal dynamic stress accumulation within granite residual soil (GRS), a material widely used in South China but known for its challenging engineering properties, such as high porosity and susceptibility to water-induced disintegration ( 20 , 21 ). While many studies focus on strain accumulation, the direct measurement and analysis of the evolving internal stress state, and its direct link to the stability criteria defined by shakedown theory, is less explored for this specific material.
This study aims to bridge this gap through a combined experimental approach. We first conduct controlled laboratory cyclic loading tests on GRS to characterize its fundamental hysteretic stress–strain behavior and the evolution of its dynamic properties. We then employ a dynamically scaled road model test to investigate the accumulation of internal residual dynamic stress under simulated moving traffic loads. By interpreting these results within the framework of shakedown theory, we establish practical stability thresholds (critical stress levels) for GRS subgrades. This work provides not only a deeper mechanistic understanding of dynamic stress accumulation but also offers a scientifically grounded basis for the design and maintenance of road infrastructure built on this challenging soil.
Materials and Methods
Materials
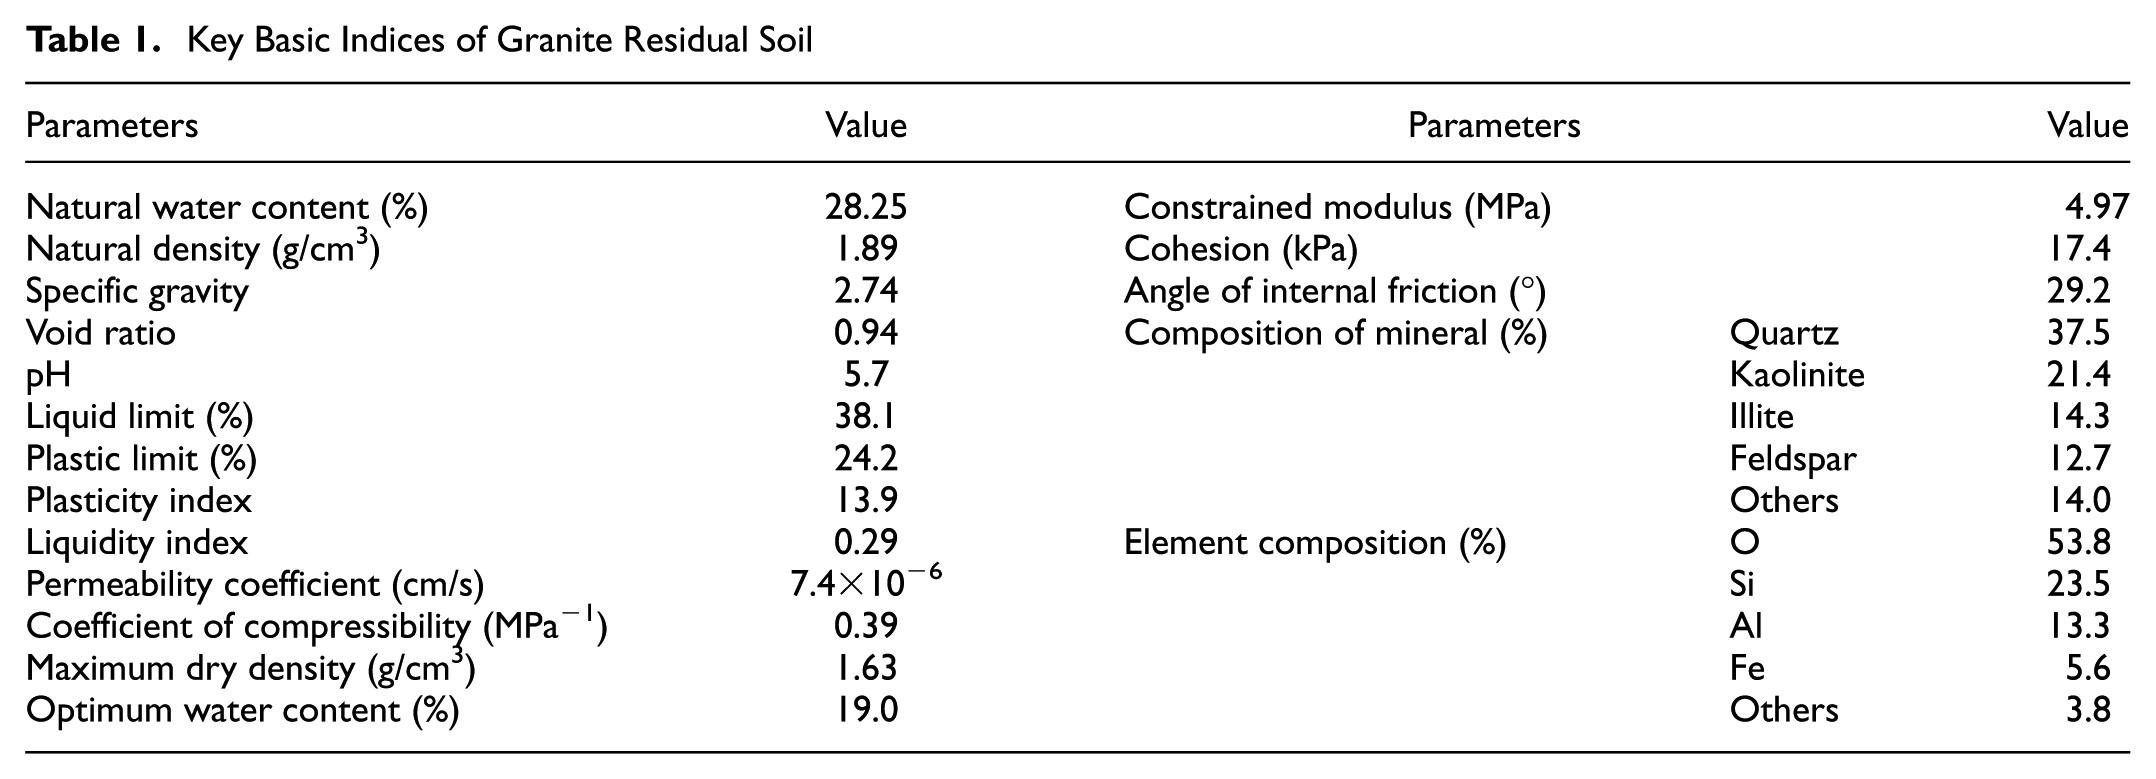
The GRS used in the experiments was collected from a construction site in Zhuhai, China, at a depth of 1 to 2 m. In its natural state, the GRS exhibited hues ranging from brown-yellow to yellow-red, showed a relatively uniform degree of weathering, and displayed a tendency to disintegrate and soften on exposure to water. The soil samples were sieved through a 2 mm mesh, and their basic physical and mechanical properties were determined following the Standard for Geotechnical Testing Methods ( 22 ), as summarized in Table 1. The physical characteristics indicated that the GRS is marked by high porosity, high strength, low density, and low compressibility. According to the Unified Soil Classification System ( 23 ), the GRS was classified as sandy clay (Figure 1).
Key Basic Indices of Granite Residual Soil
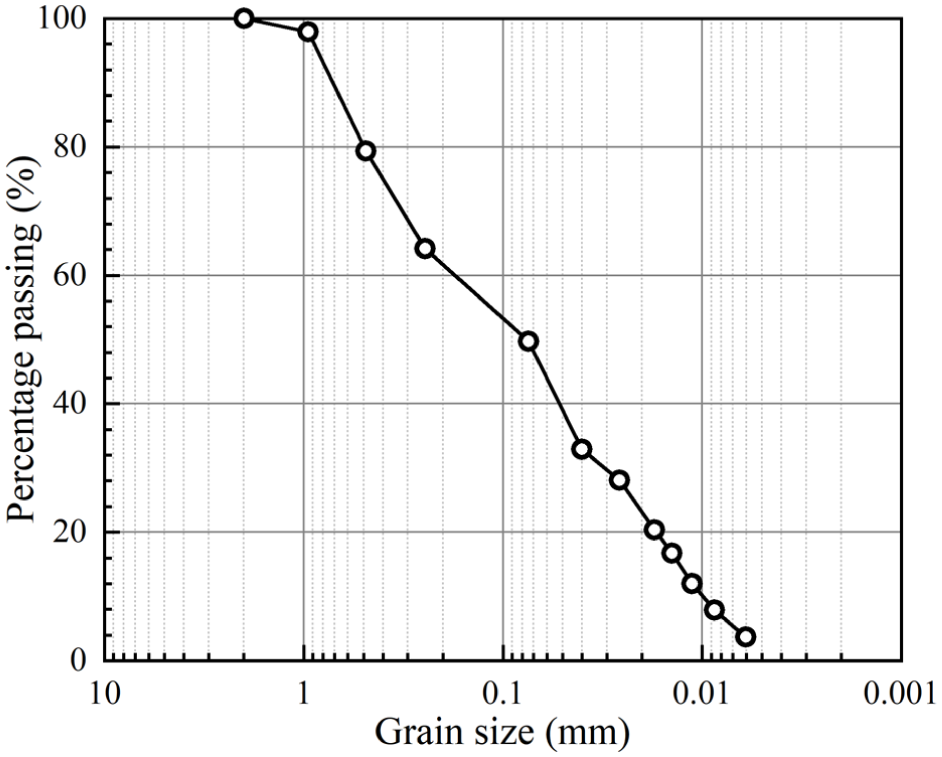
Particle size distributions of granite residual soil.
X-ray diffraction and energy-dispersive spectroscopy were employed to determine the mineralogical and elemental composition of the GRS. The results, presented in Table 1, indicate that quartz is the dominant component of the GRS, a mineral highly resistant to weathering. Quartz, being highly resistant to weathering, retains larger grain sizes during residual accumulation ( 24 ). However, it is susceptible to loss because of water-induced disintegration. The predominant clay minerals include kaolinite, illite, and feldspars, which contribute significantly to the soil’s cementation properties. The elemental composition is primarily oxygen, while Al, Fe, and Si collectively account for 42.4% of the total, and other elements constitute 46.2%. The high silica and alumina content results from the abundance of quartz and clay minerals, while iron is primarily present as hematite. Previous studies ( 25 ) have shown that hematite, as a cementing agent, can improve the strength of residual soil.
Methods
Laboratory cyclic loading tests were conducted using an electromechanical test systems (Figure 2c). Soil pressure cells (SPCs) were integrated into the specimens to monitor dynamic stress variations in real time. The type of SPC is LY-350, and the size is 32 mm in diameter and 5 mm in height. The testing procedure involved:
Preparation of specimens. According to the Standard for Geotechnical Testing Methods ( 22 ), the specimens were prepared as a remolded soil sample to ensure reproducibility and consistency. Bulk soil collected from the site was oven-dried, crushed, and passed through a 2 mm sieve. Based on the standard compaction test results (added to Table 1), the target moisture content was set to the optimum water content of 19%, and the target density was set to the maximum dry density of 1.63 g/cm3. The required amount of water was sprayed onto the soil and mixed evenly; it was then sealed in a plastic bag for 24 h to ensure uniform moisture distribution. The specimens were fabricated using the moist tamping method in 10 layers to achieve a uniform density throughout the height of H = 200 mm and the diameter of D = 200 mm. Although a height-to-diameter ratio (H/D) of 2 is typically recommended for standard triaxial tests to minimize end effects, an aspect ratio of H/D = 1 was adopted in this study to accommodate the embedded SPC (32 mm in diameter). A larger specimen diameter (D = 200 mm) was necessary to maintain a low sensor-to-specimen diameter ratio (∼0.16), thereby minimizing the “intrusion effect” of the sensors. To mitigate potential end-friction effects associated with this geometry, Vaseline was applied to the inner wall of the sample mold and the loading platens. As shown in Figure 2a, SPCs were embedded at positions corresponding to 1/4, 1/2, and 3/4 of the specimen height. The specimen’s lateral surface was wrapped with a plastic film to simulate the lateral confinement experienced by subgrade soil.
Specimen installation. Both the top and bottom platens were lubricated (with a thin layer of Vaseline) and aligned to prevent bending or eccentric loading paths. The specimen was mounted onto the universal testing machine. A preloading stress (6.4 kPa in this study) was applied to the specimen to maintain contact with the instrument. After stabilizing the connections between SPCs, the data acquisition system, and the computer, a dynamic load was applied to the specimen using the universal testing machine. A half-sine wave loading pattern was adopted in this study to better simulate actual traffic load conditions, a representative loading frequency of 0.5 Hz was selected because it accurately reflects the stress conditions experienced by subgrade soil under such loading scenarios. The test duration was set to 2,000 cycles, as this number of cycles was sufficient for the rate of accumulation in the cumulative residual dynamic stress to become negligible, indicating that a stable or steady-state response had been achieved.
The reliability of the test data was verified through unconfined uniaxial compression tests, which assessed the impact of embedded versus unembedded SPCs on specimen strength. The results showed a data discrepancy of approximately +3.43% (Appendix, Figure A1).
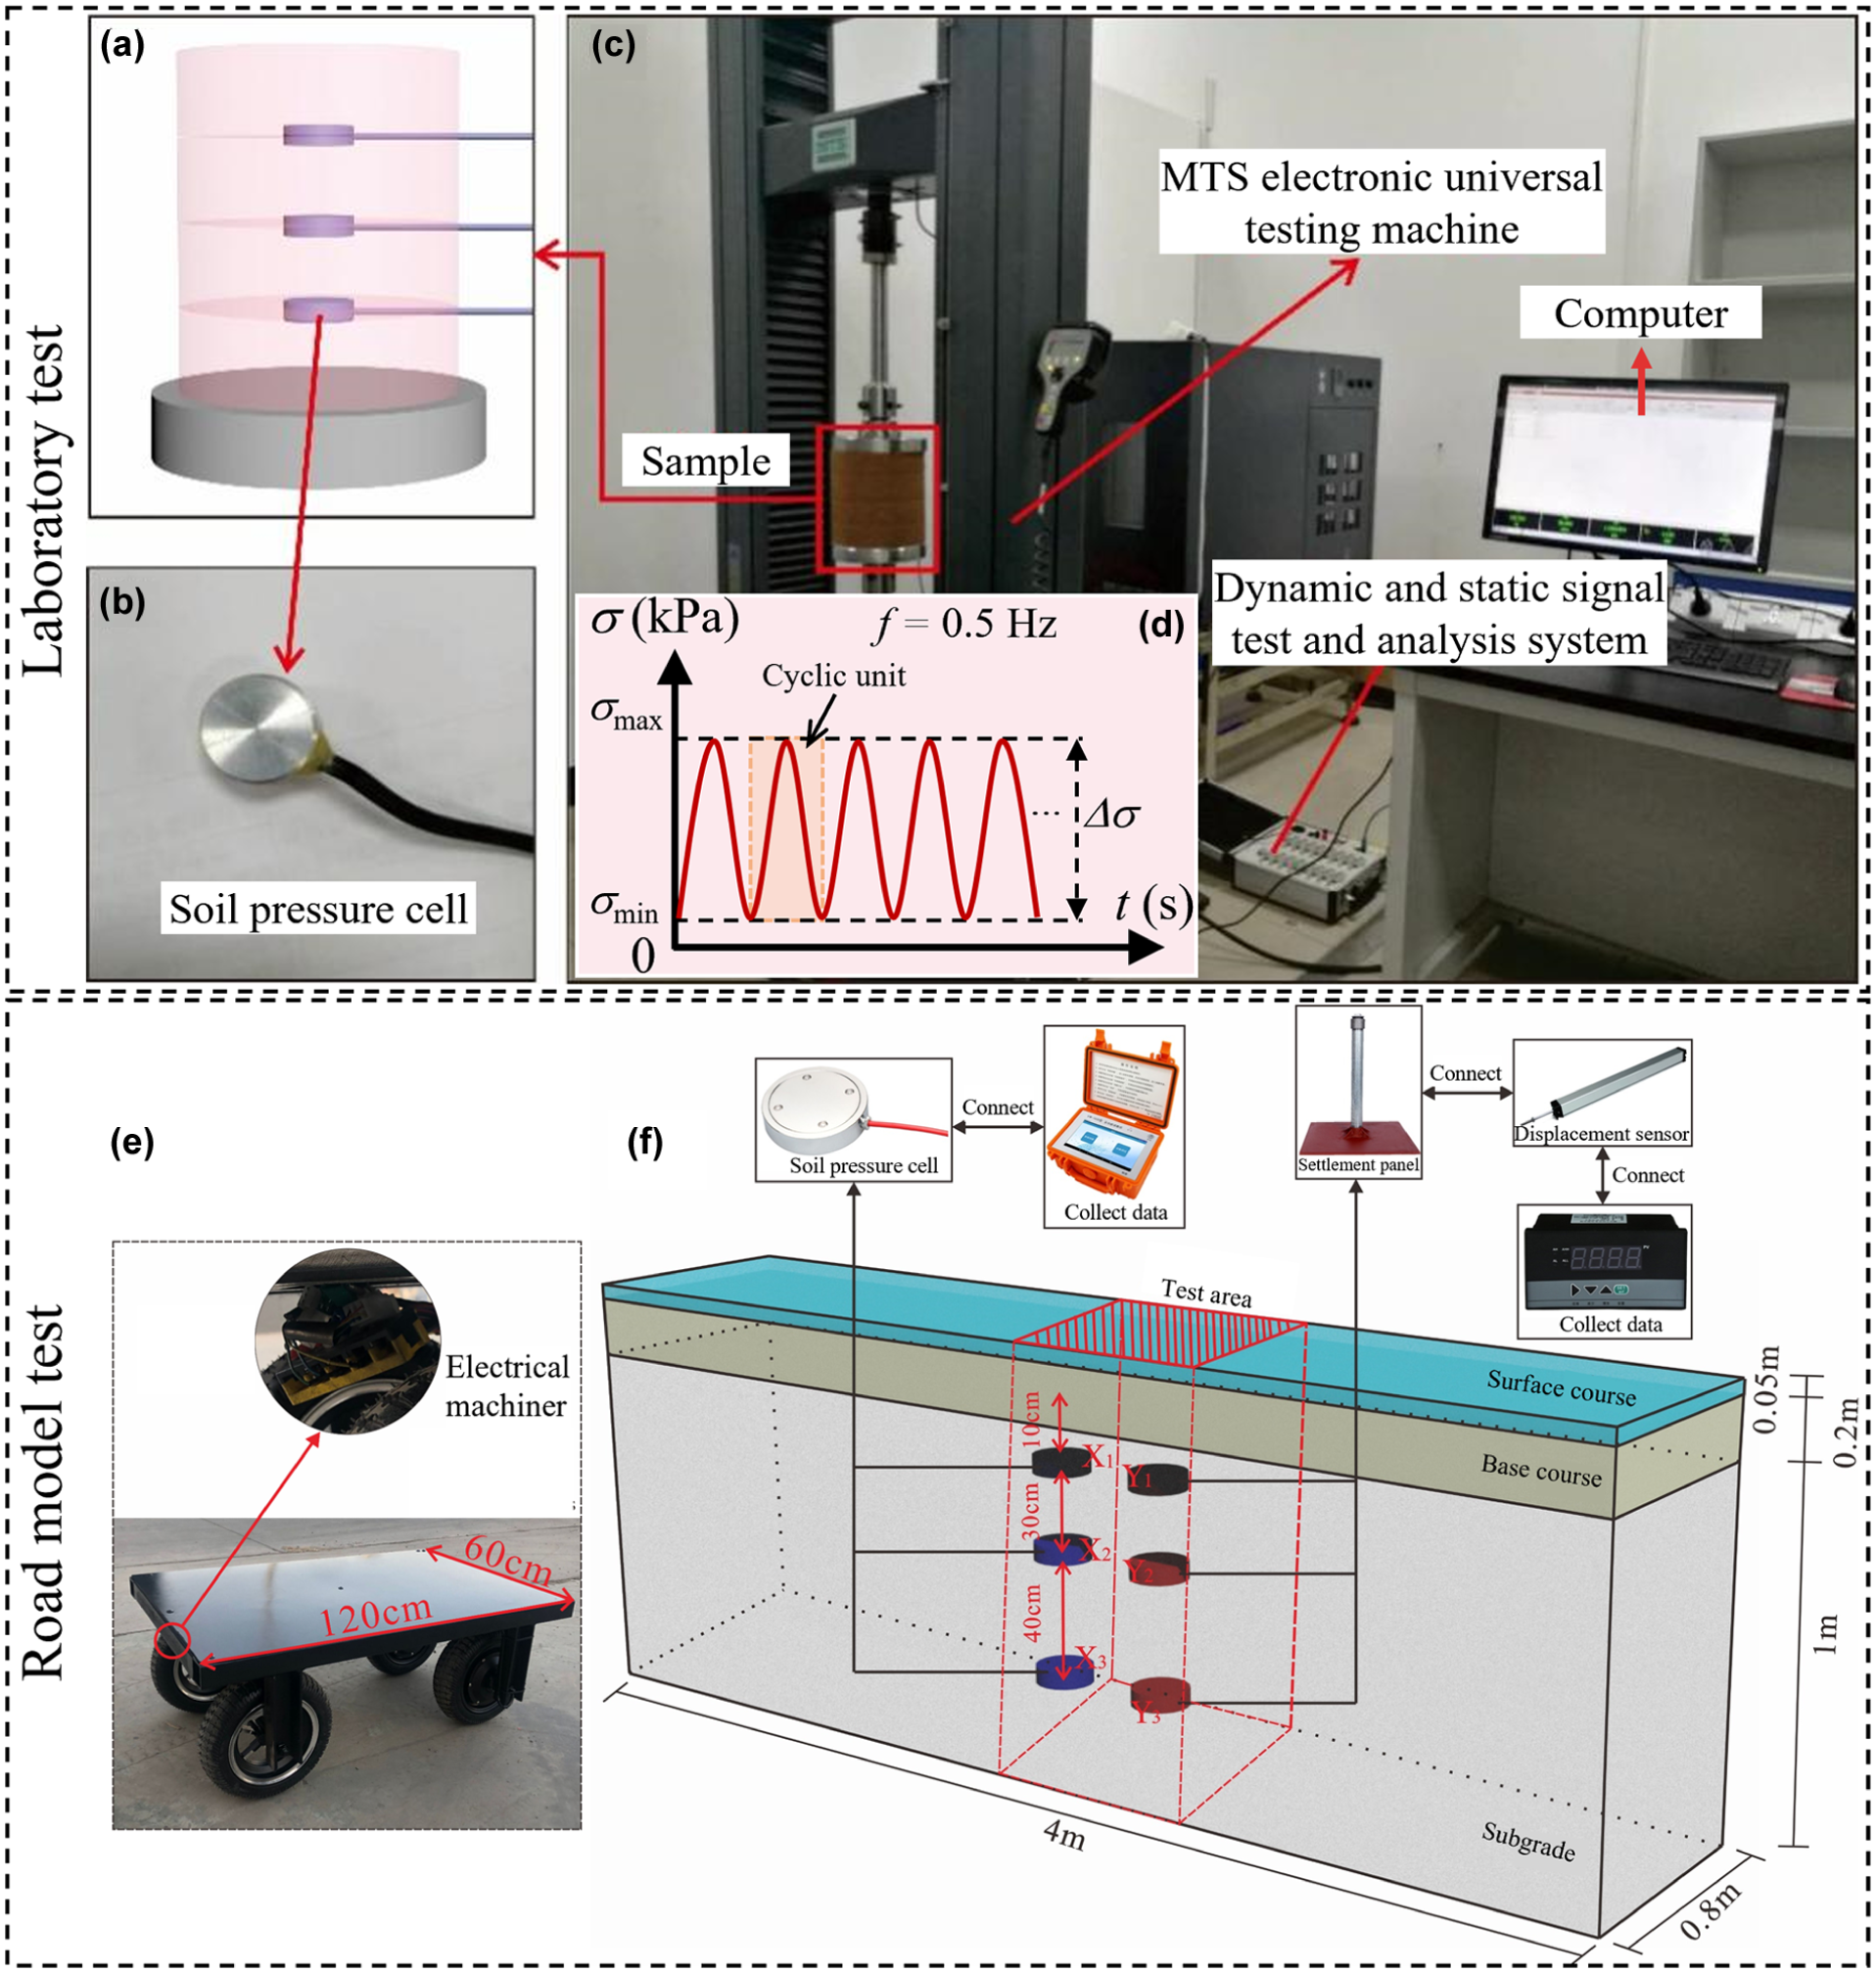
Test system: (a) the sample, (b) the SPC, (c) MTS system, (d) load path, (e) model vehicle, and (f) arrangement of instruments.
In addition to peak strength, several stiffness parameters were systematically introduced in this study to comprehensively evaluate the mechanical response of specimens with and without embedded earth pressure cells (Figure A1), including:
Initial tangent modulus (Ei): this was calculated by least squares regression within the 0%–0.2% strain range, reflecting the soil stiffness at very small strains.
Secant modulus at specific strains (E0.25%, E0.5%, E1.0%, E2.0%): these were defined as the slope of the secant line from the origin to the specified strain points (0.25%, 0.5%, 1.0%, 2.0%), describing the evolution of stiffness with increasing strain.
Secant modulus at half peak strength (E50): this parameter represents the secant stiffness at half of the peak stress, which is a commonly used medium-strain stiffness indicator in geotechnical engineering.
These parameters can reflect the multiscale mechanical characteristics of soil from small to medium strain ranges, conforming to the standards of geotechnical testing and engineering practice.
Table A1 in Appendix presents the results of the stiffness parameters and peak strength calculated by rigorous interpolation and regression methods. It can be seen that the peak strengths of the nonembedded and embedded specimens were 150.81 kPa and 145.64 kPa (difference −3.43%), the initial tangent modulus were 11.00 MPa and 10.50 MPa (−4.55%), and the differences of the secant modulus at specific strains and E50 were all within ±10%, with E50 values of 5.84 MPa and 6.09 MPa (+4.28%). This indicates that the influence of embedded sensors on peak strength and stiffness response was limited, and the conclusions are robust and representative.
A road model test was conducted using a custom-built electric model vehicle (Figure 2e). The model vehicle was designed based on a geometric scale ratio of approximately 1:4 for the vehicle dimensions. The vehicle, measuring 120 cm in length, 60 cm in width, with an 80 cm wheelbase and a 40 cm track width, weighed 40 kg and supported a maximum load of 200 kg. Simplified rectangular loads were applied as test conditions. The road model comprised a 5 cm thick concrete surface course, a 20 cm gravel base course, and a 100 cm subgrade layer of GRS. The SPCs and settlement plates were embedded at various depths to monitor dynamic stress and strain variations within the subgrade. X1 and Y1 were buried 10 cm deep, X2 and Y2 were buried 40 cm deep, and X3 and Y3 were buried 80 cm deep in the subgrade. The road model test setup is depicted in Figure 2f, and the testing configurations for both laboratory and road model tests are summarized in Table 2. To simulate realistic traffic loading conditions, the model vehicle speed was determined based on the “equivalent loading duration principle” proposed by Ling et al. ( 26 ). In actual highway scenarios, vehicle speeds of 40–120 km/h correspond to a stress pulse duration of approximately 0.720–0.288 s acting on the subgrade surface. To reproduce these specific loading durations with the model vehicle (which has a smaller tire contact length), the model speed was scaled to a range of 2.8–7.2 m/s. The axle loads for the model vehicle were determined based on the different tire pressures exerted on the pavement by vehicles of varying weights. The number of loading cycles in the physical model tests was determined based on different daily traffic volumes, while maintaining a constant loading frequency of 0.5 Hz.
Test Plans
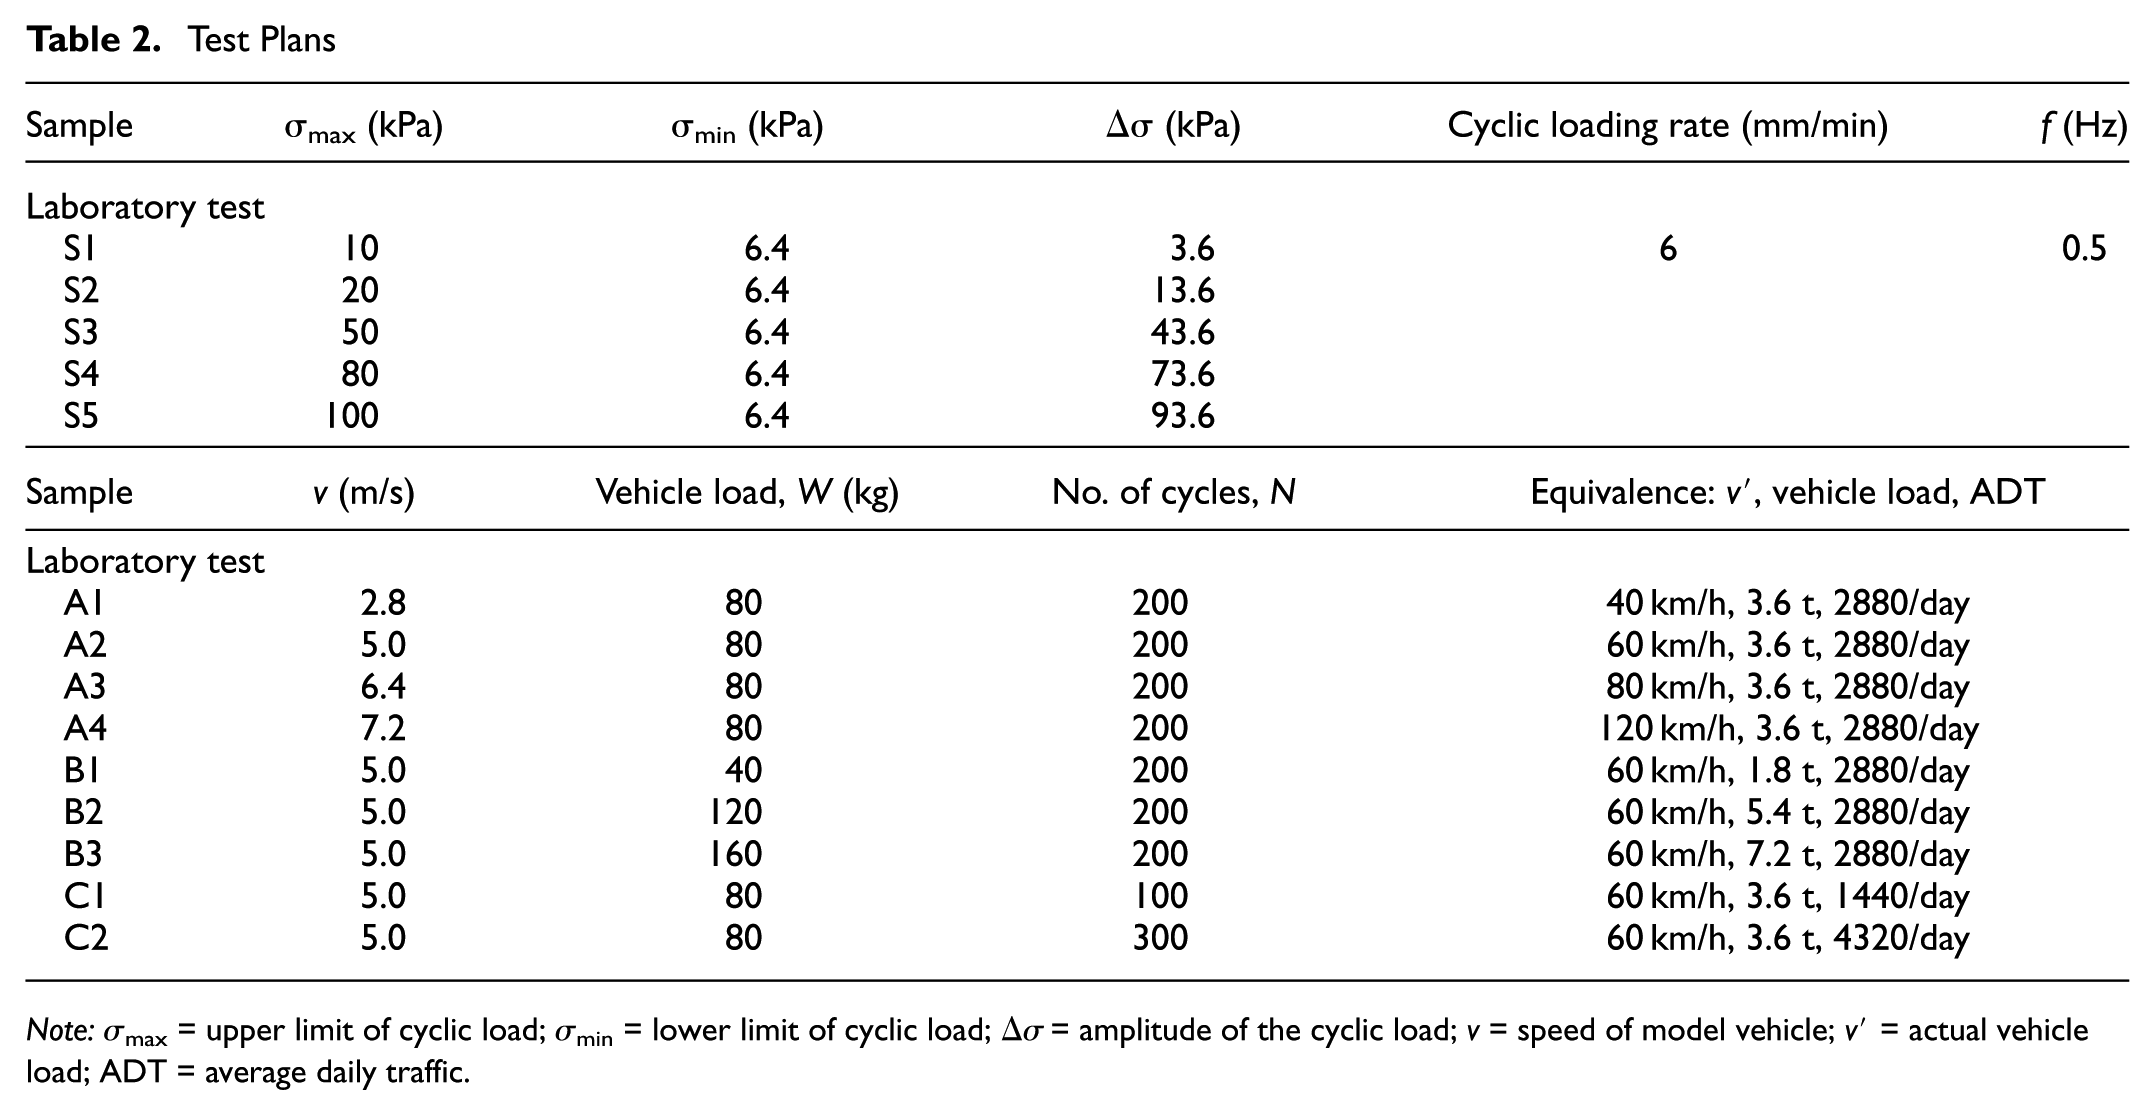
Note:σmax = upper limit of cyclic load; σmin = lower limit of cyclic load; Δσ = amplitude of the cyclic load; v = speed of model vehicle; v′ = actual vehicle load; ADT = average daily traffic.
Several measures were implemented to ensure the reliability of the internal dynamic stress measurements and to mitigate boundary effects: (i) specimen uniformity was ensured through compaction in 10 layers, the mold walls and end platens were lubricated, and a seating pre-load of 6.4 kPa was applied; (ii) a small sensor-to-specimen size ratio, combined with placement far from the boundaries, minimized local stress perturbations; (iii) the low loading frequency (a 0.5 Hz half-sine wave) precluded measurement distortion arising from wave reflection; (iv) the reliability of all SPCs was ensured by subjecting them to both static and dynamic load calibrations; and (v) companion unconfined compression tests indicated that the sensor inclusion had a limited effect on the soil’s bulk mechanical properties. These comprehensive measures ensured that the recorded dynamic stress data were both accurate and representative.
Results and Discussion
Characteristics of Stress–Strain Curves under Cyclic Load
Under cyclic loading, both the relationship between the external load applied to the soil and to the axial deformation and the relationship between the dynamic stress inside the soil and the axial deformation exhibited significant changes. As shown in Figure 3, taking the stress–strain curve of specimen S3 as an example, five key characteristics of the soil specimen under cyclic loading were analyzed.
As shown in Figure 3a, the stress–strain curve gradually shifts toward higher strain with each loading cycle, indicating the ongoing accumulation of irreversible (plastic) axial deformation in the soil. This cumulative plastic deformation is a typical response under cyclic loading, reflecting the progressive nature of permanent axial strain as cycles proceed.
Each loading and unloading cycle creates a closed area on the curve, known as a hysteresis loop. The area enclosed by this loop reflects the energy dissipated because of internal friction and microstructural changes within the soil during each cycle ( 27 , 28 ), highlighting the soil’s ability to absorb and dissipate energy in the process.
At the beginning of cyclic loading, the hysteresis loops are relatively sparse and large, which indicates substantial plastic deformation and a smaller proportion of elastic strain. As the number of cycles increases, these loops become denser and more overlapped, signifying an evolution in loop shape and density that represents a transition to predominantly elastic behavior and the stabilization of deformation, where the plastic component becomes negligible, consistent with established principles and previous studies ( 6 , 29 ).
Figure 3b further shows that both residual dynamic stress and plastic deformation accumulate most rapidly during the early loading cycles. As the number of cycles increases, these quantities tend to stabilize, indicating that the accumulation of residual stress and plastic strain slows down and the soil structure approaches a new equilibrium.
Finally, the dynamic stress transmitted into the soil is consistently lower than the applied external load. This energy dissipation difference arises from viscoelastic and plastic deformation, as well as stress diffusion effects within the soil mass, leading to a measurable reduction in the amplitude of dynamic stress relative to the external loading.
These features collectively describe the evolution of soil behavior under cyclic loading, from initial plastic-dominated response to a stabilized, predominantly elastic regime with significant energy dissipation, as directly evidenced by the shape and progression of the hysteresis loops in Figure 3.
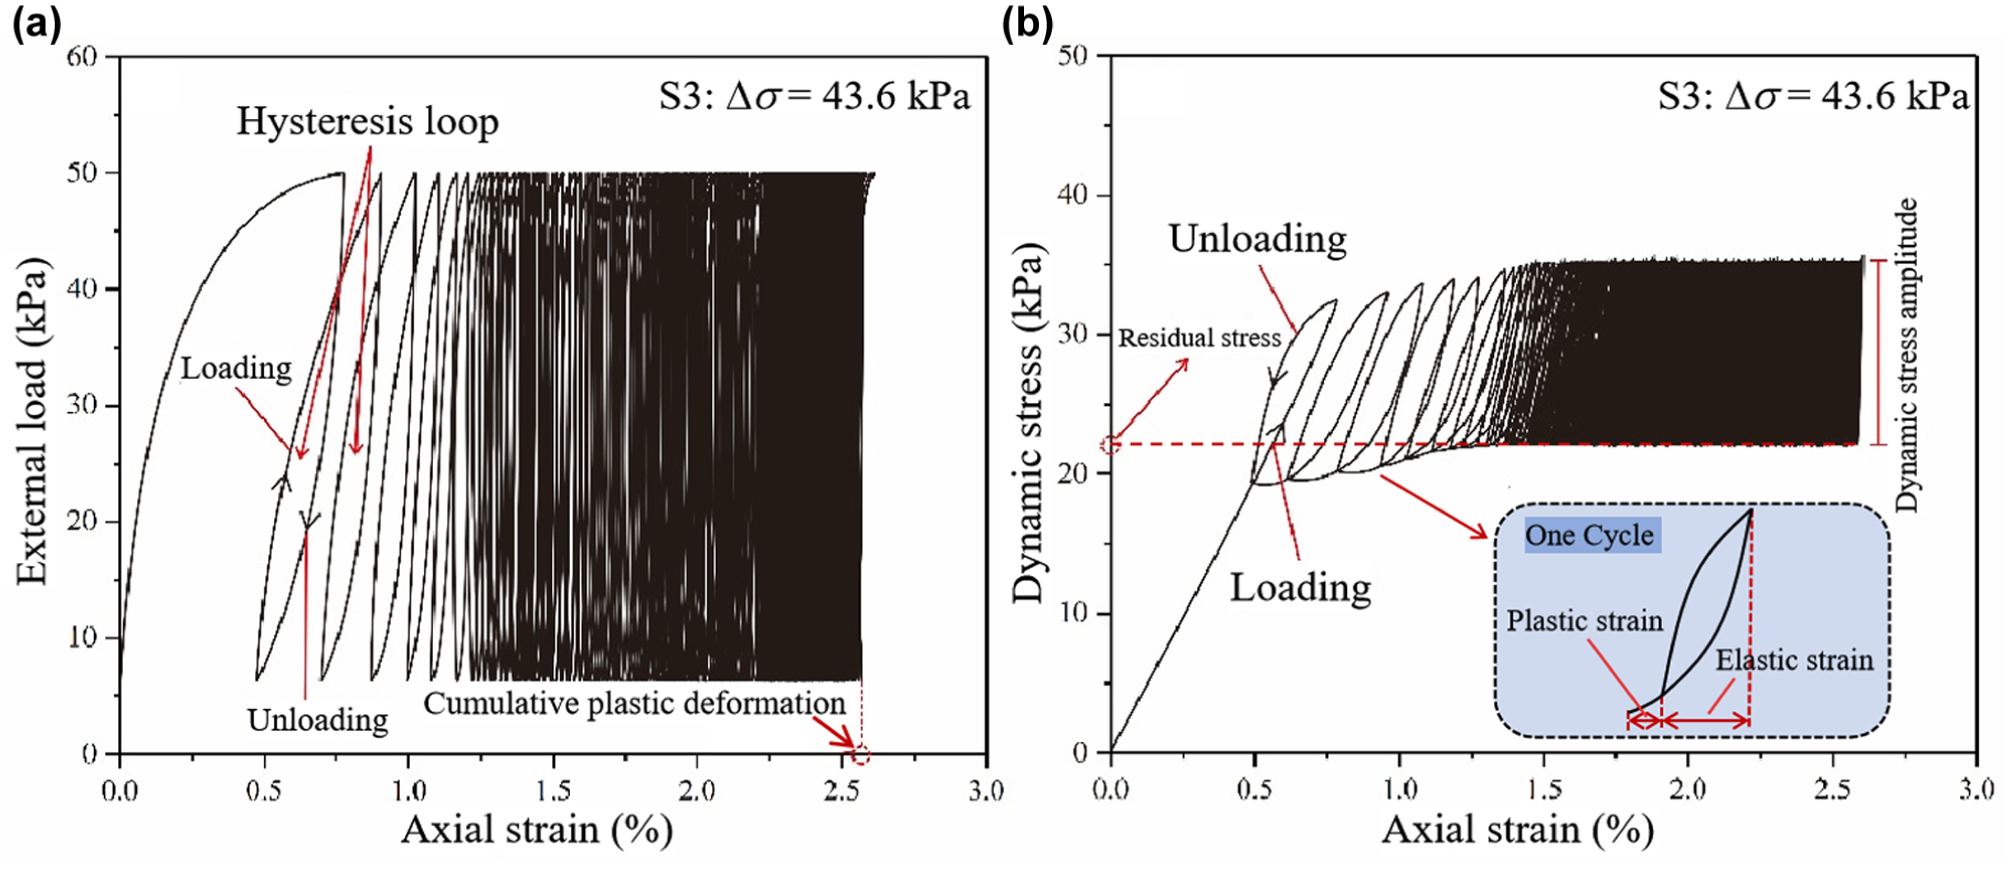
Dynamic stress–dynamic strain relationship of soil under cyclic load: (a) external load and axial strain relationship curve; and (b) dynamic stress and axial strain relationship curve.
Variation of Stress–Strain Curves under Different Cyclic Elements
The S3 test group, as detailed in Table 2, was analyzed by grouping three consecutive cycles as a single unit. Specifically, cyclic units 2–4, 10–12, 20–22, 50–52, 100–102, and 1998–2000 were compared, as shown in Figure 4.
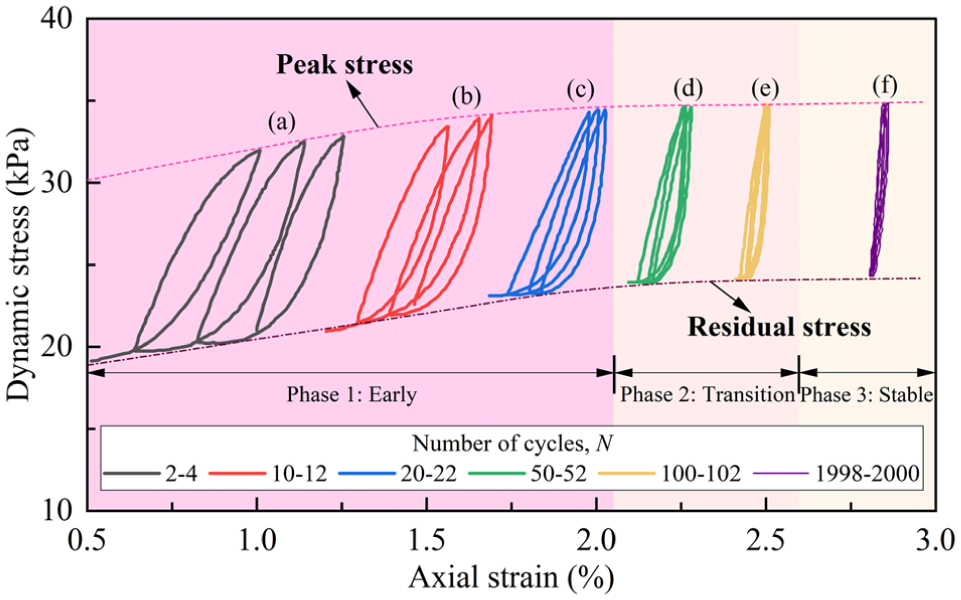
Dynamic stress–strain relation curves under different cyclic elements.
In the initial cycles, the stress–strain curves enclose a large area with minimal overlap between loading and unloading paths. As the cycles progress, the enclosed area diminishes, curve overlap increases, and the hysteresis loop evolves from a cuspid-blade shape to an elongated form. Three response stages can be distinguished: an Early phase with large, broad hysteresis loops and rapid increases in peak and residual dynamic stress; a Transition phase in which loop areas shrink and overlap increases; and a Stable phase characterized by slender, nearly coincident loops and negligible plastic strain increment. The overall rightward shift of the hysteresis loops reflected the accumulation of plastic axial strain. The reduction and convergence of the loop area indicated that the energy dissipated per cycle and the incremental plastic strain decayed rapidly and tended toward stabilization. Even after the residual dynamic stress had essentially stabilized, minor plastic strain continued to accumulate, indicating that the microstructure was still undergoing slight adjustment, but its contribution to the residual stress was limited.
It is important to emphasize that this final “Stable phase” is not representative of the soil’s intrinsic elastic properties, but rather a state of elastic shakedown achieved as a direct result of the significant load-induced densification and soil fabric rearrangement that occurred during the initial loading stages.
Vertical Evolution of Dynamic Stress
To investigate the propagation and attenuation of dynamic loads within the soil column, the variations of peak and residual dynamic stresses recorded at heights of H/4, H/2, and 3H/4 are plotted against the accumulated axial strain in Figure 5 (taking the S3 test group as a representative example).
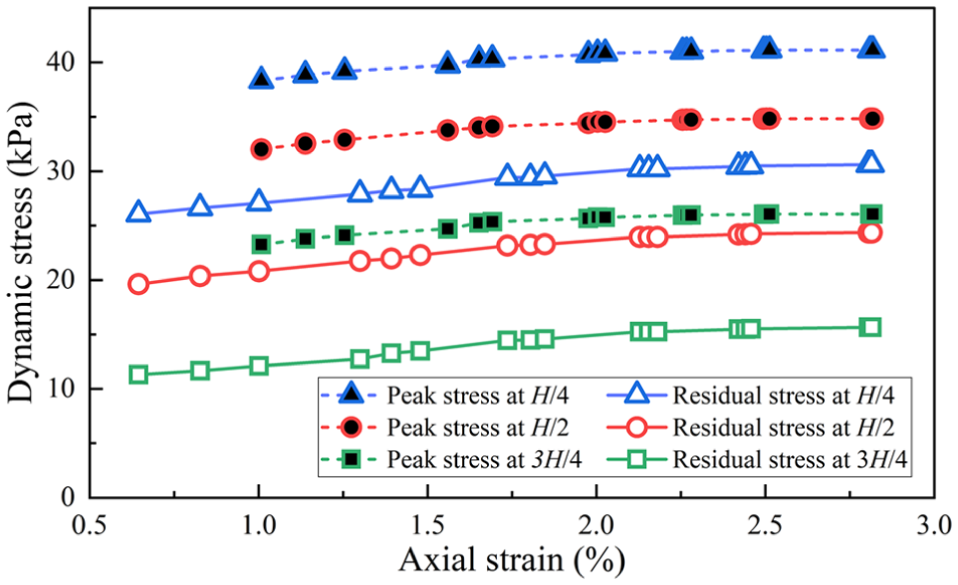
Variation of peak and residual dynamic stresses at different specimen heights versus accumulated axial strain.
As shown in Figure 5, the dynamic stress exhibits a clear depth-dependent attenuation. The stress levels at the upper position (H/4, closer to the loading source) are consistently higher than those at the middle (H/2) and lower (3H/4) positions. For instance, at an axial strain of 1.5%, the peak dynamic stress decreases from approximately 40 kPa at H/4 to 25 kPa at 3H/4. This significant decay can be attributed to the material damping of the GRS and the frictional energy dissipation along the specimen boundaries.
Furthermore, the evolution of dynamic stress with accumulated strain mirrors the three-stage behavior observed in the stress–strain hysteresis loops (Figure 4):
Adjustment phase: in the range of smaller accumulated strains (corresponding to the “Early phase” of cycling), both peak and residual stresses show a slight increasing trend. This phenomenon suggests that as the soil undergoes cyclic densification and particle rearrangement, the soil skeleton becomes stiffer. A denser soil structure facilitates more efficient stress wave transmission, thereby allowing a slightly higher portion of the dynamic load to reach the deeper layers (3H/4).
Stable phase: as the axial strain exceeds approximately 2.0%, the stress values at all three depths tend to stabilize. This plateau corresponds to the “elastic shakedown” state, where the soil fabric has reached a stable equilibrium, and no further significant plastic deformation or change in stress transmission efficiency occurs.
As shown in Figure 5, the dynamic stress exhibits a clear depth-dependent attenuation. The dynamic stress at the upper position is consistently higher than at the deeper layers. This observation indicates that the dynamic stress transmitted into the soil is consistently lower than the applied external load, deviating from the uniform stress assumption in standard element tests. This discrepancy is primarily attributed to the intrinsic material damping and stress diffusion effects within the soil mass. As the cyclic stress wave propagates through the specimen, energy is continuously dissipated because of frictional resistance, viscoelastic behavior, and plastic deformation at interparticle contacts. Consequently, the amplitude of the dynamic stress attenuates as it transmits from the loading surface to the deeper layers, leading to the observed gradient where the internal dynamic stresses are consistently lower than the applied external boundary load.
Analysis of Dynamic Stress–Strain Accumulation Relationship under Cyclic Load
Analysis of Dynamic Stress–Strain Cumulative Lag
Under cyclic loading, the internal dynamic stress–strain relationship of the soil exhibits a dynamically evolving behavior, rather than a fixed phase relationship. To accurately characterize this phenomenon, it is essential to distinguish between the behavior of the external load and that of the internal dynamic stress as they interact with strain.
First, as shown in Figure 3a, the hysteresis loop for external load versus axial strain consistently maintains the form depicted in Figure 6b throughout the entire test, which signifies that the strain phase persistently lags behind the external load phase. This is a typical viscoplastic response, the physical origins of which lie in the viscous effects of pore water between soil particles and the frictional energy dissipation at interparticle contacts ( 30 , 31 ).
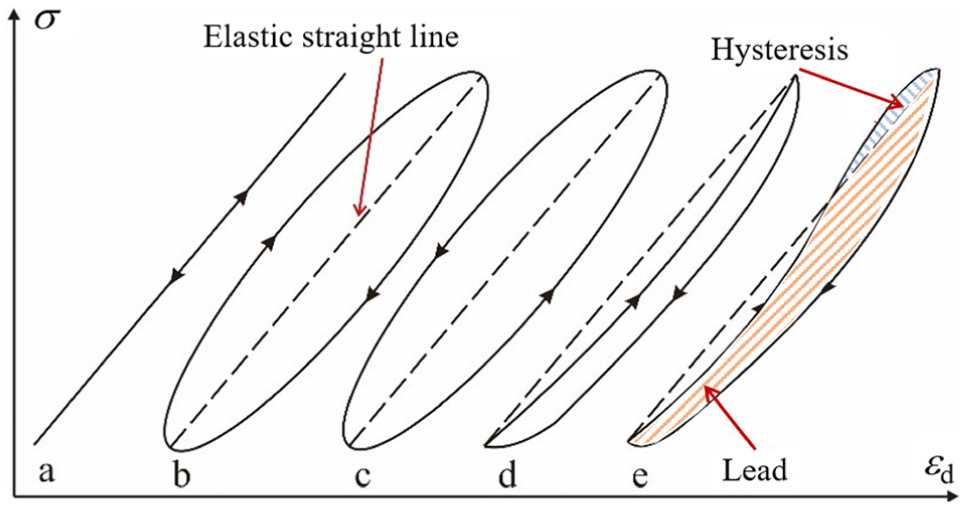
Morphological characteristics of hysteresis loop
However, the core finding of this study is manifested in the relationship between internal dynamic stress and axial strain (Figure 3b), which evolves with the number of cycles (N):
Initial Loading Stage (N < 200): during the initial cycles, the hysteresis loop resembles the form shown in Figure 6c, with the loading curve falling below the elastic reference line and the unloading curve positioned above it. This clearly indicates that, in this stage, the strain phase leads the internal dynamic stress phase.
Later Loading Stage (N > 200): as the test progresses beyond approximately 200 cycles, the morphology of the hysteresis loop gradually transitions toward that shown in Figure 6e. At this point, the stress–strain relationship within a single complete loading–unloading cycle becomes more complex, incorporating segments of both strain lead and strain lag.
This evolution from a state of “strain lead” to a “complex phase relationship” reveals the alteration of the soil’s internal state under cyclic loading. The strain-lead phenomenon during the initial loading corresponds to a phase of intense structural rearrangement and compaction in the loose soil; during this time, external energy is primarily consumed in overcoming friction and inducing plastic deformation, while the internal dynamic stress, which represents the response of the elastic skeleton, is comparatively “retarded.” Once the soil gradually densifies and stabilizes, its response mechanism shifts to a more intricate elastoplastic interaction.
Therefore, under cyclic loading, the relationship between dynamic stress and dynamic strain in the soil is not static; the phase lag between the accumulation of dynamic stress and the accumulation of dynamic strain continuously changes as the test progresses.
Relationship between Dynamic Stress Amplitude and Elastic Strain
The magnitude of dynamic stress accumulation, defined as the difference between peak and residual dynamic stress, correlates with elastic strain and N (Figure 7). In this study, the elastic strain is determined for each individual cycle. As illustrated in the schematic diagram in Figure 3b, elastic strain represents the recoverable strain component during the unloading phase of the N-th cycle, calculated as the difference between the maximum strain at peak stress and the residual strain after unloading. The data indicate that as N increases, both elastic strain and the amplitude of dynamic stress accumulation decrease in a linear manner. Before the soil reaches a state of failure, its structure becomes progressively compacted with increasing N. This compaction results in a portion of the elastic strain being converted into plastic strain, which leads to an increase in cumulative plastic deformation and a corresponding reduction in elastic strain ( 32 , 33 ). During the compaction process, soil stiffness increases, while the viscoelastic plastic deformation per cycle decreases. Consequently, the energy dissipated in each cycle diminishes. As a result, the stress transmitted by the external load to the soil intensifies, and the residual stress within the soil accumulates progressively. This residual stress impacts the cumulative dynamic stress amplitude in the soil, causing the amplitude to gradually decrease.
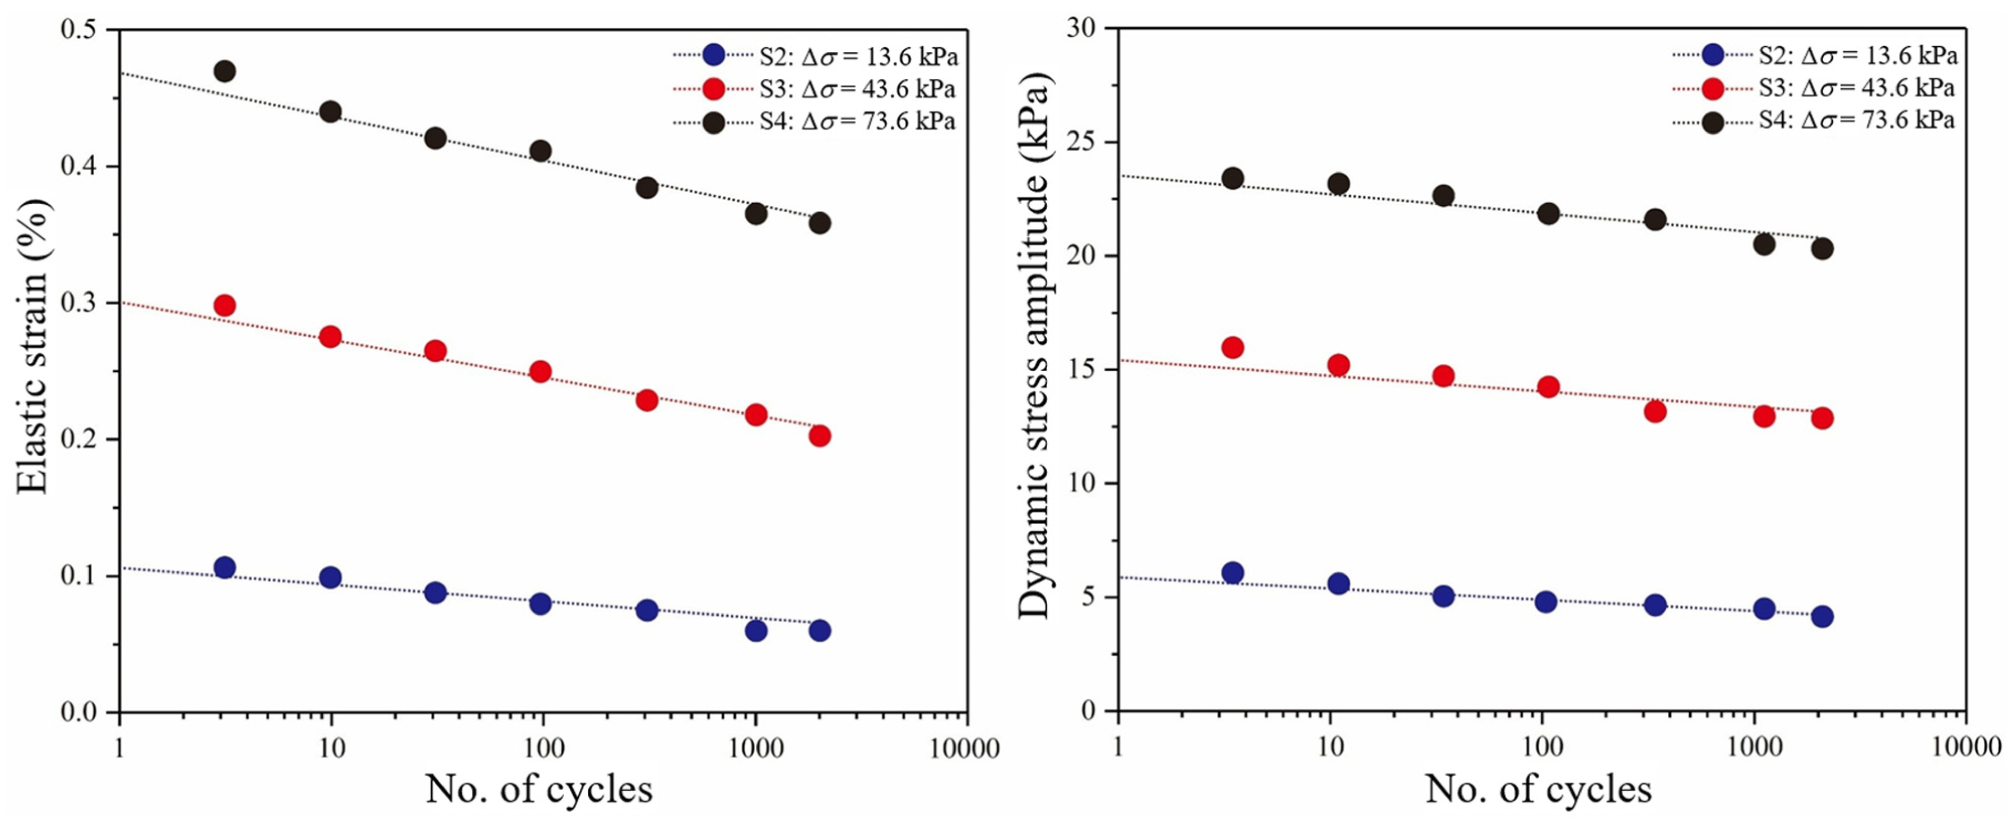
The relationship between elastic strain, dynamic stress amplitude and N.
To track the evolution of the soil’s responsiveness, a dynamic response modulus, denoted as En, is introduced, defined as the ratio of dynamic stress amplitude to elastic strain (En = σd / εe). It is important to note that En is not a constant elastic modulus, but rather an index that reflects the changing relationship between internal stress and recoverable strain as the soil densifies. As shown in Figure 8, the evolution of En with the number of cycles confirms that the soil’s stiffness response is not static but continuously adapts to the loading history.
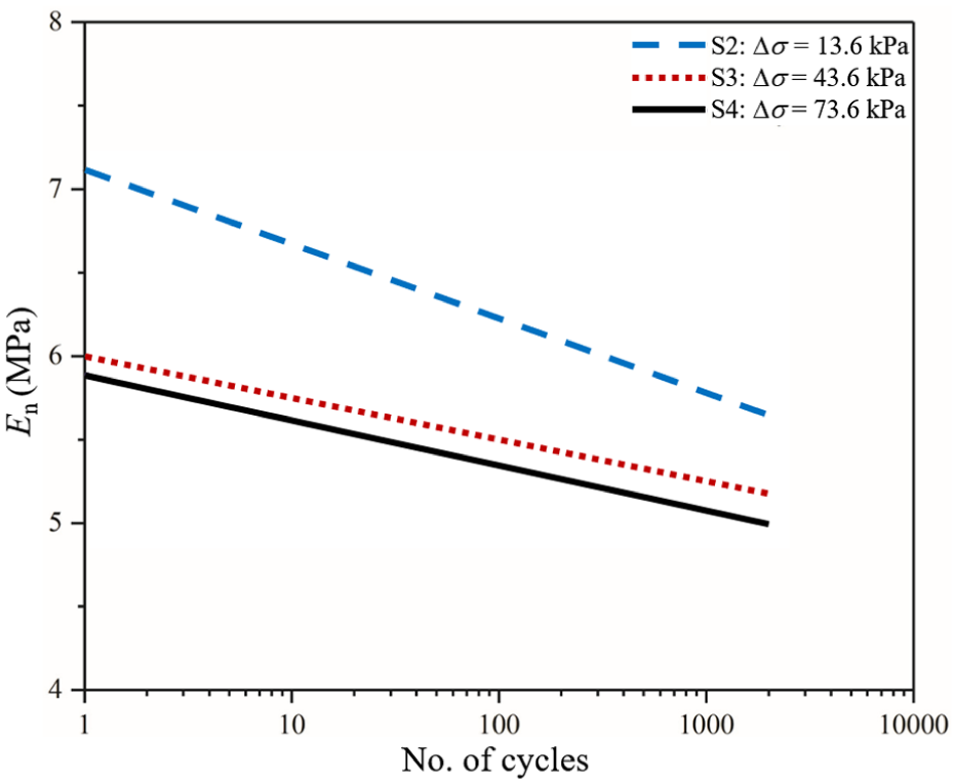
E n varies with the increase of the N.
To quantitatively validate the relationship between the amplitude of dynamic stress accumulation (σd) and elastic strain (εe), a direct linear regression analysis was performed. As shown in Figure A2, the results reveal a strong positive linear relationship between these two variables for all tested stress levels. The R2 for the test conditions with Δσ of 13.6 kPa, 43.6 kPa, and 73.6 kPa were 0.932, 0.988, and 0.973, respectively. These high R2 values provide robust statistical evidence that the magnitude of dynamic stress released during unloading is directly proportional to the magnitude of the recovered elastic strain.
This strong coupling occurs because the release of dynamic stress is a direct consequence of the soil’s elastic rebound. This connection occurs because, during cyclic loading, the soil undergoes rebound deformation, during which the elastic energy stored within soil particles is released as the soil recovers elastic deformation. Concurrently, a portion of the dynamic stress is released, while the remaining stress is carried over into subsequent cycles, contributing to cumulative of dynamic stress. Consequently, the unloading rebound deformation of subgrade soil is directly associated with the release of dynamic stress, with the magnitude of recovered elastic strain determining the amount of stress relieved.
Strain-Dependent Dynamic Properties and Energy Dissipation Characteristics
To provide a more rigorous understanding of the soil’s dynamic behavior, the strain-dependent dynamic elastic modulus (Ed) and damping ratio (λ) were calculated and analyzed. In this study, the dynamic strain (εd) refers to the single-amplitude axial strain induced by the cyclic load. As shown in Figure 9, the results are consistent with the typical dynamic characteristics of geotechnical materials.
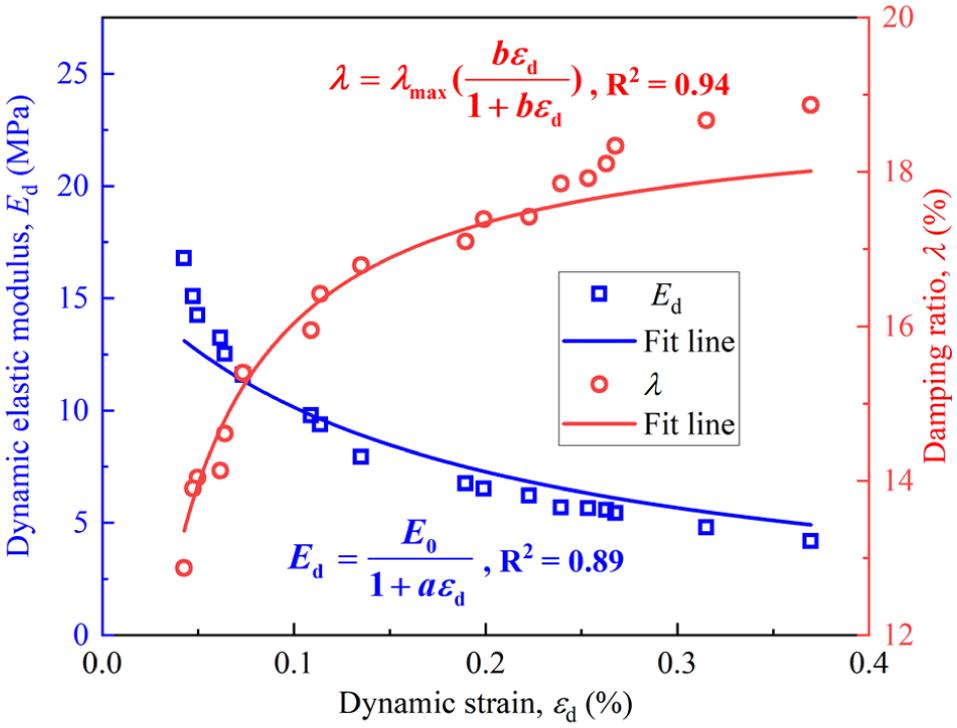
Dynamic elastic modulus and damping ratio varies with the dynamic strain.
The Ed exhibits a clear nonlinear degradation with increasing εd. Although the stress-controlled testing method and the specific strain range in this study (focused on traffic loading) differ from the wide-strain-range (10−6 to 10) resonant column-cyclic triaxial tests typically used in earthquake engineering (34−36), the observed macroscopic trends are consistent. This behavior was accurately captured by a hyperbolic model, which yielded an excellent fit to the experimental data (R2 = 0.89). This degradation reflects the reduction in soil stiffness at higher strain levels because of the mobilization of interparticle sliding and microstructural adjustments.
Concurrently, the λ, which quantifies the energy dissipated per cycle, shows a strong positive correlation with dynamic strain. This relationship was successfully fitted with a hyperbolic model (R2 = 0.94). The increase in damping at higher strains signifies greater energy loss, which is attributed to increased frictional sliding and more extensive plastic deformation from particle rearrangement.
The specific fitted parameters (a, b) for these constitutive models are detailed in Appendix B.
The observed macroscopic evolution of the stress–strain behavior, modulus, and damping is a direct manifestation of complex processes occurring at the microscale. A deeper understanding can be achieved by analyzing the system from the perspectives of particle mechanics and energy transformation.
The interaction and movement of individual soil particles govern the behavior of the soil mass under cyclic loading. The process can be divided into distinct phases based on the dominant particle-scale mechanism:
Initial phase, particle rearrangement and densification. In the early cycles, the soil is in a relatively loose state. The applied load causes significant, irreversible particle rearrangement. Particles slide and roll to fill adjacent voids, leading to a rapid decrease in the void ratio, which is observed macroscopically as large plastic strain accumulation (compaction). During this phase, the soil’s internal structure, or fabric, is highly unstable and constantly evolving. The number of effective force-bearing contacts is low, and the existing force chains (the primary paths of stress transmission) are weak and frequently collapse and reform.
Transition phase, frictional mobilization and fabric stabilization. As the soil densifies, the potential for large-scale particle rearrangement diminishes. The number of interparticle contacts increases significantly, and the soil fabric begins to stabilize. The dominant mechanism for deformation and energy dissipation shifts from gross rearrangement to mobilization of interparticle friction. Frictional sliding at these numerous, newly formed contacts becomes the primary way the soil accommodates small strains and dissipates energy. The force chain network becomes more robust and extensive.
Stable phase, elastic deformation and shakedown. In the later cycles, the soil fabric approaches a stable, “shakedown” state. Particle positions are largely locked in. The response to cyclic loading is now dominated by the recoverable elastic deformation of particle contacts. Any remaining irrecoverable deformation is minimal (e.g., plastic creep or localized frictional slip). The force chain network is now stable and resilient, efficiently transmitting stress with minimal structural change.
During the initial particle rearrangement phase, a large amount of energy is dissipated through the plastic work required to overcome static friction and permanently move particles. This corresponds to the large area of the initial hysteresis loops. In the transition phase, as the soil densifies, the energy dissipated by frictional sliding at the increased number of contacts becomes the dominant dissipation mechanism. This can lead to a peak in the damping ratio, as the system is most effective at dissipating energy through friction before it becomes too stiff. In the stable shakedown phase, the potential for plastic work and frictional sliding is greatly reduced. Most of the input energy is stored elastically and then recovered. The hysteresis loop area becomes very small, indicating minimal energy dissipation per cycle and a low, stable damping ratio.
In summary, the journey of the GRS from a loose to a stable state under cyclic loading can be viewed as a process of evolving from a high-dissipation, plastically dominated system governed by particle rearrangement to a low-dissipation, elastically dominated system governed by a stable particle fabric. The quantitative analysis of the modulus and damping ratio provides the macroscopic evidence for these underlying micromechanical and energetic transformations.
Analysis of Residual Dynamic Stress Accumulation Characteristics under Cyclic Loading
The accumulation of dynamic stress in subgrade soil was analyzed using data from sensor X1 in sample A2, located 10 cm beneath the base layer. Figure 10 illustrates the dynamic stress patterns over 200 loading cycles. The results demonstrate a continuous buildup of dynamic stress with increasing N. After the first cycle, the soil retains a residual stress of 9.1 kPa, which increases to 82.3 kPa by the 200th cycle—an approximate eightfold rise—demonstrating significant stress accumulation. The dynamic stress variation follows a consistent pattern in both the first and 200th cycles, characterized by two peaks and troughs corresponding to the passage of the vehicle’s front and rear wheels.
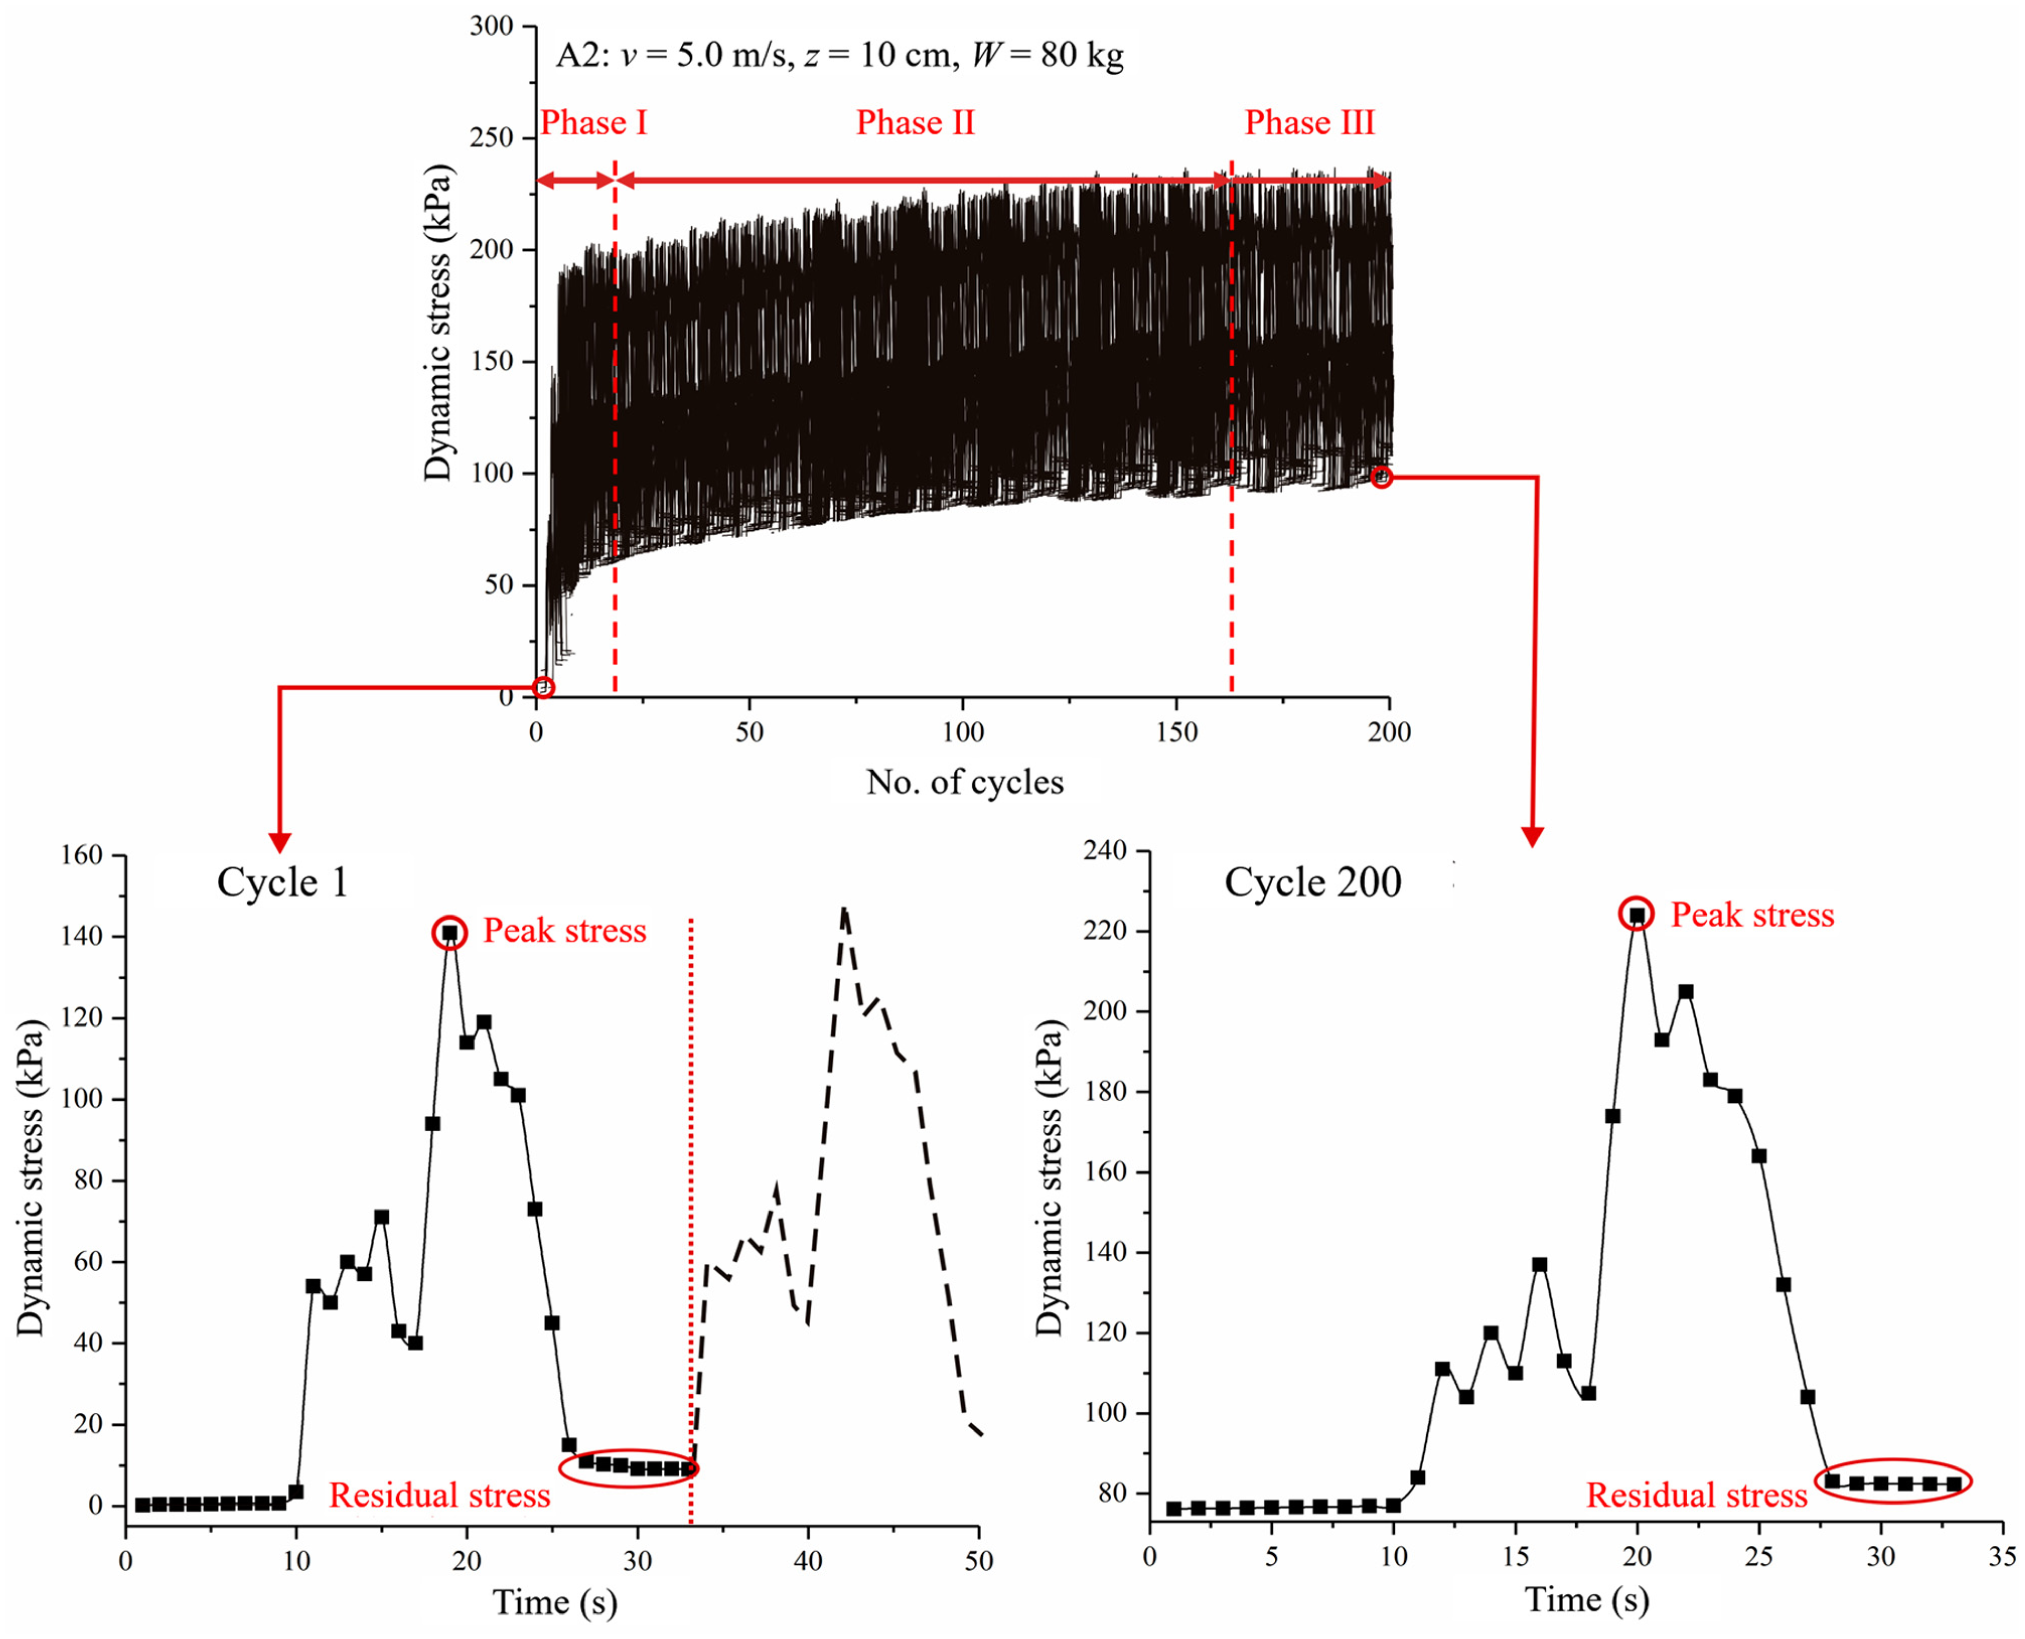
The variation law of residual dynamic stress accumulation in subgrade soil.
As shown in Figure 10, the residual dynamic stress accumulation in subgrade soil can be divided into three distinct phases.
Phase I (Acceleration Phase): characterized by a rapid increase in stress accumulation at the onset of cyclic loading.
Phase II (Deceleration Phase): the rate of stress accumulation gradually decreases as cyclic loading continues.
Phase III (Stabilization Phase): beyond a specific number of cycles (N), accumulated dynamic stress stabilizes and approaches a plateau.
Notably, the three phases of macroscopic stress accumulation in the road model test are intrinsically correlated with the three stages of stress–strain evolution observed in the cyclic loading tests (Figure 4). Phase I corresponds to the “Early phase” of the element test, where rapid particle rearrangement and densification result in a significant increase in effective stiffness and stress transmission capability. Phase II mirrors the “Transition phase,” where the rate of plastic deformation decays as the soil fabric stabilizes. Finally, Phase III aligns with the “Stable phase,” indicating that the subgrade soil has reached a state of elastic shakedown. This consistency across different testing scales confirms that the evolution of dynamic stress in the subgrade is fundamentally governed by the progressive densification and stiffening of the soil material under cyclic loading.
Data from SPCs X1, X2, and X3 were analyzed to assess the effects of vehicle speed, load, pass frequency, and depth on dynamic stress accumulation in subgrade soil. These factors significantly influence both the rate and the extent of stress accumulation, providing valuable insights into the behavior of subgrade soils under cyclic loading.
Influence of Vehicle Speed on Residual Dynamic Stress Accumulation Characteristics
After 200 loading cycles, the residual dynamic stress in the subgrade soil was recorded as the final accumulated stress for the tested samples. Samples A1–A4, subjected to the same vehicle load, were analyzed, as illustrated in Figure 11. At a given subgrade depth, residual dynamic stress increases with vehicle speed, but the accumulation rate decreases as speed increases. In addition, as the depth of the subgrade increases, the differences in residual dynamic stress between low and high speeds become less pronounced.
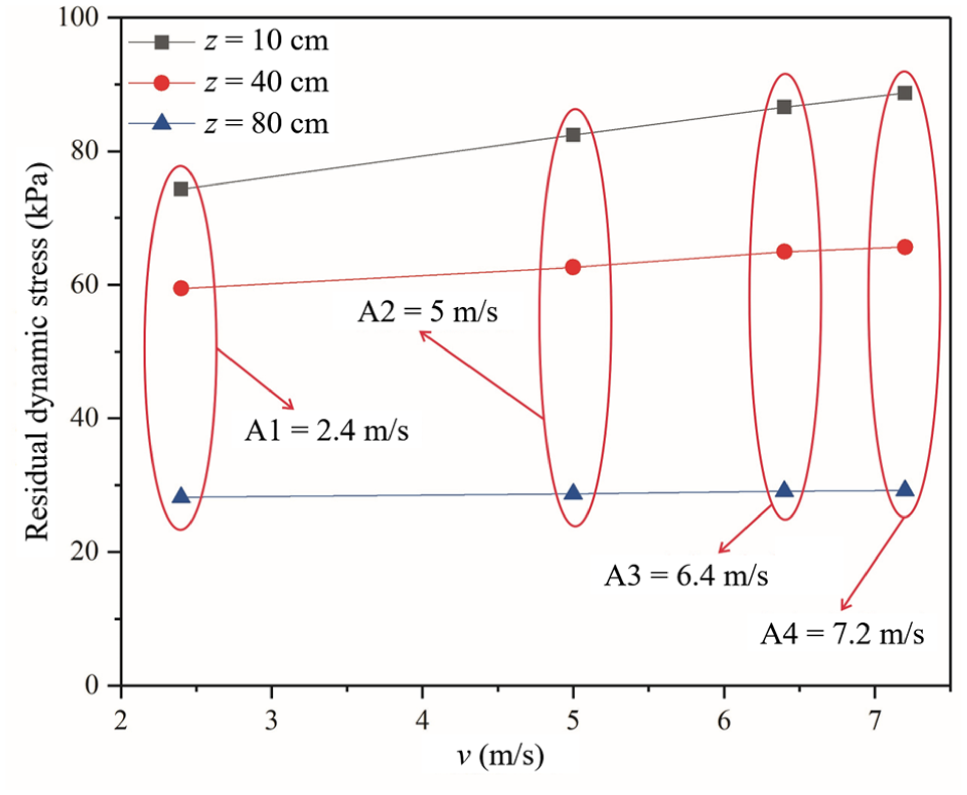
The relationship between velocities and residual dynamic stress.
The depth of the subgrade has a significant impact on residual dynamic stress, which is attributable to the attenuation effect of stress. According to Boussinesq’s theory, the stress induced by surface loading rapidly disperses over a larger area as depth increases, resulting in a pronounced reduction of stress experienced by deeper soil layers. Experimental results demonstrate that residual dynamic stress decreases sharply within the depth range of z = 10 cm to z = 80 cm, providing empirical support for this classical theory. Therefore, geometric dispersion is the principal mechanism governing the internal stress state of the subgrade.
By contrast, the effect of vehicle speed on residual dynamic stress is relatively limited. Experimental data (Figure 11) indicate that at shallow subgrade depths (e.g., z = 10 cm), residual dynamic stress increases only slightly as vehicle speed rises from 2.4 m/s to 7.2 m/s. This phenomenon occurs because higher vehicle speeds correspond to shorter load durations, which reduces the amount of dynamic stress that can be released or dissipated during each cycle, leading to a slight net accumulation of residual stress. However, this effect is much weaker than the impact of changes in subgrade depth. For example, the stress variation resulting from a threefold increase in vehicle speed is much smaller than the stress reduction observed when the depth increases from 10 cm to 40 cm, illustrating the comparatively minor role of vehicle speed.
Numerous studies have also confirmed that the influence of vehicle speed on subgrade structural response is considerably less than that of load magnitude and structural layer thickness or depth ( 37 , 38 ). In deeper subgrade layers, the pronounced attenuation of stress transmission and the extended duration of load application render the impact of load duration differences caused by varying vehicle speeds almost negligible with respect to residual dynamic stress. Therefore, both theoretical analysis and experimental results indicate that the effect of subgrade depth on dynamic stress accumulation far exceeds that of vehicle speed.
The Influence of Vehicle Load on the Residual Dynamic Stress Accumulation Characteristics
After 200 loading cycles, the residual dynamic stress in the subgrade soil was recorded as the final accumulated stress for the sample group. Samples A2 and B1–B3, tested under the same vehicle speed, were analyzed, as shown in Figure 12. At both shallow (z = 10 cm) and middepth (z = 40 cm) layers of the subgrade soil, the pattern of dynamic stress variation with vehicular load is consistent. Residual dynamic stress gradually increases with vehicle weight, but the accumulation rate decreases as load increases.
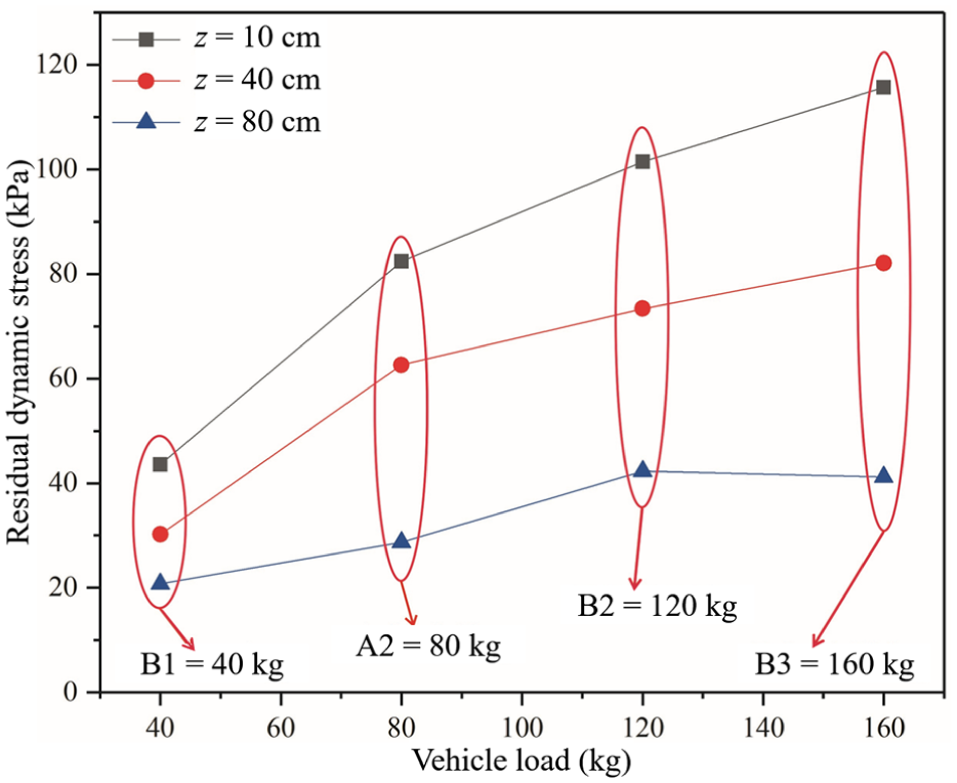
The relationship between vehicle load and residual dynamic stress.
The vehicle load has a significant impact on the distribution of dynamic stress within the subgrade soil. The magnitude of the external load directly determines the internal dynamic stress, including both the peak dynamic stress and residual stress limits. As the external load increases, both peak and residual stresses rise. However, the magnitude of the increase in dynamic stress diminishes at higher loads. This is because the subgrade soil has a maximum capacity for dynamic stress, beyond which the accumulation does not increase linearly. Once the external load reaches a critical value, the dynamic stress stabilizes and approaches a steady state, resulting in progressively smaller increments in residual stress.
The Influence of N on the Cumulative Characteristics of Residual Dynamic Stress
The residual dynamic stress in the subgrade soil between the 100th and the 300th cycles was considered the final accumulated stress for the sample group. Samples A2 and C1–C2, tested under the same vehicle load and speed, were analyzed, as shown in Figure 13.
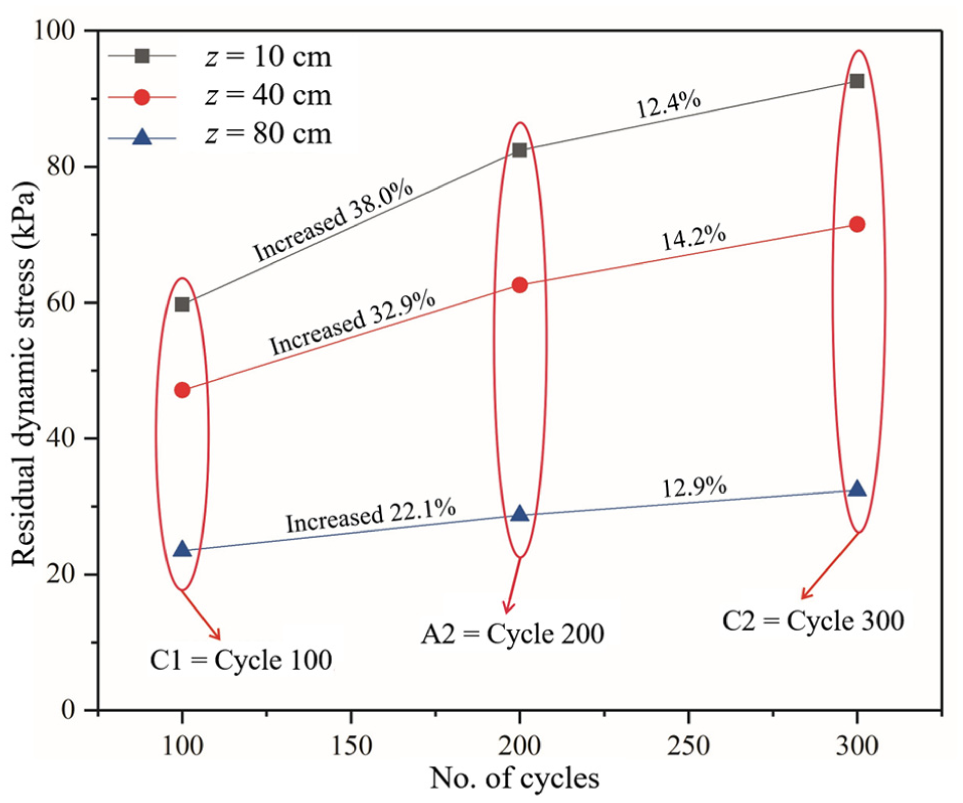
The relationship between the N and the residual dynamic stress in subgrade soil under different subgrade depths.
Overall, the N is a critical factor affecting the distribution of dynamic stress in subgrade soil. The relationship between dynamic stress and the N is consistent across shallow, middepth, and deep layers of the subgrade. Dynamic stress exhibits a cumulative pattern with increasing N, although the rate of accumulation diminishes over time. Once a specific threshold of N is reached, dynamic stress accumulation stabilizes, forming a plateau, which aligns with earlier analyses.
Previous studies have identified two distinct phases of dynamic stress accumulation in subgrade soil. The first phase, referred to as the accelerated phase, occurs predominantly within the 50th to 100th cycle range and is characterized by a rapid accumulation of dynamic stress. Following this, the accumulation transitions to a steady phase, where the rate of stress buildup declines significantly. This observation highlights the criticality of the initial period following the opening of new highways, during which the rate of dynamic stress accumulation is highest, posing a significant risk of structural damage. Therefore, it is recommended to implement measures that allow dynamic stress within the subgrade soil to stabilize before fully opening the road to traffic, thereby mitigating potential adverse effects.
The Influence of Depth on the Accumulation Characteristics of Residual Dynamic Stress
Using data from SPCs of samples A1–C2, the correlation between fill thickness and residual dynamic stress in subgrade soil was analyzed, as shown in Figure 14. The results indicate that the incremental buildup of residual dynamic stress is more pronounced in shallower regions of the subgrade compared with deeper strata.
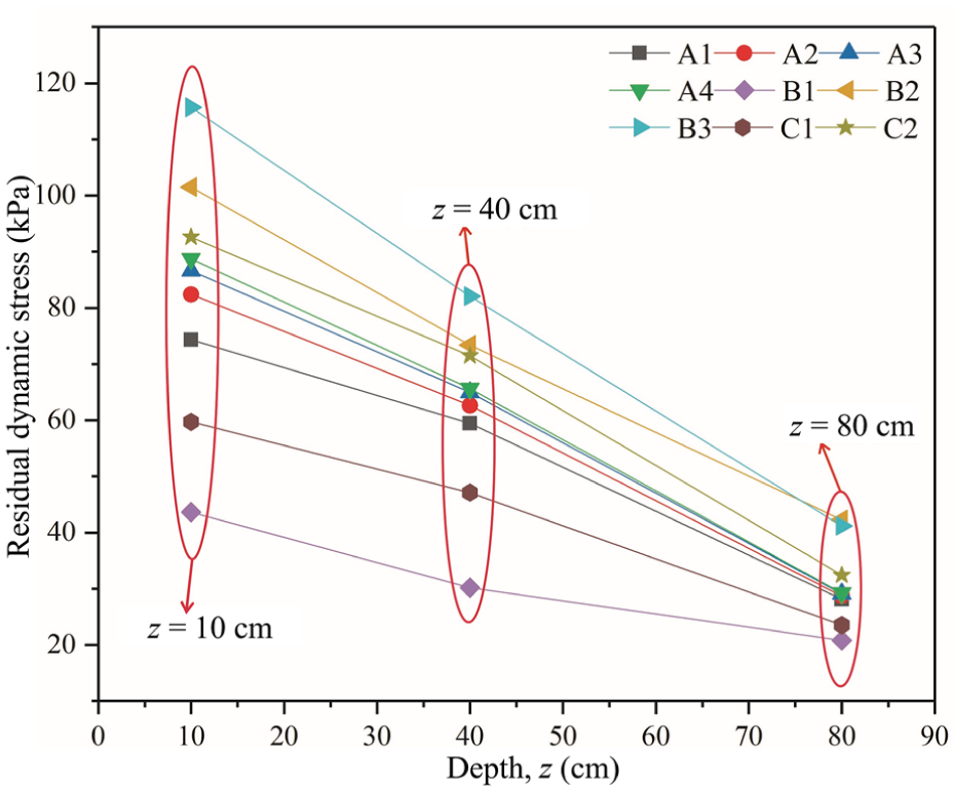
The relationship between depth and residual dynamic stress in subgrade soil.
In addition, increasing the fill thickness effectively reduces the impact of dynamic stress accumulation. Thicker fills attenuate the effects of external factors on stress distribution within the subgrade, leading to a more uniform stress profile. These findings suggest that at a certain subgrade depth, dynamic stress approaches a stable value, beyond which it remains constant regardless of external conditions.
For road sections with high traffic volumes or inferior soil quality, increasing the fill thickness can significantly alleviate the adverse effects of residual dynamic stress accumulation. This approach not only enhances the structural stability of the subgrade but also mitigates potential long-term damage caused by excessive stress buildup.
Analysis of Plastic Deformation Accumulation Characteristics under Cyclic Loading
Under cyclic loading, subgrade soils undergo dynamic stress accumulation, leading to plastic deformation and potential permanent structural damage. This permanent deformation, if sufficiently accumulated, may lead to structural failure. For example, data from settlement plates Y1 of sample A2, located 10 cm beneath the base layer, are used to illustrate plastic deformation patterns in the subgrade soil over 200 loading cycles (Figure 15). The findings indicate that plastic deformation in the subgrade soil increases with N, though the accumulation rate gradually declines. After 200 cycles, the cumulative plastic deformation of the subgrade soil reached 3.1%.
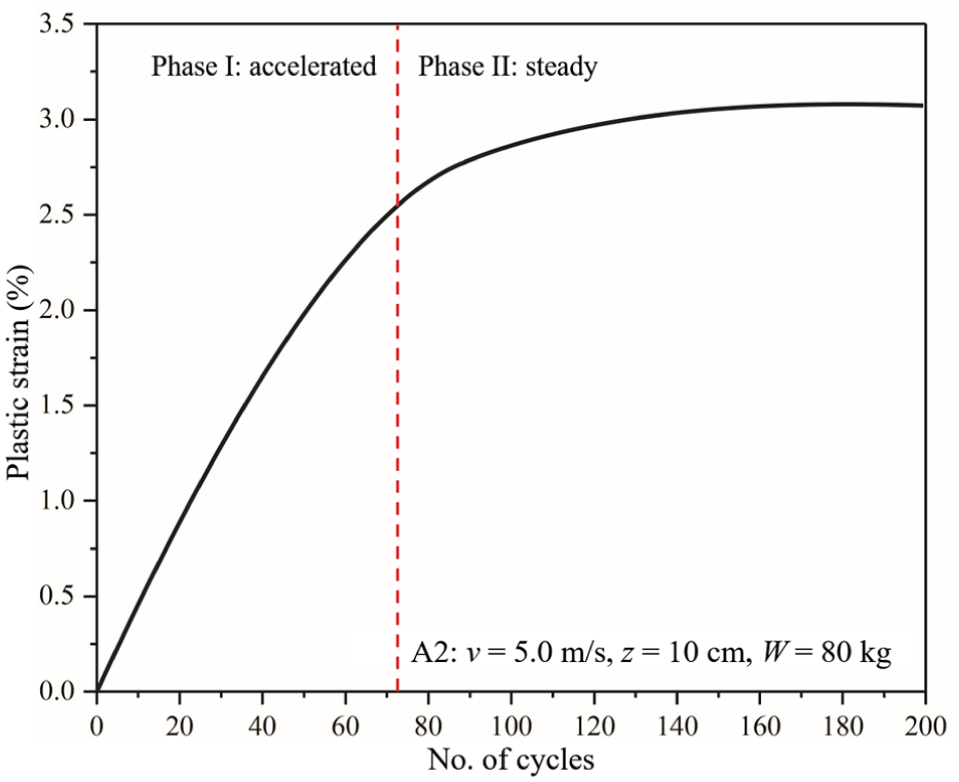
Accumulative variation law of plastic deformation in subgrade soil.
An inflection point in the plastic deformation curve occurs between 60 and 80 cycles, marking the transition from the acceleration phase to the steady-state phase of dynamic stress accumulation. As N increases, the plastic deformation of the subgrade soil approaches a stable value before structural failure. Compared with dynamic stress accumulation, plastic deformation requires a larger N to stabilize, indicating that dynamic stress in subgrade soils reaches equilibrium more quickly than plastic deformation. This observation aligns with results from laboratory cyclic load tests.
The Influence of Vehicle Speed on the Cumulative Characteristics of Plastic Deformation
As an example, Groups A1–A4 illustrate the relationship between vehicle speed and plastic deformation, with the cumulative plastic deformation after 200 cycles taken as the final value for these samples (Figure 16). At a constant subgrade depth and vehicle weight, plastic deformation accumulates more rapidly at higher vehicle speeds, though the accumulation rate diminishes over time. This trend parallels dynamic stress accumulation, as higher vehicle speeds shorten loading durations, reducing deformation recovery time within the subgrade soil. Consequently, less elastic deformation is recovered, leading to increased plastic deformation accumulation.
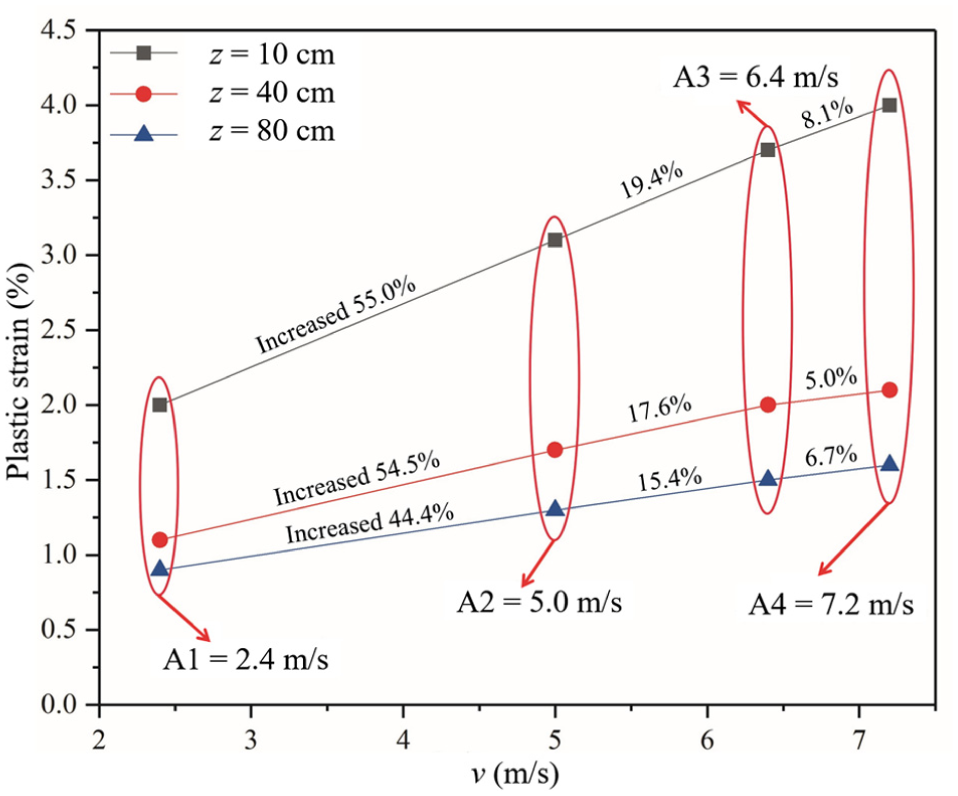
The relationship between vehicle speed and plastic deformation in subgrade soil under different subgrade depths.
As the subgrade depth increases, the relationship between plastic deformation and vehicle speed weakens, indicating that the influence of vehicle speed on plastic deformation accumulation diminishes with depth. This phenomenon is attributed to the reduction in the magnitude of the external load as it penetrates deeper into the subgrade, resulting in a narrower range of plastic deformation variations induced by the load.
The Influence of Vehicle Load on the Cumulative Characteristics of Plastic Deformation
Data from Groups A2 and B1–B3 are used to illustrate the effect of vehicle load on plastic deformation accumulation within the subgrade soil (Figure 17). Across varying subgrade depths, the rate of plastic deformation accumulation initially peaks as the vehicle load increases from 80 kg to 120 kg, then declines as the load increases further. This suggests a parabolic relationship between plastic deformation accumulation and vehicle load, peaking within the 80–120 kg range.
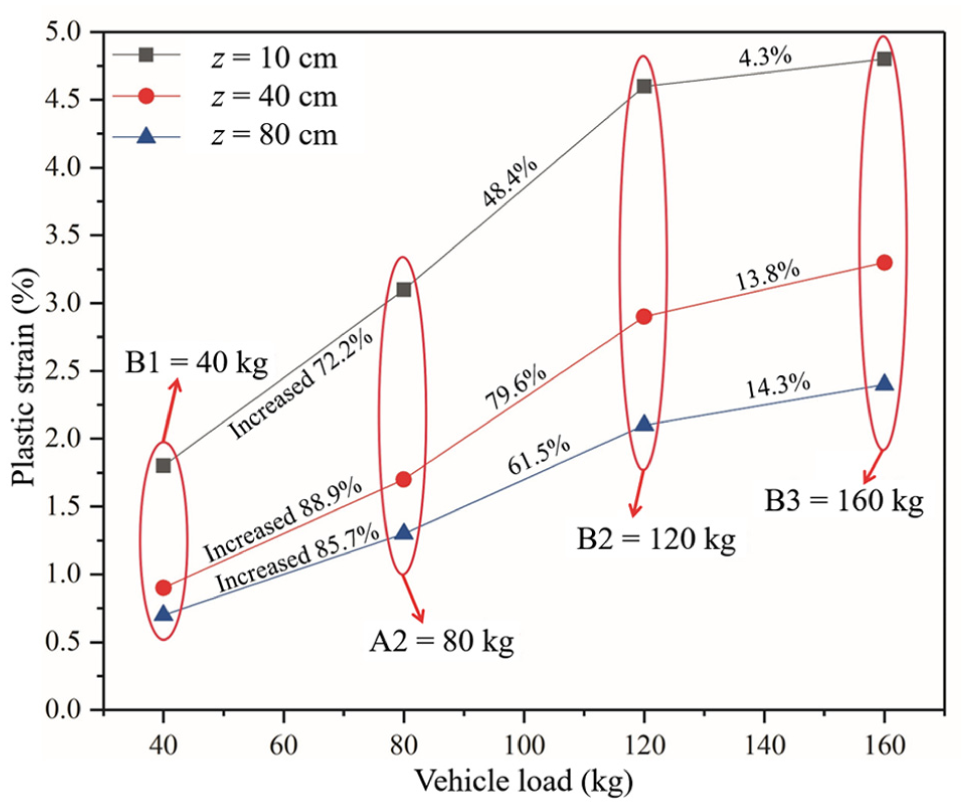
The relationship between vehicle load and plastic deformation in subgrade soil under different subgrade depths.
At lower vehicle loads, the impact on subgrade soil deformation is minimal, leading to a faster stabilization of plastic deformation accumulation. Consequently, under lighter loads, the rate of plastic deformation accumulation remains comparatively low. However, as the load increases and reaches a certain threshold, the influence on soil deformation becomes more pronounced, significantly increasing the volume of deformation in the subgrade soil. This results in the maximum rate of plastic deformation accumulation. Beyond this threshold, the subgrade soil deformation approaches completion, and further increases in load have minimal additional effects, causing the rate of plastic deformation accumulation to decline.
The Influence of N on the Cumulative Characteristics of Plastic Deformation
Groups C1–C2 and A2 were analyzed to evaluate the relationship between plastic deformation and the N in subgrade soil. The plastic deformation accumulated between the 100th and 300th cycles was used as the final value for these samples, as shown in Figure 18.
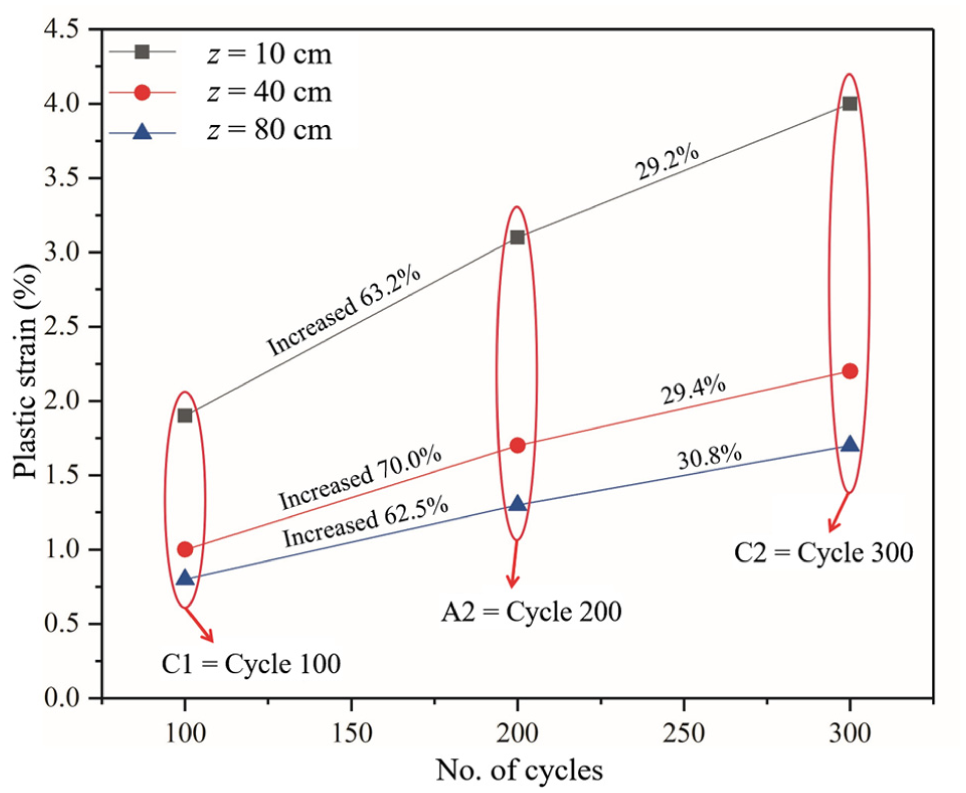
The relationship between the number of N and the plastic deformation in subgrade soil under different subgrade depths.
Across the shallow, middepth, and deep layers of the subgrade, the relationship between plastic deformation and N is consistent. Plastic deformation increases with N, though its accumulation rate declines over time. This trend aligns with the behavior of dynamic stress accumulation and N, suggesting that plastic deformation in subgrade soil is bounded and asymptotically approaches a maximum value as N reaches a critical threshold. Beyond this threshold, further increases in N may lead to subgrade soil failure.
Unlike dynamic stress accumulation, the plastic deformation in the middepth and deep layers of the subgrade exhibits a more prolonged pattern of accumulation, indicating a lag in stabilization compared with dynamic stress. This suggests that new plastic deformation continues to occur even after dynamic stress has stabilized, highlighting the potential for ongoing plastic deformation without a corresponding increase in dynamic stress.
The Influence of Depth of the Cumulative Characteristics of Plastic Deformation
Using data from Groups A1–C2, a curve was constructed to analyze the relationship between fill thickness and plastic deformation in subgrade soil, as shown in Figure 19. The results indicate that plastic deformation in subgrade soil decreases with increasing fill thickness, though at a diminishing rate. The shallowest subgrade layer (z = 10 cm) shows the most pronounced deformation in response to external loads, whereas deeper layers exhibit convergence in plastic deformation values.
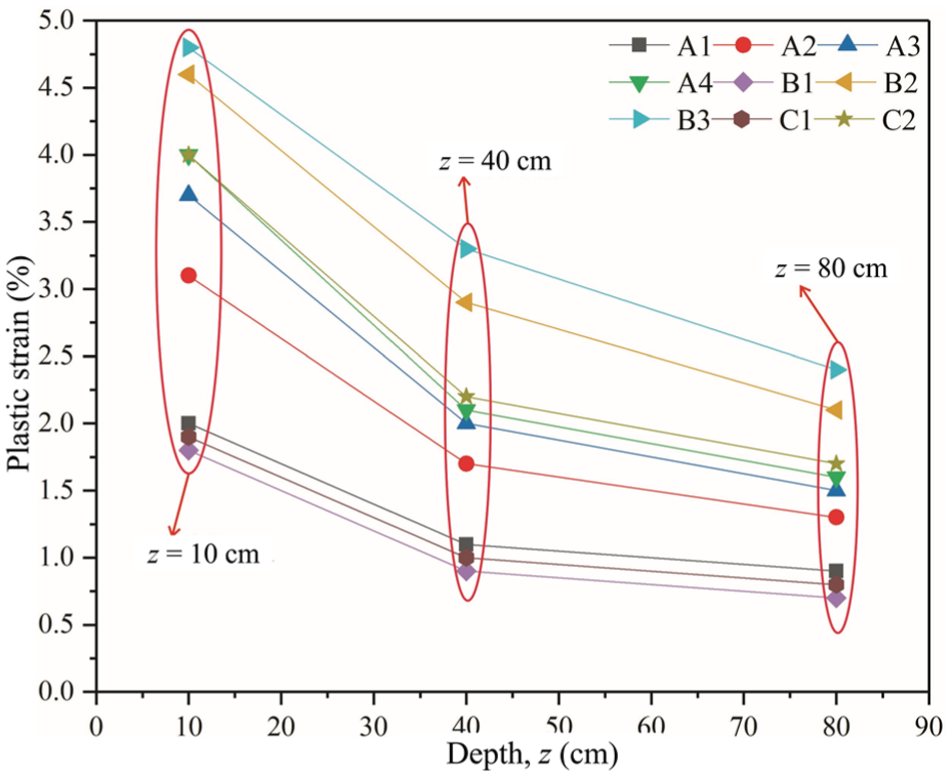
Relationship between depth and plastic deformation in subgrade soil.
Figure 13 corroborates these findings, revealing differences between dynamic stress accumulation and plastic deformation accumulation across the 10–80 cm depth range of the subgrade. Dynamic stress accumulation decreases linearly with increasing fill thickness, while plastic deformation follows a nonlinear reduction trend. This indicates that at a specific depth, the effect of fill thickness on dynamic stress accumulation is more significant than its impact on plastic deformation. This behavior is associated with the attenuation of force and deformation as depth increases during load transmission, a phenomenon previously discussed by Mierczak et al. ( 39 ).
Analysis of Subgrade Soil Shakedown Behavior under Cyclic Loading
Shakedown theory provides a theoretical foundation for evaluating the long-term stability of materials under variable-magnitude loads, such as cyclic traffic loading. According to the research by Werkmeister et al. ( 40 ), the response behavior of soil under cyclic loading can be classified into five typical modes (Figure 20): Elastic, Elastic Shakedown, Plastic Shakedown, Plastic Creep, and Incremental Collapse. When the applied load exceeds a certain threshold, plastic deformation accumulates continuously, potentially leading the structure into a state of plastic creep or incremental collapse, and ultimately to failure. Therefore, assessing the stress state of subgrade soil using shakedown theory is crucial for predicting its long-term performance.
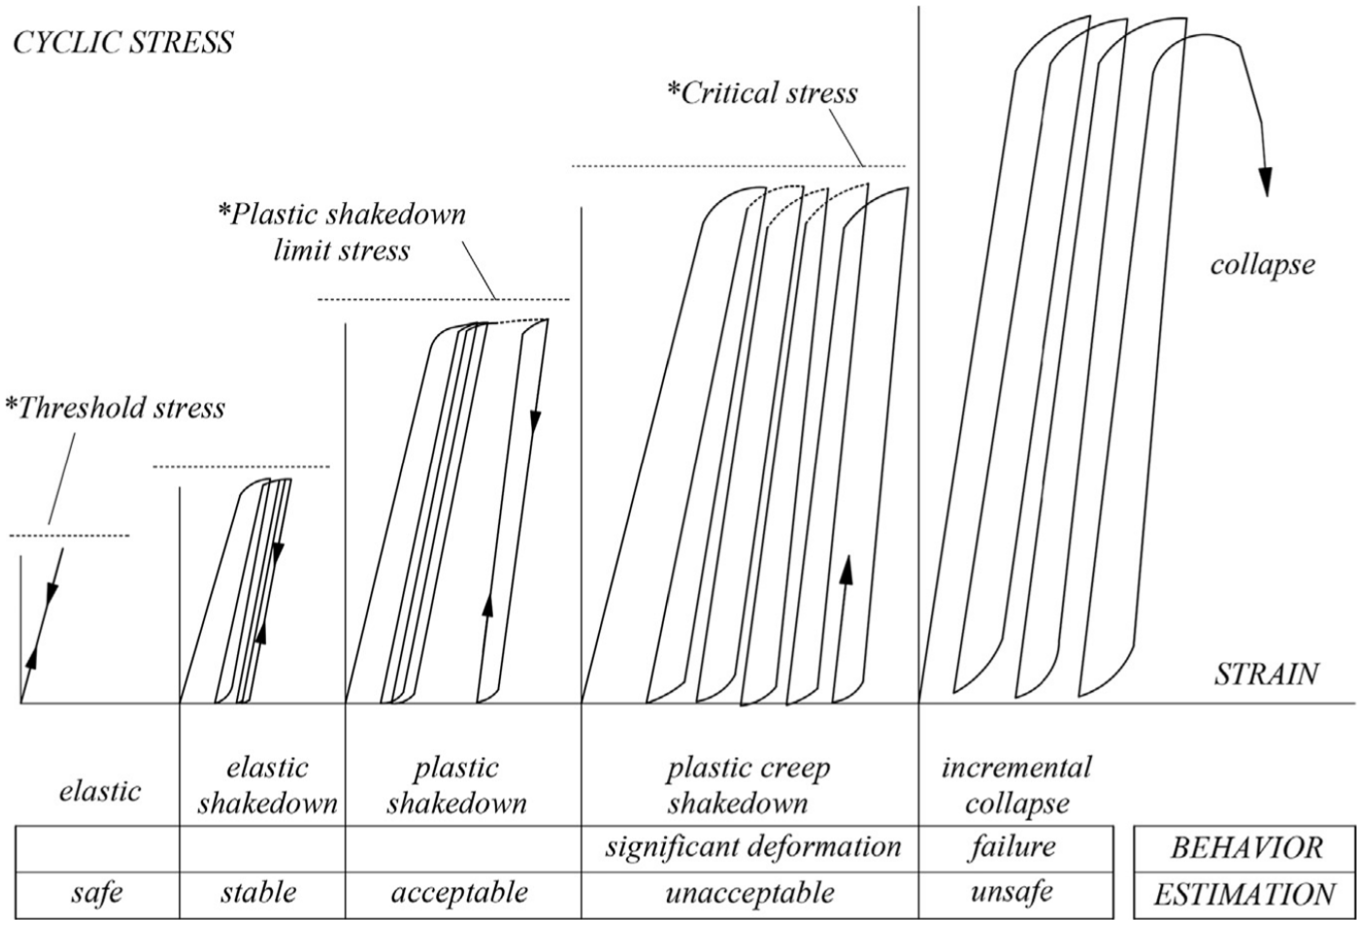
Typical shakedown behavior of soil under cyclic loading ( 4 ).
To quantitatively evaluate the stability of the subgrade soil under various conditions, this study defines a parameter known as the critical stress level (SL). The SL is calculated by normalizing the accumulated residual dynamic stress measured in the experiments, using the following formula:

In this study, the cumulative residual dynamic stress (σrd) is a direct measurement obtained from the various cyclic loading tests conducted in this study, including both laboratory tests and physical model tests. It represents the residual dynamic stress value at which the soil interior eventually stabilizes after being subjected to a series of loading cycles under specific conditions. The failure stress (σf) is the failure strength of the GRS, which serves as a benchmark. In this study, σf = 225 kPa represents the peak deviator stress at failure obtained from the monotonic triaxial test; specifically, the remolded specimen (prepared at the same density and water content as in the road model test) was isotropically consolidated under σ3 = 20 kPa and then sheared at a constant axial strain rate of 0.075%/min until the peak deviator stress stabilized (the stress–strain curve of the GRS exhibited strain-hardening behavior); the stabilized peak deviator stress was recorded and taken as σf.
When applying this shakedown analysis framework to the GRS, two key assumptions were made:
Representativeness of a single σf: the most critical assumption of this study is that the σf = 225 kPa, measured via monotonic loading under a single confining pressure (20 kPa), can serve as an effective normalization benchmark for evaluating soil stability at different depths and under various cyclic stress states. A confining pressure of 20 kPa was selected because it effectively represents the low-stress environment of the subgrade in the physical model, particularly in the critical shallow zones. This assumption simplifies the analysis process. Although soil strength is stress-dependent, using a single, representative reference strength allows for a consistent engineering stability assessment across all test results. Therefore, the SL should be interpreted as a normalized stress level index that characterizes the proximity of the soil’s residual stress state to its failure strength under representative conditions, rather than as a precise “factor of safety” at any given depth.
Applicability of shakedown behavior classification: it is assumed that the classic shakedown behavior classifications originating from pavement material research are qualitatively applicable to describing the long-term deformation behavior of GRS under cyclic loading. This assumption provides a well-established theoretical framework for interpreting and classifying the complex soil behaviors observed (Table 3) and correlating them with expected in-service performance (i.e., stable, acceptable, or unsafe). The experimental results of this study demonstrate a clear correspondence between the calculated SL values and these behavioral classifications, which practically supports the validity of this assumption.
Using the preceding methods, the shakedown behavior of the subgrade soil under each condition was analyzed, and the results are summarized in Table 3.
Shakedown behavior and SL of subgrade soil under cyclic loading
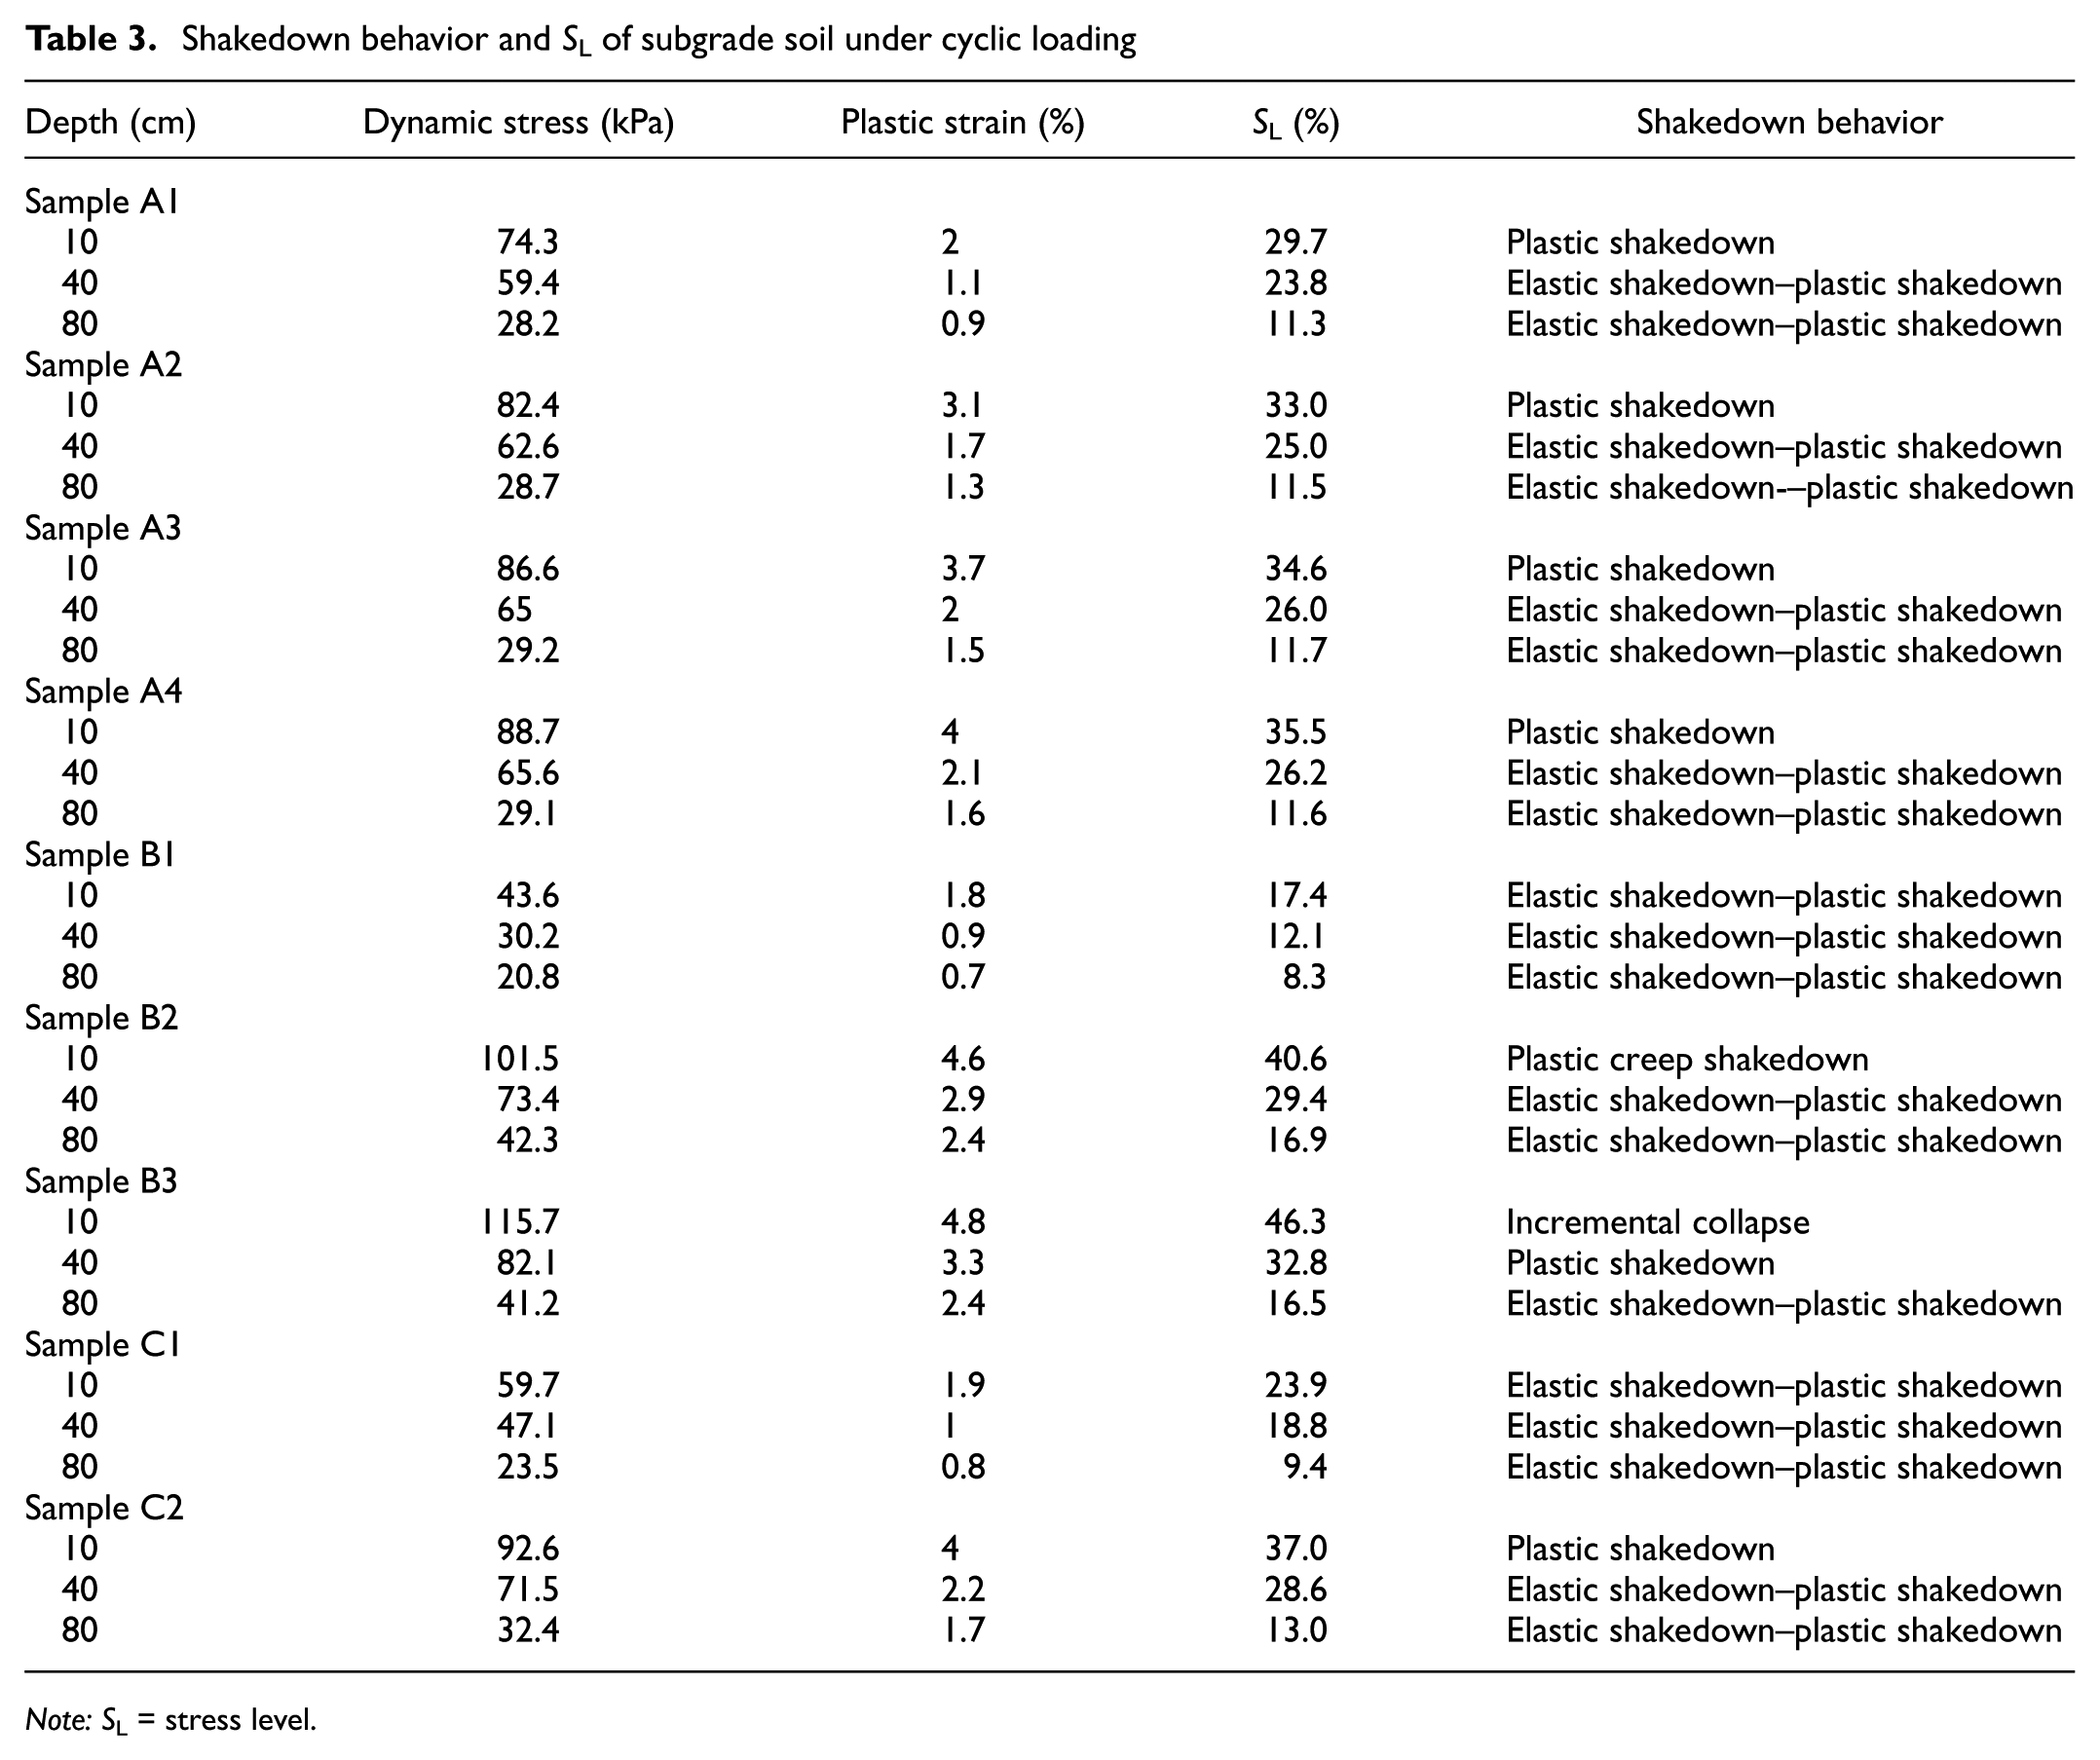
Note: S L = stress level.
Analysis of Shakedown Behavior
The analysis of dynamic stress and plastic deformation accumulation under cyclic loading reveals the following observations:
Shallow subgrade (z = 10 cm): At a vehicle load of W = 80 kg, plastic deformation accumulates rapidly during the initial cycle stage (N < 100). With increasing N, the accumulation rate declines, eventually stabilizing. Each cycle exhibits hysteresis with minimal plastic change, indicating that the soil is in a plastically stable state. However, at higher cyclic loads (e.g., W = 120 kg and 160 kg), plastic creep shakedown develops, where plastic deformation continues accumulating beyond initial stabilization, indicating a transition toward failure. At W =160kg, the soil shows plastic shakedown behavior during the initial cycle stage (N < 100). As N increases, significant deformation occurs, progressing into plastic creep shakedown and ultimately into incremental collapse. At failure, the plastic strain reaches 4.8%, and SL is 46.3%.
Middepth and deep subgrade (z = 40 cm, 80 cm): At a vehicle load of W = 40kg and N = 100, plastic deformation accumulation is minor during the early cycles. As N increases, the total strain gradually dissipates, with some plastic deformation persisting. The soil stabilizes in a transitional phase between elastic and plastic stability. At greater depths, the influence of cyclic loading on plastic creep is mitigated, as the overburden pressure helps to maintain structural integrity and limits excessive deformation accumulation.
The findings suggest that when subgrade soil is in a plastic latent state, increasing the cyclic load or the number of vehicle passages leads to incremental failure, with plastic deformation increasing linearly and indicating soil instability. Thus, cyclic loading not only affects immediate shakedown behavior but also governs the long-term accumulation of plastic creep deformation, which may eventually trigger instability.
Shakedown Thresholds and Practical Implications
The outcomes of the road model tests were generally satisfactory, with rare occurrences of instability. As shown in Table 3:
When SL > 40%, the soil enters a plastic creep shakedown state characterized by significant deformation. This state is critical because continued increases in cyclic load or N will lead to irreversible accumulation of plastic deformation, ultimately resulting in failure.
For 30% ≤SL≤40%, the soil exhibits plastic shakedown behavior and remains fundamentally stable. However, long-term cyclic loading may still cause progressive deformation, necessitating further monitoring.
When SL < 30%, the soil is in a transitional phase between elastic and plastic shakedown, maintaining relative stability even if N increases.
For road structures utilizing GRS as roadbed filling, maintaining SL < 40% ensures structural stability and resistance to failure. The SL parameter serves as a quantifiable threshold for assessing subgrade behavior under cyclic loading, enabling engineers to determine whether the soil will stabilize or enter a progressive failure mode. These findings provide theoretical insights and practical guidelines for road design and traffic management, aiding in the development of effective structural and operational strategies.
Conclusion
This study employed a combined experimental approach, integrating controlled laboratory cyclic loading tests with dynamically scaled road model tests, to investigate the dynamic stress accumulation in GRS subgrades. The laboratory tests were designed to elucidate the fundamental mechanisms of stress–strain evolution, while the road model tests served to validate these mechanisms at a system level and establish practical stability criteria. The key findings, synthesized from both experimental programs, are as follows:
The fundamental mechanism of dynamic stress accumulation, characterized by evolving stress–strain hysteresis loops, was identified in the laboratory tests. The loops transition from large and sparse in the early cycles (indicating significant plastic deformation and energy dissipation from particle rearrangement) to slender and nearly coincident in later cycles. This signifies a progression toward a stable, elastic shakedown state where deformation stabilizes.
These fundamental behaviors were qualitatively confirmed and complemented by the scaled road model tests. Under simulated moving traffic loads, the subgrade soil also exhibited a clear pattern of initial rapid stress/strain accumulation followed by stabilization, validating that the principles observed in the element tests are applicable to a more complex, layered system.
The primary synthesis of the laboratory and field-scale results was achieved through the application of shakedown theory. While the laboratory tests provided insight into the nature of different stability states (e.g., plastic creep versus elastic shakedown), it was the road model tests that allowed for the quantification of practical stability thresholds. By correlating the measured internal stress state with the observed long-term deformation, we established a set of SL criteria: Unsafe (SL≥ 40%)—corresponds to plastic creep and incremental collapse states, unacceptable for design; Conditionally Stable (30% ≤ SL < 40%)—corresponds to a plastic shakedown state, which may be acceptable for lower-class roads; and Stable (SL < 30%)—corresponds to an elastic shakedown state, representing a stable and resilient subgrade structure.
The road model tests further revealed the relative influence of operational parameters at a system level. Subgrade fill thickness was the dominant factor in mitigating dynamic stress accumulation because of stress attenuation. Vehicle load directly influenced the magnitude of stress, whereas vehicle speed had a comparatively minor effect. These findings provide direct, practical guidance for pavement design.
Finally, it is essential to acknowledge the inherent limitations of this study when applying its findings. These limitations stem from the laboratory tests, the scaled physical modeling, and the controlled experimental environment. First, the laboratory tests were conducted on remolded samples, which do not retain the original soil structure and stress history. Second, the scaled physical model, conducted under 1 g conditions, is subject to well-known scale effects. The nonscaling of gravitational stress leads to lower confining pressures, which results in reduced soil stiffness and a more concentrated stress distribution. This makes the model a conservative tool for analysis; a subgrade deemed stable by the SL criteria here is highly likely to be stable in the field. Lastly, the study did not account for environmental factors. For GRS, prevalent in the hot and humid regions of Southern China, the interplay of seasonal moisture changes and high temperatures can significantly affect soil strength. Future research should therefore focus on incorporating these crucial hydro-mechanical and thermal effects to develop a more comprehensive prediction model for subgrade stability. Furthermore, future modeling efforts could benefit from employing more advanced techniques, such as nonlinear regression or the explicit quantification of damping ratios, to build a more sophisticated constitutive model for GRS under cyclic loading. Ultimately, these laboratory and model-based findings should be further validated through long-term field monitoring of in-service pavements, which represents the next major goal of our research program.
Supplemental Material
sj-docx-1-trr-10.1177_03611981261455014 – Supplemental material for Dynamic Stress Accumulation Characteristics in Granite Residual Soil under Cyclic Loading
Supplemental material, sj-docx-1-trr-10.1177_03611981261455014 for Dynamic Stress Accumulation Characteristics in Granite Residual Soil under Cyclic Loading by Liansheng Tang, Jianing Huang, Dengheng Zheng and Jijie Du in Transportation Research Record
Supplemental Material
sj-docx-2-trr-10.1177_03611981261455014 – Supplemental material for Dynamic Stress Accumulation Characteristics in Granite Residual Soil under Cyclic Loading
Supplemental material, sj-docx-2-trr-10.1177_03611981261455014 for Dynamic Stress Accumulation Characteristics in Granite Residual Soil under Cyclic Loading by Liansheng Tang, Jianing Huang, Dengheng Zheng and Jijie Du in Transportation Research Record
Footnotes
Authors’ Note
During the preparation of this work, the authors used Google’s Gemini language model to enhance language quality and improve readability. After using this tool, the authors reviewed and edited the content as needed and take full responsibility for the content of the publication.
Author Contributions
The authors confirm contribution to the paper as follows: study conception and design: Liansheng Tang, Jianing Huang, Dengheng Zheng, Jijie Du; methodology development: Liansheng Tang, Jianing Huang, Jijie Du; formal analysis and investigation: Jianing Huang, Jijie Du; draft manuscript preparation: Jianing Huang, Jijie Du; manuscript review and editing: Jianing Huang, Dengheng Zheng; funding acquisition: Liansheng Tang; resources provision: Liansheng Tang; supervision: Liansheng Tang. All authors reviewed the results and approved the final version of the manuscript.
Declaration of Conflicting Interests
The authors declared no potential conflicts of interest with respect to the research, authorship, and/or publication of this article.
Funding
The authors disclosed receipt of the following financial support for the research, authorship, and/or publication of this article: This work was supported by the National Natural Science Foundation of China (42277142); National Cultivation Project for Guangzhou Institute of Science and Technology (2024gjp002); Research Start-up Funding Project for Guangzhou Institute of Science and Technology (2023KYQ028).
Data Accessibility Statement
Data sets generated during the current study are available from the corresponding author on reasonable request.
Supplemental Material
Supplemental material for this article is available online.
References
Supplementary Material
Please find the following supplemental material available below.
For Open Access articles published under a Creative Commons License, all supplemental material carries the same license as the article it is associated with.
For non-Open Access articles published, all supplemental material carries a non-exclusive license, and permission requests for re-use of supplemental material or any part of supplemental material shall be sent directly to the copyright owner as specified in the copyright notice associated with the article.