
Abstract
The pipe-roof method is an increasingly popular pre-construction support system for underground space development. However, conventional pipe-roof systems suffer from low bearing capacity and complex construction procedures, limiting their application in ultra-shallow-buried large-span metro stations. To address these limitations, this study proposes an innovative adaptation termed the pipe-roof-concrete slab (PRCS) method. Based on the Shenyang Metro Line 3 Heping South Street Station in China, a three-dimensional finite difference model was developed through refined modeling and validated against field measurements. The results reveal that surface settlement follows a quadratic function relationship with pipe-roof stiffness and roof slab modulus, and a linear relationship with slab spacing and thickness. Increasing pipe-roof stiffness from 0.5EI to 2.5EI reduces maximum settlement by 41.40%, while increasing slab thickness from 400 mm to 1,000 mm reduces settlement by 35.95%. A multiple linear regression model was established to quantify the matching relationships between parameters, achieving an adjusted R2 of 0.886. These quantitative relationships provide a theoretical basis for understanding the parameter interactions and optimizing the structural design of PRCS systems. Based on these findings, practical guidance is provided for the rational selection of structural parameters to meet different settlement control standards in similar underground engineering projects.
Introduction
The rapid advancement of economic development and accelerated urbanization have driven continuous infrastructure expansion and refinement, with urban rail transit systems representing a critical component (1–3). At the end of 2024, 362 urban rail transit lines were operational across 58 cities in 28 Chinese provinces, achieving a total length of 12,168.77 km. Subway systems dominate this network, accounting for 9,281.37 km (76.27%) ( 4 ). Urban metro construction faces escalating challenges, including complex geological profiles, proximity to existing utilities and structures, and increasingly stringent settlement control requirements ( 5 , 6 ). Conventional tunneling techniques, exemplified by the shallow tunneling method, are constrained by intricate workflows, low efficiency, elevated safety risks, and substantial environmental disruption, rendering them unsuitable for ultra-shallow buried station construction ( 7 , 8 ). These limitations necessitate innovative tunneling methodologies, prompting the development of the pipe-roof method.
First implemented in 1962 during the Tokaido Shinkansen’s Atami Tunnel project in Japan, the pipe-roof method marked a milestone in underground engineering. Its subsequent adoption in Belgium, Italy, the U.S., South Korea, and China has progressively expanded its applications ( 9 , 10 ). This method involves the sequential installation of tightly spaced steel pipes via pipe-jacking machines, which are laterally interconnected to form a continuous structural canopy. Subsequent excavation beneath this prefabricated support system offers operational simplicity and enhanced settlement mitigation. More importantly, it markedly reduces acoustic emissions. The pipe-roof method enables excavation under ultra-shallow cover (≤5 m) within its pre-support system, significantly reducing construction noise compared with open-cut methods that require extensive surface excavation ( 11 ). Additionally, the self-compacting concrete (>90% fullness) and inter-pipe grouting form a dense barrier that blocks noise transmission to the surface (12–14).
Contemporary research focused on parametric optimization of pipe-roof systems, including pipe diameter, spacing, geometric configuration, connection mechanisms, length, and wall thickness. Lu et al. employed finite element modeling to quantify the influence of steel beam dimensions and spacing on canopy deformation and surface subsidence ( 15 ). Through sensitivity analysis, Dong et al. established criteria for pipe diameter selection under varying roof lengths and structural spans ( 16 ). Experiments and numerical investigations by Jia et al. elucidated the bending resistance mechanisms of pipe-roof systems, providing theoretical foundations for structural refinement ( 17 ). Li et al. presented the analysis methods for long-term structural monitoring and the application of intelligent algorithms ( 18 ). Shin et al. integrated physical modeling and computational simulations to evaluate canopy length effects on stability of the rock surrounding a tunnel ( 19 ). Nevertheless, systematic studies addressing parameter interdependence within pipe-roof systems remain scarce.
While global scholars have proposed diverse pipe-roof configurations and extensively investigated parameter-structure interactions, persistent challenges include protracted construction timelines, complex inter-pipe connections, inefficient spatial utilization, and significant soil disturbance. To address these limitations, this study introduces an innovative adaptation of the pipe-roof method, namely the pipe-roof-concrete slab (PRCS) method, characterized by streamlined construction workflows, broad applicability, and enhanced performance in geotechnically complex conditions. Leveraging its implementation at Shenyang Metro’s Heping South Street Station in China, the parameter compatibility between pipe-roof systems and concrete slabs is investigated to optimize the proposed methodology.
Project Overview
Site Conditions
The Heping South Street Station of Shenyang Metro Line 3 is located at the intersection of Heping South Street and Nanba Road. The station is designed along the direction of Heping South Street, surrounded by numerous existing buildings, as shown in Figure 1. The central station mileage is Right DK27 + 692.578. Shield tunneling sections are connected to both ends of the station, with shield launch shafts provided. The foundation pit support adopts bored piles with a diameter of 1,000 mm spaced at 1,200 mm centers, combined with an internal bracing system. Groundwater treatment utilizes a dewatering well system outside the pit. The construction method combines open-cut excavation at both ends and concealed excavation across the intersection, with the concealed excavation section employing PRCS ( 20 ).
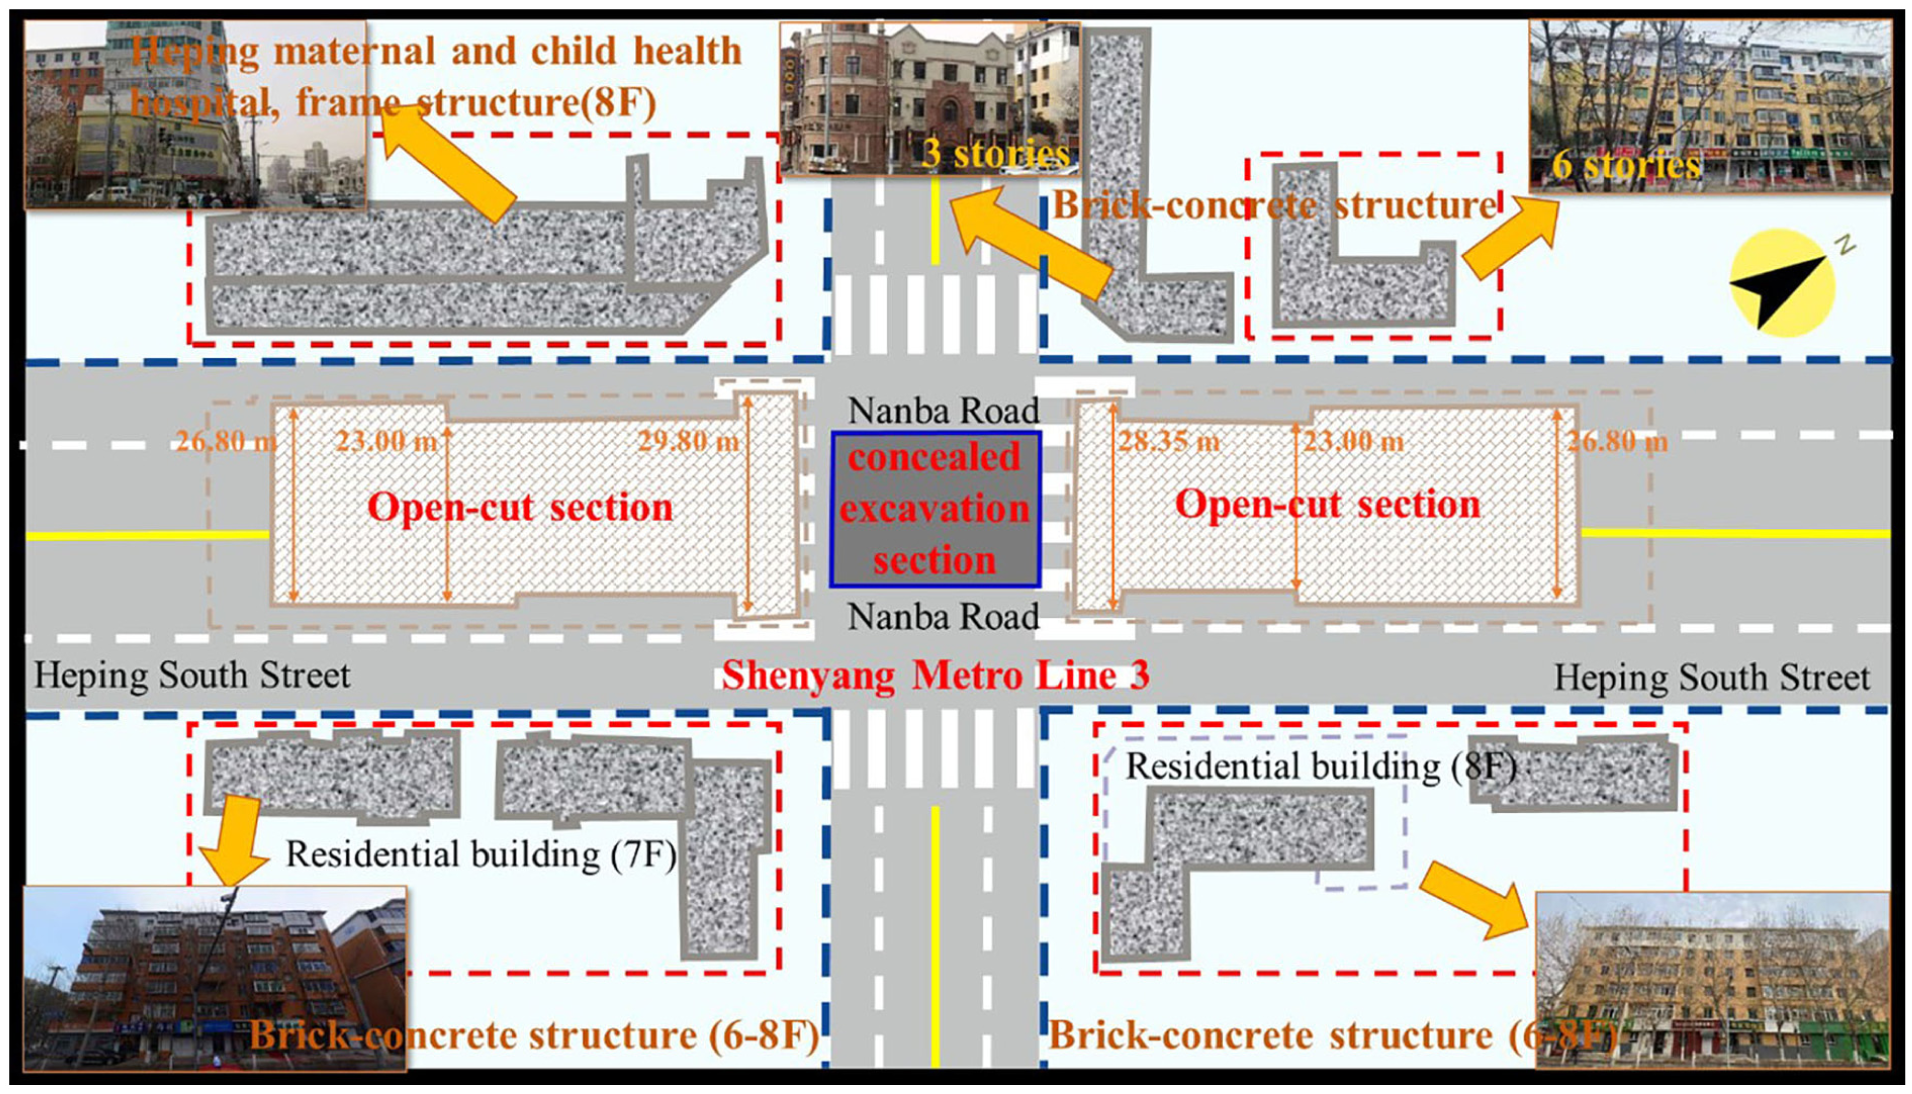
Layout of Heping South Street Station.
Station Structure and Pipe-Roof Layout
The station is a single-column double-span three-story structure with a single span of 7.5 m, a standard section width of 20.9 m, and a base slab burial depth of approximately 25.99 m. The total longitudinal length of the station is 38 m. The average thickness of the overlying soil is about 4.2 m. The pipe-roof support structure consists of 53 Q235 hot-rolled seamless steel pipes with a diameter of 457 mm and a wall thickness of 16 mm. The center-to-center distance between adjacent steel pipes is 500 mm. Cement mortar is poured between the pipes, while C30 high-flowability self-compacting concrete is poured inside the pipes. The thickness of the concrete slab below the pipe-roof is 900 mm. The station’s side piles are mechanically formed piles with a diameter of 1,000 mm spaced at 1,400 mm centers, and the central columns are concrete-filled steel tube (CFST) columns with a diameter of 1,000 mm spaced at 6,000 mm centers. The main structure of the station is located in a stratum composed of medium-coarse sand, gravelly sand, and rounded gravel, as shown in Figure 2.
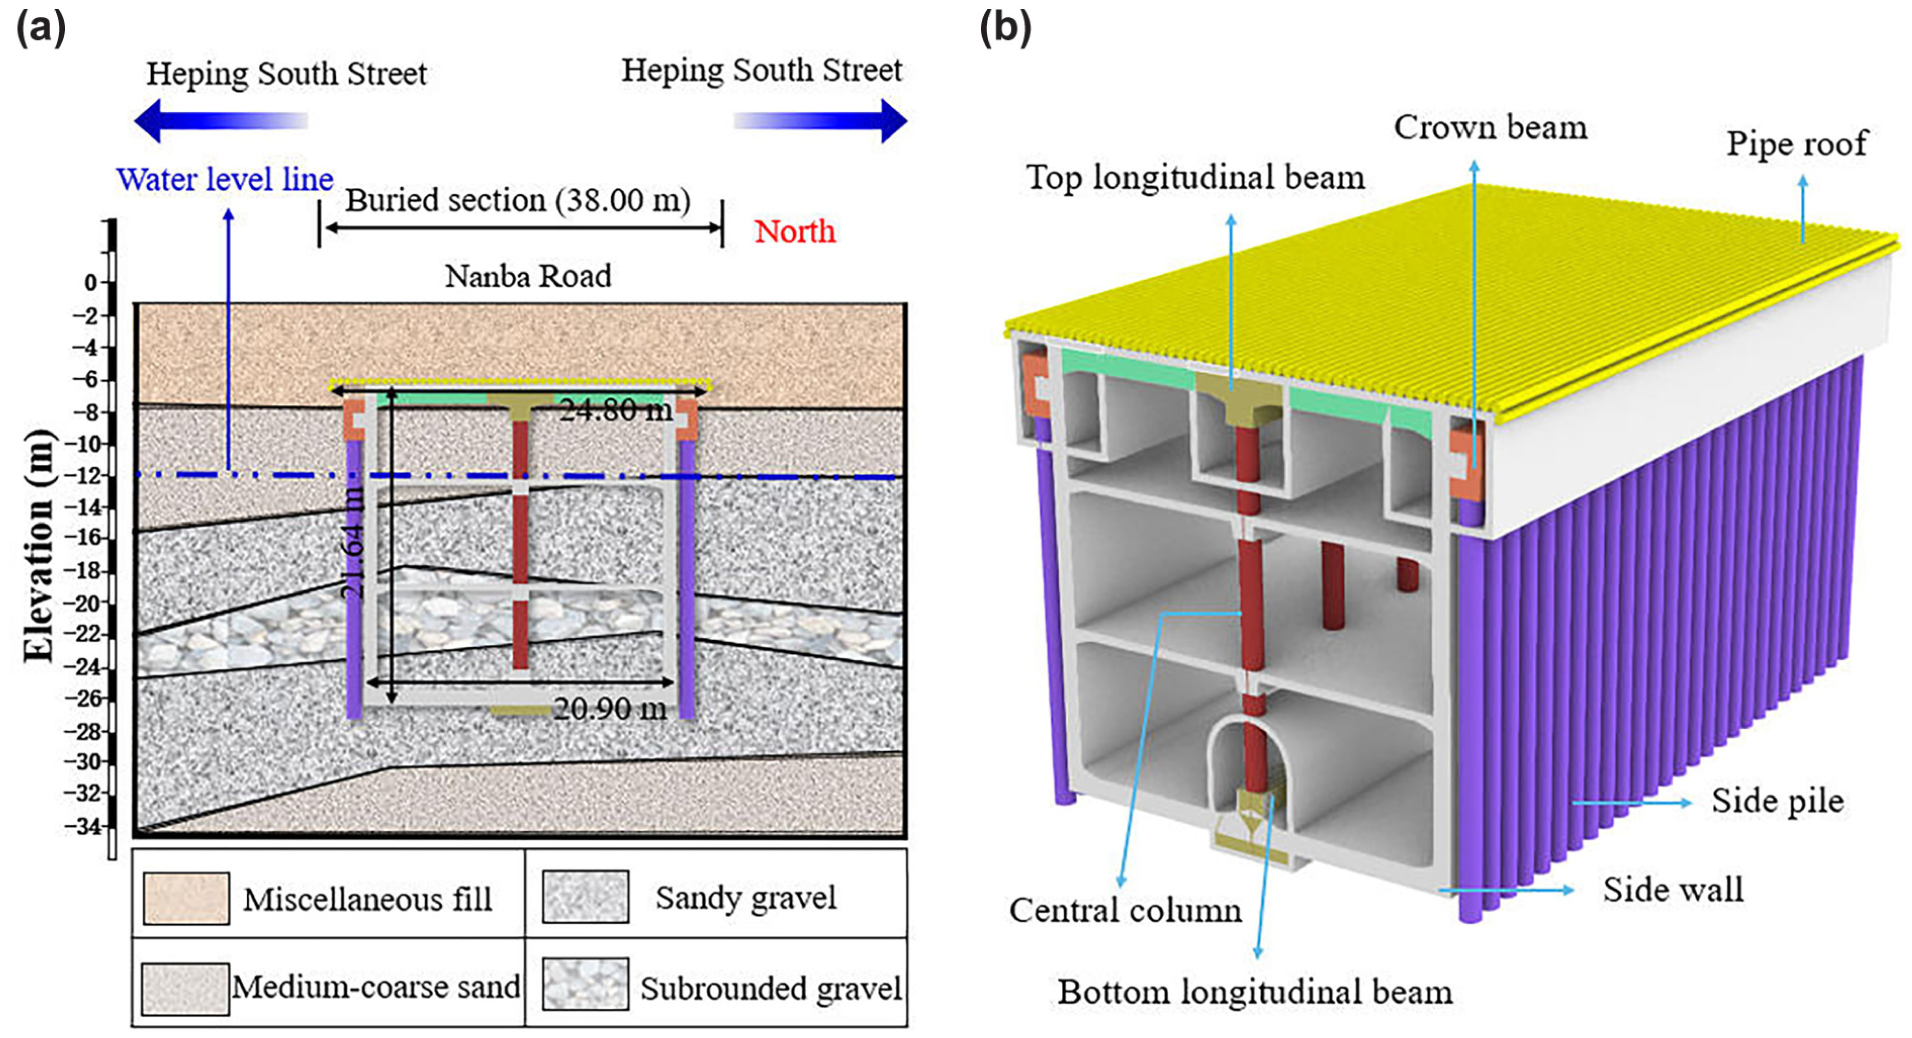
Overall station structure: (a) engineering geological and (b) station structure.
Pipe-Jacking Construction Sequence
The steel pipes are jacked using an auger boring machine (Figure 3). This machine comprises a frame, cutter head, and hydraulic power station, with dimensions of 6.3 m (length) × 1.3 m (width) × 1.8 m (height). During pipe-roof construction, each pipe-roof element begins with the installation of a guide drill rod (diameter: 110 mm, length per section: 1 m) using hexagonal socket-and-spigot connections. The rod is advanced via hydraulic jacks and corrected for alignment using a wedge-shaped drill bit. A hollow drill rod (outer diameter: 400 mm), designed to be inserted into the guide drill rod, is employed. This hollow drill rod features spiral grooves and octagonal socket-and-spigot connections (length per section: 1 m). The hollow drill rod and steel pipe are simultaneously inserted into the pre-installed guide drill rod, with advancement driven by hydraulic jacks. During the jacking process, the steel pipe advances while simultaneously discharging excavated soil. Notably, both the guide drill rod and steel pipe share the same hydraulic equipment for jacking. On completion of one pipe-roof element, the process is sequentially repeated for subsequent elements, followed by grouting for sealing.
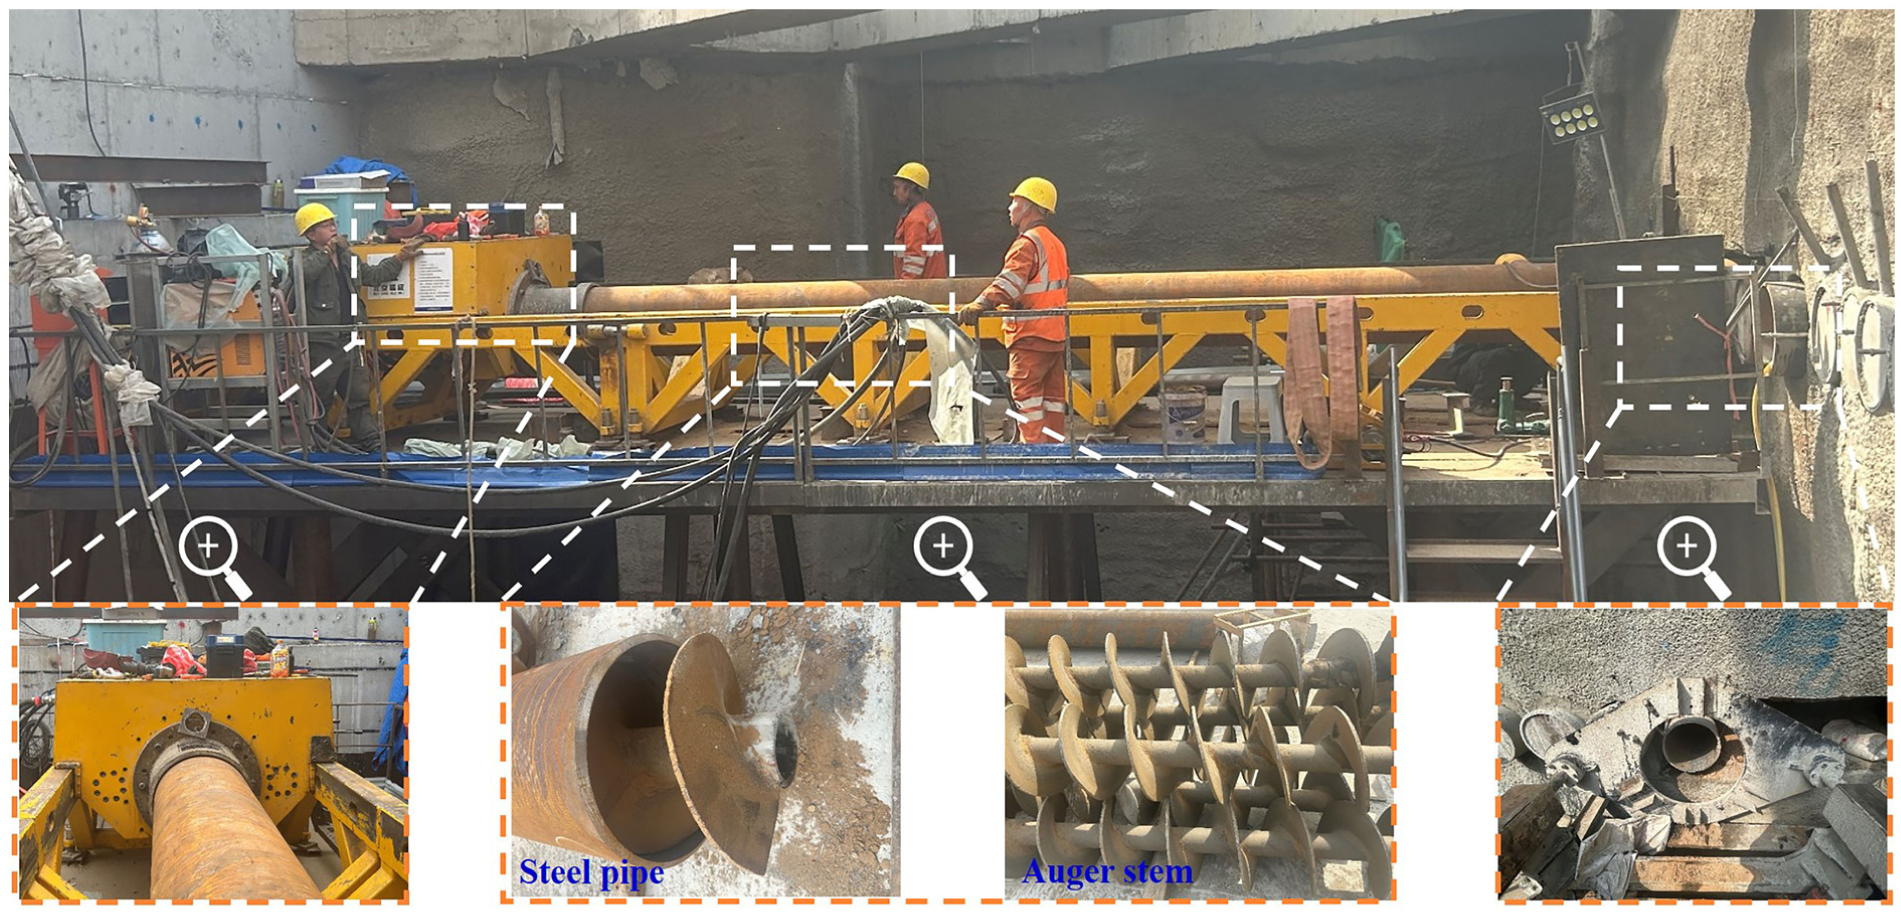
Diagram of pipe-roof jacking equipment.
Station Construction Sequence
The construction sequence of the PRCS, as illustrated in Figure 4, comprises seven primary steps:
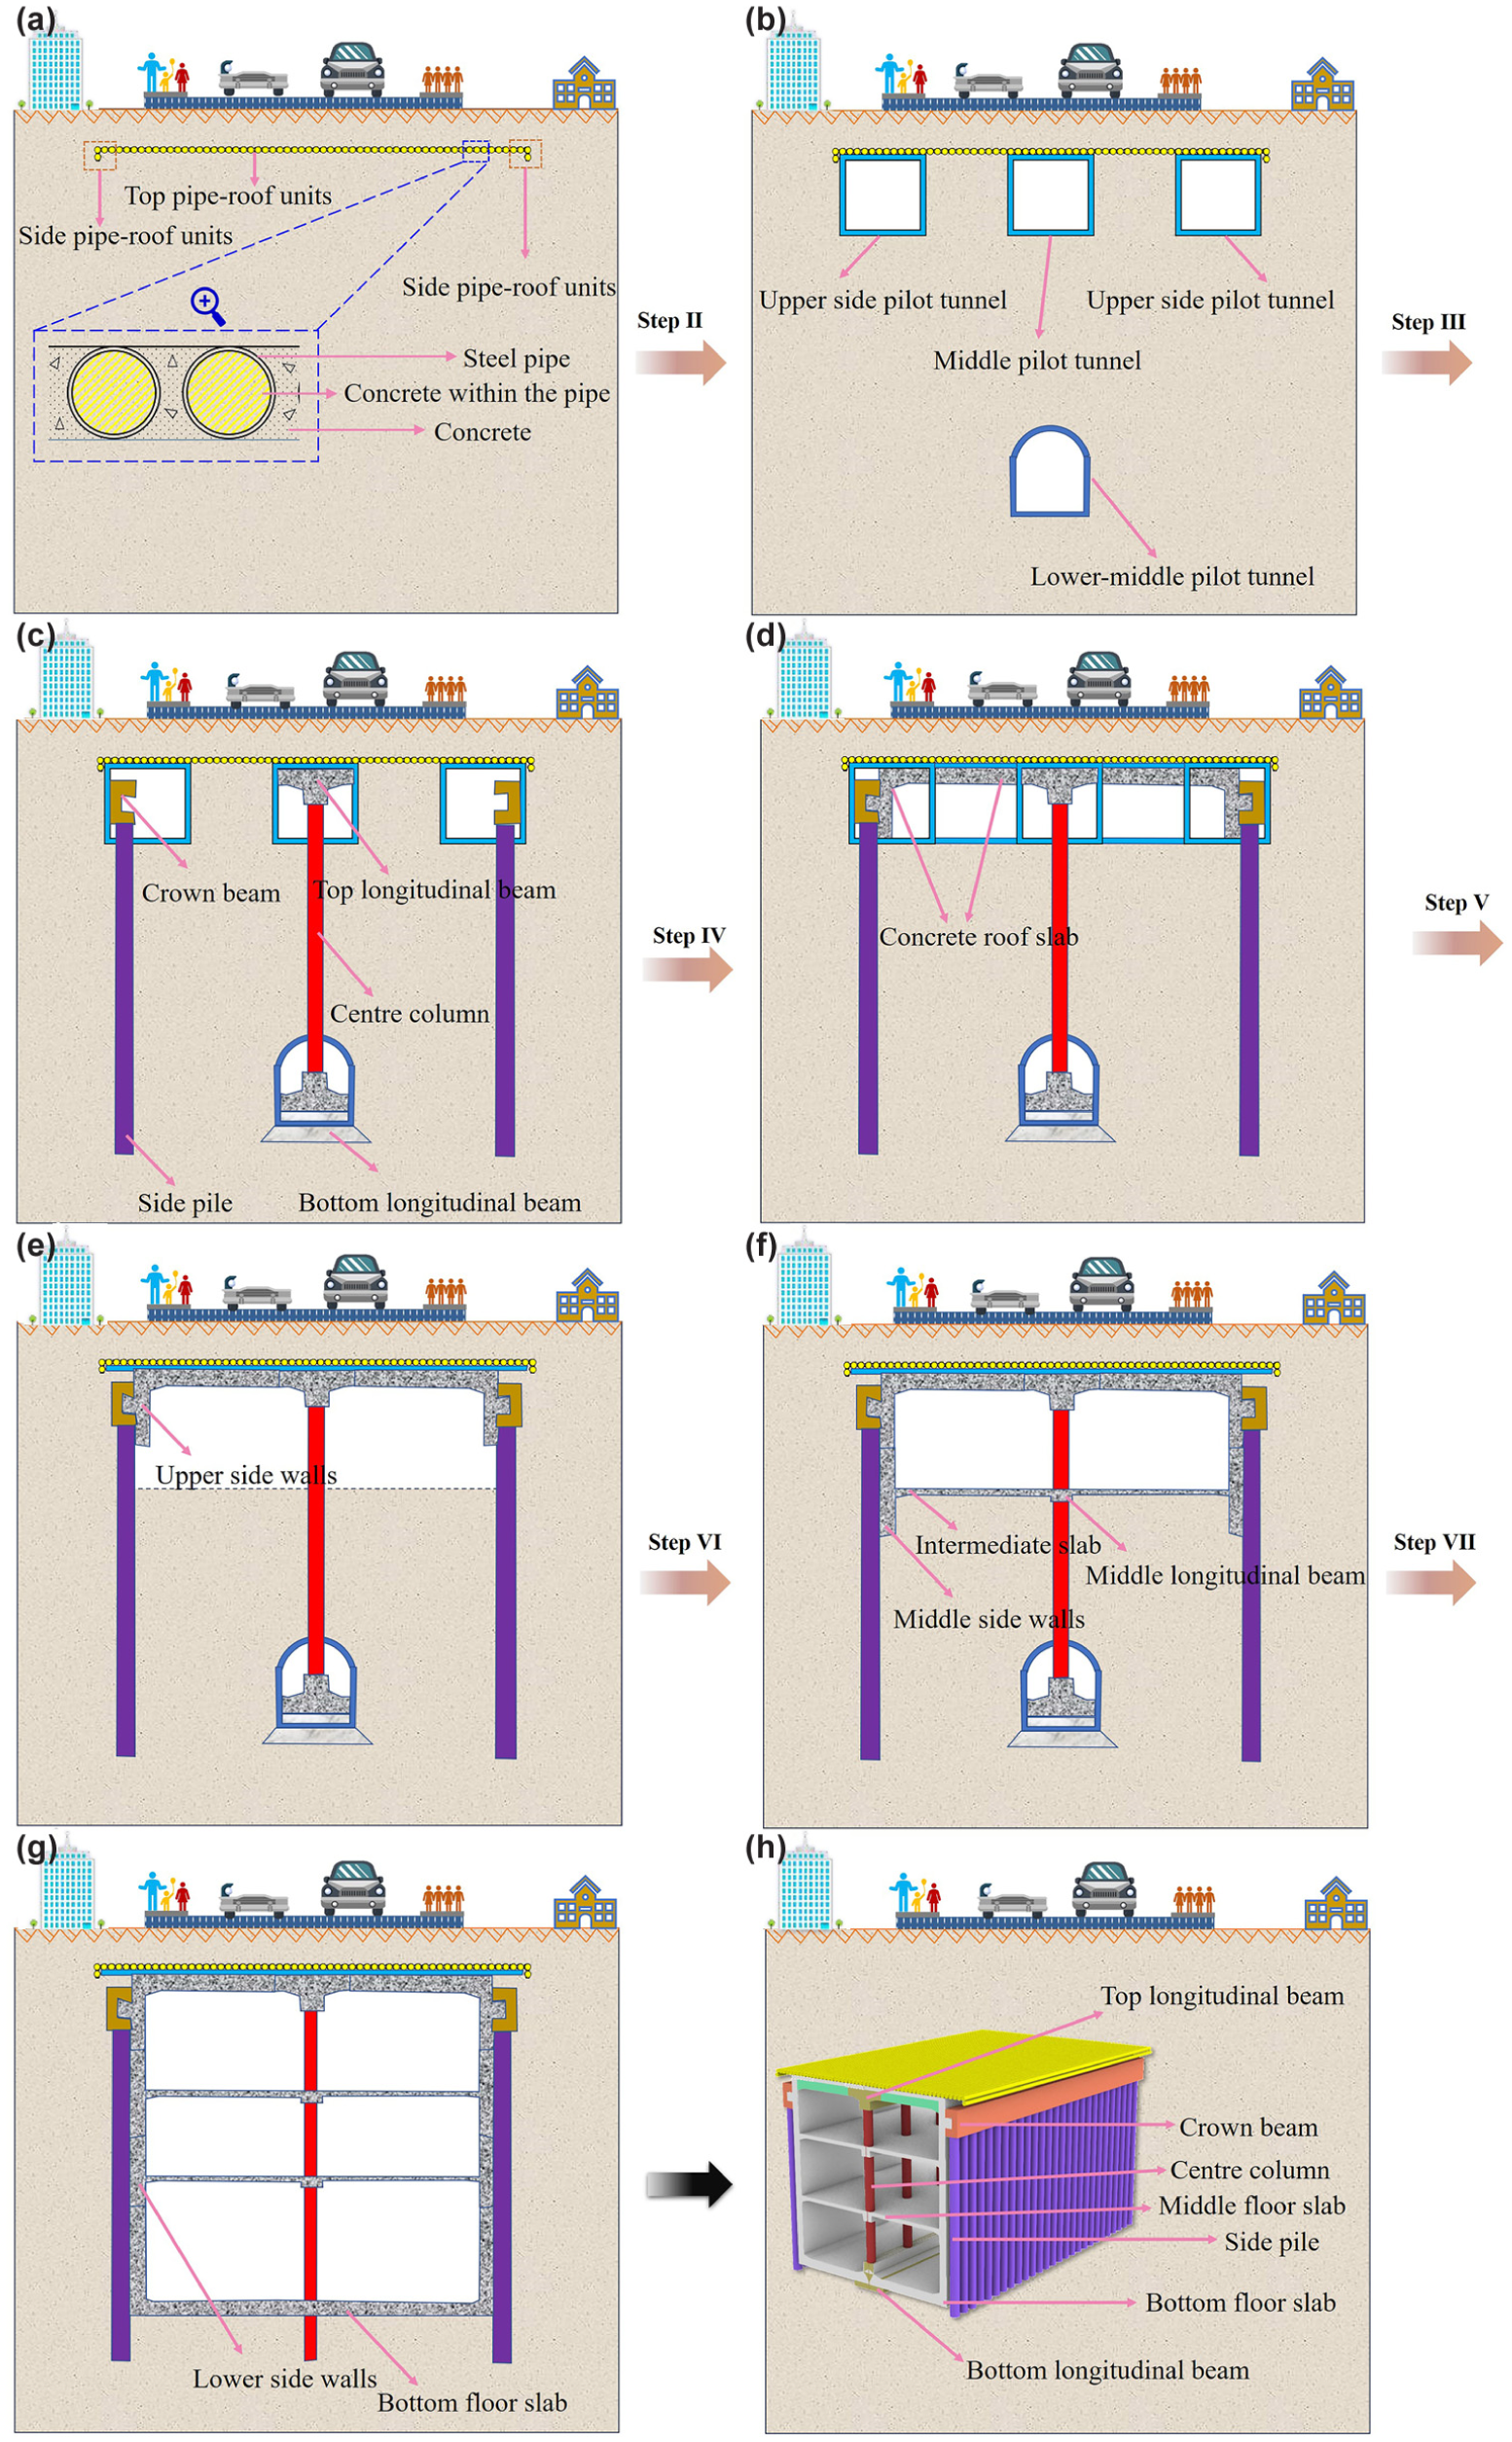
Construction steps: (a) Stage I, (b) Stage II, (c) Stage III, (d) Stage IV, (e) Stage V, (f) Stage VI, (g) Stage VII, and (h) artist’s impression of the completed station.
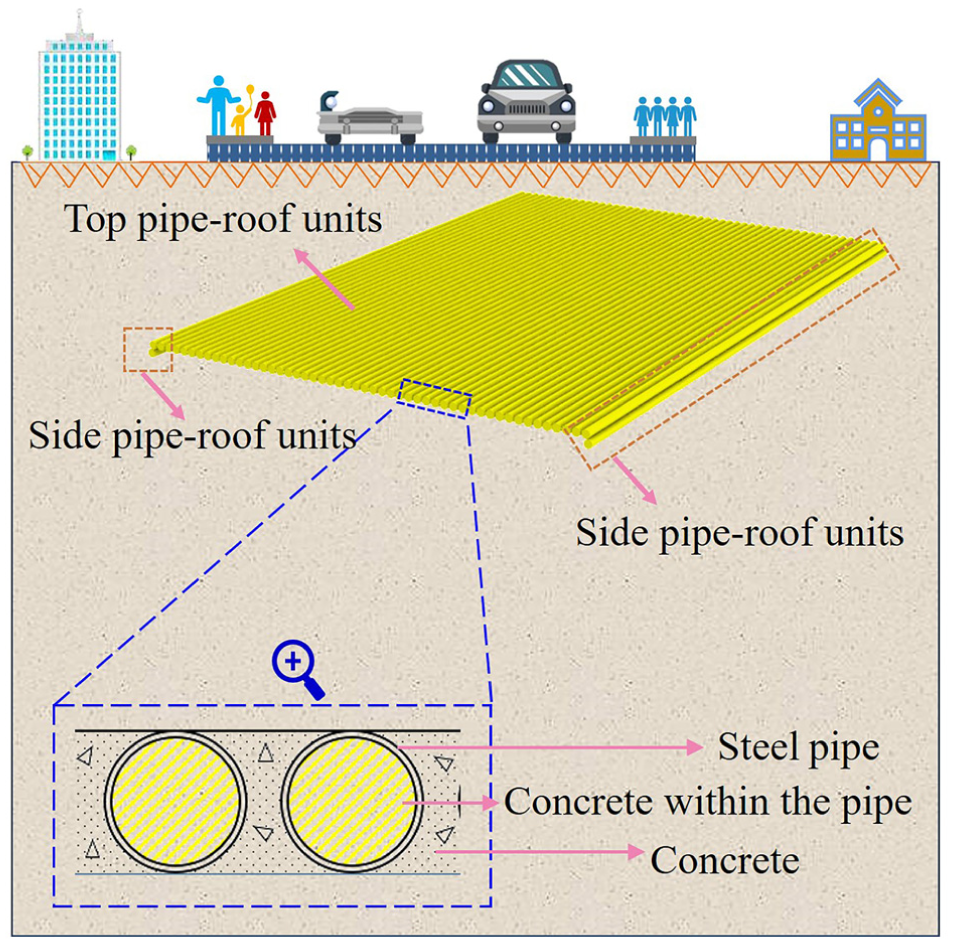
Schematic diagram of the pipe-roof-concrete slab method layout.
Numerical Model Establishment
Model Dimensions and Boundary Conditions
First, precise geometric modeling of the underground station structure was undertaken using Rhino (Rhinoceros). Subsequently, robust mesh generation was performed on this model using the Griddle plugin. The meshed model was then imported into FLAC3D to analyze the impact of structural parameters on surface settlement ( 21 , 22 ). Based on the actual construction sequence of Heping South Street Station (as described in the Station Construction Sequence section), the model dimensions were set to 150 m (length) × 38 m (width) × 50 m (height). The model incorporates a surcharge load of 20 kPa (GB 50157-2013) and soil self-weight, with fixed boundaries applied to the four lateral surfaces and base, while the top surface remains free (Figure 6) ( 23 ).
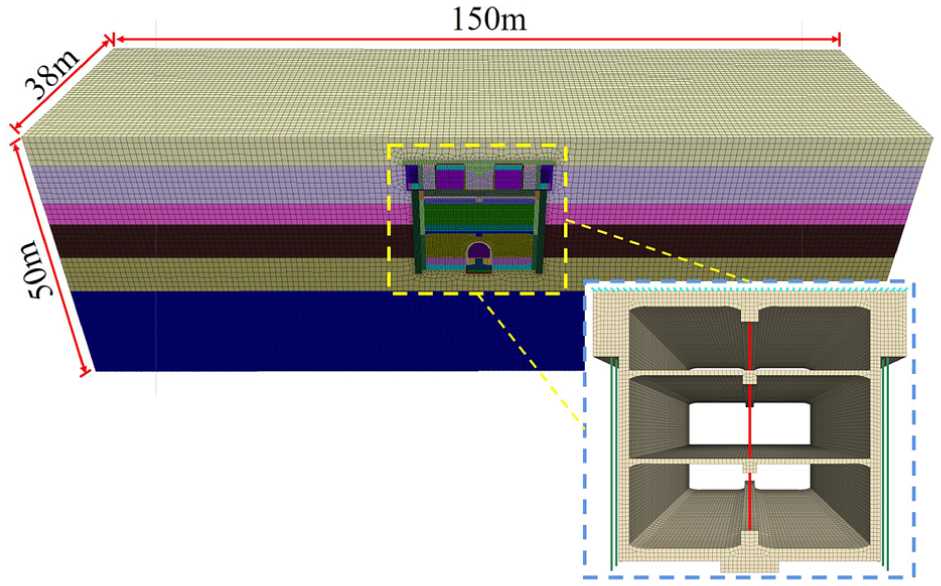
Numerical model schematic.
Considering the substantial soil disturbance caused by the PRCS method during subway station construction, localized mesh refinement was applied to the vicinity of the main station structure. Key structural components such as side piles and central columns were simulated using a coupled solid-structural element approach. Lattice girders and shotcrete are modeled with solid elements, whereas temporary excavation supports are represented by shell structural elements. The final numerical model contains 290,110 solid elements, 274,256 nodes, and 78,433 surface mesh elements.
Additionally, before the construction, foundation pits were built at both ends of the underground excavation section to serve as launching and receiving shafts. Since the dewatering process was completed before the pipe-roof installation, the seepage effect of water was not considered in this model.
Constitutive Models and Parameters
The surrounding soil layers of the station were assumed to be homogeneous, continuous elastoplastic media modeled using the Mohr-Coulomb constitutive model ( 24 ). Lattice girders, temporary supports, side piles, and central columns were simulated as linear elastic materials. Key parameters for the strata and station structures are listed in Table 1. Groundwater effects were excluded from the analysis because of pre-construction dewatering. Surface settlement induced during pipe-roof installation was controlled via inter-pipe grouting, achieving near-zero settlement or controlled pre-uplift before the main excavation ( 25 ). Consequently, the numerical simulation omits the pipe-jacking phase.
The Main Parameters of Soil and Station Structures
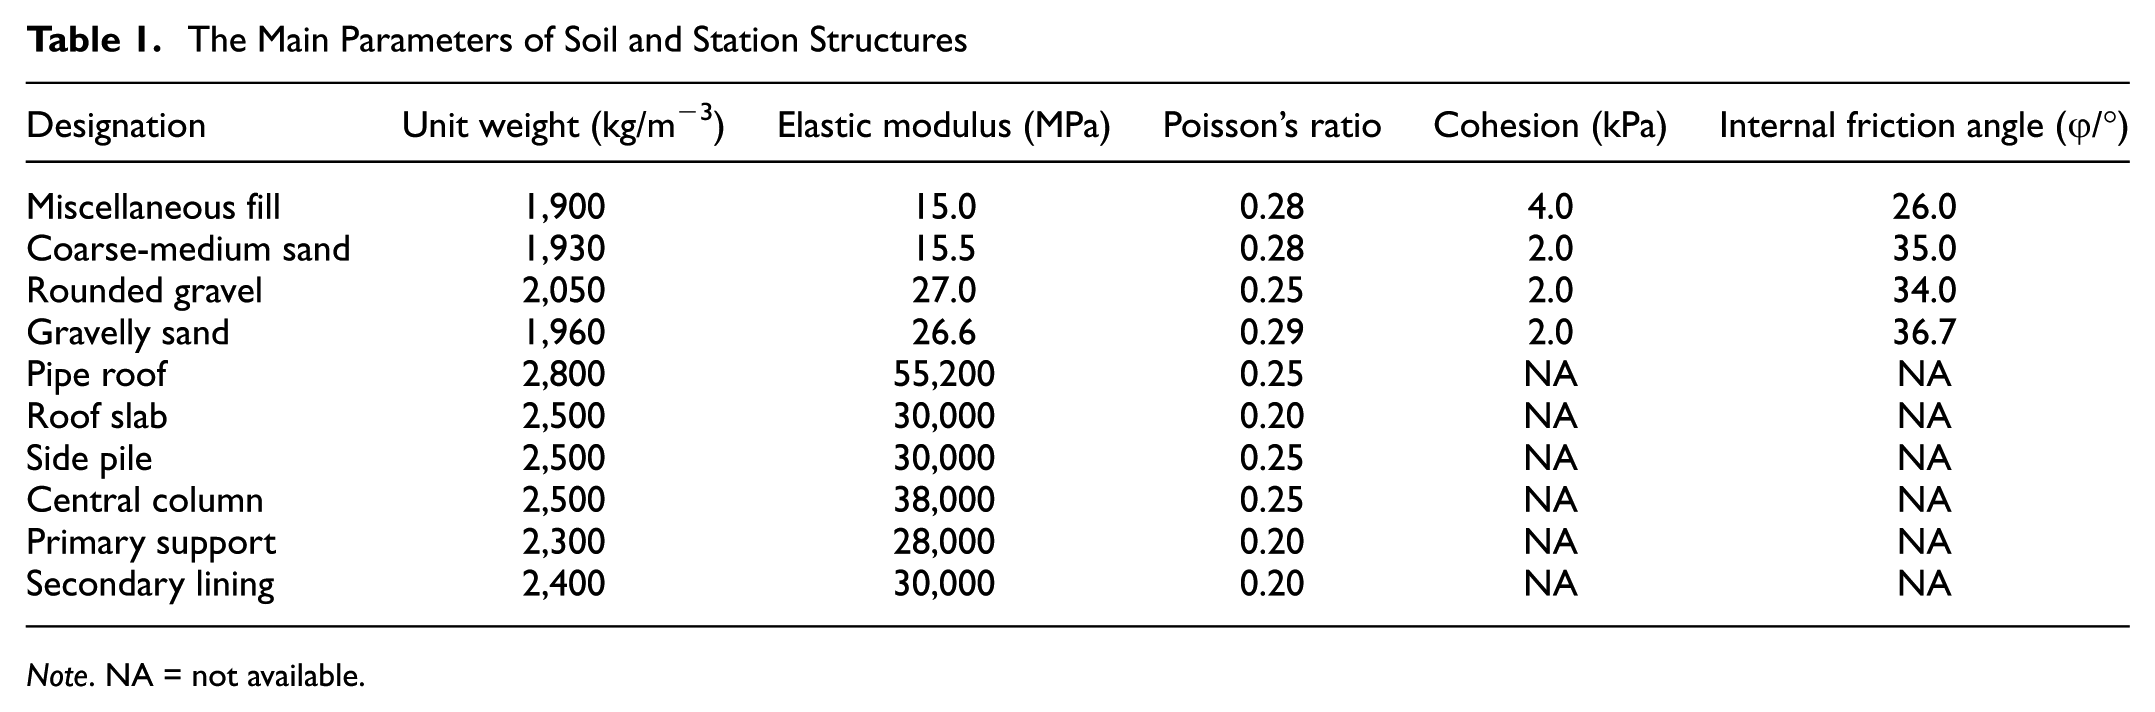
Note. NA = not available.
Numerical Simulation Process and Validation
The numerical simulation strictly followed the actual construction sequence of the PRCS. Following initial geostatic stress equilibration, the actual construction sequence was simulated, with numerical convergence defined when the ratio of maximum unbalanced force to typical internal force in the system falls below a threshold of 1 × 10⁻⁵. During the construction of Heping South Street Station, surface settlement was monitored. A comparative analysis between field measuring (central point) and numerical results is presented in Figure 7. The results exhibit strong congruence in settlement curves, with accurate prediction of maximum settlement values. This validates the rationality and accuracy of the established three-dimensional finite difference model, providing a reliable computational foundation for subsequent parametric analyses.
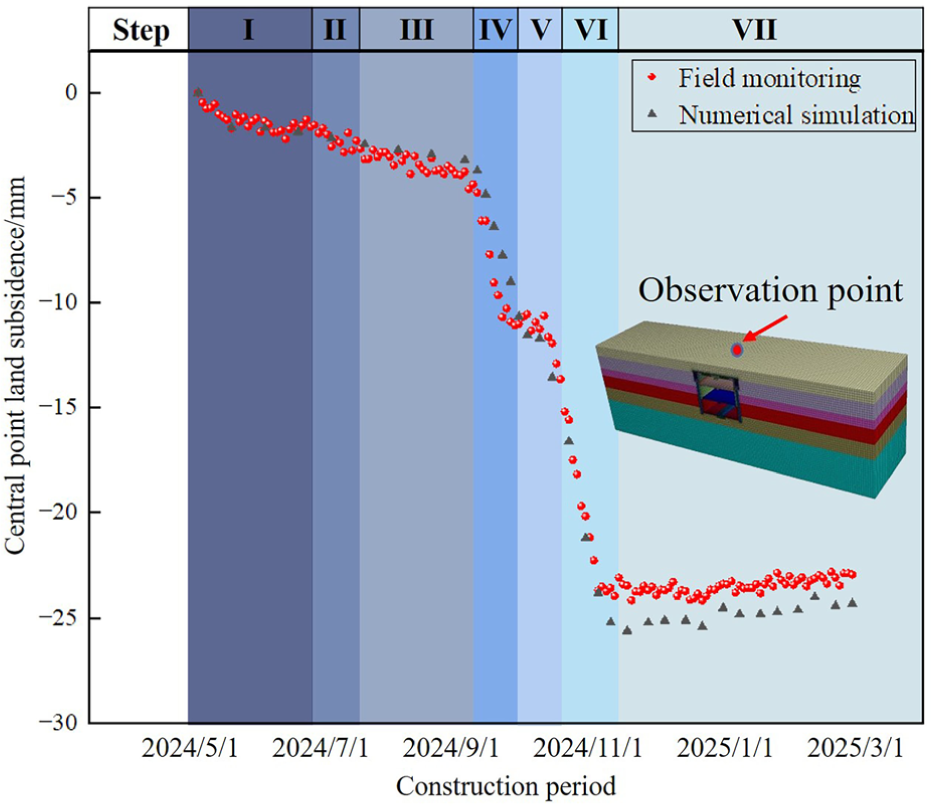
Comparison of numerical simulation and field monitoring results of Heping South Street Station.
Influence of Structural Parameters on Surface Settlement
The subsequent analysis examines the influence of pipe-roof stiffness, roof slab modulus, spacing, and thickness on surface settlement, along with the matching relationships between these parameters. This analysis is grounded in the aforementioned validated numerical model, which has demonstrated high accuracy in replicating field monitoring data. The guiding conclusions are expected to provide robust reference for the design of similar underground engineering structures.
Pipe-Roof Stiffness
The baseline pipe-roof stiffness (EI) corresponds to a structure with steel pipes (outer diameter 457 mm, 16 mm wall thickness, 500 mm spacing), filled with C30 concrete and fabricated from Q235 steel. To investigate the influence of pipe-roof stiffness on surface settlement, five numerical models were established with stiffness values of 0.5EI, 1.0EI, 1.5EI, 2.0EI, and 2.5EI. Parameters including concrete slab (12 m), elastic modulus of roof slab (30 GPa), and slab thickness (900 mm) remained consistent with field conditions.
Figure 8 presents transverse and longitudinal surface settlement profiles under varying stiffnesses. As shown in Figure 8a, transverse settlement demonstrates a Gaussian distribution pattern, with maximum settlement occurring at the span center. Increasing pipe-roof stiffness reduces peak settlement but does not significantly alter the settlement trough width, indicating negligible impact on soil disturbance zones adjacent to the station.
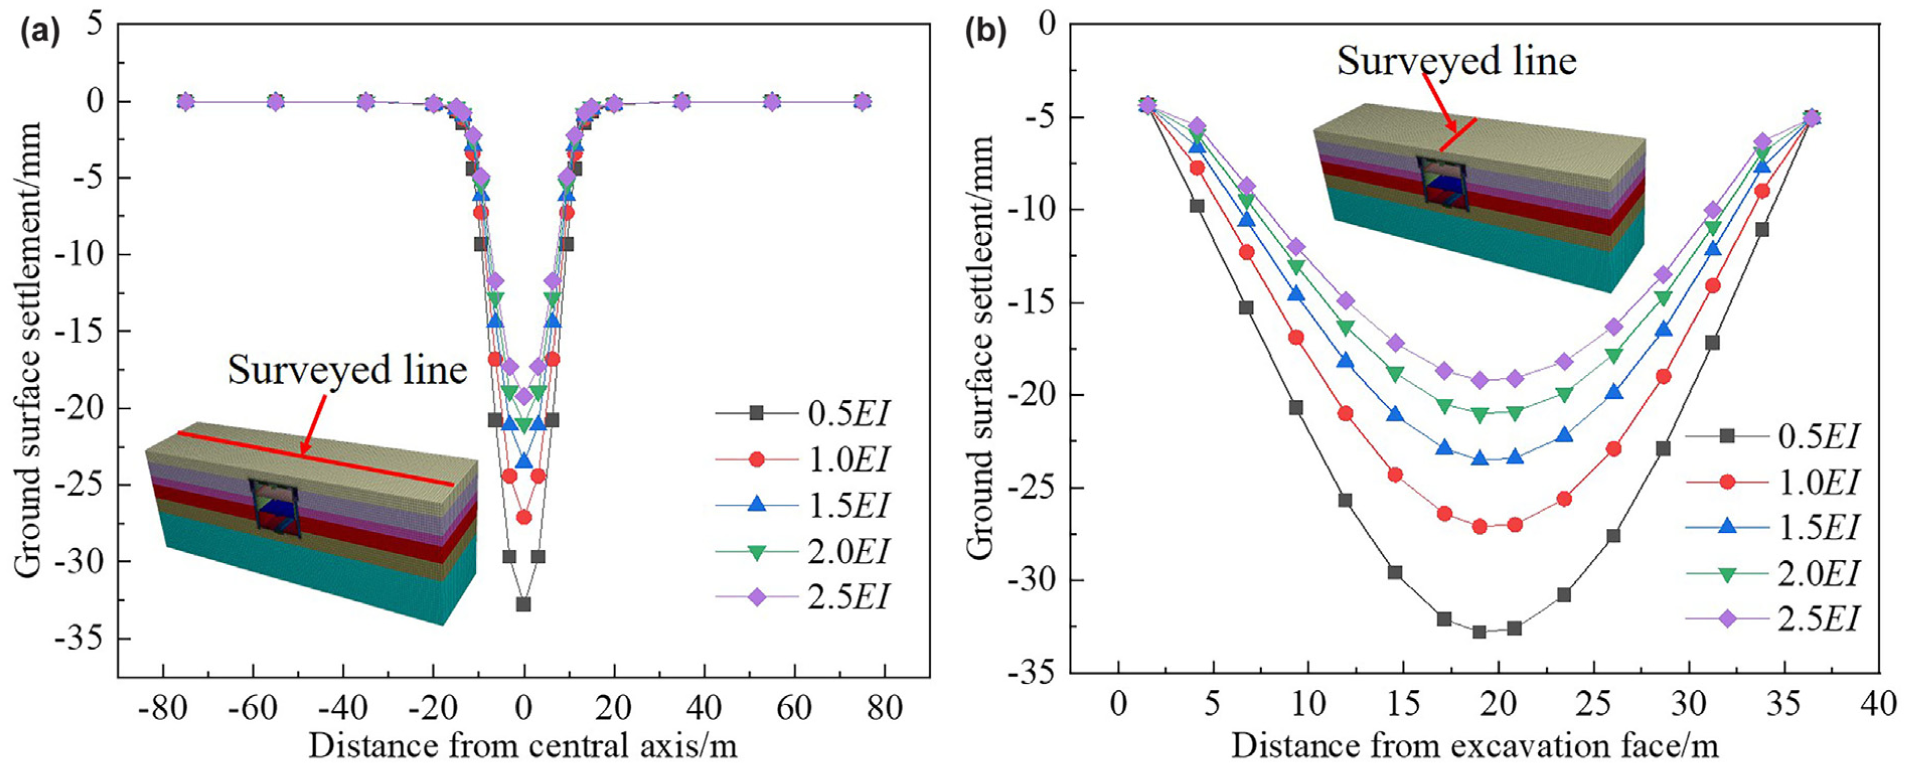
Transverse and longitudinal surface settlement curves for different pipe-roof stiffnesses: (a) transverse ground surface settlement curve and (b) longitudinal ground surface settlement curve.
As shown in Figure 8b, for longitudinal surface settlement, the surface settlement decreases continuously as the pipe-roof stiffness increases. When the pipe-roof stiffness increases from 0.5EI to 2.5EI, the maximum surface settlement at mid-span decreases by 41.40%, indicating a significant influence of pipe-roof stiffness on surface settlement. However, the reduction rate of the maximum mid-span settlement gradually diminishes, which demonstrates that the effect of pipe-roof stiffness is prominent only within a specific range. The critical value corresponds to the pipe-roof stiffness at which the structural bearing capacity of the pipe-roof is fully utilized.
Roof Slab Modulus
Five numerical models were established to investigate the influence of roof slab modulus (5, 10, 15, 20, and 30 GPa) on surface settlement, with all other parameters fixed to field conditions and pipe-roof stiffness maintained at EI.
Figure 9 illustrates transverse and longitudinal surface settlement profiles under varying modulus values. Both transverse and longitudinal settlements exhibit similar trends to those observed with pipe-roof stiffness: increasing modulus reduces peak settlement magnitudes but causes no significant alteration in the disturbance zones adjacent to the station. This implies that enhanced modulus primarily reduces settlement magnitudes without reshaping the settlement curve. When the modulus increases from 5 to 30 GPa, the maximum settlement decreases by 17.6%. However, the incremental reduction diminishes as modulus rises: a 20→30 GPa increase yields only a 4.04% reduction (below 5%), indicating that modulus significantly influences peak settlement within the 5–20 GPa range. Beyond 20 GPa, further modulus increases provide marginal benefits, suggesting full utilization of the roof slab’s load-bearing capacity.
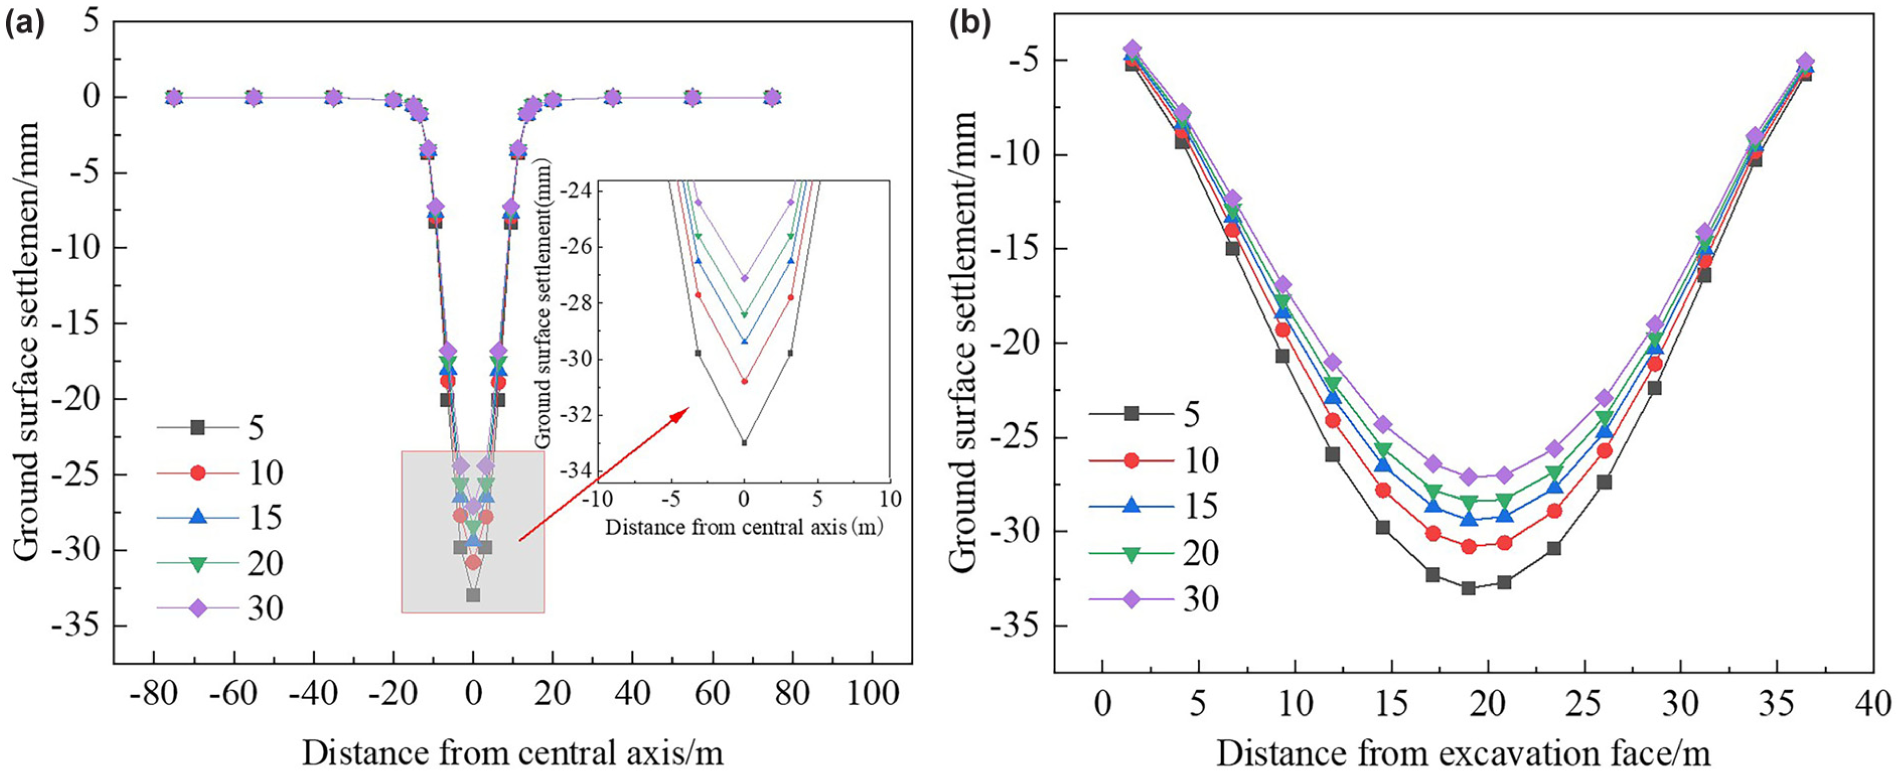
Transverse and longitudinal surface settlement curves under different elastic modulus of concrete slab: (a) transverse ground surface settlement curve and (b) longitudinal ground surface settlement curve.
Roof Slab Spacing
Identifying optimal roof slab spacing is critical for controlling surface settlement during metro station construction. To investigate its influence, five numerical models with slab spacings of 12, 18, 24, 30, and 38 m were analyzed, maintaining consistent parameters across all models. Figure 10 displays transverse and longitudinal surface settlement profiles under varying slab spacings. As the spacing increases, the maximum settlement escalates significantly: a 12→38 m increase raises peak settlement by 42.0%. Settlement profiles consistently follow Gaussian distributions, with peak values occurring at the span center. Notably, increased spacing predominantly amplifies settlement in the central station area while exerting negligible effects on lateral soil disturbance zones. These results demonstrate that slab spacing primarily governs settlement magnitudes rather than altering the overall settlement pattern.
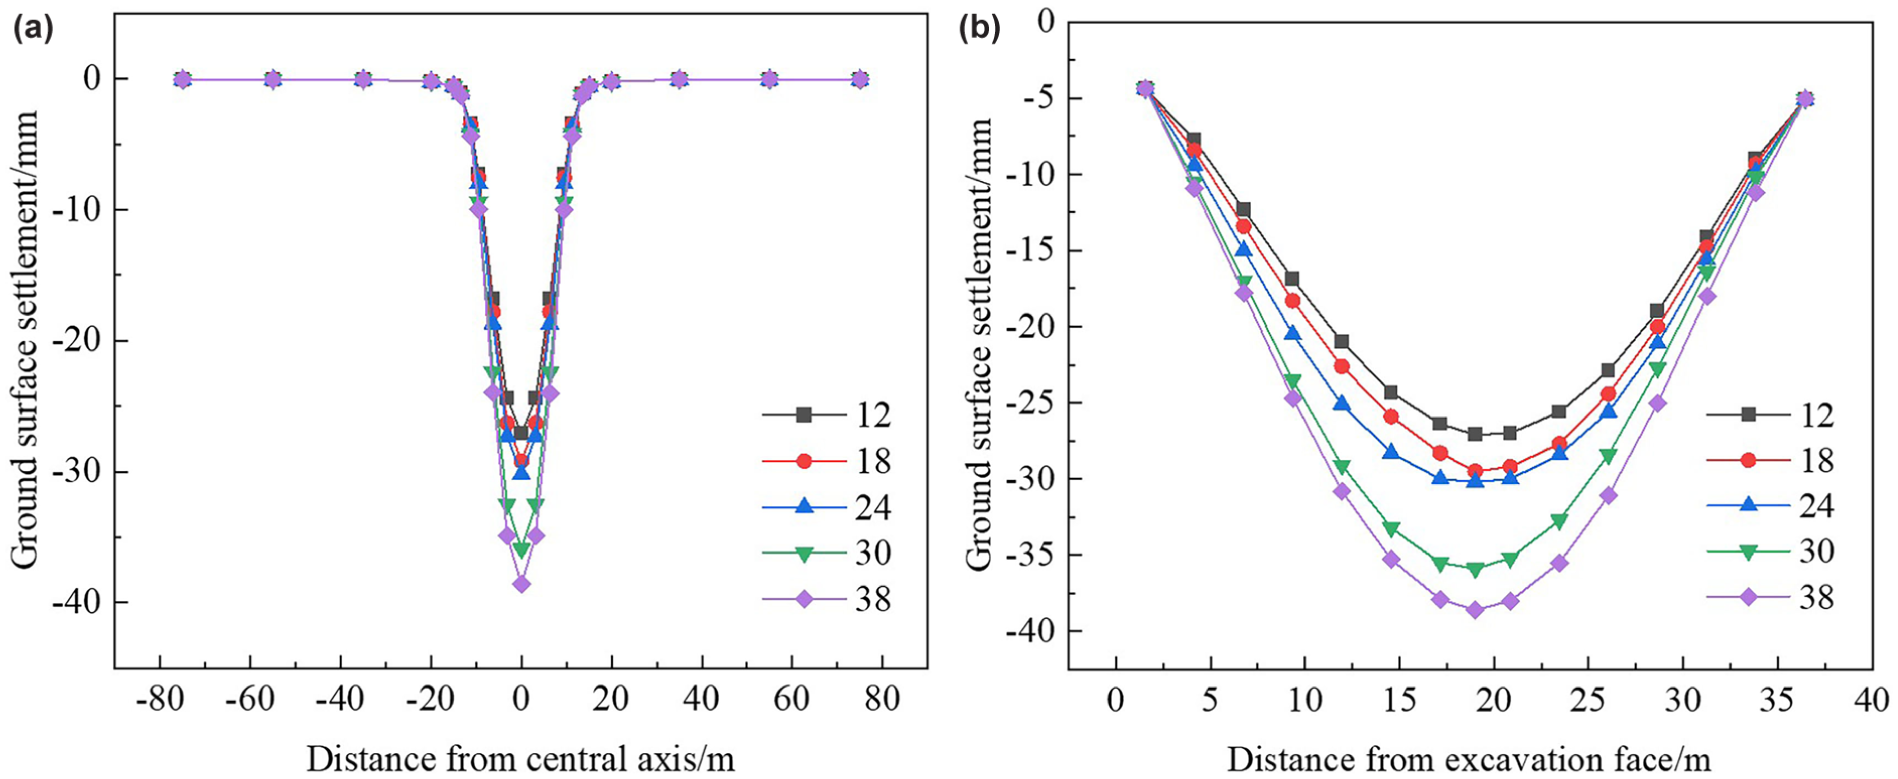
Transverse and longitudinal surface settlement curves at different roof slab spacings: (a) transverse ground surface settlement curve and (b) longitudinal ground surface settlement curve.
Roof Slab Thickness
To investigate the influence of roof slab thickness on surface settlement, five numerical models with slab thicknesses of 400, 600, 800, 900, and 1,000 mm were analyzed, while keeping other parameters unchanged. Figure 11 presents transverse and longitudinal surface settlement profiles under varying slab thicknesses. Increasing slab thickness significantly reduces maximum settlement: a thickness increase from 400 to 1,000 mm decreases peak settlement by 35.95%. Settlement profiles consistently follow Gaussian distributions, with peak values occurring at the span center. Notably, increased thickness predominantly mitigates settlement in the central station area, while exerting negligible effects on lateral soil disturbance zones. These results demonstrate that slab thickness governs settlement magnitudes without altering the overall settlement pattern.
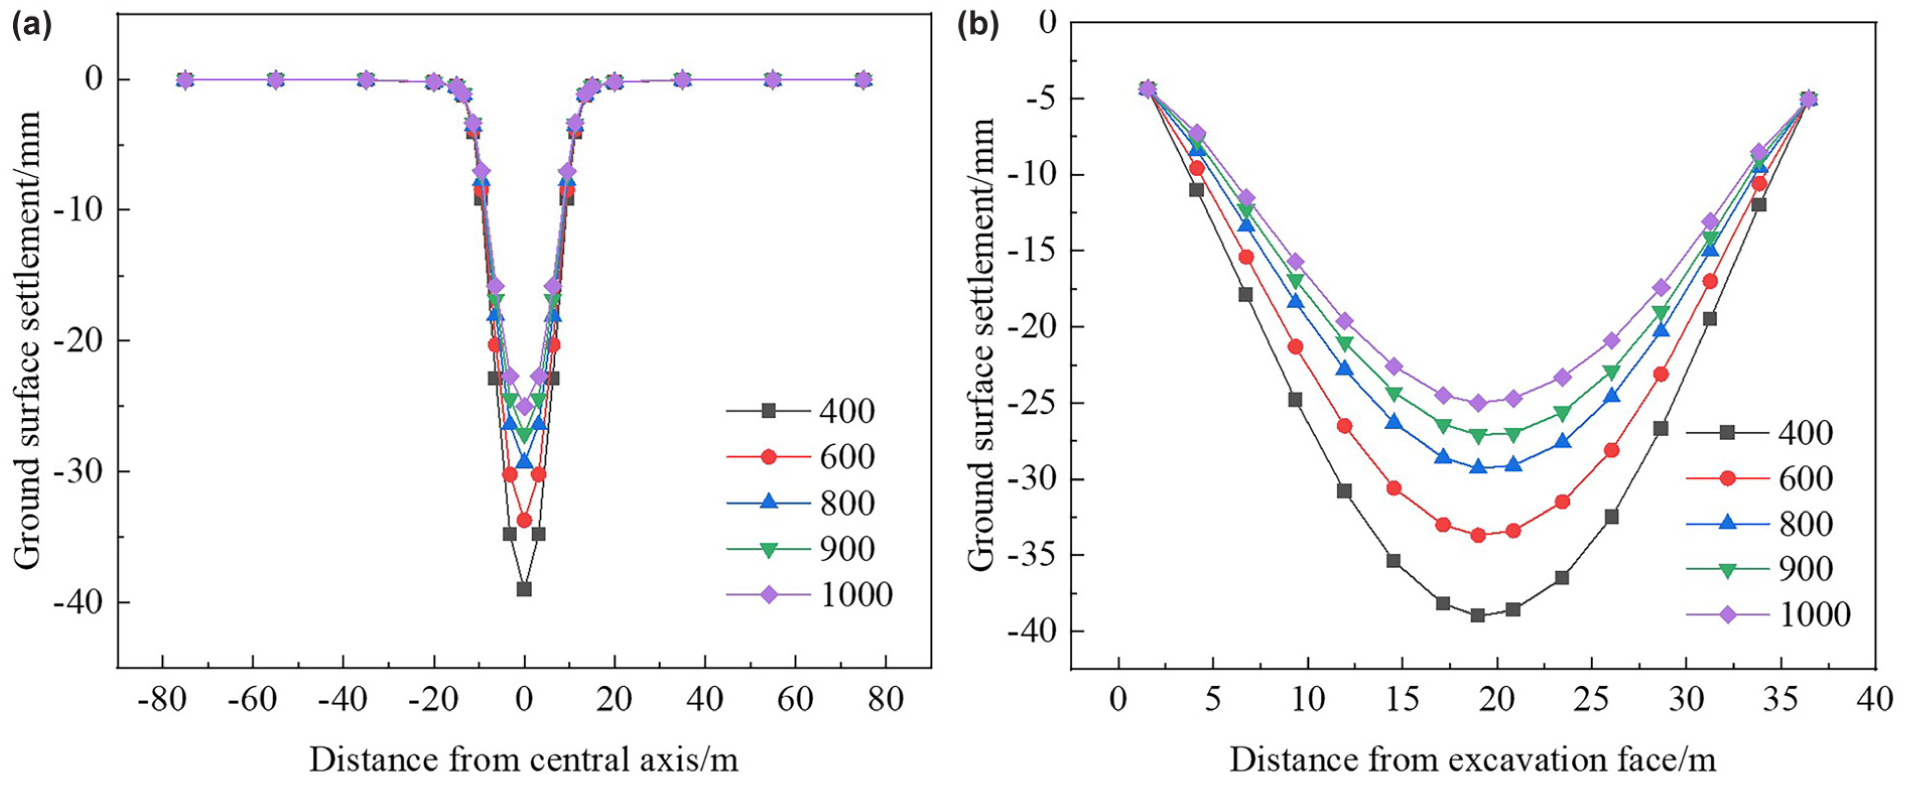
Transverse and longitudinal surface settlement curves for different concrete slab thicknesses: (a) transverse ground surface settlement curve and (b) longitudinal ground surface settlement curve.
Comparative Analysis of Parameter Sensitivity
Based on the settlement results presented in the sections on Pipe-Roof Stiffness, Roof Slab Modulus, Roof Slab Spacing, and Roof Slab Thickness, a comparative analysis was conducted to identify the relative influence of each parameter on surface settlement. Increasing pipe-roof stiffness from 0.5EI to 2.5EI reduced maximum settlement by 41.40%. Increasing roof slab modulus from 5 to 30 GPa reduced settlement by 17.6%. Increasing roof slab spacing from 12 to 38 m increased settlement by 42.0%. Increasing roof slab thickness from 400 to 1,000 mm reduced settlement by 35.95%. These comparisons indicate that pipe-roof stiffness and roof slab thickness are the dominant parameters for settlement control, whereas roof slab modulus has a relatively limited effect. Roof slab spacing, although exhibiting a substantial influence on settlement magnitudes, primarily acts as an adverse factor. This sensitivity ranking provides a basis for the regression analysis in the Parameter Matching for Pipe-Roof and Roof Slab section, where the quantitative relationships between these parameters are further examined.
Parameter Matching for Pipe-Roof and Roof Slab
Model Establishment
Surface settlement is taken as the dependent variable, while pipe-roof stiffness, roof slab modulus, roof slab spacing, and roof slab thickness are considered independent variables. A multiple linear regression model is used to establish the coupling relationship between pipe-roof stiffness and concrete roof slab parameters, thereby determining the rational selection of concrete roof slab parameters under different pipe-roof stiffness values.
Although the single-factor analysis indicated potential nonlinear trends between certain structural parameters and surface settlement, a multiple linear regression model was selected for parameter matching in this study. The brief justification for this approach is twofold: 1) within the specific practical ranges of parameters evaluated, the relationships can be reasonably approximated as linear without significant loss of accuracy, and 2) the linear model provides a straightforward, highly practical tool for on-site engineers to quickly calculate parameter matching without requiring complex nonlinear iterations. While the inability to capture complex nonlinear boundary behaviors remains a limitation of this approach, its reliability and predictive accuracy will be verified through subsequent statistical tests.
The general form of the multiple linear regression model is as follows:

where
y i = the dependent variable,
x ij = the value of the j-th independent variable for the i-th observation,
u i = the random error term (residual, defined as the difference between measured and estimated values), and
β i (i = 0, 1, 2,…, k − 1) = the regression coefficients.
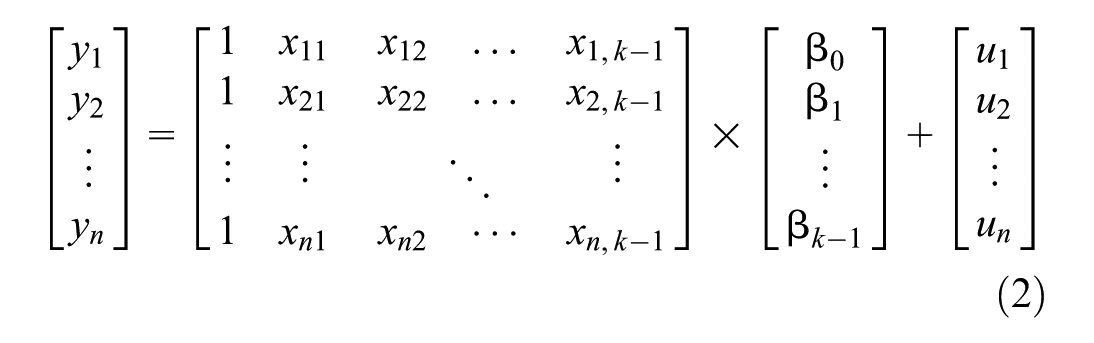
By setting x 0 = 1, the matrix form of the population regression model can be written as:

Parameter Estimation
Ordinary least squares are employed to estimate the regression model parameters. The principle involves minimizing the sum of squared residuals (SSR), where smaller SSR values indicate better model fit. The matrix-form equation for calculating SSR is:
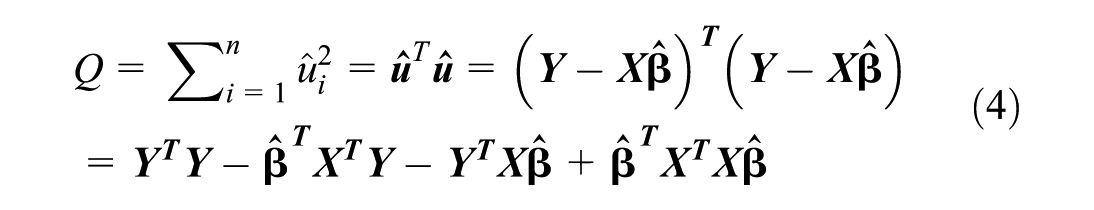
By deriving partial derivatives of the matrix equation to identify extremum points, the closed-form solution minimizing SSR is obtained as:

To derive the multiple linear regression equation, 25 sets of orthogonal experiments were designed and computed. The orthogonal test factors include pipe-roof stiffness, roof slab modulus, roof slab spacing, and roof slab thickness, with five levels each. The orthogonal experimental design and computational results are summarized in Table 2. During regression model parameter calculation, 80% of the data (20 sets) were randomly selected for model fitting, while the remaining 20% (5 sets) were reserved for testing.
Table of Orthogonal Tests
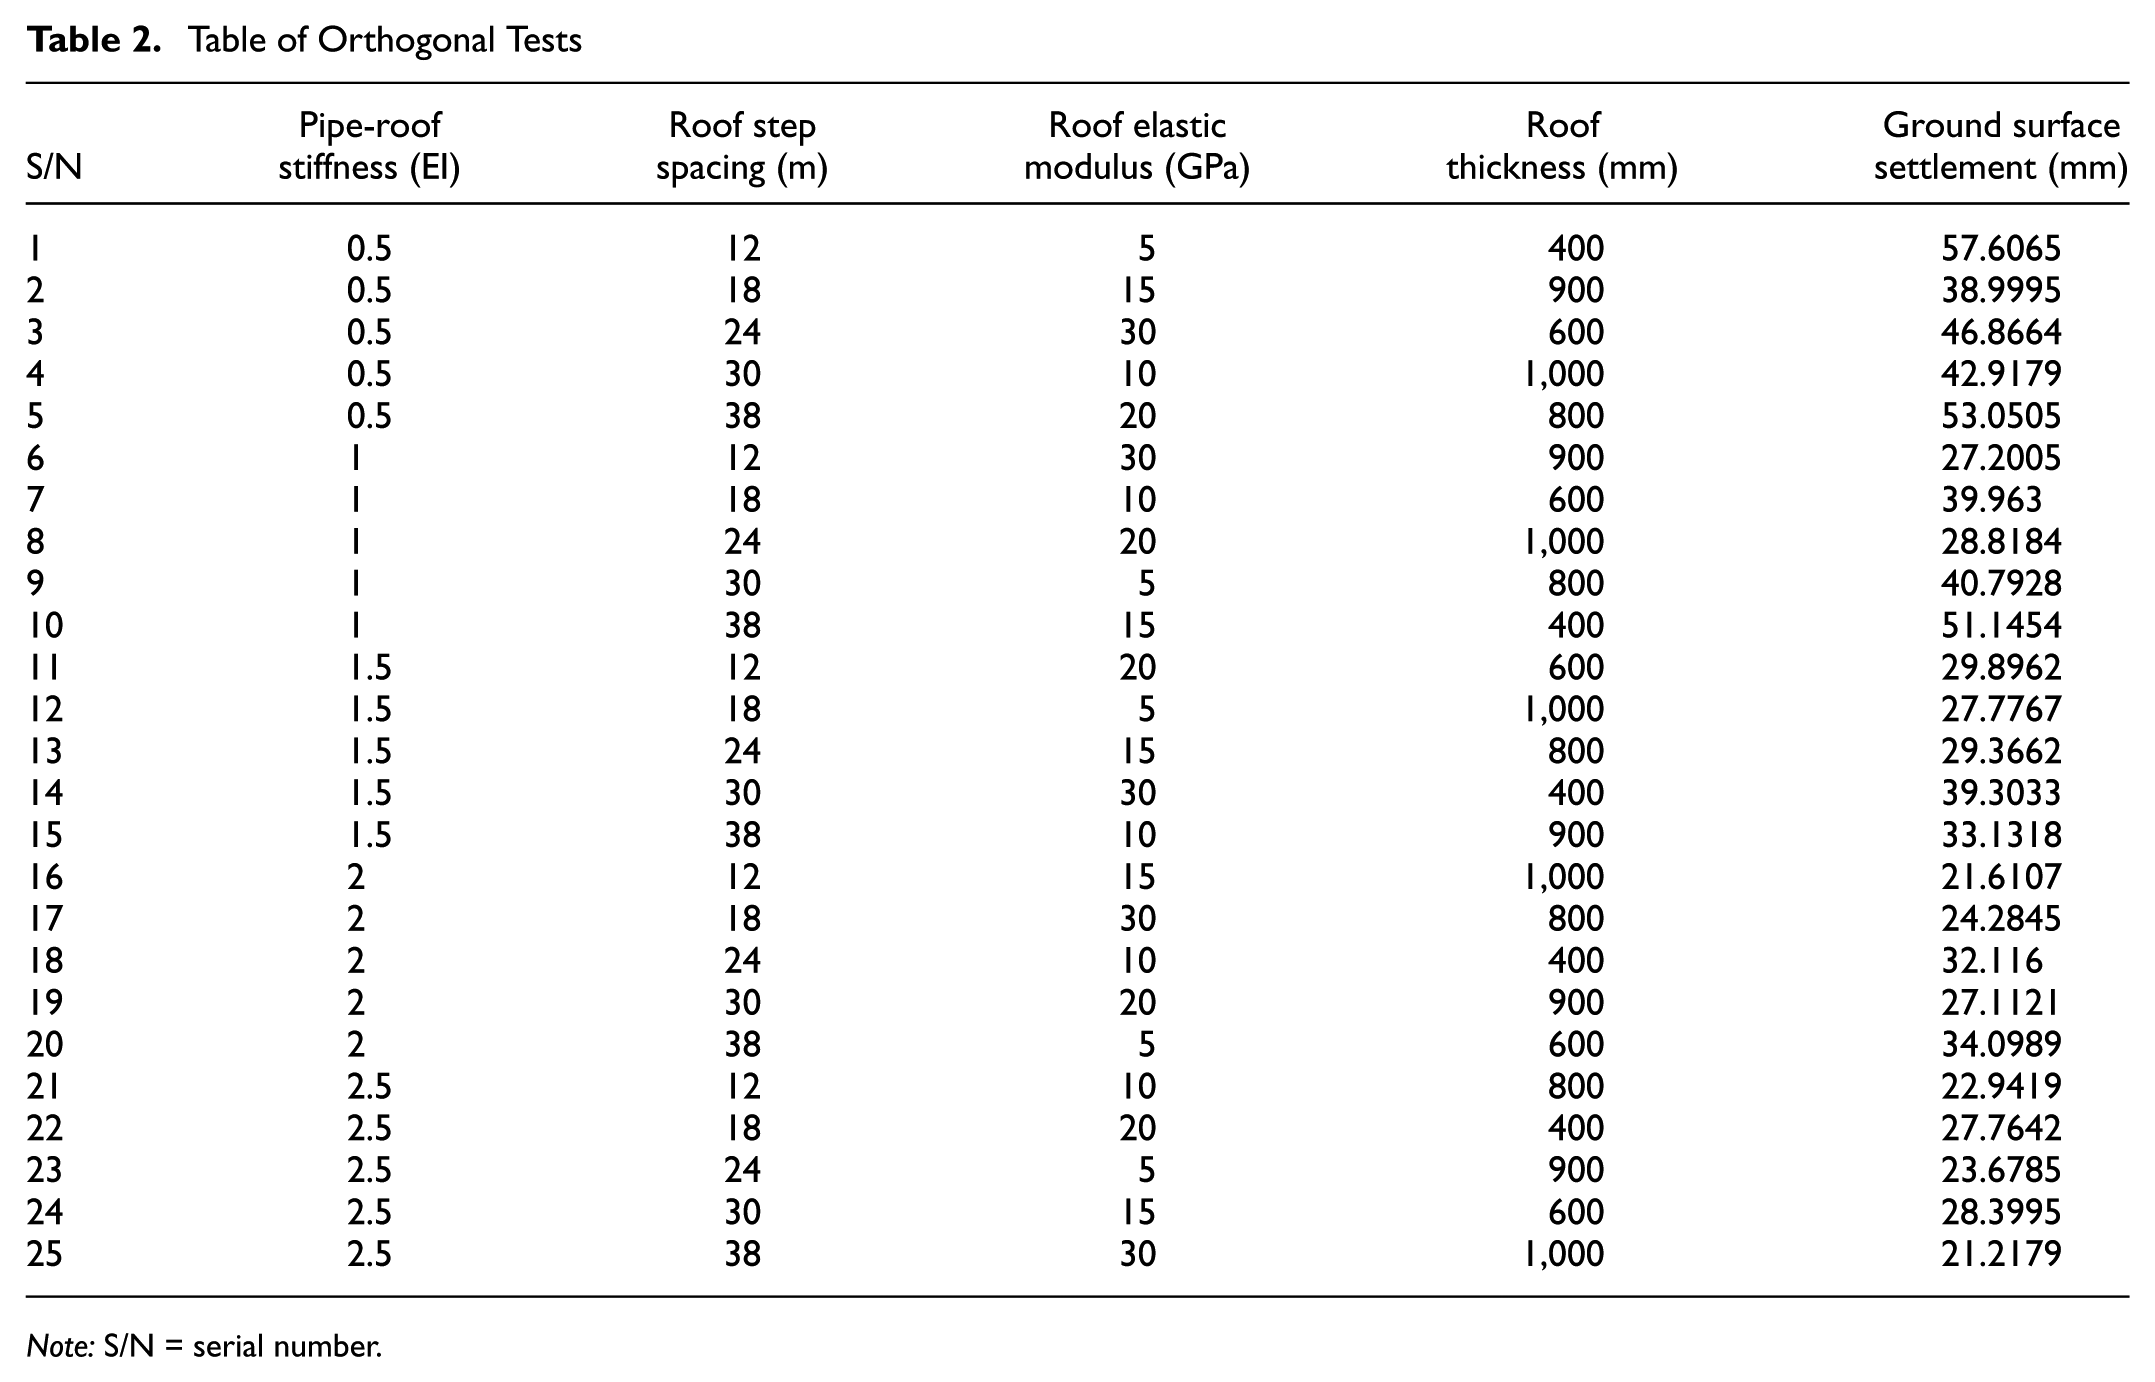
Note: S/N = serial number.
Using the 20 fitting samples, the following results are obtained:

Therefore, the sample regression model, which captures the relationship between pipe-roof stiffness and roof slab parameters, is expressed as follows:
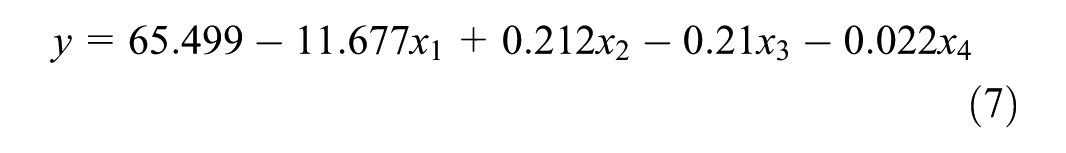
where
x 1 = pipe-roof stiffness,
x 2 = roof slab spacing,
x 3 = roof slab modulus, and
x 4 = roof slab thickness,
Statistical Tests
Goodness-of-Fit Test
The goodness-of-fit of the multiple linear regression model was evaluated using the adjusted coefficient of determination R2. The calculated adjusted R2 is 0.886, indicating that the model explains 88.6% of the variance in surface settlement and thus exhibits a good overall fit. For multivariate models, the adjusted coefficient of multiple determination R2 is adopted, as expressed below:

where
TSS = total sum of squares, and
ESS = residual sum of squares.
Significance Test
To assess the statistical significance of the linear relationship between independent and dependent variables in the model, a significance test must be conducted. This test involves formulating a statistical hypothesis, which is then evaluated for validity using sample data.
Overall Model Significance Test (F-test)
The F-test is employed to assess the overall significance of the model, calculated as:

where
MSR = regression mean square, and
MSE = error mean square.
In most research contexts, a significance level α = 0.05 is widely accepted as the threshold for statistical significance. Thus, α = 0.05 is adopted for the F-test in this study. Given n = 20 (sample size) and k = 5 (number of parameters), the critical F-value is defined as:
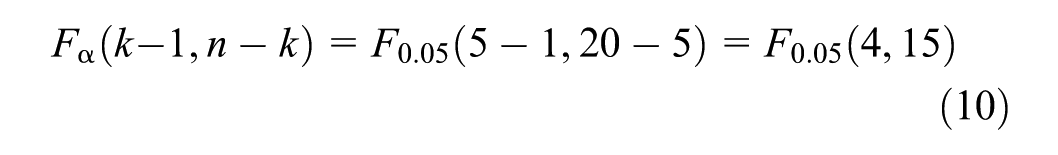
The calculated F-statistic from Equation 10 is 38.05, which exceeds the critical value of 1.75. This confirms that the linear relationship between the independent and dependent variables is statistically significant.
Individual Variable Significance (t-test)
The t-test evaluates the significance of individual variables, calculated as:
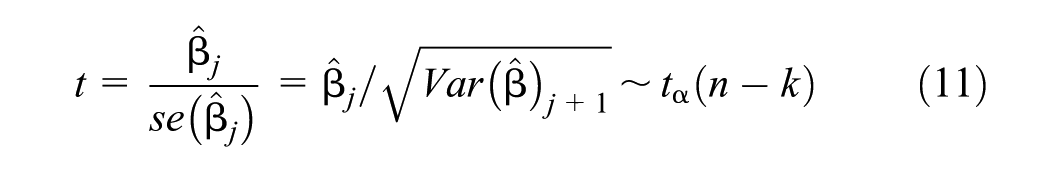
The t-distribution table gives maxt0.05(15) = 1.753. The t-values corresponding to pipe canopy stiffness (t 1 ), roof step distance (t 2 ), roof elastic modulus (t 3 ), and roof thickness (t 4 ) calculated from Equation 11 are −10.38, 2.43, −1.95 and −5.88, respectively. All absolute values exceed 1.75, satisfying the t-test requirements. This confirms that none of the model parameters equals zero, demonstrating significant linear relationships between each independent variable and the dependent variable individually.
Multicollinearity Test
Multicollinearity among the independent variables was evaluated by the variance inflation factor (VIF). The VIF values for the four variables are 1.05, 1.04, 1.02, and 1.03, all well below the threshold of 10, confirming no significant multicollinearity and, thus, stable parameter estimates. In linear regression, the VIF value for the i-th explanatory variable is expressed as:

where
R i 2 = the coefficient of multiple determination obtained by regressing the i-th independent variable against the remaining k − 2 independent variables.
A higher VIF value indicates stronger correlations between parameters, serving as a metric to assess the severity of multicollinearity. A VIF ≥ 10 signifies multicollinearity among independent variables, and severe multicollinearity implies model distortion because of unstable parameter estimates.
In conclusion, the established multiple linear regression model is reasonable, effective, and accurate, with stable parameters and standard errors within acceptable ranges.
Goodness-of-Fit Validation
Figure 12 illustrates the goodness-of-fit plot. The results demonstrate that the multiple linear regression model achieves satisfactory overall data fitting. Notably, three datasets exhibit relatively large errors: Group 1 (error: 5.25 mm), Group 5 (error: 7.13 mm), and Group 25 (error: 5.16 mm). However, the mean error of 8.21% remains within an acceptable margin, validating the model’s rationality. These findings confirm the linear relationship between surface settlement and pipe-roof stiffness, roof slab spacing, roof slab modulus, and roof slab thickness. The regression model demonstrates strong predictive capability for estimated values, providing practical guidance for engineering construction.
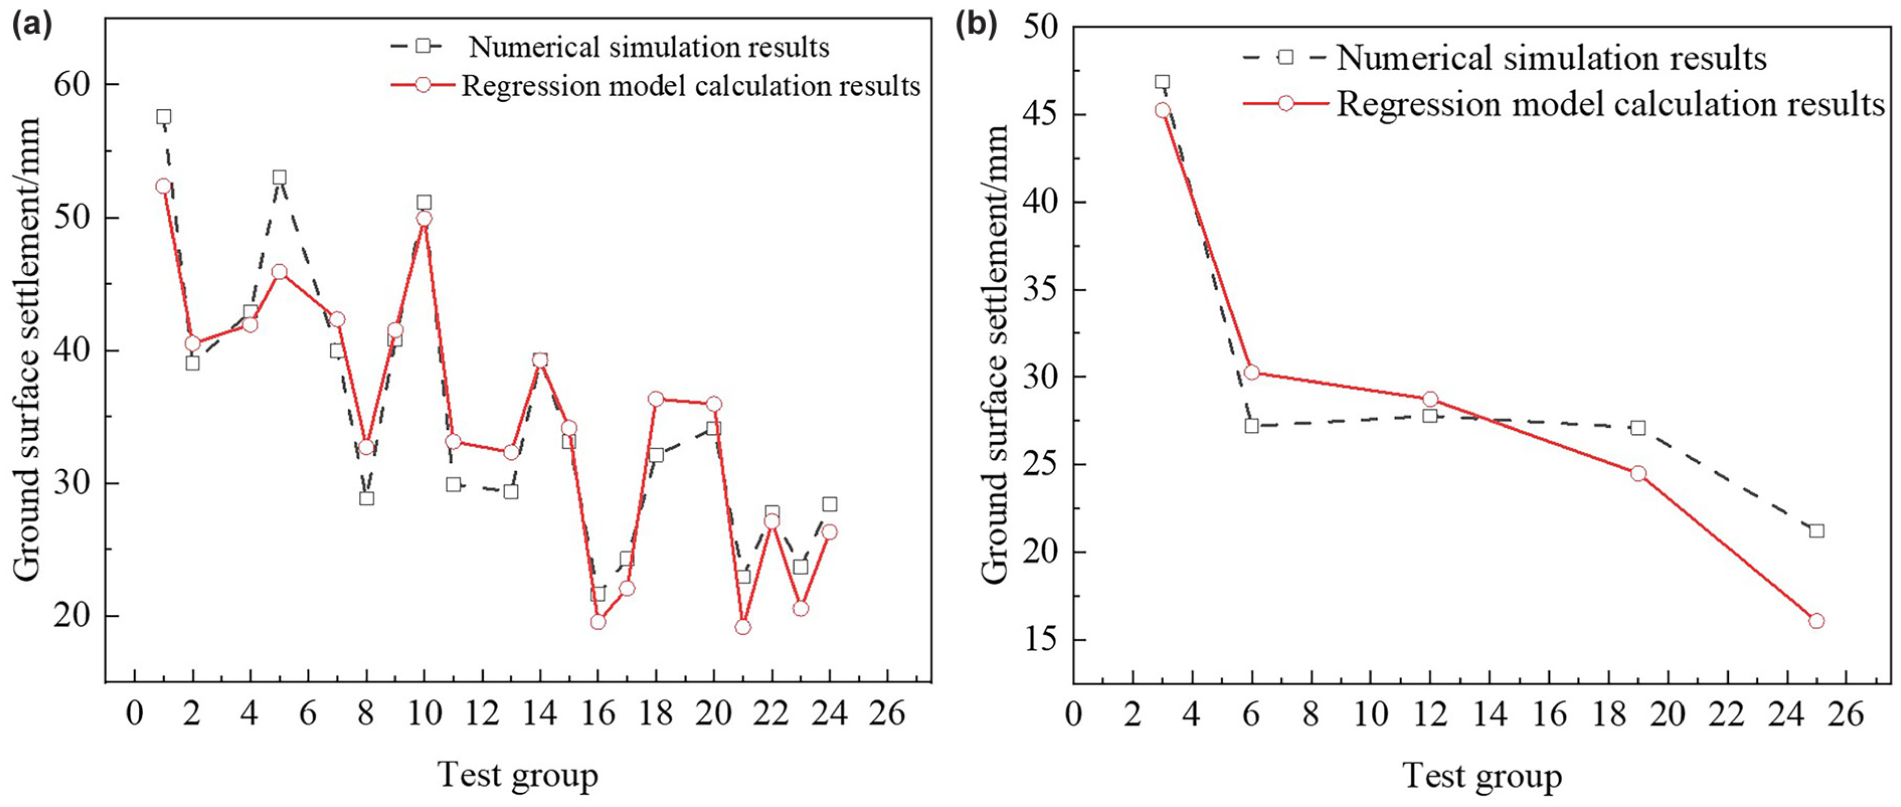
The effect of fitting: (a) fitting group fitting results and (b) testing group fitting results.
Matching Relationship Between Pipe-Roof Stiffness and Roof Slab Parameters
Analysis of Parameter Influence Magnitude
During construction, with the constraint of maintaining surface settlement below 30 mm, the relationship between the remaining two roof slab parameters can be determined by fixing pipe-roof stiffness and one roof slab parameter, thereby guiding parameter selection. Priority should be given to identifying the most influential factor on surface settlement to ensure rational parameter selection. This study employs the statistical software SPSS to evaluate the relative impact of roof slab parameters on surface settlement ( 26 ).
Standardized coefficients are calculated to eliminate the effects of differing dimensional units among independent variables. The 20 sample datasets are processed through the software’s linear regression module, with results summarized in Table 3.
Standardized Coefficients
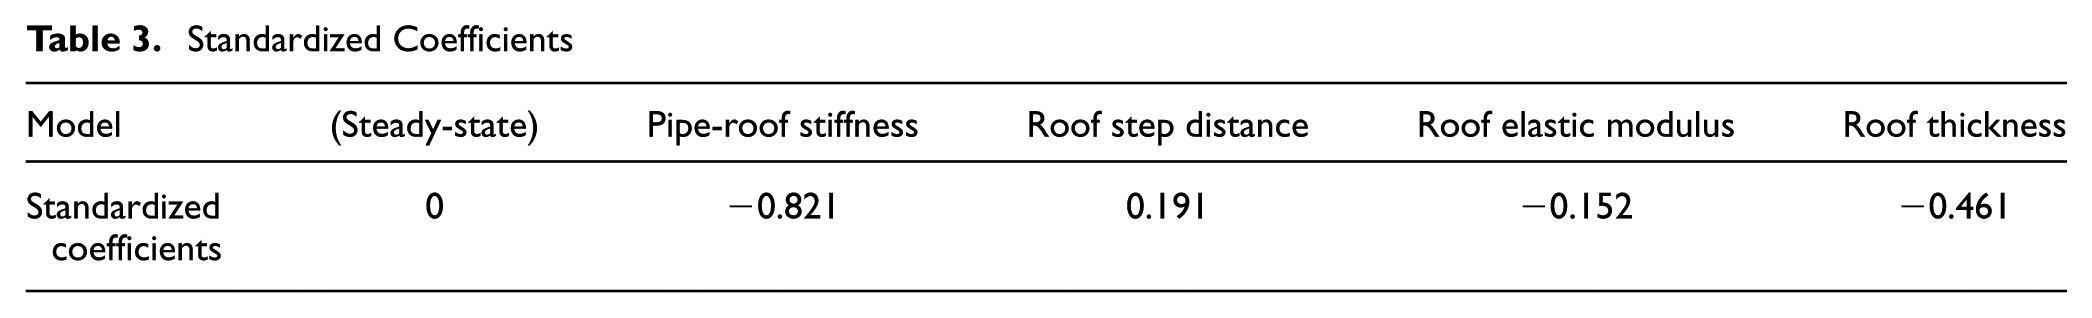
A larger absolute value of the standardized coefficient indicates a stronger influence of the independent variable on the dependent variable. As shown in Table 3, the standardized coefficient for pipe-roof stiffness is 0.82—the highest among all independent variables—demonstrating its dominant impact on surface settlement. The absolute standardized coefficient for roof slab thickness (0.46) ranks highest among the three roof slab parameters, indicating its greater influence on settlement than roof slab spacing and modulus. Therefore, when pipe-roof stiffness is fixed, roof slab thickness should be prioritized for determination, followed by the remaining two parameters via the linear regression model, ensuring rational selection of roof slab structural parameters.
Parameter Matching Reference Curves
Based on the preceding research and in accordance with the Code for Design of Metro (GB 50157-2013) and the Specifications for Operational Monitoring of Urban Rail Transit Facilities—Part 3: Tunnel (GB 50911-2013), surface settlement control standards for Heping South Street Station are defined as follows ( 23 , 27 ):
Level I control standard: maximum allowable settlement of 30 mm
Level II control standard: settlement threshold at 85% of the maximum allowable value (25.5 mm)
Level III control standard: settlement threshold at 70% of the maximum allowable value (21 mm)
Figure 13 provide rational parameter selection guidelines for pipe-roof stiffness and concrete slab parameters under a roof slab modulus of 30 GPa, corresponding to the above control standards.
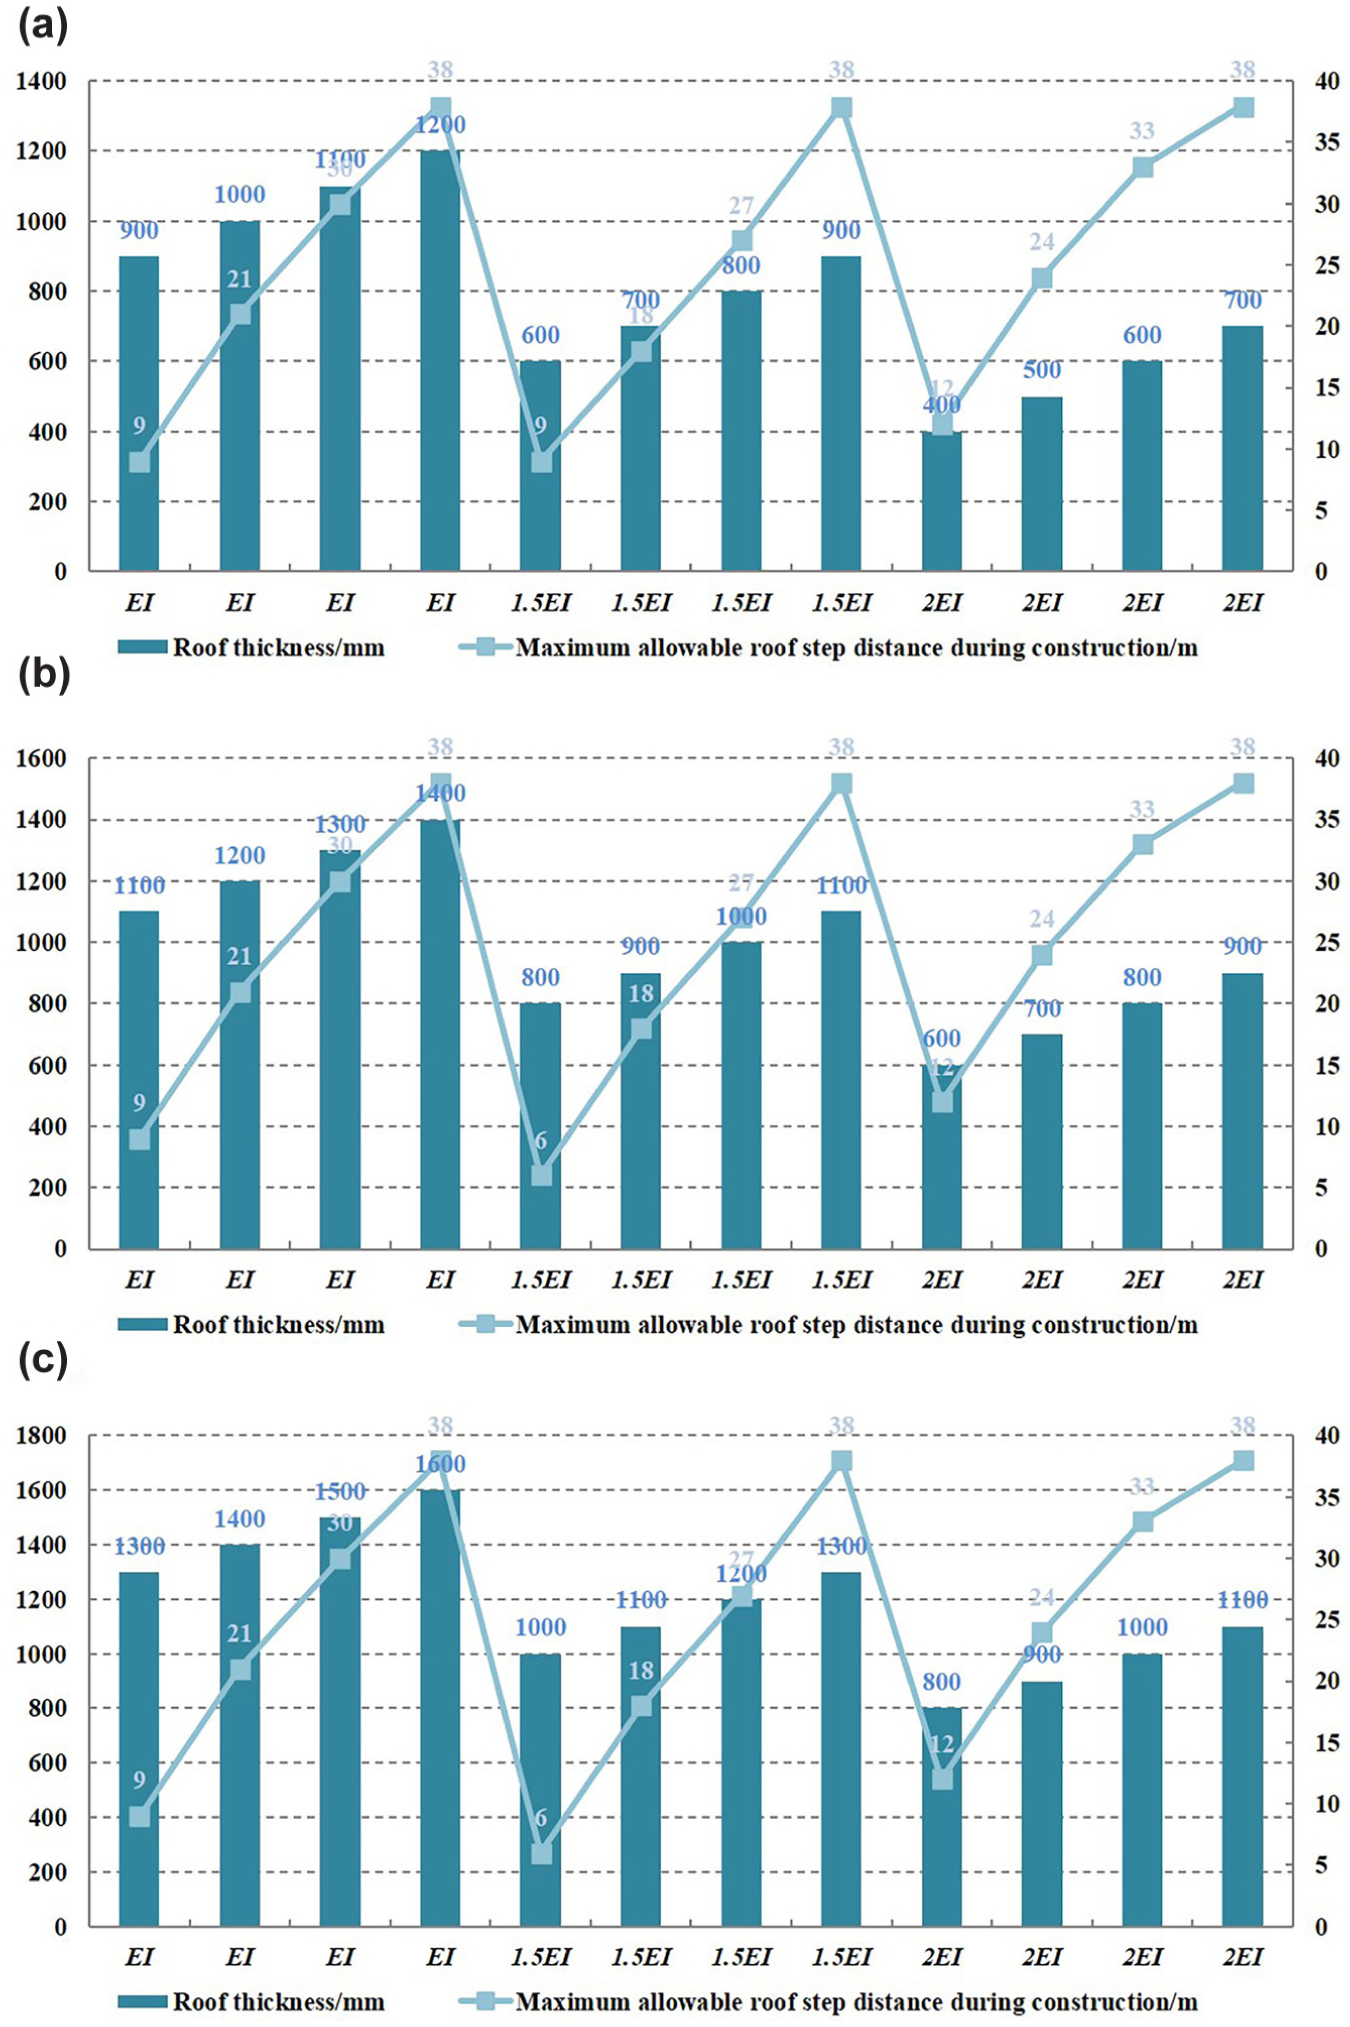
Rational parameters for pipe-roof-concrete slab for different controls: (a) Level I control standard (30 mm), (b) Level II control standard (25.5 mm), and (c) Level III control standard (21 mm).
Conclusions and Discussion
Conclusions
This paper presents the application of an innovative adaptation of the pipe-roof method—the PRCS method—in metro station construction. Numerical simulations were conducted to investigate the influence of pipe-roof stiffness and concrete roof slab parameters on surface settlement. A multiple linear regression model was developed to establish matching relationships between pipe-roof stiffness and concrete roof slab parameters. Practical design tables for pipe-roof and concrete slab parameters were provided to meet surface settlement control thresholds, based on engineering specifications. The numerical analyses and findings presented in this paper are predicated on site conditions following comprehensive pre-construction dewatering, simulating construction in a stable, groundwater-dry environment. The following conclusions were drawn:
1) PRCS is an effective and reliable construction technique for metro stations, achieving a maximum surface settlement of 27.1 mm during construction. It demonstrates favorable performance in controlling surface settlement under shallow overburden conditions.
2) Pipe-roof stiffness, roof slab modulus, roof slab spacing, and roof slab thickness all exhibit significant impacts on surface settlement. Among these factors, pipe-roof stiffness exerts the most substantial influence, followed by roof slab thickness.
3) When pipe-roof stiffness increases from 0.5EI to 2.5EI, the maximum mid-span surface settlement decreases by 41.40%. A rise in roof slab modulus from 5 to 30 GPa reduces the maximum settlement by 17.6%. Conversely, increasing roof slab spacing from 12 to 38 m elevates the maximum settlement by 42.0%. Increasing roof slab thickness from 400 to 1,000 mm decreases the maximum settlement by 35.95%.
4) A functional relationship between pipe-roof stiffness and concrete roof slab parameters has been established. The model indicates that, when roof slab parameters remain constant, each EI increase in pipe-roof stiffness reduces surface settlement by 11.68 mm; when pipe-roof stiffness, roof slab modulus, and thickness are fixed, each 1 m increase in roof slab spacing increases surface settlement by 0.21 mm; when pipe-roof stiffness, roof slab spacing, and thickness are fixed, each 1 GPa increase in roof slab modulus reduces surface settlement by 0.21 mm; and when pipe-roof stiffness, roof slab spacing, and modulus are fixed, each 100 mm increase in roof slab thickness reduces surface settlement by 2.20 mm.
5) Design tables for rational parameter selection under varying pipe-roof stiffness values have been provided. For a roof slab modulus of 30 GPa under Level I control standards (30 mm), the minimum required roof slab thickness is 900 mm with a maximum allowable slab spacing of 9 m when pipe-roof stiffness is EI; the minimum thickness reduces to 600 mm with a maximum allowable spacing of 9 m at 1.5EI pipe-roof stiffness; and at 2EI pipe-roof stiffness, the minimum thickness further decreases to 400 mm with a maximum allowable spacing of 12 m.
Discussion
The findings of this study offer practical guidance for engineering design. The identified sensitivity ranking (pipe-roof stiffness > roof slab thickness > slab spacing > slab modulus) provides clear direction for settlement control optimization. The parameter matching charts (Figure 13) serve as practical design aids, enabling efficient selection of slab parameters under varying pipe-roof stiffness to meet specific control standards. The successful application at Heping South Street Station, achieving only 27.1 mm maximum settlement, validates the real-world viability of the PRCS method. Despite these valuable contributions, several limitations of this study should be acknowledged.
1) The successful application of the PRCS method requires effective pre-dewatering. In urban environments, where dewatering may affect adjacent structures and utilities, a comprehensive evaluation of groundwater conditions and potential dewatering effects should be conducted before construction. Additionally, to simplify the numerical analysis, this study omitted the initial pipe-jacking phase and dynamic groundwater seepage effects. In practice, pipe-jacking inevitably causes ground loss and soil disturbance, and groundwater variations can dynamically influence settlement behavior. Therefore, omitting these factors represents a limitation of the current model. Future studies should incorporate the coupled effects of pipe-jacking and groundwater seepage to more comprehensively simulate the construction process and predict surface settlement.
2) The numerical model assumes homogeneous soil layers, which may not fully capture the complexity of heterogeneous geological conditions encountered in practice. While this simplification was appropriate for the specific site conditions, caution should be exercised when applying the findings to sites with significant geological variability.
3) The parametric study focused on four key structural parameters, while other potentially influential factors, such as pipe diameter, grouting quality, and construction speed, remain unexplored. Further investigation incorporating these variables would enhance the generalizability of the findings.
Footnotes
Acknowledgements
The authors thank the three anonymous reviewers for their excellent feedback.
Author Contributions
The authors confirm contribution to the paper as follows: study conception and design: W. Zhao, B. Lu; data collection: X. Zhou, B. Lu, X. Du, X. Sun; analysis and interpretation of results: B. Ding, B. Lu, J. Qiu; draft manuscript preparation: B. Ding, B. Lu. All authors reviewed the results and approved the final version of the manuscript.
Declaration of Conflicting Interests
The authors declared no potential conflicts of interest with respect to the research, authorship, and/or publication of this article.
Funding
The authors disclosed receipt of the following financial support for the research, authorship, and/or publication of this article: The research described in this paper was supported by the National Natural Science Foundation of China (Grant No. 52508436), the Postdoctoral Fellowship Program of CPSF (Grant No. GZB20250452), the Doctoral Start-up Foundation of Liaoning Province (Grant No. 2025-BS-0105), and the Fundamental Research Funds for the Central Universities (Grant No. N25XQD016).
Data Accessibility Statement
The datasets used during the current study are available from the corresponding author on reasonable request.