
Abstract
This study evaluated the Federal Aviation Administration’s (FAA) pavement design methodology using empirical pavement condition data collected from 179 commercial service airports across the United States. Pavement condition index (PCI) and structural condition index (SCI) values were computed using FAA PAVEAIR software for over 10,000 runway and taxiway sections, including Portland cement concrete (PCC), asphalt concrete, asphalt over asphalt concrete, and asphalt over PCC surfaces. Pavement age was determined based on inspection, construction, and maintenance history. Filtered data were used to assess performance trends by surface type and validate theoretical deterioration models. Results showed that the bilinear SCI model for rigid pavements closely matched observed data, with an inflection point of nearly 24 years. However, measured SCI data before the inflection point indicated some deterioration, challenging the design assumption of no damage before the inflection point. Flexible pavements deteriorated faster than rigid pavements, with a majority of distresses being environment-related including longitudinal and transverse cracking, joint reflection cracking, weathering, and raveling. The average age at rehabilitation was 15–18 years for flexible pavements and 32 years for rigid pavements, with PCI values typically between 61 and 67 at the time of rehabilitation. The findings confirm the general validity of existing design models but also highlight embedded conservatism, particularly in rigid pavement design. The results suggest that the FAA’s initiative to extend airport pavement design life to 40 years must consider environmental-related distresses and include planning for rehabilitations over the service life.
Introduction
Airport pavement design is the process of selecting an appropriate pavement thickness for a given set of traffic conditions and pavement materials. Another way to view this process is simply as a forecast of how pavement conditions will deteriorate over time. In any airport pavement design, the objective is to design a structure that will remain serviceable for its intended lifespan. For the Federal Aviation Administration (FAA), the design life is typically 20 years for newly constructed pavements as specified in Advisory Circular (AC) 150/5320-6G ( 1 ). For this, the pavement design incorporates assumptions about anticipated future aircraft traffic and the types of construction materials using the FAA standard software, FAARFIELD. FAARFIELD uses these inputs along with mechanistic-empirical analysis to determine a pavement thickness that will provide adequate structural capacity over the design life.
FAARFIELD determines the pavement thickness using a set of failure models which define the structural deterioration of airport pavements. These models were primarily developed through controlled accelerated pavement testing conducted at the FAA’s National Airport Pavement Test Facility and the US Army Corps of Engineers Waterways Experiment Station. Accelerated pavement testing has the benefit of simulating years of traffic within a short time, under tightly controlled conditions. Often, these experiments also include instrumentation and additional characterization testing to better measure structural deterioration of airport pavements. However, given their controlled nature, these experiments cannot fully capture the variability inherent in real-world airports, including changes in traffic loads, pavement maintenance, different climate regions, and construction variabilities. As a result, there is a recurring need to compare the failure models developed from accelerated pavement testing with pavement performance data from real airports. Data collection at in-service airports, however, is not trivial or feasible in most cases. Characterization testing would require longer delays, instrumentation requires a physical data collection system located near runway or taxiway safety areas, and changes in traffic would require regular monitoring of aircraft movement data. These limitations are further realized when trying to capture data over the entire 20-year operational life of the pavement.
Although detailed data on in-service airport pavements is limited, pavement condition data are regularly monitored at each airport that receives federal funding. In parallel with design standards, FAA AC 150/5380-7B ( 2 ) requires all commercial airports receiving federal funding to “perform a detailed inspection of airfield pavements at least once a year” (expanded to at least once every three years when following ASTM D5340) to maintain an airport pavement management plan. Often, this is accomplished using the pavement condition index (PCI), a standardized metric developed by Shahin et al. ( 3 ) in 1977 and later formalized in ASTM D5340 ( 4 ). PCI relies on visual inspection of a sample of the pavement, where pavement distresses are identified and measured. All distresses are aggregated into a final PCI rating that provides a high-level assessment of the pavement condition. Given the frequency at which pavements are inspected, the PCI data provides an opportunity to evaluate deterioration of pavement conditions over time.
Previous research using PCI data for evaluation of airport pavement design models was completed by Garg et al. ( 5 ), which reviewed pavement condition data from 1996 and earlier. The study distinguished pavement distresses related to traffic (i.e., load-induced) and other factors such as construction defects or the environment. From this, the researchers found that all pavements were structurally sound, with comparable performance when focusing on load-induced distresses (structural distresses). Differences, however, in asphalt and Portland cement concrete (PCC) were observed when considering all distresses, with asphalt pavements having a poorer condition compared with PCC pavements. The authors concluded that factors other than traffic (e.g., material defects, construction variability, or climatic conditions) were the primary cause of poorer performance in asphalt pavements. Since this study, however, an increasing number of airports have collected PCI data; advances in computing have improved. storage, management, and retrieval of PCI data; and more detailed records of maintenance and rehabilitation (M&R) activities are now being maintained. Further, the data in the original study were limited and most of the airport pavements included did not contain historical information on the M&R activities, which are necessary for assessing overall pavement life. Finally, the FAA has the goal of extending pavement life to a 40-year design life rather than the existing 20-year design. Therefore, there is a need to evaluate the current FAA pavement design procedure and failure models, and ensure they are aligned with actual pavement performance using PCI and historical M&R data from operational airports.
Research Goal and Objectives
The goal of this study was to re-evaluate FAA pavement design methodology using pavement condition data collected from operational airports in the United States. Specifically, the primary objective of this study was to compare the expected pavement design life with the realized operational life of airport pavements. A secondary objective of this study was to identify practical insights that could support extending the FAA pavement design life from 20 years to 40 years.
Pavement Condition Data Collection
Pavement condition data were collected for airports in the United States categorized under the National Plan of Integrated Airport Systems (NPIAS) as Commercial Service, Reliever, General Aviation, or non-NPIAS airports. The FAA stored all data collected in a dedicated private database built on the FAA PAVEAIR 3.0 platform. FAA PAVEAIR is a web-based application designed to fulfill the requirements of an airport pavement management system (PMS), as defined in FAA AC 150/5380-7B ( 2 ). For this study, only data from NPIAS commercial service airports were analyzed. In total, the PMS database developed in this study included 2,811 runway sections and 7,762 taxiway sections from 179 airports in the United States. A breakdown of the number of inspections considered in this study for each surface type as defined in Unified Facilities Criteria 3-270-08 ( 6 ) is presented in Figure 1. Further, airport runways are the most critical feature on the airport given the high-speed nature of the operations. Thus, runways are often maintained and repaired earlier than other airport features (e.g., taxiways, aprons) creating a bias in the pavement condition dataset, which is presented in Figure 1b. Although this bias exists, it is believed that both runways and taxiways will deteriorate similarly. Nonetheless, the impact of airport feature will be compared.
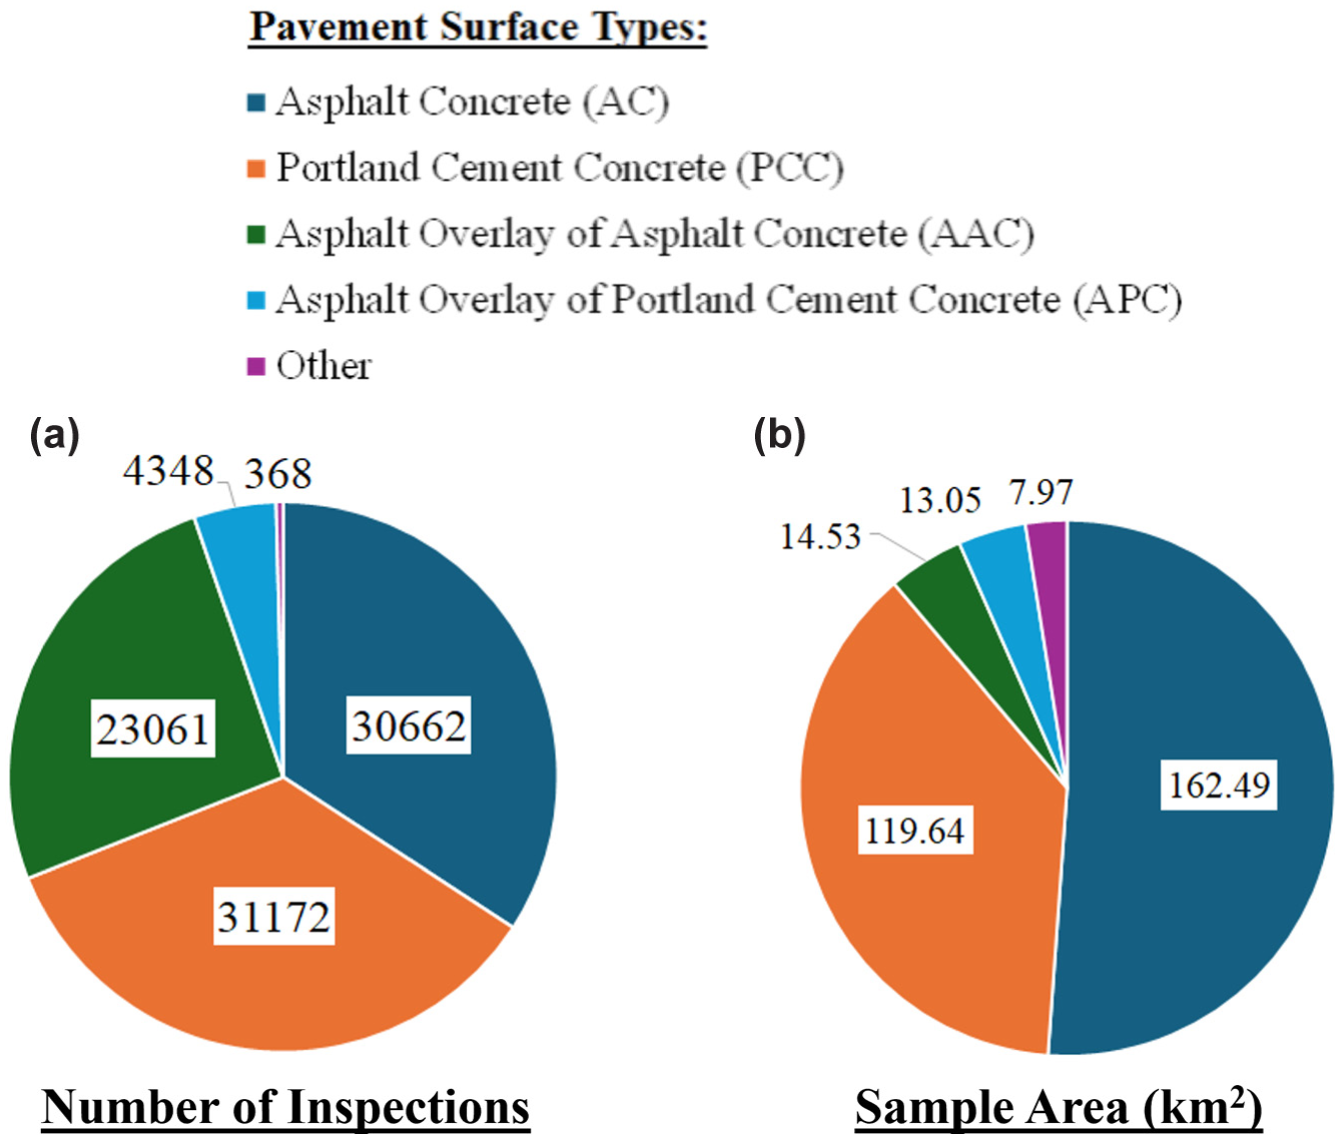
Breakdown of (a) number of inspections and (b) sample size area (km2) in nationwide PCI database by surface type.
Analysis Methodology for Pavement Condition Data
Pavement Condition Metrics
PCI is calculated to represent the overall condition of a pavement using measurements of observed pavement distress. Specifically, PCI is a continuous measure between 0 and 100 where 0 indicates complete failure and 100 represents a pavement without any distress. To calculate PCI, distresses are identified and measured in a pavement section using a sampling procedure dependent on the type of evaluation. These measurements are then translated to deduct values which are used to compute PCI. The PCI is then often converted to a qualitative measure through an airport PCI rating scale (Figure 2). Details related to the computation of PCI are provided in ASTM D5430 ( 7 ). For this study, all distress data were provided from airport owners, and the PCI was computed internally by FAA PAVEAIR.
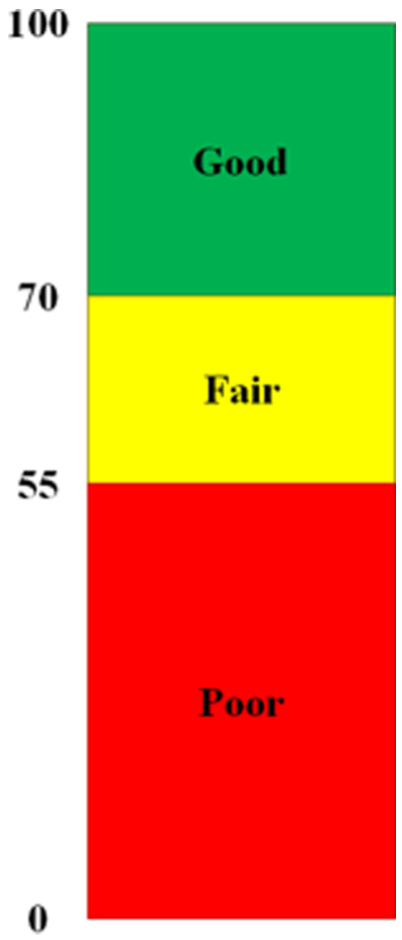
Airport pavement condition index rating scale.
The structural condition index (SCI) is built on the concept of PCI but includes only load-induced distresses, providing a more direct assessment of the pavement’s structural capacity with respect to aircraft traffic. For example, a low SCI (and thus a low PCI) would indicate that the pavement was structurally deficient for the design loading. In contrast, a high SCI paired with a low PCI would suggest that the observed damage is driven by nontraffic factors such as environmental effects or construction defects. The calculation of SCI only includes a subset of the distresses considered in the PCI calculation as described in Table 1. Like PCI, SCI is defined on a continuous scale between 0 and 100 with a higher number indicating less load-related damage. SCI must always be greater than or equal to PCI, and the limit case where SCI equals PCI indicates all pavement distress is load-related. The concept of SCI was originally developed by Rollings ( 8 ) as a means of distinguishing distresses on rigid pavements attributable to aircraft loading from distresses controlled by construction or material specifications. Garg et al. ( 5 ) introduced the concept of SCI to flexible pavements, selecting rutting and alligator cracking as the primary distresses associated with load-induced damage.
Distress Considered in the Calculation of SCI
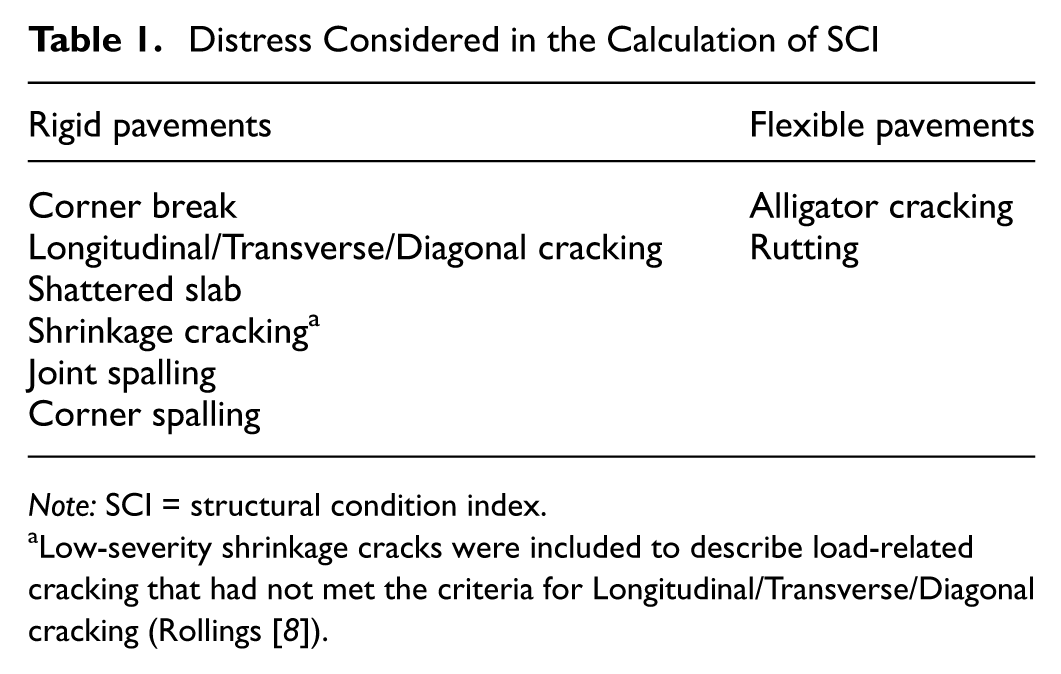
Note: SCI = structural condition index.
Low-severity shrinkage cracks were included to describe load-related cracking that had not met the criteria for Longitudinal/Transverse/Diagonal cracking (Rollings [ 8 ]).
Determination of Pavement Age
Airport pavement management databases now more routinely include historical data detailing past work on specific pavement sections. This additional data proved necessary when determining pavement condition because it has been able to explain most of the unexpected increases in PCI throughout the life of the pavement. An example of this is shown in Figure 3. Therefore, to determine the age of the pavement, a combination of the construction date, the work history, and the date of the PCI inspection were used. In the case of a documented work history event, the starting age of the pavement would be reset to the date of the pavement rehabilitation event. Only those pavement M&R events with a structural impact (e.g., overlays) were used to reset the pavement age. Nonstructural maintenance repairs (e.g., crack seal, surface seals) were not considered in this study.
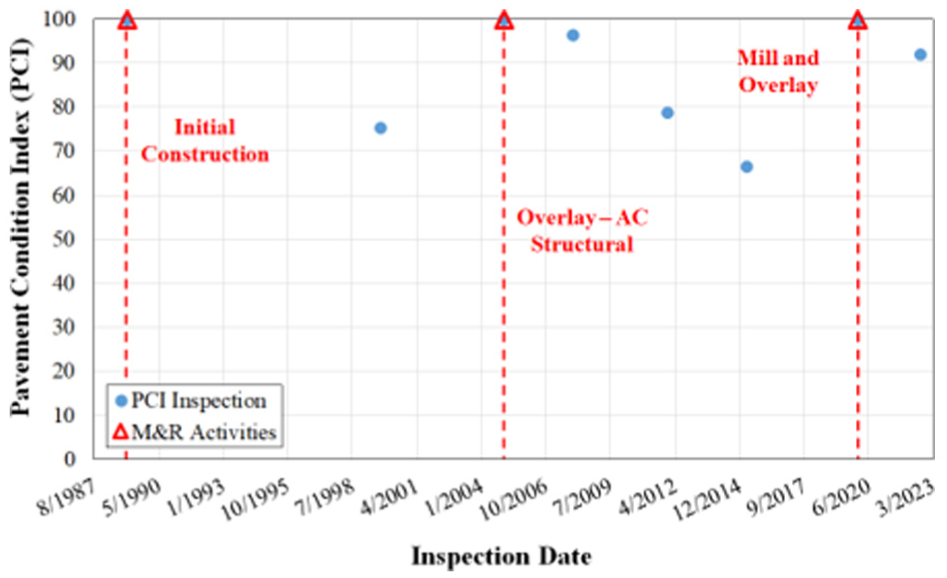
Example of PCI inspections with annotated work activities.
Outlier Analysis of Pavement Condition
Airport pavement condition data are noisy. This is especially so when comparing data across the United States, given the variety of environmental conditions, inspection experience, and the general subjectivity of some pavement distresses. This is exacerbated by missing or inaccurate information in the pavement inventory or work histories. Therefore, a methodology to collate these data and remove any outliers was necessary before evaluating any data.
As a first step, the pavement age was grouped into discrete years rather than treated as a continuous variable. This simplification better reflects how construction and inspection activities are planned and scheduled and helps minimize the influence of short-term variability in PCI data. Grouping the data by year also improves data consistency by increasing the number of observations per age group. After each age group was established, the number of observations in each age group had to be greater than a specified value. For general assessment of PCI trends and pavement distresses, the minimum number of observations was 30 to include for analysis. The threshold of 30 data points was selected based on the assumptions of a central limit theory ( 9 ). However, it is acknowledged that few pavement sections reach a highly deteriorated state (given the associated safety concerns) and all data points capturing this trend would be omitted using a threshold of 30. Therefore, to compare existing pavement design failure models with PCI data, only 10 observations were required for each age group to better capture pavement failure.
Results and Discussions
Trends in Pavement Condition Index and Structural Condition Index
General trends in median and mean PCI are presented in Figure 4 for runways and taxiways. The mean values are shown as a line to better distinguish them from the median values and should not be read as a continuous variable. Figure 4, a and b , shows that the rigid pavement PCI deteriorated at a slower rate compared with all other surface types regardless of the airport feature. Asphalt concrete (AC) and asphalt over asphalt concrete (AAC) pavements deteriorated at very similar rates, indicating that these two surface types may be treated similarly for the purposes of pavement condition evaluation and modeling. Asphalt overlays over PCC (APC) showed a similar rate of PCI degradation as AC and AAC; however, additional data and further comparison of distress mechanisms are necessary to compare these surface types. Overall, PCI trends were relatively consistent between runways and taxiways, regardless of surface type. However, there were fewer runway pavement sections more than 20 years old. The smaller number could be as a result of fewer runway sections overall, prioritization of M&R funding for runways, selection thresholds applied during analysis, or faster deterioration rates. Nonetheless, that there were fewer runway inspections in the 20–30 year age bracket is significant on its own, reflecting that many of these pavements were likely rehabilitated or reconstructed earlier, especially for asphalt-surfaced pavements. Lastly, Tables 2 and 3 present the average and standard deviation in PCI at selected ages. Given that the median, mean, and standard deviations values were consistently similar across all ages, it was determined that outliers had minimal influence on the analysis.
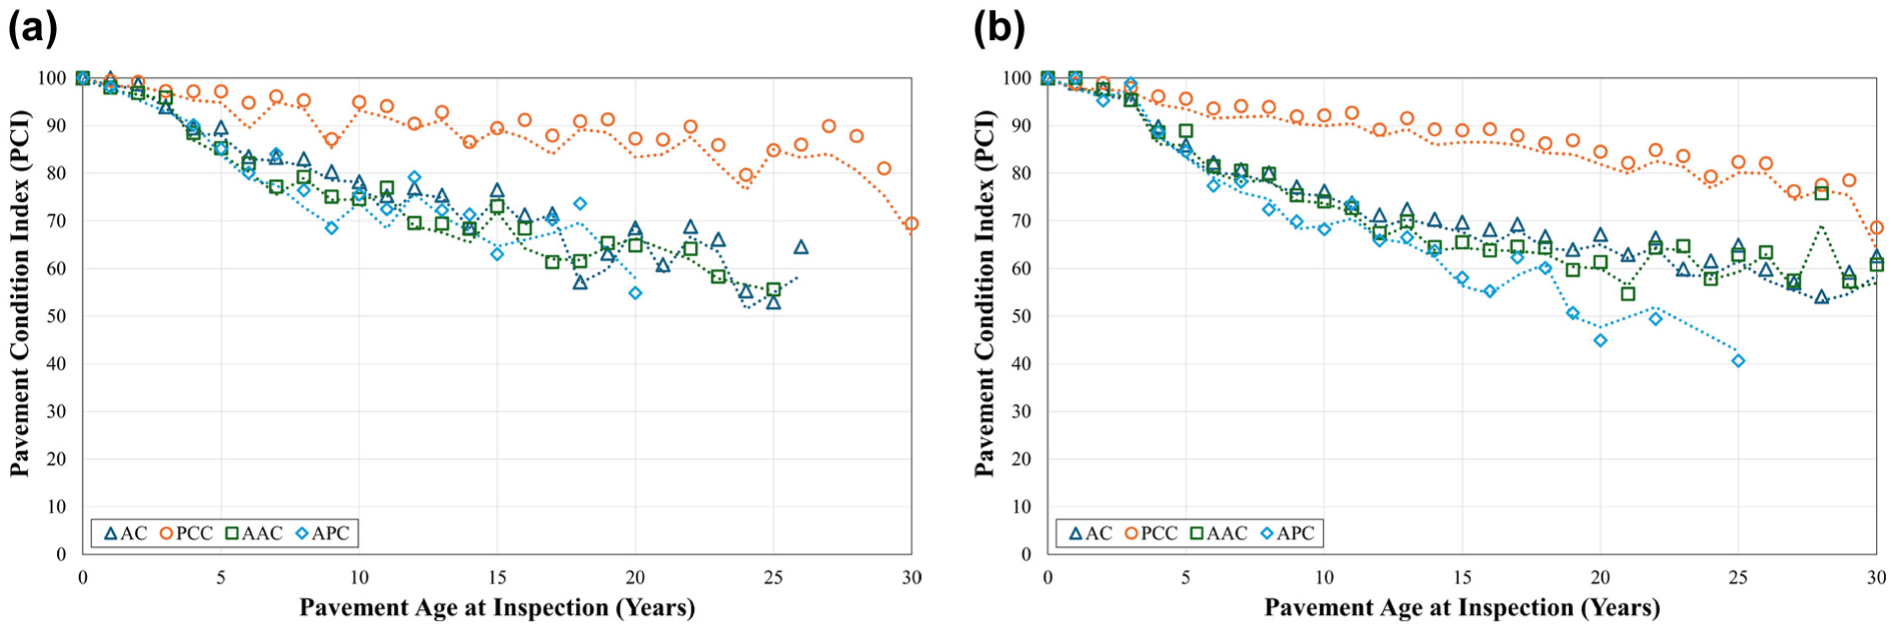
Yearly trend in PCI for (a) runways and (b) taxiways.
Average and Standard Deviation PCI Values for Runways by Surface Type
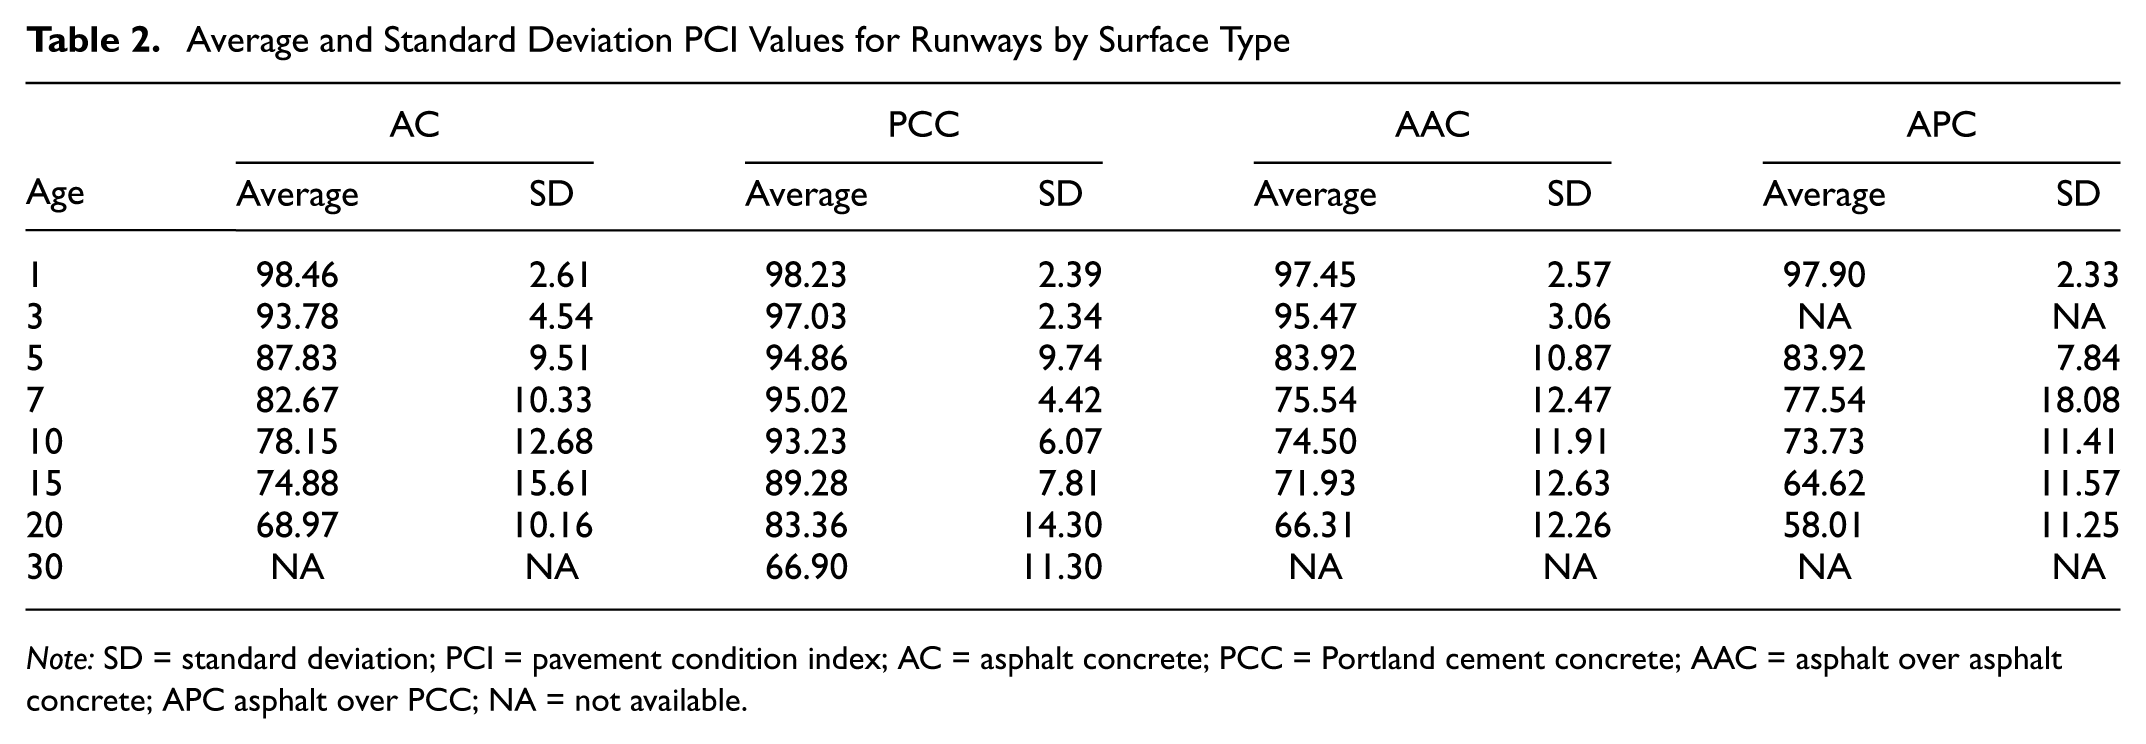
Note: SD = standard deviation; PCI = pavement condition index; AC = asphalt concrete; PCC = Portland cement concrete; AAC = asphalt over asphalt concrete; APC asphalt over PCC; NA = not available.
Average and Standard Deviation PCI Values for Taxiways by Surface Type
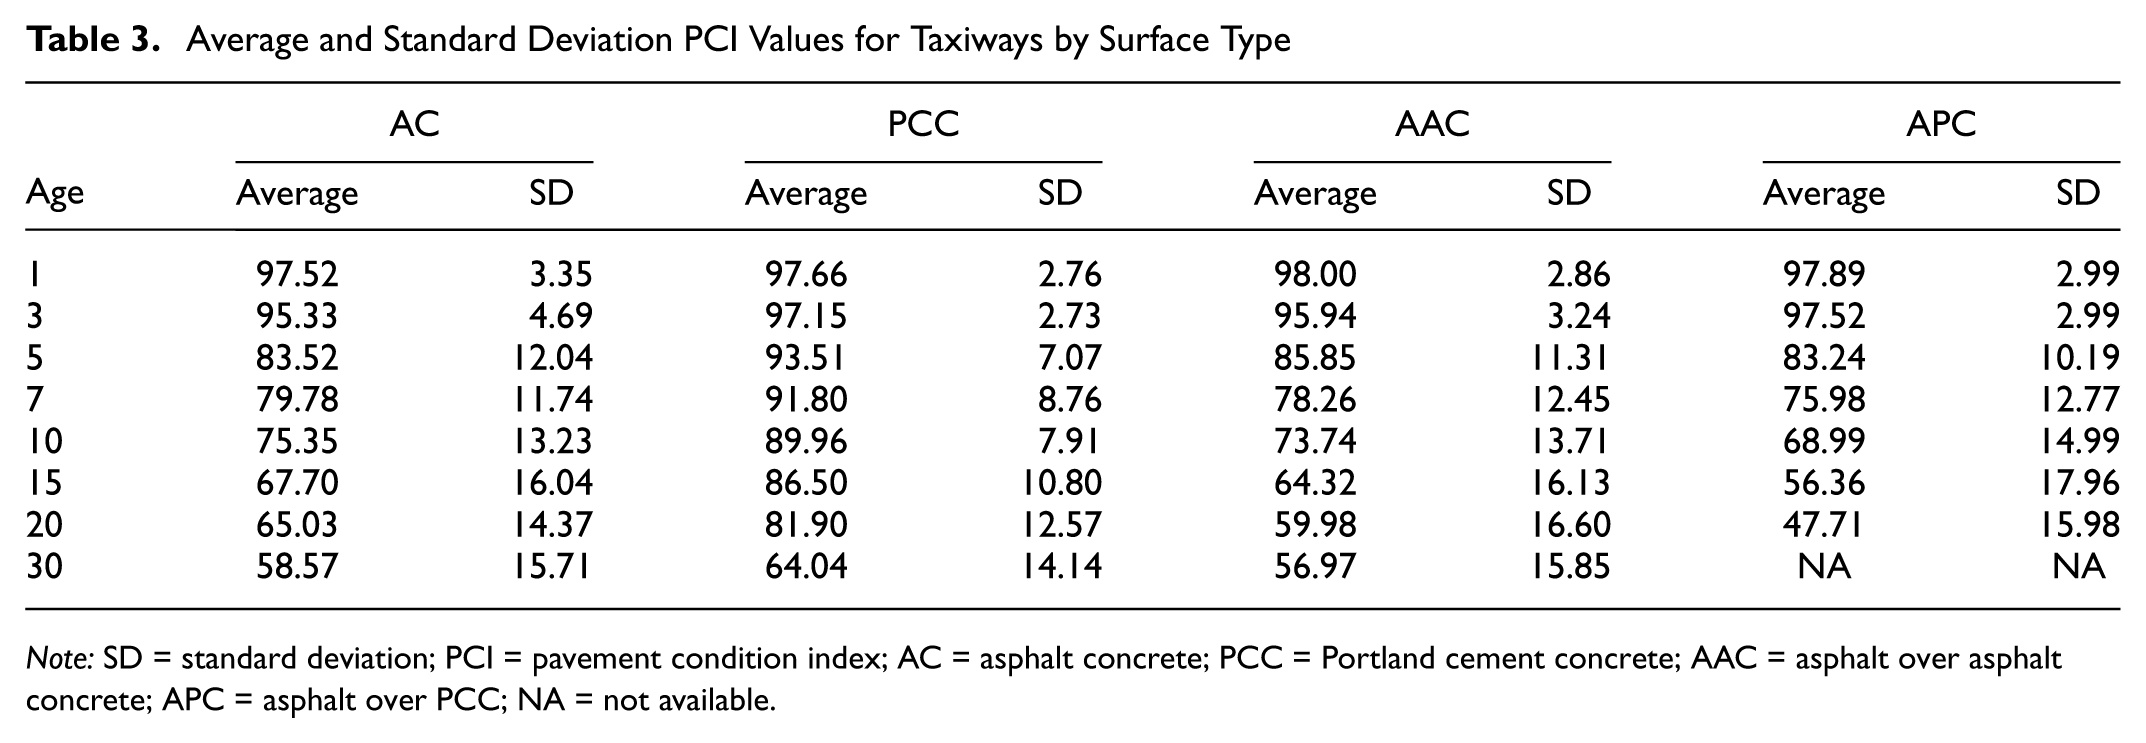
Note: SD = standard deviation; PCI = pavement condition index; AC = asphalt concrete; PCC = Portland cement concrete; AAC = asphalt over asphalt concrete; APC = asphalt over PCC; NA = not available.
General trends in median SCI are presented in Figure 5, a and b , for runways and taxiways, respectively. Interestingly, SCI indicates a different performance trend compared with PCI. In the case of SCI, asphalt-surfaced pavements (AC, AAC, and APC) all have consistently higher SCI values compared with rigid pavements, regardless of the airport feature. Therefore, the SCI values indicate that asphalt-surfaced pavements did not experience much, if any, load-related distress. As mentioned previously, fewer asphalt-surfaced sections exist at older service ages, and so distresses or mechanisms not considered in SCI must be driving the need for rehabilitation of asphalt-surfaced airport pavements. Furthermore, the differences between the median and average SCI values were minimal at earlier pavement ages but increased over time. This suggests that the distribution of SCI data became less symmetric and had greater skewness at later pavement ages.
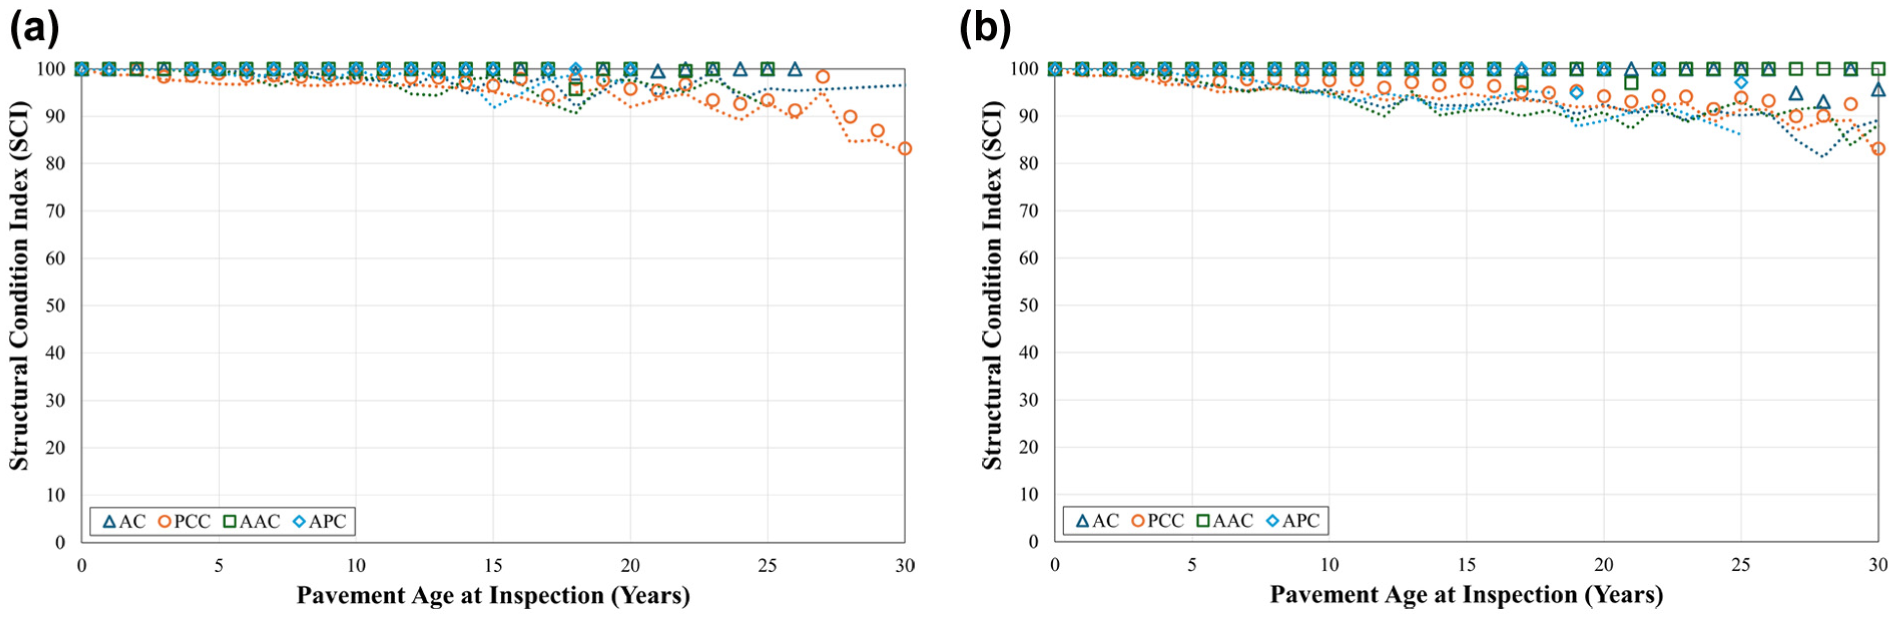
Yearly trend in SCI for (a) runways and (b) taxiways.
Distress Evaluation
The findings related to SCI depend on how distresses are identified given that SCI only considers those that are deemed load-related (Table 1). Therefore, an assessment of the common distresses observed for each surface type and airport feature was completed. For this assessment, the total sample density of each distress was calculated by dividing the total distress quantity by the total sample area. Total sample distress density and average PCI deduct value for flexible and rigid pavements are presented in Tables 4 and 5, respectively. Weathering was the most common distress observed on flexible pavements with approximately 30%–40% of all sample areas experiencing this distress. Weathering, however, had only a minor impact on PCI with deduct values near 10. Raveling, block cracking, and longitudinal and transverse cracking all were commonly experienced on flexible pavements with substantial deduct values (greater than 10). For APC pavements, joint reflection cracking was also a commonly experienced distress. These flexible pavement distresses are not considered within the SCI and is the reason why SCI remained close to 100 for all flexible pavement ages. As for rigid pavements, joint seal damage was the most common distress experienced but did not have a substantial impact on PCI (deduct values less than 10). Other distresses (alkali silica reaction, spalling, longitudinal/transverse/diagonal cracks) were experienced less frequently but had substantially higher deduct values. However, in general, a smaller percentage of total sample area experienced some distress in rigid pavements compared with flexible pavements.
Density and Average PCI Deduct Value for Flexible Pavement Distresses
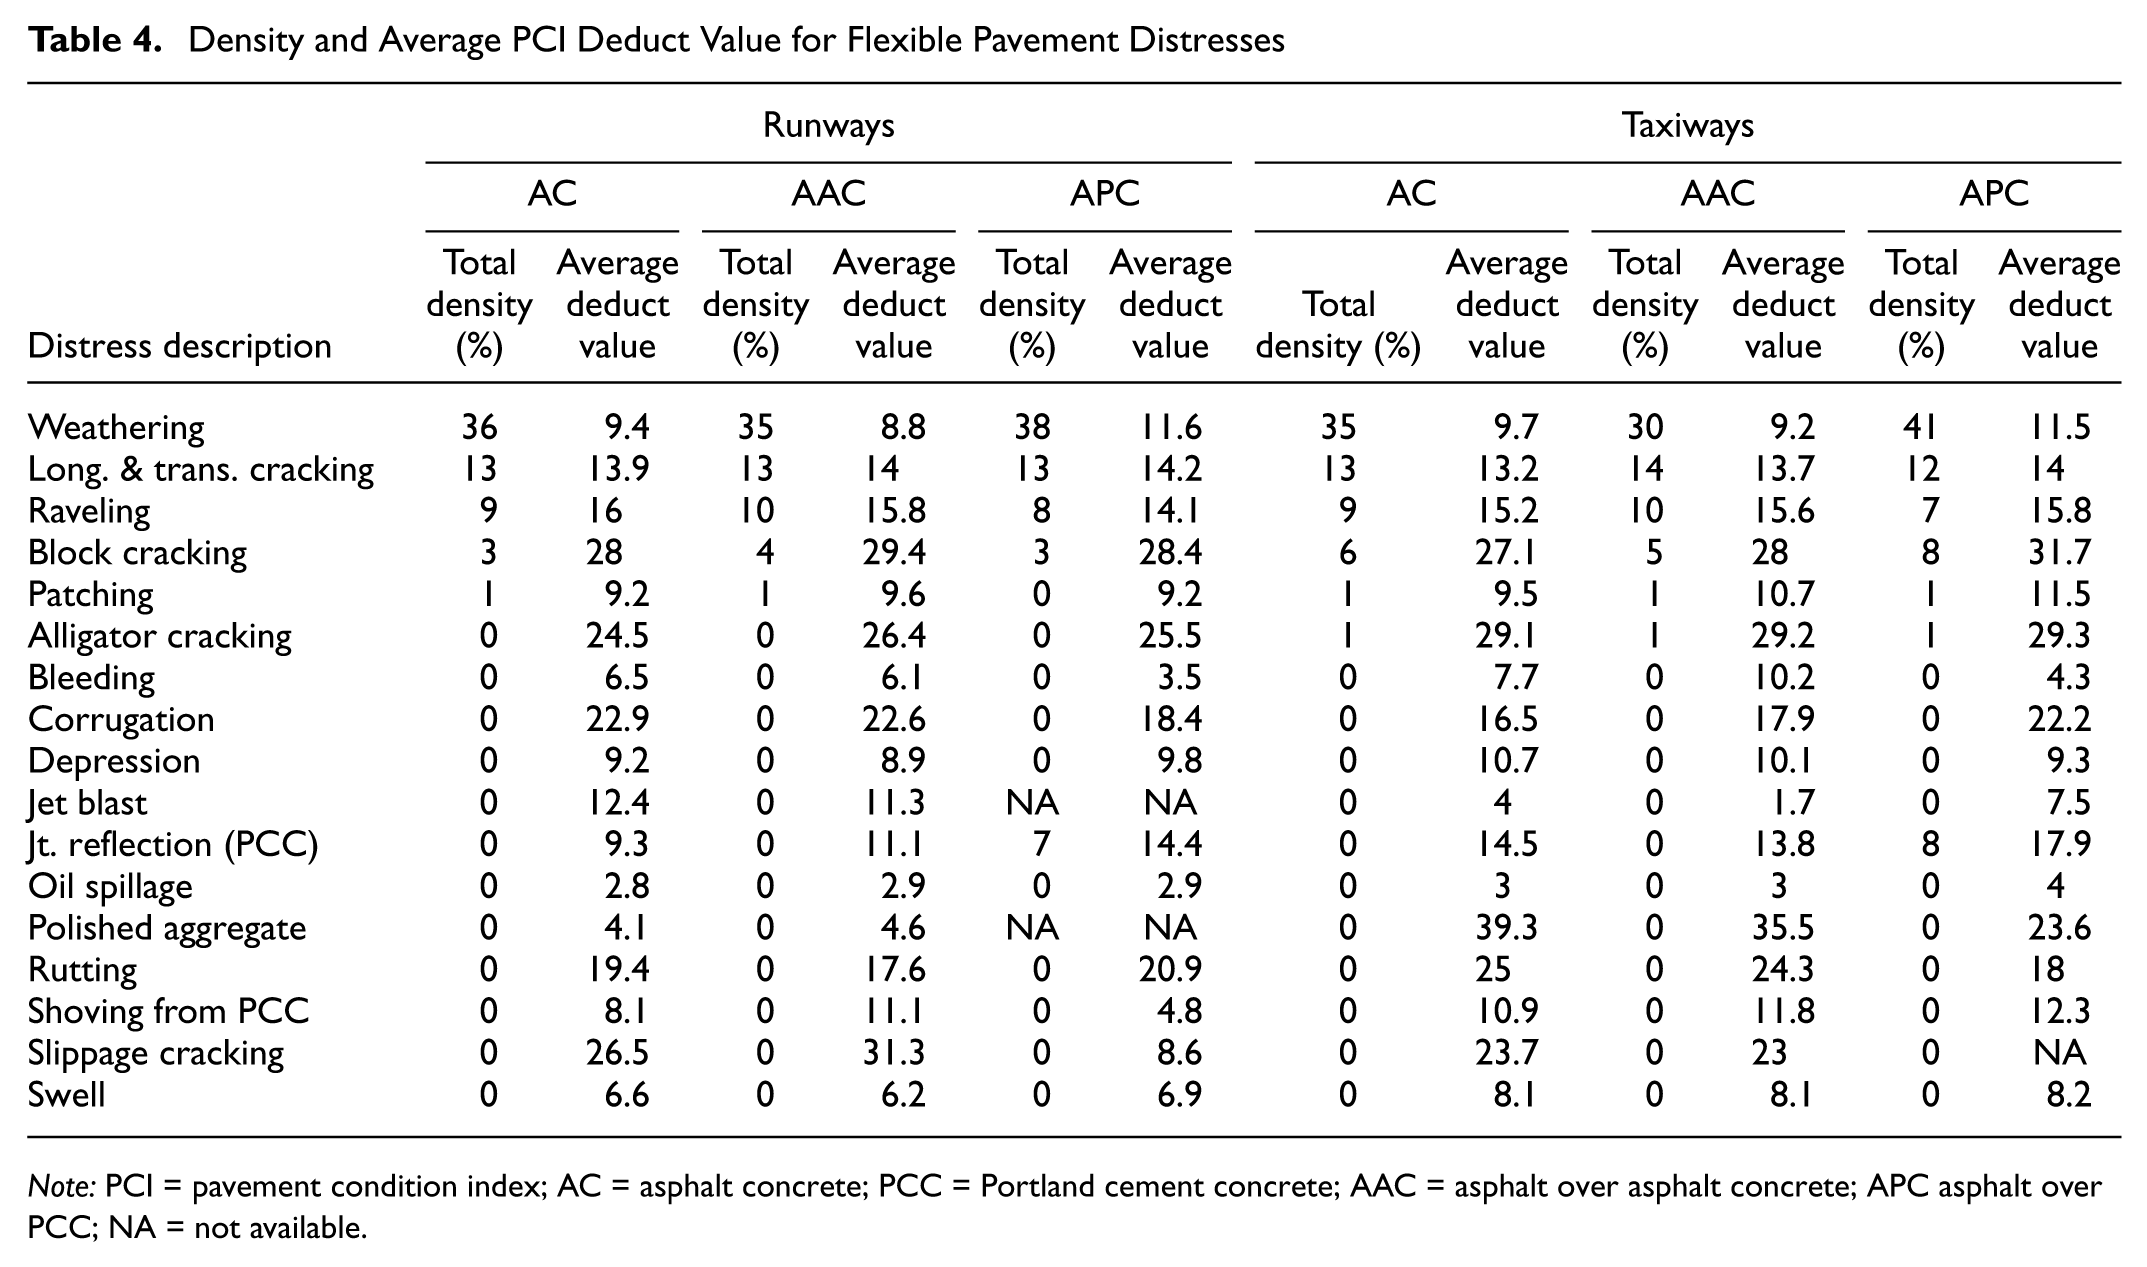
Note: PCI = pavement condition index; AC = asphalt concrete; PCC = Portland cement concrete; AAC = asphalt over asphalt concrete; APC asphalt over PCC; NA = not available.
Density and Average PCI Deduct for Rigid Pavement Distresses
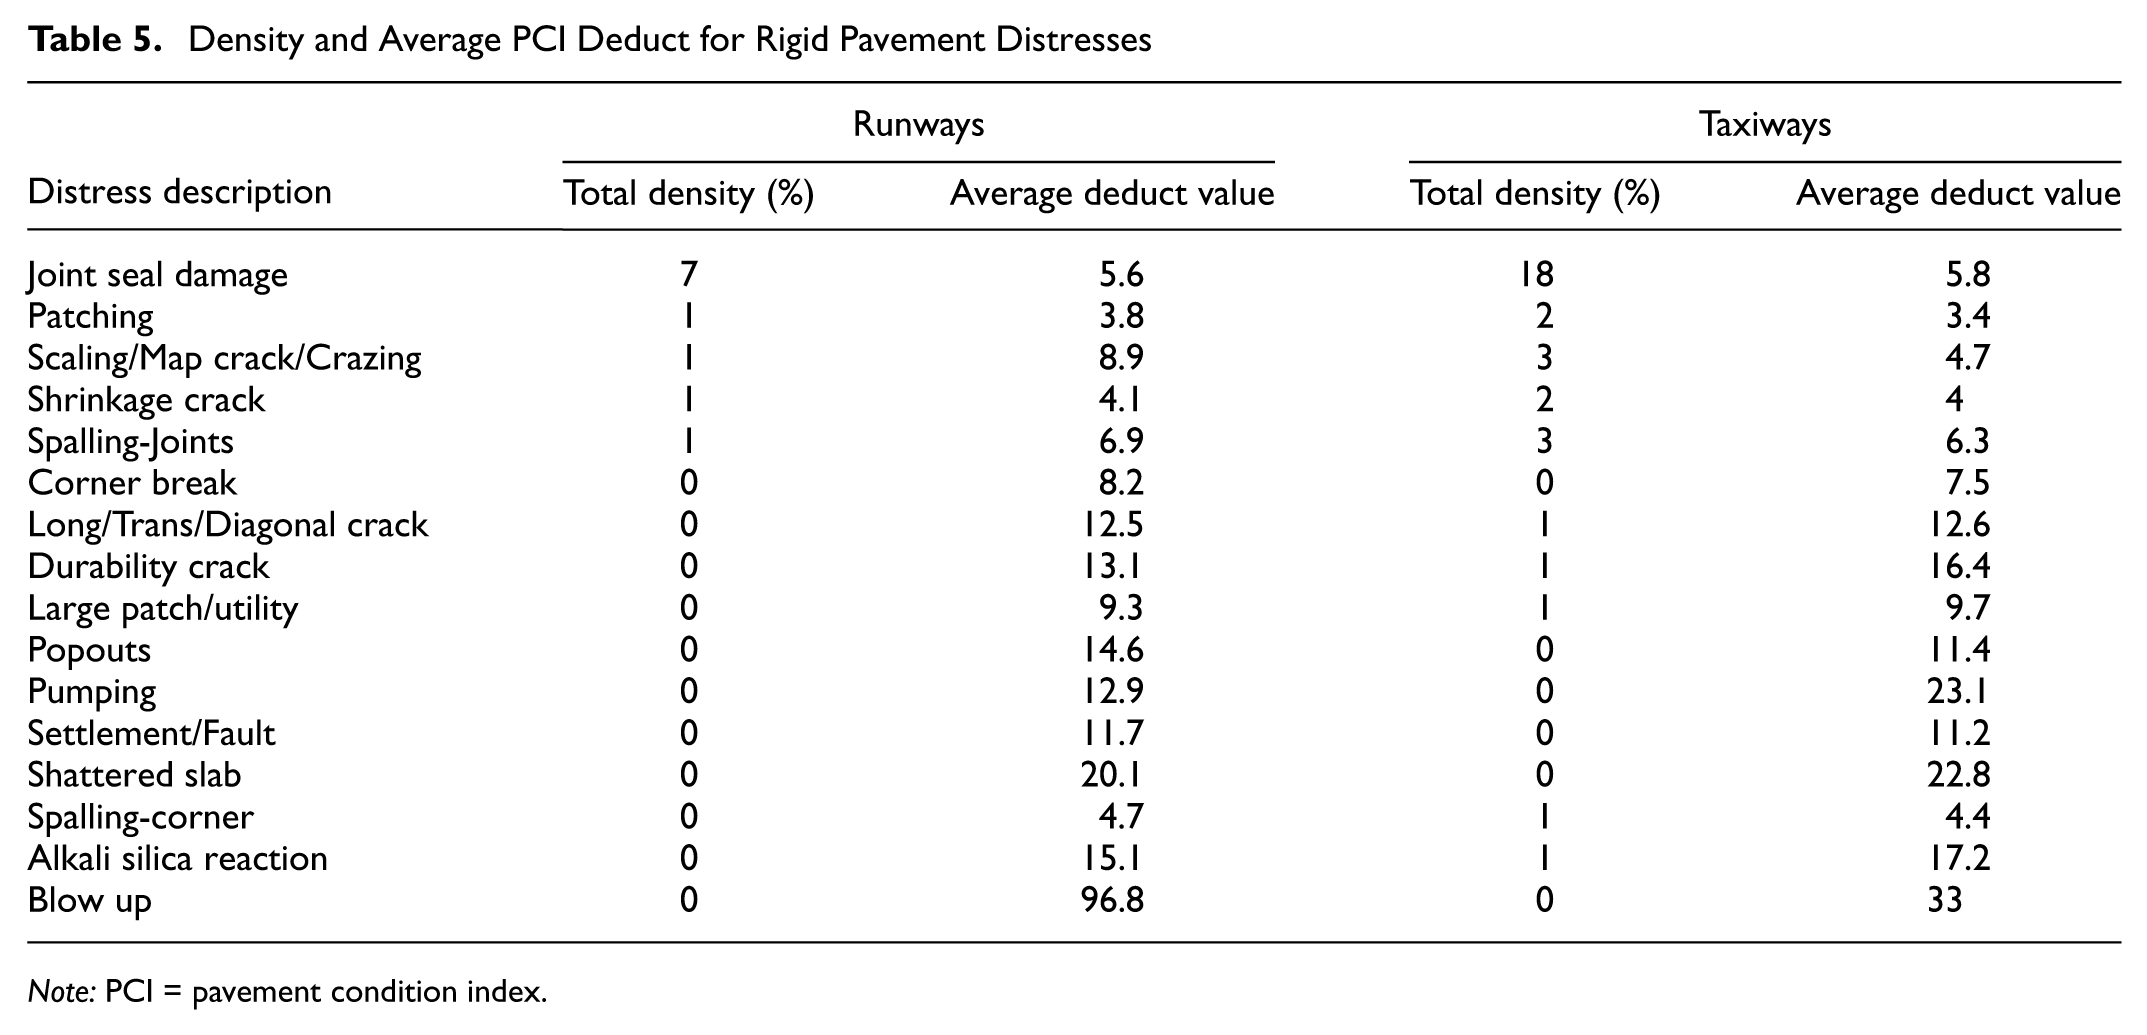
Note: PCI = pavement condition index.
Evaluating FAA Pavement Design Procedure Using Pavement Condition Data
The current FAA airport pavement design procedure intends to produce a pavement structure that supports anticipated aircraft traffic for 20 years. Therefore, in the context of PCI, ideally a pavement built in 2000 would be at a condition that required some structural rehabilitation by 2020. Rigid and flexible pavements, however, did not experience substantial drops in SCI at 20 years of age (shown previously in Figure 5), warranting comparison of airport pavement life forecasts with the measured pavement condition data. For this comparison, time duration (i.e., years) and coverages were viewed synonymously. This was necessary because pavement condition data are not recorded with traffic, but rather at a specific point in time. Further, relaxed data restrictions were applied in this analysis, requiring a minimum of 10 pavement sections rather than 30. This adjustment allowed for the inclusion of data representing the extreme ends of pavement service life, which are relatively uncommon. Given the reduction in number of required data points, the median was used to evaluate the FAA pavement design procedure using pavement condition data. The following subsections present evaluations of the failure models for both rigid and flexible pavements.
Rigid Airport Pavements
The FAA rigid pavement design procedure uses pavement condition, as represented by SCI, within the theoretical design model. This design framework was based on Rollings ( 8 ), which established a bilinear SCI deterioration model based on rigid pavement performance data from multiple studies ( 10 ). Later, the concept of terminal SCI was adopted as an FAA design criterion to ensure the pavement would have an SCI of 80 at the end of the design period. An illustration of the bilinear SCI degradation curve is presented in Figure 6.
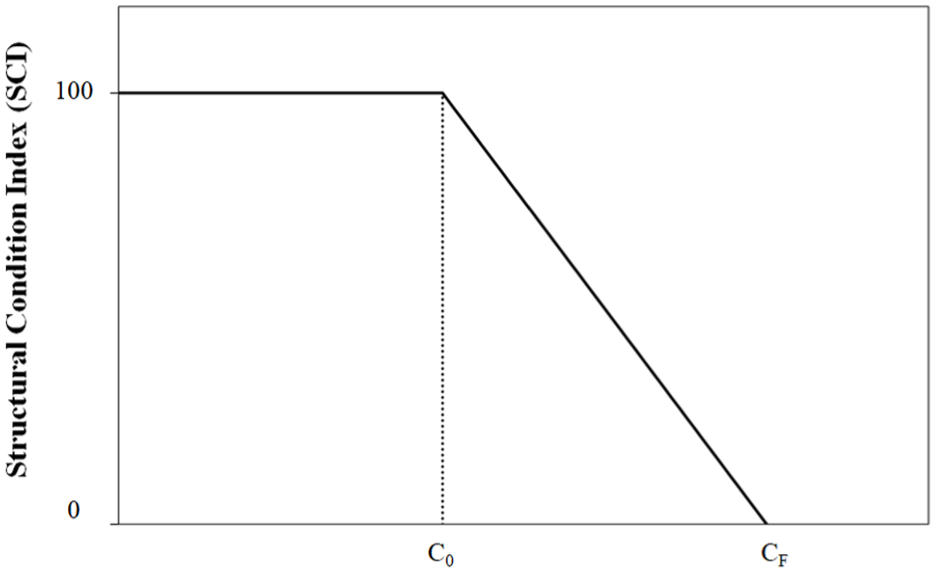
Theoretical bilinear structural condition index model used for rigid airport pavements ( 11 ).
As seen in Figure 6, the SCI deterioration model was hypothesized to be horizontal for a period of time indicating no load-induced damage to the pavement. After a certain number of coverages (C0), the SCI begins to deteriorate at a linear rate until pavement failure (CF). The pavement failure behavior described in Figure 6 can be evaluated using the average SCI values from pavement condition surveys using age as a surrogate for aircraft coverages. The SCI performance data for PCC runways and taxiways is presented in Figure 7.
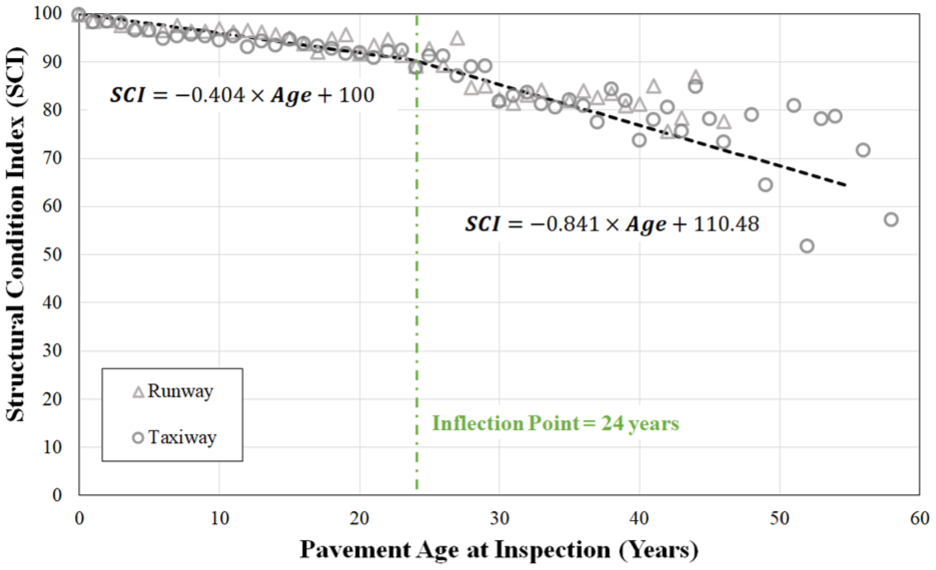
Bilinear structural condition index model generated from pavement condition data.
As can be seen from Figure 7, the data follow an approximately bilinear trend, supporting the SCI degradation curve proposed by Rollings ( 8 ) and further used in FAA rigid airport pavement design. In addition, the SCI data from runways and taxiways were very similar and indicated that the airport feature did not have an impact on the SCI. Considering this, a bilinear model was developed and the equations for each portion are also presented in Figure 7. The inflection point between the two linear models occurred at 24 years. Interestingly, this indicates that the FAA design life of 20 years is predicting the approximate inflection point of the bilinear model. Further, the data before the inflection point were not horizontal as hypothesized. Rather, there was a slight deterioration of SCI before the inflection point with an approximate SCI reduction of 10 points. This was then followed by a faster reduction in SCI, reaching an SCI of 80 at approximately 35 years. Ultimately, Figure 7 shows that the FAA rigid pavement design model is valid, but the overall pavement design, from selection of inputs to the calibration of the failure model, includes added conservatism that causes rigid pavements to surpass their design life.
Flexible Airport Pavements
The FAA flexible pavement design procedure is based on prevention of subgrade shear failure rather than on a pavement condition metric (such as rigid pavement design). Specifically, a definition of flexible pavement failure was established in Ahlvin ( 12 ) as either “surface upheaval of the pavement adjacent to the traffic lane reached 1 in or more” or “surface cracking occurred to the point that the pavement was no longer waterproof.” The FAA flexible pavement design procedure selected surface upheaval as the primary airport pavement failure mechanism (while allowing a pavement designer to consider cracking in the surface layer). Surface upheaval is not a distress specifically identified in pavement condition evaluations; it is only captured as either rutting or swelling.
In an effort to reconcile pavement design and condition evaluation, Garg et al. ( 5 ) determined two flexible pavement distresses that are structural condition measures—rutting and alligator cracking—and recommends those distresses be used to compute SCI for flexible pavements. However, when using these distresses to compute the SCI, there was little to no change throughout the life of the pavement (Figure 5). This leads to the observation that the FAA flexible pavement design procedure is not deficient in protecting the structural capacity of the subgrade. Figure 4, however, is simply based on general trends and not necessarily indicative of all the pavement sections. To more closely assess SCI reduction over time for flexible pavements, the 10th, 20th, 30th, 40th, and 50th (i.e., median) percentiles were calculated combining all flexible pavements surface types (AC, AAC, and APC) and are presented in Figure 8.
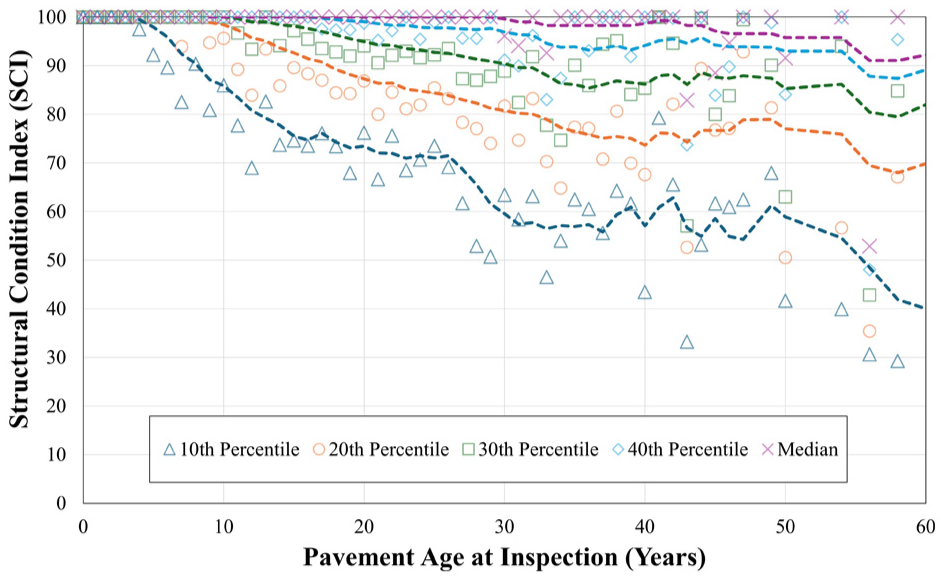
Relationship between SCI and pavement age for flexible airport pavement sections at various percentiles.
In Figure 8, there is a small subset of flexible pavements that have a sharp reduction in SCI; however, only 10% of all flexible pavement sections had an SCI less than 90 after 20 years of service. Based on this and considering the current FAA design life, it is apparent that the FAA design procedure for flexible airport pavement overdesigns flexible pavements given that there is no structural damage experienced. Nonetheless, it was seen from Figure 4 that flexible pavements deteriorate more rapidly than rigid pavements, which is either unaccounted for in design or unrelated to the structural life of the pavement. Figure 9 shows the cumulative distribution of pavement sections with PCI less than or equal to 55 (solid lines) and 70 (dashed lines), with PCC pavements included for comparison. These two thresholds were selected because of how they relate to pavement management. PCI 55 is considered poor condition requiring urgent repair, while PCI 70 is an early trigger to begin planning for the rehabilitation (ASTM D5340-20).
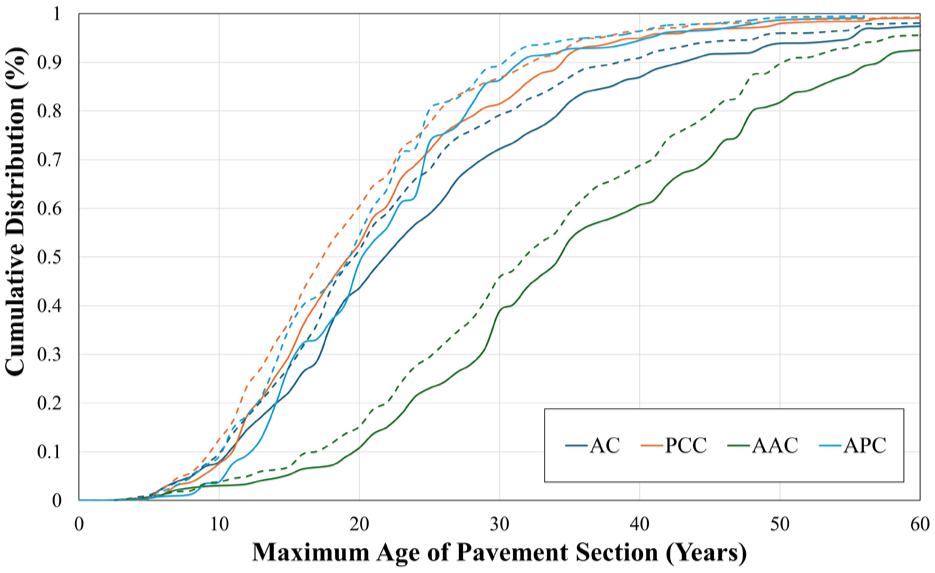
Cumulative distribution of pavements sections with PCI less than or equal to 55 and 70.
From Figure 9, approximately 50% of all flexible airport pavements reached PCI 70 and 55 at approximately 18 and 21 years, respectively. Rigid pavements, however, reached the same PCI levels at approximately 30 and 32 years, respectively. In the context of SCI, factors other than insufficient structural design must be driving the need for rehabilitation of flexible airport pavements. This is not necessarily true for every airport pavement but rather represents an overall trend for airports across the United States. Nonetheless, this finding highlights the distinct difference between structural and functional pavement life. The concept of structural versus functional life is described in Brill and Parsons ( 13 ) where the pavement can still support aircraft loads but functional deficiency poses a safety risk to continued operations. Independent of structural capacity, major work to restore pavement serviceability may be triggered by one or more of the following functional factors: (i) risk of foreign object damage generation; (ii) excessive roughness; or (iii) inadequate skid resistance (low friction). Since the FAA has initiated the goal to extend airport pavement design life from 20 years to 40 years, observations from Figure 9 indicate a need to consider functional life explicitly as part of the design procedure.
Moving toward 40-Year Airport Pavement Design
To consider functional life in airport pavement design, it is important to understand what initiates a pavement rehabilitation and an approximate time at which it is needed. For this, the data used in this study were filtered to only select pavement sections that had (i) a recorded major rehabilitation and (ii) a history of PCI inspections before the rehabilitation. With this dataset, the PCI and age at inspection immediately before the rehabilitation were determined and the general statistics were calculated as presented in Table 6.
General Statistics of PCI and Pavement Age Immediately before a Major Rehabilitation
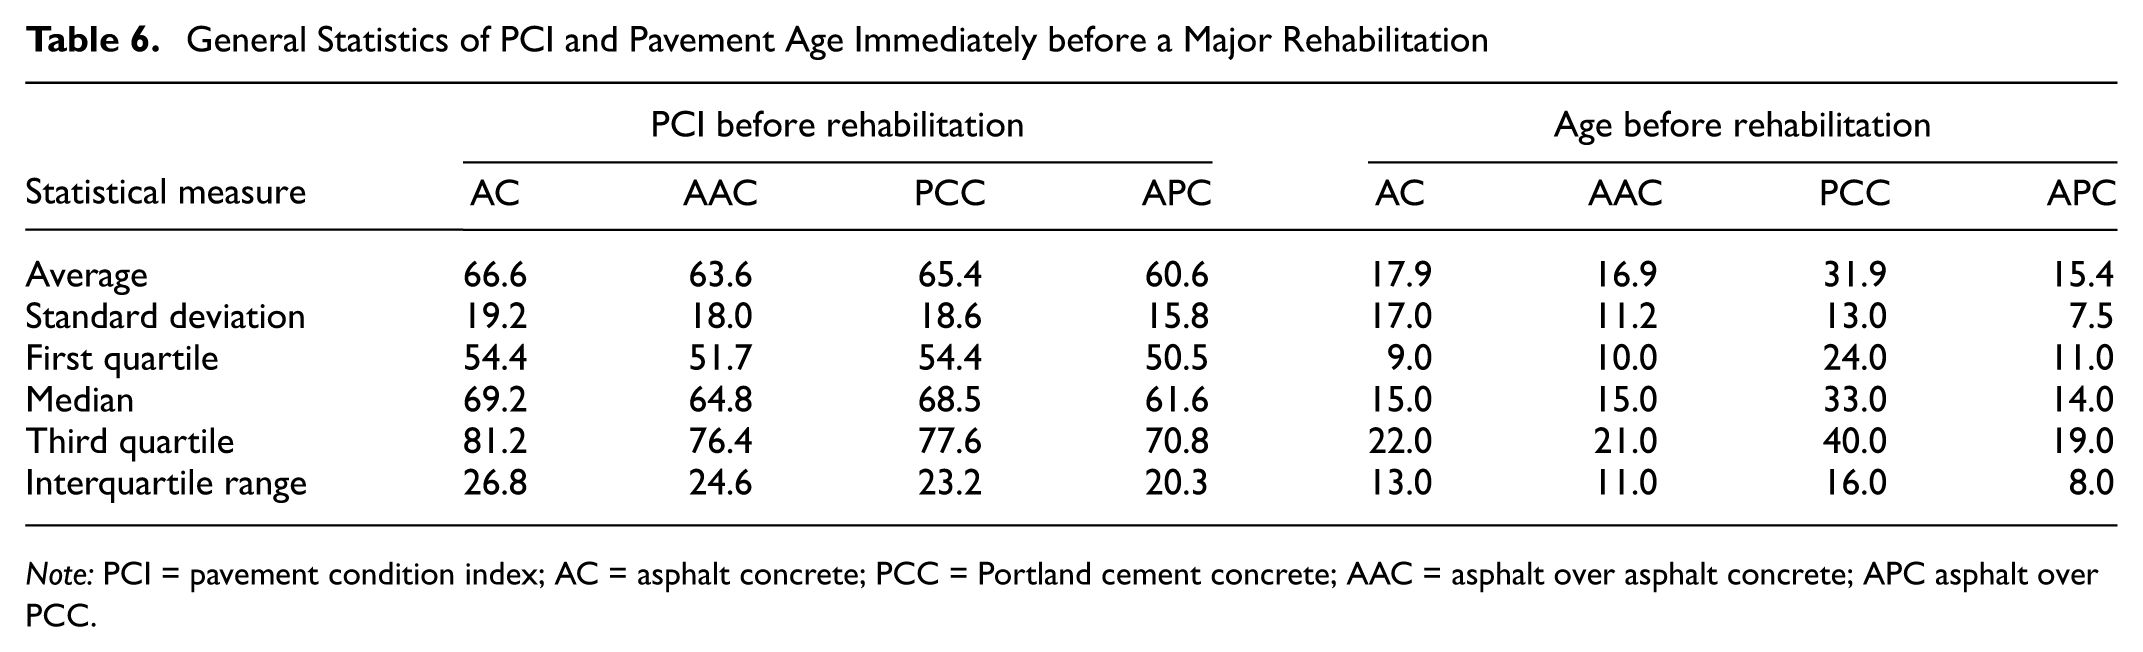
Note: PCI = pavement condition index; AC = asphalt concrete; PCC = Portland cement concrete; AAC = asphalt over asphalt concrete; APC asphalt over PCC.
From Table 6, on average, airport pavements are repaired immediately before reaching a “poor” pavement condition as determined by PCI (i.e., PCI less than 55). This timing of intervention may be tied to functional concerns (e.g., generation of foreign object debris on the pavement) or availability and prioritization of funding. An additional observation from Table 6 is that the age immediately before repair is greater for rigid pavements compared with flexible pavements. This is consistent with the cumulative distribution presented previously in Figure 9 and shows that PCC pavements typically have a longer life before rehabilitation. In fact, when looking at all pavement sections and not only those with rehabilitation, only 15% of the rigid pavement sections had a major rehabilitation. Table 6 shows that critical PCI is a strong predictor of when intervention is performed. Transitioning to a 40-year design life presumably would require maintaining the PCI above 60 throughout the life of the pavement.
For rigid pavements, this is relatively straightforward because (i) SCI and PCI are closely linked and (ii) the current thickness design procedure uses SCI. The issue with rigid pavements is that SCI does not fully explain the reduction in PCI. Ashtiani et al. ( 4 ) evaluated the discrepancy between PCI and SCI by accounting for all other distresses in a secondary measure called anti-SCI. From this definition, anti-SCI would capture distresses related to climate and construction defects as shown in Equation 1:

For this study, the anti-SCI was calculated for PCC runways and taxiways and is presented in Figure 10. Interestingly, anti-SCI deteriorates at a relatively constant rate throughout the pavement life regardless of airport feature. This is not all that surprising considering the damage captured from this parameter is mainly represented by environmental distresses. Also, the anti-SCI reduces at a similar rate to SCI before the SCI inflection point but does not have an inflection point like SCI. Distresses, such as ASR, are expected to have steady and continued development until they either lead to (i) a reduction in capacity such that a load-related distress develops or (ii) a rehabilitation intervention. As can be seen from Figure 10, anti-SCI can be easily modeled using a linear relationship with pavement age. Combining the deterioration of SCI and anti-SCI, it was observed that the current FAA 20-year airport pavement design procedure produces a pavement that lasts approximately 40 years.
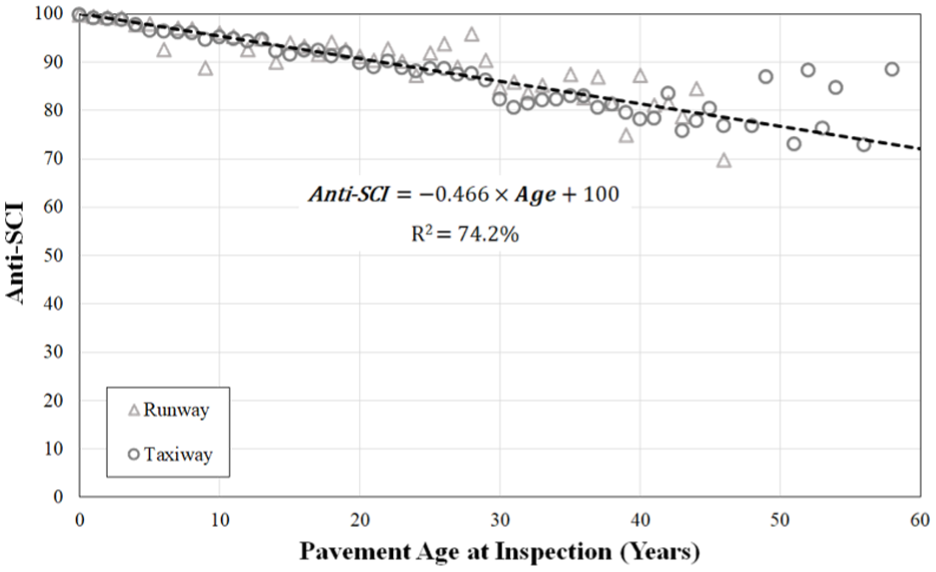
Change in anti-SCI over the life of rigid pavements.
Transitioning to a 40-year design for flexible airport pavements poses a greater challenge. On the one hand, the current FAA design procedure prevented flexible airport pavements from experiencing shear failure in the subgrade. On the other hand, these pavements are only operational for approximately 15 to 20 years, on average. In fact, most of the PCI deterioration was related to factors other than structural defects so any increase in design thickness would have negligible long-term impacts. Instead of increasing pavement thickness for the design, the overall design needs to assume some environmental damage and plan for interim rehabilitations during the 40-year design life. Based on the data in this study (Table 6), approximately two to three asphalt overlays would be necessary to achieve the desired 40-year pavement life. Assuming no change in traffic or issues in original construction, the structural aspect of the pavement maintains intact so the overlay treatment can be a full-depth mill and overlay of the surface layer. This form of considering rehabilitations, however, is simple and can be further improved by producing thicknesses based on the structural need of the pavement and then planning rehabilitations to repair pavement damage associated with environmental effects.
Conclusions
The main purpose of this study was to evaluate FAA pavement design methodology using pavement condition data. This study utilized pavement condition data collected from 179 commercial service airports across the United States (as defined by the NPIAS airport classification). In this study, PCC, AC, AAC, and APC surfaces were considered with 31,172, 30,662, 23,061, and 4,348 runway and taxiway inspections, respectively. For each pavement section, the PCI and SCI were computed using the FAA pavement management software, FAA PAVEAIR. The age of each pavement section was computed using the inspection date, construction date, and any M&R data. Once the data were prepared, the data were filtered based on the type of analysis such that a representative value of pavement condition was used in the analysis. Key findings from this study are:
The theoretical bilinear SCI model for rigid airport pavements aligned closely with the measured SCI data. The inflection point for the bilinear model occurred at approximately 24 years. The measured SCI data indicated some load-induced damage before the inflection point rather than remaining constant as assumed in the theoretical bilinear SCI model.
Flexible pavements deteriorated at a faster rate than rigid pavements when evaluating PCI. Distresses observed in flexible pavements were primarily weathering, raveling, longitudinal and transverse cracking, and block cracking. Joint reflection cracking was also a common distress observed among APC pavement sections. Of the commonly observed distresses, all are assumed to be environmental-related rather than load-related.
The average age of a flexible airport pavement before rehabilitation was approximately 15–18 years, whereas the average age of rigid airport pavements before rehabilitation was approximately 32 years. For all surface types, the average PCI immediately before rehabilitation was between 61 and 67.
The current FAA rigid pavement design procedure is close to achieving a 40-year design life even though it is currently using a 20-year design period. This is mainly attributable to conservatism of the rigid pavement failure model. Movement toward 40-year rigid airport pavement design would also require some consideration of environmental damage during that time.
The current FAA flexible pavement design procedure provides substantial structural capacity to support aircraft traffic for 20 years; however, the operational life of the flexible pavements is less than 20 years. Specifically, the average age of flexible pavements when reaching PCI values of 70 or less is approximately 15–19 years. Movement toward 40-year flexible airport pavement design must consider environmental damage and plan for interim rehabilitations throughout the design period.
The findings from this study have a direct impact on airport pavement design as it confirms existing theoretical failure models, highlights conservatism and shortcomings in the existing design procedure, and demonstrates that the end of life for a pavement is not always structural. This study indicates that extensions of pavement life beyond the current design period must consider environmental damage in the design and when planning rehabilitations. Further, the study indicates that increasing pavement thickness will not always yield a substantial improvement in pavement life, especially if the distresses are driven by climatic conditions. The research in this study highlighted several areas for continued research, including further evaluation of the limitations and shortcomings of the current airport pavement design models, integration of reliability-based approaches in the planning of rehabilitations, life-cycle and life-cycle cost assessments of implementing a 40-year airport pavement design life, and consideration of how preventative treatments may affect the findings of this study. Finally, this study only included pavement condition data from US airports, so the results are limited to conditions represented within the United States.
Footnotes
Acknowledgements
The authors gratefully acknowledge the time, effort, and cooperation of the airport and state agencies that provided the data necessary to complete this study.
Author Contributions
The authors confirm contribution to the paper as follows: study conception and design: Daniel Offenbacker, David R. Brill, Navneet Garg; data collection: Daniel Offenbacker, David Brill; analysis and interpretation of results: Daniel Offenbacker, David Brill, Navneet Garg; draft manuscript preparation: Daniel Offenbacker, David R. Brill, Navneet Garg. All authors reviewed the results and approved the final version of the manuscript.
Declaration of Conflicting Interests
The authors declared no potential conflicts of interest with respect to the research, authorship, and/or publication of this article.
Funding
The authors disclosed receipt of the following financial support for the research, authorship, and/or publication of this article: The work described in this paper was supported by the FAA Airport Technology Research and Development Branch, James Layton, Manager.
Data Accessibility Statement
The contents of this paper reflect the views of the authors who are responsible for the facts and the accuracy of the data presented here. The contents do not necessarily reflect the official views or policies of the FAA. This paper does not constitute a standard, specification, or regulation.