






Abstract
This study presents a comprehensive approach to quantifying journey-level driving behavior using connected vehicle (CV) trajectory data. A count and severity-weighted driving behavior index was developed through confirmatory factor analysis, integrating acceleration, braking, speeding, and cruising metrics to assess the overall risk level of each trip. The index was applied to over 330,000 trips across Iowa, revealing a skewed distribution, indicating that while most trips involved moderate behavior, a notable subset exhibited aggressive patterns such as frequent speed limit violations and abrupt maneuvers. The study further explored whether behaviors in the first five minutes of a trip are associated with driving tendencies during the remainder of the journey. Using quantile regression, the analysis demonstrated that early trip cruising was consistently linked to safer driving, while early speeding and braking events were associated with elevated risk throughout the remainder of the journey. Acceleration variables showed relatively weaker associations with the remainder journey behavior. These associations varied across different trip durations, suggesting that trips of similar length should be compared when applying performance metrics or behavior-based scoring methods. These findings from this study support both reactive and proactive safety strategies by enabling real-time alerts during risky trips and post-trip identification of high-risk journeys for targeted feedback or intervention. As CV datasets continue to grow in coverage and quality, future work should explore collaborations with commercial operators and integrate high-frequency telemetry to enable proactive risk management.
Introduction
Speeding remains one of the most pervasive and hazardous behaviors on roadways, significantly contributing to traffic-related fatalities and severe injuries. According to the National Highway Traffic Safety Administration ( 1 ), speeding has consistently accounted for approximately 25% of all motor vehicle fatalities in the United States over recent decades. Traditional speed-monitoring methods, such as fixed-location speed detectors and enforcement mechanisms, provide valuable safety data; however, these methods have inherent limitations because of their inability to capture continuous vehicle movements. Consequently, they offer limited insight concerning the comprehensive speeding behaviors of a trip. In parallel, crash location data derived from police reports is commonly used to identify high-risk areas or crash hotspots. While valuable for spatial analysis and targeted interventions, these datasets often lack critical contextual information about driver behavior preceding the incidents ( 2 ).
It is not just whether a driver is speeding that matters, but also how they speed. The distinction between abrupt and smooth speed changes can reveal important aspects of a driver’s behavior. Sudden acceleration or braking may indicate aggressive or inattentive driving, while more gradual changes often reflect safer, more predictable behavior. This is important because driving style affects not only the individual driver but also other road users, including nearby drivers, pedestrians, and cyclists, who must quickly adapt to the behaviors of those around them. Therefore, identifying risky driving behavior is essential for improving roadway safety and ensuring a more predictable traffic environment.
In response to these limitations, researchers and practitioners have increasingly turned to sensor-based vehicle movement data, particularly from technologies such as LiDAR and connected vehicles (CVs), to obtain more granular, detailed, and comprehensive insights into driver speeding behaviors ( 3 – 6 ). Commercial third-party vendors now provide high-resolution vehicle trajectory data, and the resolution and fidelity of such datasets are expected to improve significantly in the near future. CVs generate continuous streams of high-frequency trajectory data, including precise global positioning system (GPS) coordinates, instantaneous speed, and dynamic vehicle parameters (e.g., acceleration, heading, and braking status). Unlike traditional spot-speed sensors, CV data allows researchers to observe where speeding occurs and for how long, how frequently, and under what roadway or temporal conditions. This enables the identification of distinct speeding episodes, patterns, and severity levels within diverse traffic environments such as urban arterials, highways, school zones, and work zones. The integration of posted speed limit data with CV trajectories further enhances the ability to quantify speeding magnitude and duration across roadway segments. Such insights are critical for evaluating the effectiveness of speed management strategies, identifying high-risk corridors and drivers, and informing data-driven safety interventions ( 6 – 8 ).
The motivation of this study is to utilize an anonymous commercial CV trajectory dataset, which provides extensive coverage across all hours of the day, to identify drivers inclined to risky driving behavior during the trips. Given the growing availability of high-resolution CV data, there is an increasing need for robust methods to quantify driving risk at the individual journey level. A comprehensive driving behavior index can help identify high-risk trips by capturing key behavioral indicators such as speeding, harsh braking, and aggressive acceleration. Such an index is especially valuable for fleet operators, enforcement agencies, and safety analysts aiming to prioritize interventions and monitor risky behavior over time. In addition to identifying risky journeys, it is also important to explore whether a driver’s behavior during the initial minutes of a trip can serve as an early signal for how they are likely to drive for the remainder of the journey. If early behavior proves significant, it could be used as a real-time alert for drivers.
Building on this foundation, the current study pursues two main objectives. First, we propose a method to develop a comprehensive driving behavior index, incorporating speeding, acceleration, braking, and cruising, to identify journeys associated with higher risk. Second, we investigate whether observed early driving behavior (e.g., from the first few minutes of a trip) can be used to explore how a driver behaves for the remainder of the journey. These objectives aim to support both reactive and proactive safety strategies. By identifying unsafe driving patterns early in a trip, the approach enables real-time or near-real-time alerts that can help prevent risky behavior as it occurs. In addition, flagging high-risk journeys after they are completed allows fleet managers to provide targeted feedback or incentives to drivers before their next trip. This dual approach is especially valuable in the fleet management industry, where improving overall driver behavior can enhance safety, reduce fuel costs, and support performance-based programs.
Related Literature
Past studies have increasingly adopted data-driven methods to address speeding/unsafe behavior, evolving from traditional sensors to high-resolution trajectory data. Abdel-Aty et al. ( 9 ) demonstrated that dynamically adjusting variable speed limits upstream and downstream of high-risk areas can enhance safety without compromising travel efficiency. Li et al. ( 10 ) further showed that machine learning models for crash prediction can be effectively transferred across freeway networks. However, these studies primarily relied on sensor-based or simulated data and did not incorporate continuous, driver-specific insights derived from real-world data.
CV technology has transformed traffic safety research by offering high-frequency, trip-level trajectory data. Unlike spot-speed detectors, CV data captures detailed driving behavior across millions of GPS points, including speed, acceleration, and roadway context. This enables identification of speeding hotspots and driver risk profiles while addressing challenges of scale and data complexity ( 3 , 4 ). Ugan et al. ( 6 ) used a large CV dataset and applied XGBoost to predict trip-level speeding with approximately 75% accuracy, highlighting the influence of trip duration and roadway type, showing less speeding in residential areas than on highways. Kong et al. ( 7 ) applied association rule mining to naturalistic driving data, revealing patterns linking speeding to roadway features, traffic conditions, and driver demographics. Desai et al. ( 11 ) used connected truck trajectory data to assess differential speed limit policies across several US states, finding only minor compliance improvements (1–2 mph reductions). Mathew et al. ( 4 ), analyzing over 300 million CV speed records, found that automated enforcement significantly improved compliance (63%–84%) in freeway work zones, compared with 25%–50% without enforcement.
Along with speeding tendency, harsh braking and rapid acceleration are increasingly recognized as key indicators of unsafe driving behavior and hazardous roadway conditions. Simons-Morton et al. ( 12 ) introduced the “kinematic risky driving” index, which combines the frequency of these aggressive events and links them to higher near-term crash risk. A recent study from the Foundation for Traffic Safety identified that hard braking consistently predicts rear-end collisions, particularly on highways, whereas rapid acceleration is more predictive of crash risk in urban settings ( 13 ). Researchers have also leveraged crowdsourced acceleration and braking event data to identify crash hotspots and evaluate safety performance at intersections, work zones, and across urban networks ( 3 , 4 , 14 ). While much of the existing work has provided valuable insights, many studies focus on individual indicators such as speeding or harsh braking, rather than considering the broader context of driving behavior. In this study, we adopt a more comprehensive approach by combining several key behaviors, including speeding, acceleration, and braking, into a single driving behavior index. We also introduce a new component called cruising, which captures gradual increases or decreases in speed. Although often overlooked, this smoother driving style can be an important sign of safer and more consistent behavior. By incorporating aggressive and controlled driving elements, our index provides a more complete view of driver behavior and better reflects the risk levels observed across different journeys.
In studies focused on vehicle acceleration and braking data, weighted scoring models have been proposed, often employing explicit formulas or fuzzy logic to assign variable weights according to event severity. For instance, Eftekhari and Ghatee ( 15 ) developed neurofuzzy models based on smartphone accelerometer data to classify driving behavior severity, while Choudhary and Velaga ( 16 ) integrated multiple telematics metrics, including harsh acceleration and braking, into comprehensive driving scores. Commercial telematics providers also implement weighted scoring systems where braking and acceleration are essential components. Geotab’s Driver Safety Scorecard, for example, attributes significant weights to speeding (20%–30%), hard braking (10%–30%), and acceleration (10%) ( 17 ). Similarly, fleet management systems such as Azuga allocate a substantial weight (30%) to harsh braking, underscoring its strong implications for traffic safety ( 18 ). Insurance telematics programs also prioritize these metrics. Progressive’s Snapshot program significantly penalizes hard braking because of its strong association with crash risk ( 19 ). Tesla’s Safety Score incorporates the proportion of time spent decelerating at rates above 0.3 g, making it a key factor in risk evaluation ( 20 ). Across academic and industry applications, hard braking repeatedly emerges as a critical predictor of unsafe driving, supported by empirical crash data. In our study, we also adopt a weighted approach in constructing the driving behavior index. The specific weights and rationale are detailed in the methodology section.
While numerous studies have demonstrated the importance of braking, acceleration, and speeding in evaluating driver risk, most existing research relies on trip-level or aggregated behavioral metrics, focusing on outcomes after the journey is complete. To the best of our knowledge, no study has explored whether early trip driving behavior, such as acceleration and braking within the first few minutes, can characterize driving patterns over the remainder of the journey. This represents a key limitation in the current literature, particularly given the growing interest in real-time risk detection and proactive safety interventions. To address this gap, the present study investigates whether initial driving behavior can serve as an indicator of later risk. By analyzing high-resolution CV data, we aim to determine whether behavior observed in the first 1, 3, 5, or 7 min of a journey can forecast subsequent aggressive or unsafe driving. This approach has the potential to inform early warning systems, improve safety outcomes, and offer new tools for fleet management and enforcement applications.
Data Description
Study Area and Data Preparation
For this study, CV trajectory data were obtained from the commercial provider StreetLight. The study area encompasses the state boundary of Iowa. The dataset includes anonymized vehicle waypoints, each consisting of a journey ID, timestamp, geographic coordinates (latitude and longitude), and instantaneous speed. These waypoints represent vehicle movements from ignition-on to ignition-off events, typically sampled at 3-second intervals. A cloud-based platform, Amazon Athena, was used to query and filter the data to ensure computational efficiency and scalability. Raw data corresponding to the state of Iowa were exported and subsequently processed using Python to derive behavioral metrics and performance measures. The analysis focused on trip data collected on five Wednesdays in April 2025: April 2, April 9, April 16, April 23, and April 30 (Figure 1 shows a sample of CV data on Iowa roadways).
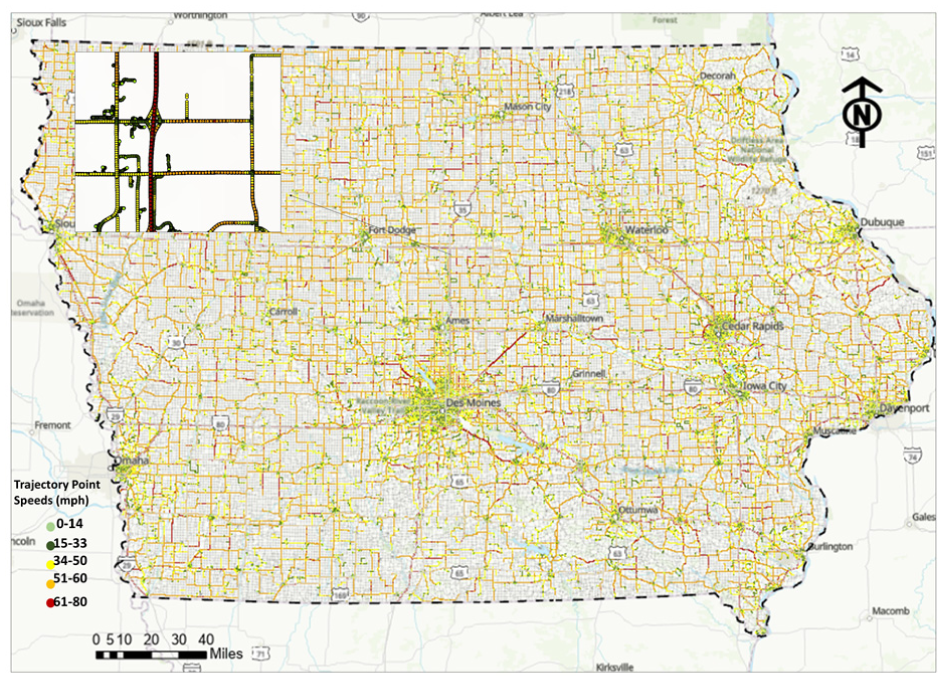
Study area and raw connected vehicle trajectory points in Iowa.
The primary objective of this study is to leverage CV trajectory data to both develop a comprehensive driving behavior index and examine whether early trip behavior can predict driving tendencies throughout the rest of the journey. To support these goals, we retained trips with durations between 10 min and 2 h. This range ensures that each trip includes enough data to meaningfully capture both initial driving behavior and sustained driving patterns, while excluding extremely short trips that lack sufficient behavioral context and abnormally long trips that may reflect atypical driving conditions. Multiple filtering steps were applied to improve data reliability. Trips were excluded if more than 5% of ping intervals (the interval between two consecutive records) exceeded 10 s, or if a single ping gap was greater than 15 s, as such anomalies often indicate poor GPS signal or device issues. In addition, trips that started or passed through areas outside the state of Iowa were filtered out to focus exclusively on in-state driving behavior. The first two minutes of each trip were also removed, as these often reflect idling or ignition-related activities that do not represent consistent travel behavior. Each CV waypoint was then spatially joined with Iowa’s Roadway Asset Management System (RAMS) shapefile to associate waypoints with road segment attributes, including posted speed limits. This spatial join enabled evaluation of speed compliance and allowed further contextualization of driving behavior across different road types.
Additional filters were applied to address behavioral outliers. Trips with an initial speed exceeding 70 mph were removed to exclude unrealistic values, which may result from GPS error or atypical vehicle behavior. Trips were also discarded if more than 50% of their speed records showed 0 mph, indicating prolonged idling or possible tracking failure. For the remaining valid trips, several behavioral indicators were computed, including the proportion of time spent speeding (exceeding posted speed limits), the frequency of hard braking and hard acceleration events, and the share of time spent cruising at stable speeds. Acceleration and deceleration events were further categorized by severity to better reflect driving intensity and possible aggressiveness. Composite behavioral indices were then calculated across different temporal segments: the first 1, 3, and 5 min, the remainder of the trip, and the entire trip duration. These indices integrate multiple metrics, including speeding, aggressive maneuvers, and cruising stability, to characterize both early trip tendencies and overall driving style. These behavioral profiles offer a valuable basis for identifying patterns of driving behavior and examining how early trip movements may be associated with later instances. The details of each metric are described in the methodology section. In total, the processed dataset included approximately 333,174 trips and 105 million pings. To make the data preparation steps clearer, the trajectory cleaning criteria are summarized as:
Only trips between 10 min and 2 h were retained to ensure enough information from both the early segment and the remainder of the journey.
Trips were dropped if more than 5% of ping intervals exceeded 10 s or if any single ping gap was over 15 s, as these cases typically indicate poor GPS reception.
Trips that began outside Iowa or crossed into neighboring states were removed to focus the analysis strictly on in-state driving patterns.
The first two minutes of each trip were excluded because they often reflect idling and ignition-related activity rather than meaningful driving behavior.
Trips with an initial speed greater than 70 mph or those with more than 50% of speed records at 0 mph were removed.
All remaining waypoints were spatially joined with Iowa’s RAMS network to assign posted speed limits.
Driving Behavior Classification
To understand how speeding behavior varies across different roadway environments, we examined the cumulative distribution of speeding proportions by facility type, as shown in Figure 2. One-way roadways represent the northbound or eastbound directions of divided roadways. Two-way roadways represent undivided roadways ( 1 ). In Iowa, the majority of the data falls under two-way undivided roadways, which account for approximately 34,390 mi, followed by one-way roadways (880 mi). Ramp segments make up around 222 mi. Given their limited coverage and lack of interpretability, we excluded nonmainline, planned unbuilt, and not specific/unidentified facility types from subsequent analyses ( 21 ).
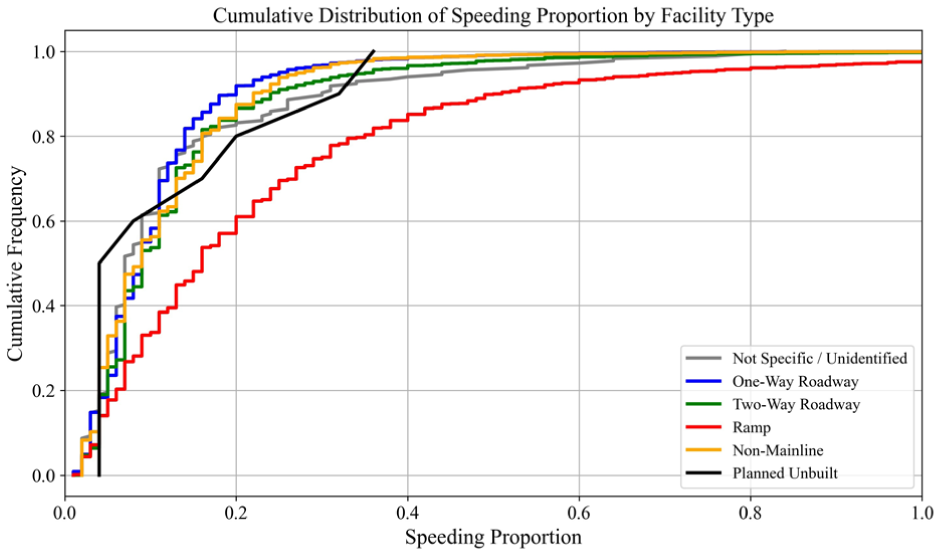
Cumulative distribution of speeding proportion by facility type.
The speeding proportion represents the share of each trip during which the vehicle exceeded the posted speed limit. The results reveal noticeable differences across facility types (Figure 2). Ramps demonstrate a higher tendency for speeding, which is expected given the physical design of ramps, where adhering to posted speed limits can be difficult because of merging and exiting. Notably, two-way undivided roadways also show higher speeding proportions compared with one-way roadways. This is particularly concerning, as two-way roads lack a physical median and many of these segments are located on rural roads in Iowa, where higher speeds pose an increased risk of head-on and run-off road crashes.
To classify different driving behaviors, we used CV trajectory data to identify acceleration and braking events based on acceleration thresholds. The CV data does not have the raw acceleration data. The acceleration has been derived by taking the difference of two consecutive speeds and dividing by the time interval. Events were classified into categories based on widely accepted threshold ranges. Normal braking events were defined as deceleration values less than 0.2 g, while near-miss crash braking events were those exceeding 0.45 g, and hard braking fell between 0.2 g and 0.45 g. For acceleration, normal acceleration was defined as values below 0.2 g, high acceleration ranged from 0.2 g to 0.45 g, and aggressive acceleration included any values greater than 0.45 g. These categories were used to quantify the frequency of different driving behaviors across different facility types in the datasets.
Figure 3 shows the distribution of acceleration and braking events by facility type. Two-way roadways exhibit the highest number of events across all categories, including normal, high, and extreme behaviors, followed by one-way roadways and ramps. This is partly because of the greater mileage associated with two-way roads in Iowa, which naturally leads to more recorded events. In Figure 3a, the proportions of normal acceleration and normal braking events are fairly consistent across the different facility types. However, both Figure 3b and Figure 3c show that braking-related events, such as hard braking and near-miss crash braking, occur more frequently than their corresponding acceleration events. Notably, Figure 3c reveals a higher number of near-miss crash braking events on one-way roadways (compared with Figure 3a and Figure 3b), which is a potential safety concern. While the underlying causes of this pattern are beyond the scope of this study, it highlights an important area for future research, particularly to understand why one-way facilities may be more prone to such high-risk braking behavior.
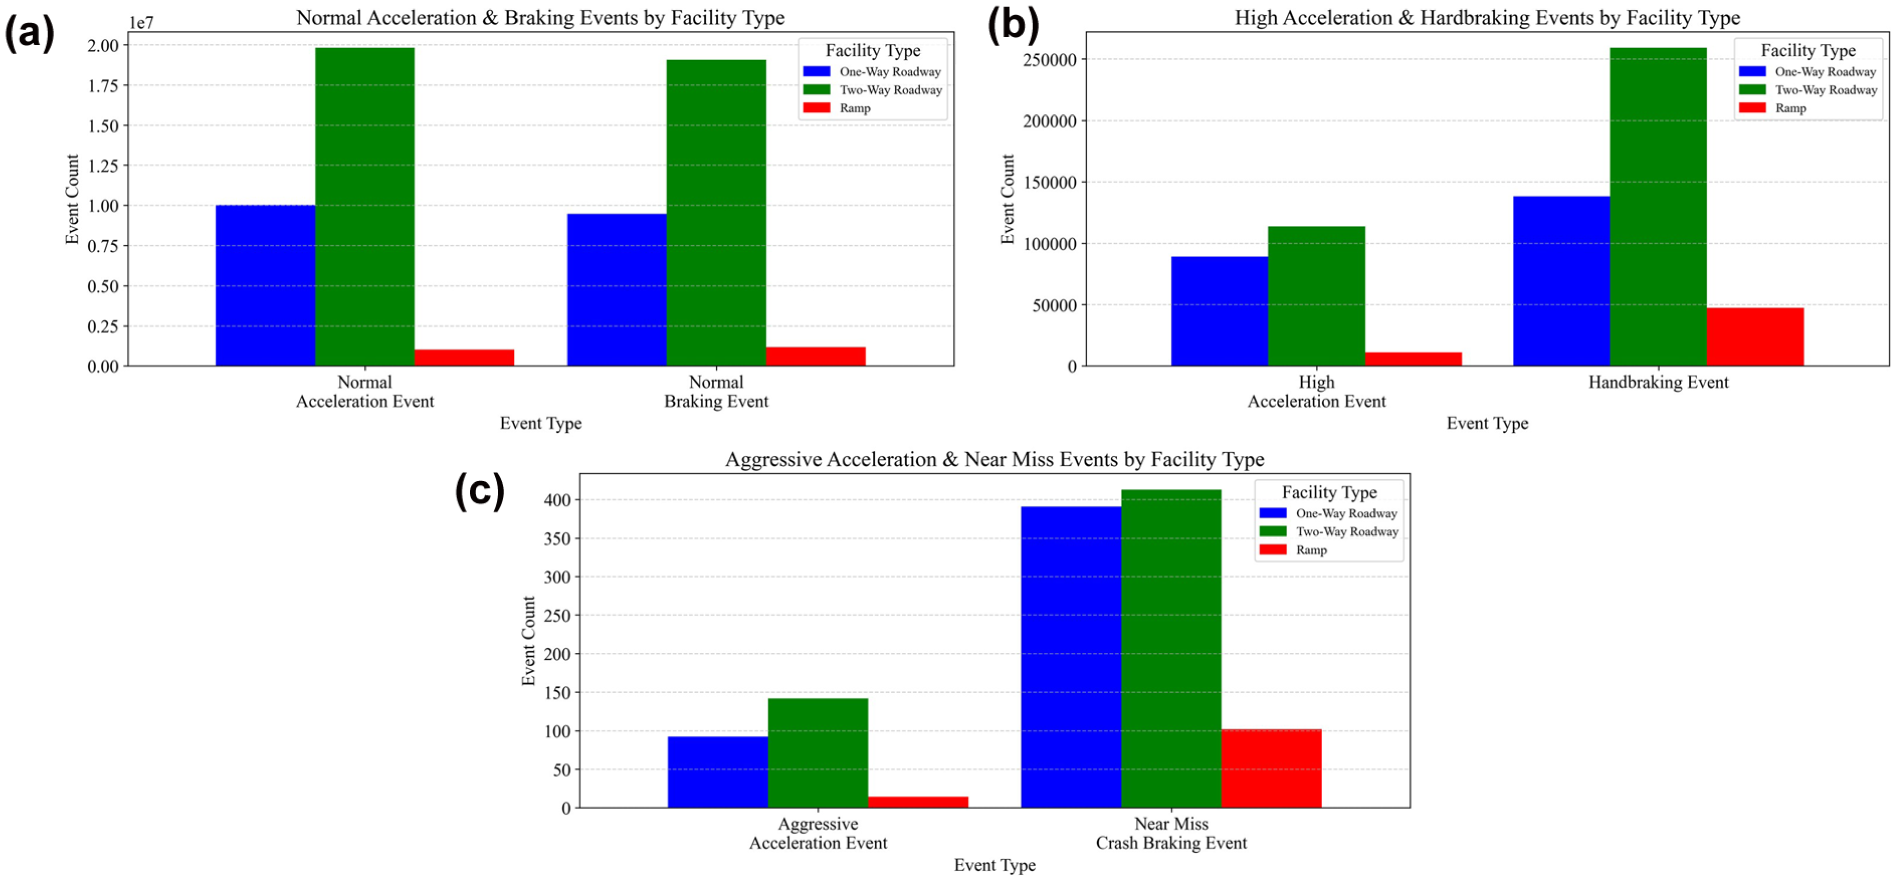
Distribution of acceleration and braking event types by facility type: (a) normal acceleration and braking events, (b) high acceleration and hard-braking events, and (c) aggressive acceleration and near-miss crash braking events.
Methods
Metrics for Developing a Driving Behavior Index
The first objective of this study is to develop a comprehensive driving behavior index to identify high-risk journeys. To create this index, we relied on metrics commonly associated with dangerous driving behaviors, as reported in the literature, explicitly focusing on four key components: speeding, acceleration, braking, and cruising. Each entry in the CV dataset represents a timestamped observation from an individual journey, including latitude, longitude, speed, and acceleration. We derived multiple metrics from these records corresponding to each behavioral component, collectively forming the basis of the proposed driving behavior scoring method. These metrics are detailed below:
Speeding Proportion
In a prior study that utilized probe data from Wejo, comprising approximately 273 million GPS points collected over two weeks and representing nearly 900,000 vehicle trips in Florida, researchers employed the speeding proportion to indicate risky driving behavior across various roadway types ( 6 ). Considering the context and available dataset, we adopted a similar metric to quantify speeding behavior in our analysis. The speeding proportion for each record was calculated as:

where P r denotes the speeding proportion, Vobs is the observed vehicle speed, and Vlimit represents the posted speed limit. Only positive values of the speeding proportion were considered. For example, if the vehicle speed at a given location is below the posted speed limit, it is treated as zero, indicating no speeding.
Braking Behavior
Hard braking is widely recognized as one of the most significant indicators of driving behavior associated with higher risk ( 22 ). Several studies have used varying deceleration thresholds to define hard braking events. For example, a deceleration threshold of 0.272 g has been used to identify typical hard braking ( 23 ), while more severe thresholds, such as 0.45 g, have been applied to capture near-miss crash events ( 22 , 24 ). In this study, braking events were categorized based on deceleration intensity, using threshold values informed by findings from the existing literature.
Near-miss crash braking: deceleration greater than 0.45 g
Hard braking: deceleration between 0.2 g and 0.45 g
Normal braking: deceleration less than 0.2 g.
Here, “g” denotes gravitational acceleration (32.2 ft/s2). These thresholds align with standards from prior research as previously mentioned. We expanded the analysis to include normal braking to assess broader safety implications and fuel efficiency, which are particularly relevant to freight transportation ( 22 , 24 , 25 ).
Acceleration Behavior
Similar to braking, this study classifies the acceleration events into three categories:
Aggressive acceleration: acceleration greater than 0.45 g
High acceleration: acceleration between 0.2 g and 0.45 g
Normal acceleration: acceleration less than 0.2 g.
This categorization allows for capturing diverse levels of driving aggressiveness.
Cruising Behavior
Cruising behavior is a novel metric in relation to assessing driving behavior introduced in this study. The term “cruising” refers to instances where the driver increases or decreases speed gradually, rather than making abrupt changes. This metric was included because smooth speed transitions are often associated with safer and more fuel-efficient driving practices. Sudden acceleration or deceleration can increase the likelihood of crashes, particularly in congested or urban environments, and contribute to higher fuel consumption. In contrast, cruising reflects a more controlled driving pattern, which may indicate better anticipation of traffic conditions and adherence to safe driving practices.
The study examined both lead and lag records for each data point to identify cruising behavior. If the acceleration between consecutive points remained within the range of −1 to +1 mph/s, the corresponding record was classified as cruising. This approach enables us to distinguish drivers who consistently manage speed smoothly, which may be a proxy for safer driving behavior.
This study did not consider speed error or latency for the CV data. Recent studies have shown that CV data, even with an average market penetration rate of about 6%, exhibits a speed bias of approximately −0.8 mph and a mean detection latency close to 0 min, both of which are minimal and support the suitability of the data for this type of analysis. Moreover, since all CV data used in this study were obtained from the same vendor and within the same state, the speed error was reasonably assumed to be uniform across the study area ( 26 , 27 ). It is important to note that the dataset does not include information about vehicle make, model, or onboard systems. Therefore, the study did not distinguish whether cruising behavior resulted from adaptive cruise control systems or individual driving tendencies.
Driving Behavior Index
After identifying the metrics previously described, the average value of each metric was computed for every journey identification. Since the duration of journeys varies significantly, using raw counts (e.g., the total number of near-miss crash events) could introduce bias. To address this, the average number of events per record was used instead of total counts, allowing for fair comparison across trips of different lengths.
In addition to event frequency, the severity of acceleration and braking events was also considered, as this aspect is commonly used in driver scoring systems based on telematics data. Severity is represented by the average magnitude of acceleration or deceleration for each journey ( 28 ). The following variables were computed for each journey by calculating the average over all records:
Average speeding proportion
Average number of near-miss crash braking events
Average number of hard braking events
Average number of normal braking events
Average number of aggressive acceleration events
Average number of high acceleration events
Average number of normal acceleration events
Average deceleration during near-miss crash braking events (ft/sec2)
Average deceleration during hard braking events (ft/sec2)
Average deceleration during normal braking events (ft/sec2)
Average acceleration during aggressive acceleration events (ft/sec2)
Average acceleration during high acceleration events (ft/sec2)
Average acceleration during normal acceleration events (ft/sec2)
Average number of cruising events.
After aggregating the metrics for each journey, all values were normalized using min–max scaling to ensure comparability across different variables. Following normalization, a weighted scoring scheme was applied to reflect the relative severity of different driving behaviors.
To assign proper weights to each driving behavior variable, we used confirmatory factor analysis (CFA) with a hierarchical structure ( 29 , 30 ). CFA is a type of structural equation modeling that holds the relationship between observed indicators and unobserved latent variables. In this case, the actual driving behavior is an unobserved latent variable which cannot be measured directly, but we have variables that are indicators of this latent variable. We specified a hierarchical CFA model with two first-order latent factors (Acceleration and Braking) and a second-order latent factor (Risky Driving). The Acceleration factor included six indicators: aggressive acceleration, aggressive acceleration severity, high acceleration, high acceleration severity, normal acceleration, and normal acceleration severity. The Braking factor included six indicators: braking near-miss severity, braking near-miss events, normal hard braking severity, normal hard braking events, normal braking severity, and normal braking events. The second-order Risky Driving factor was defined by the Acceleration and Braking factors, as well as two directly observed indicators: cruising time and speeding proportion. Standardized factor loadings (Std.all) were used to quantify each variable’s contribution, and final variable weights were computed by multiplying the loading of each indicator on its latent factor by the loading of that latent factor on the Risky Driving factor. The results show that aggressive acceleration (0.771) and aggressive acceleration severity (0.865) are the strongest contributors within the acceleration domain, while braking near-miss severity (0.942) and braking near-miss events (0.675) dominate the braking domain. Normal acceleration and braking indicators had near-zero weights, indicating that actually normal acceleration and normal braking are indicators of safer driving behavior. Cruising received a small negative weight (−0.005), reflecting its protective nature, whereas speeding proportion contributed positively, indicating that riskier behavior increases with higher speeding proportions (0.012). Together, these weights form a composite index that emphasizes high-risk behaviors over routine driving patterns. Table 1 presents the results and final weights estimated from the CFA analysis.
Weight Estimation from CFA models
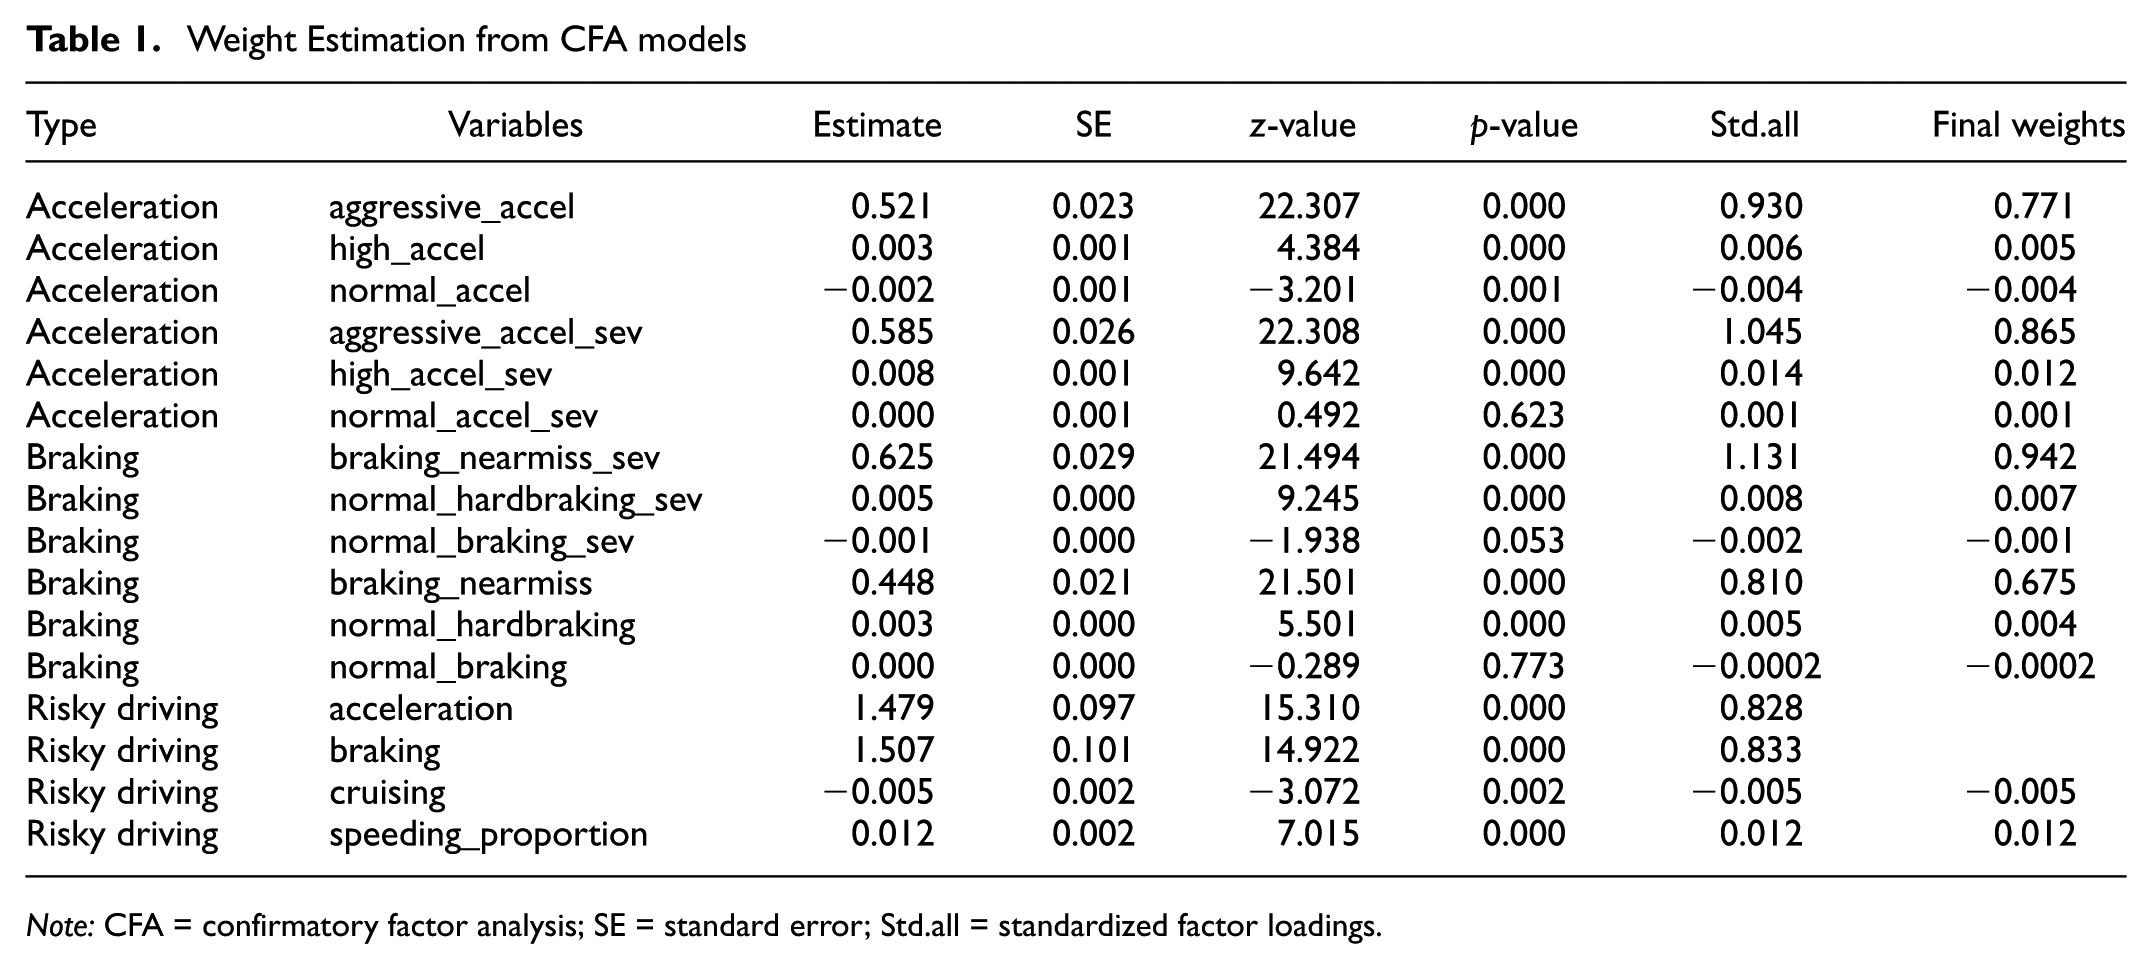
Note: CFA = confirmatory factor analysis; SE = standard error; Std.all = standardized factor loadings.
From the CFA estimation, the driving behavior index was computed by using the last column in Table 1:

where
xi = standardized value of driving behavior indicator in data (e.g., aggressive acceleration severity, high acceleration, near-miss braking)
wi = CFA-derived weight for indicators (from Table 1)
S = average speeding proportion
C = average number of cruising events.
Once the driving behavior index was calculated, journeys were sorted based on their index values, with higher scores indicating riskier driving behavior. This approach can be valuable for organizations subject to speed and safety enforcement, such as Uber, Lyft, Departments of Transportation, and trucking companies, to identify trips that exhibit unsafe driving patterns ( 24 ).
However, it is important to note that travel time can influence driving behavior, as supported by previous studies. To account for this, the analysis grouped journeys into three categories based on travel duration: less than 20 min, 20 to 40 min, and more than 40 min. This grouping allows for more meaningful comparisons by evaluating trips of similar length within each travel time category.
Characterize Driving Behavior
In the second part of this study, the study examined whether a driver’s behavior observed during the early portion of a journey could be indicative of their driving behavior later in the trip. Understanding this relationship is important for potential applications such as issuing early real-time safety warnings based on initial driving patterns.
To investigate this, data were extracted from the first 1, 3, 5, and 7 min of each journey, and the same set of driving behavior metrics described in the previous section, including those related to acceleration, braking, speeding, and cruising, were aggregated. These metrics were also computed for the remainder of the journey beyond each respective time window. For example, for a 25-minute trip, the driving behavior metrics were aggregated for the first 1 min and for the remaining 24 min. The same process was repeated for the 3-, 5-, and 7-minute intervals. This allowed for the creation of paired summaries of early and later period driving behavior for each trip.
A quantile regression model was employed to analyze the relationship between early and subsequent driving behavior. The objective was to determine whether behavior observed in the initial minutes of driving could statistically predict driving tendencies during the remainder of the journey. Four response variables were defined to represent driving behavior during the remaining portion of the trip (note that no weighting was applied when calculating these indices):
Acceleration Index: the sum of the average acceleration for the rest of the trip, including aggressive, high, and normal acceleration events.
Braking Index: the sum of the average deceleration for the rest of the trip, including near-miss crash braking, hard braking, and normal braking events.
All Index: the combined sum of average acceleration, deceleration, and speeding proportion during the remainder of the trip, minus the average number of cruising events (to account for safer driving behavior).
Speeding Proportion: the average speeding proportion during the remainder of the trip.
Unlike the earlier index and overall driving behavior index discussed earlier, no weighting was applied when creating the indices for this part of the analysis. Several metrics were extracted from the first 1, 3, 5, and 7 min of each journey for the independent variables. These included: near-miss braking deceleration, hard braking deceleration, normal braking deceleration, aggressive acceleration, high acceleration, normal acceleration, cruising proportion, and speeding proportion. To avoid redundancy, highly correlated variables were removed from the analysis.
Because the objective was not only to examine how early behavior affects the average (mean) outcome but also to understand its influence across the distribution of driving behavior (e.g., among lower-risk versus higher-risk drivers), quantile regression was employed. This approach provided a more detailed understanding of how early driving patterns relate to subsequent driving behavior throughout the remainder of the trip.
Quantile Regression
Quantile regression allows different quantiles of the response variable’s conditional distribution to be modeled as functions of observed covariates, providing a more comprehensive understanding of relationships beyond the conditional mean ( 31 ). It has been employed in various studies to predict deceleration rates ( 24 ) and to analyze speed data in transportation research ( 32 ). Robust regression produces a single central tendency estimate, typically reflecting effects around the conditional mean, and therefore cannot characterize heterogeneity in behavioral responses among low-, medium-, and high-risk drivers. In contrast, quantile regression allows the model to estimate relationships at the 20th, 50th, and 80th percentiles of the driving behavior, revealing how early driving behavior influences more aggressive drivers differently from low-risk drivers.
The foundation of quantile regression lies in a generalized definition of sample quantiles that does not rely on ordering the sample observations, making it well suited for extension to linear models (
33
). Given a random sample

Quantile regression was used in this analysis because the interest extended beyond the mean; the goal was to understand how early driving behavior influences different percentiles of the Acceleration Index, Braking Index, and Speeding Proportion. Specifically, the 0.2, 0.5, and 0.8 quantiles were examined to capture how the effects of covariates vary across the distribution of these outcomes. Higher quantile values generally correspond to riskier driving behavior, making this approach particularly useful for identifying patterns across varying levels of driver risk.
Results
Driving Behavior Index
The results of this study are presented in two parts. First, we developed a driving behavior index based on the outlined methodology. Figure 4 displays the distribution of this index using a histogram, where higher values indicate riskier driving behavior.
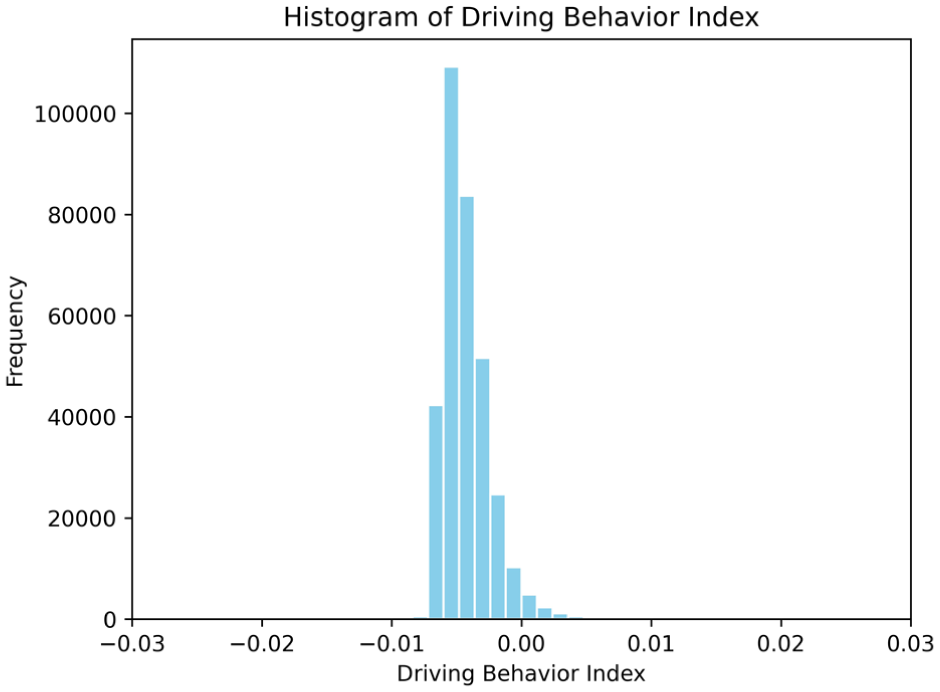
Histogram of driving behavior index.
The distribution is highly left-skewed, with the vast majority of trips falling less than zero (0), which is probably the indicator of most of the drivers following a normal driving condition based on the combined metrics of speeding, acceleration, braking, and cruising. Only a small number of trips register values above 0, with very few extending beyond 0.5 (not shown in Figure 4), reflecting isolated instances of high-risk driving. This distribution highlights that while aggressive driving is generally infrequent, the index is effective in distinguishing trips that may warrant further attention or intervention.
To illustrate the variation, we selected journeys representing high, average, and low driving behavior index scores. Figures 5 to 7 show comparative speed and acceleration profiles for journeys with high, medium, and low driving behavior index. High-index trips exhibit frequent sharp accelerations, erratic speed fluctuations, and repeated speeding, suggesting aggressive and unsafe driving behavior. Medium-index trips still show variability but with more moderated acceleration and better alignment with speed limits. In contrast, low-index trips display smooth acceleration patterns and consistent adherence to posted speed limits, reflecting stable and safe driving. The visual differences clearly demonstrate that higher driving index scores are associated with more volatile and risky behavior, validating the index as a reliable behavioral metric.
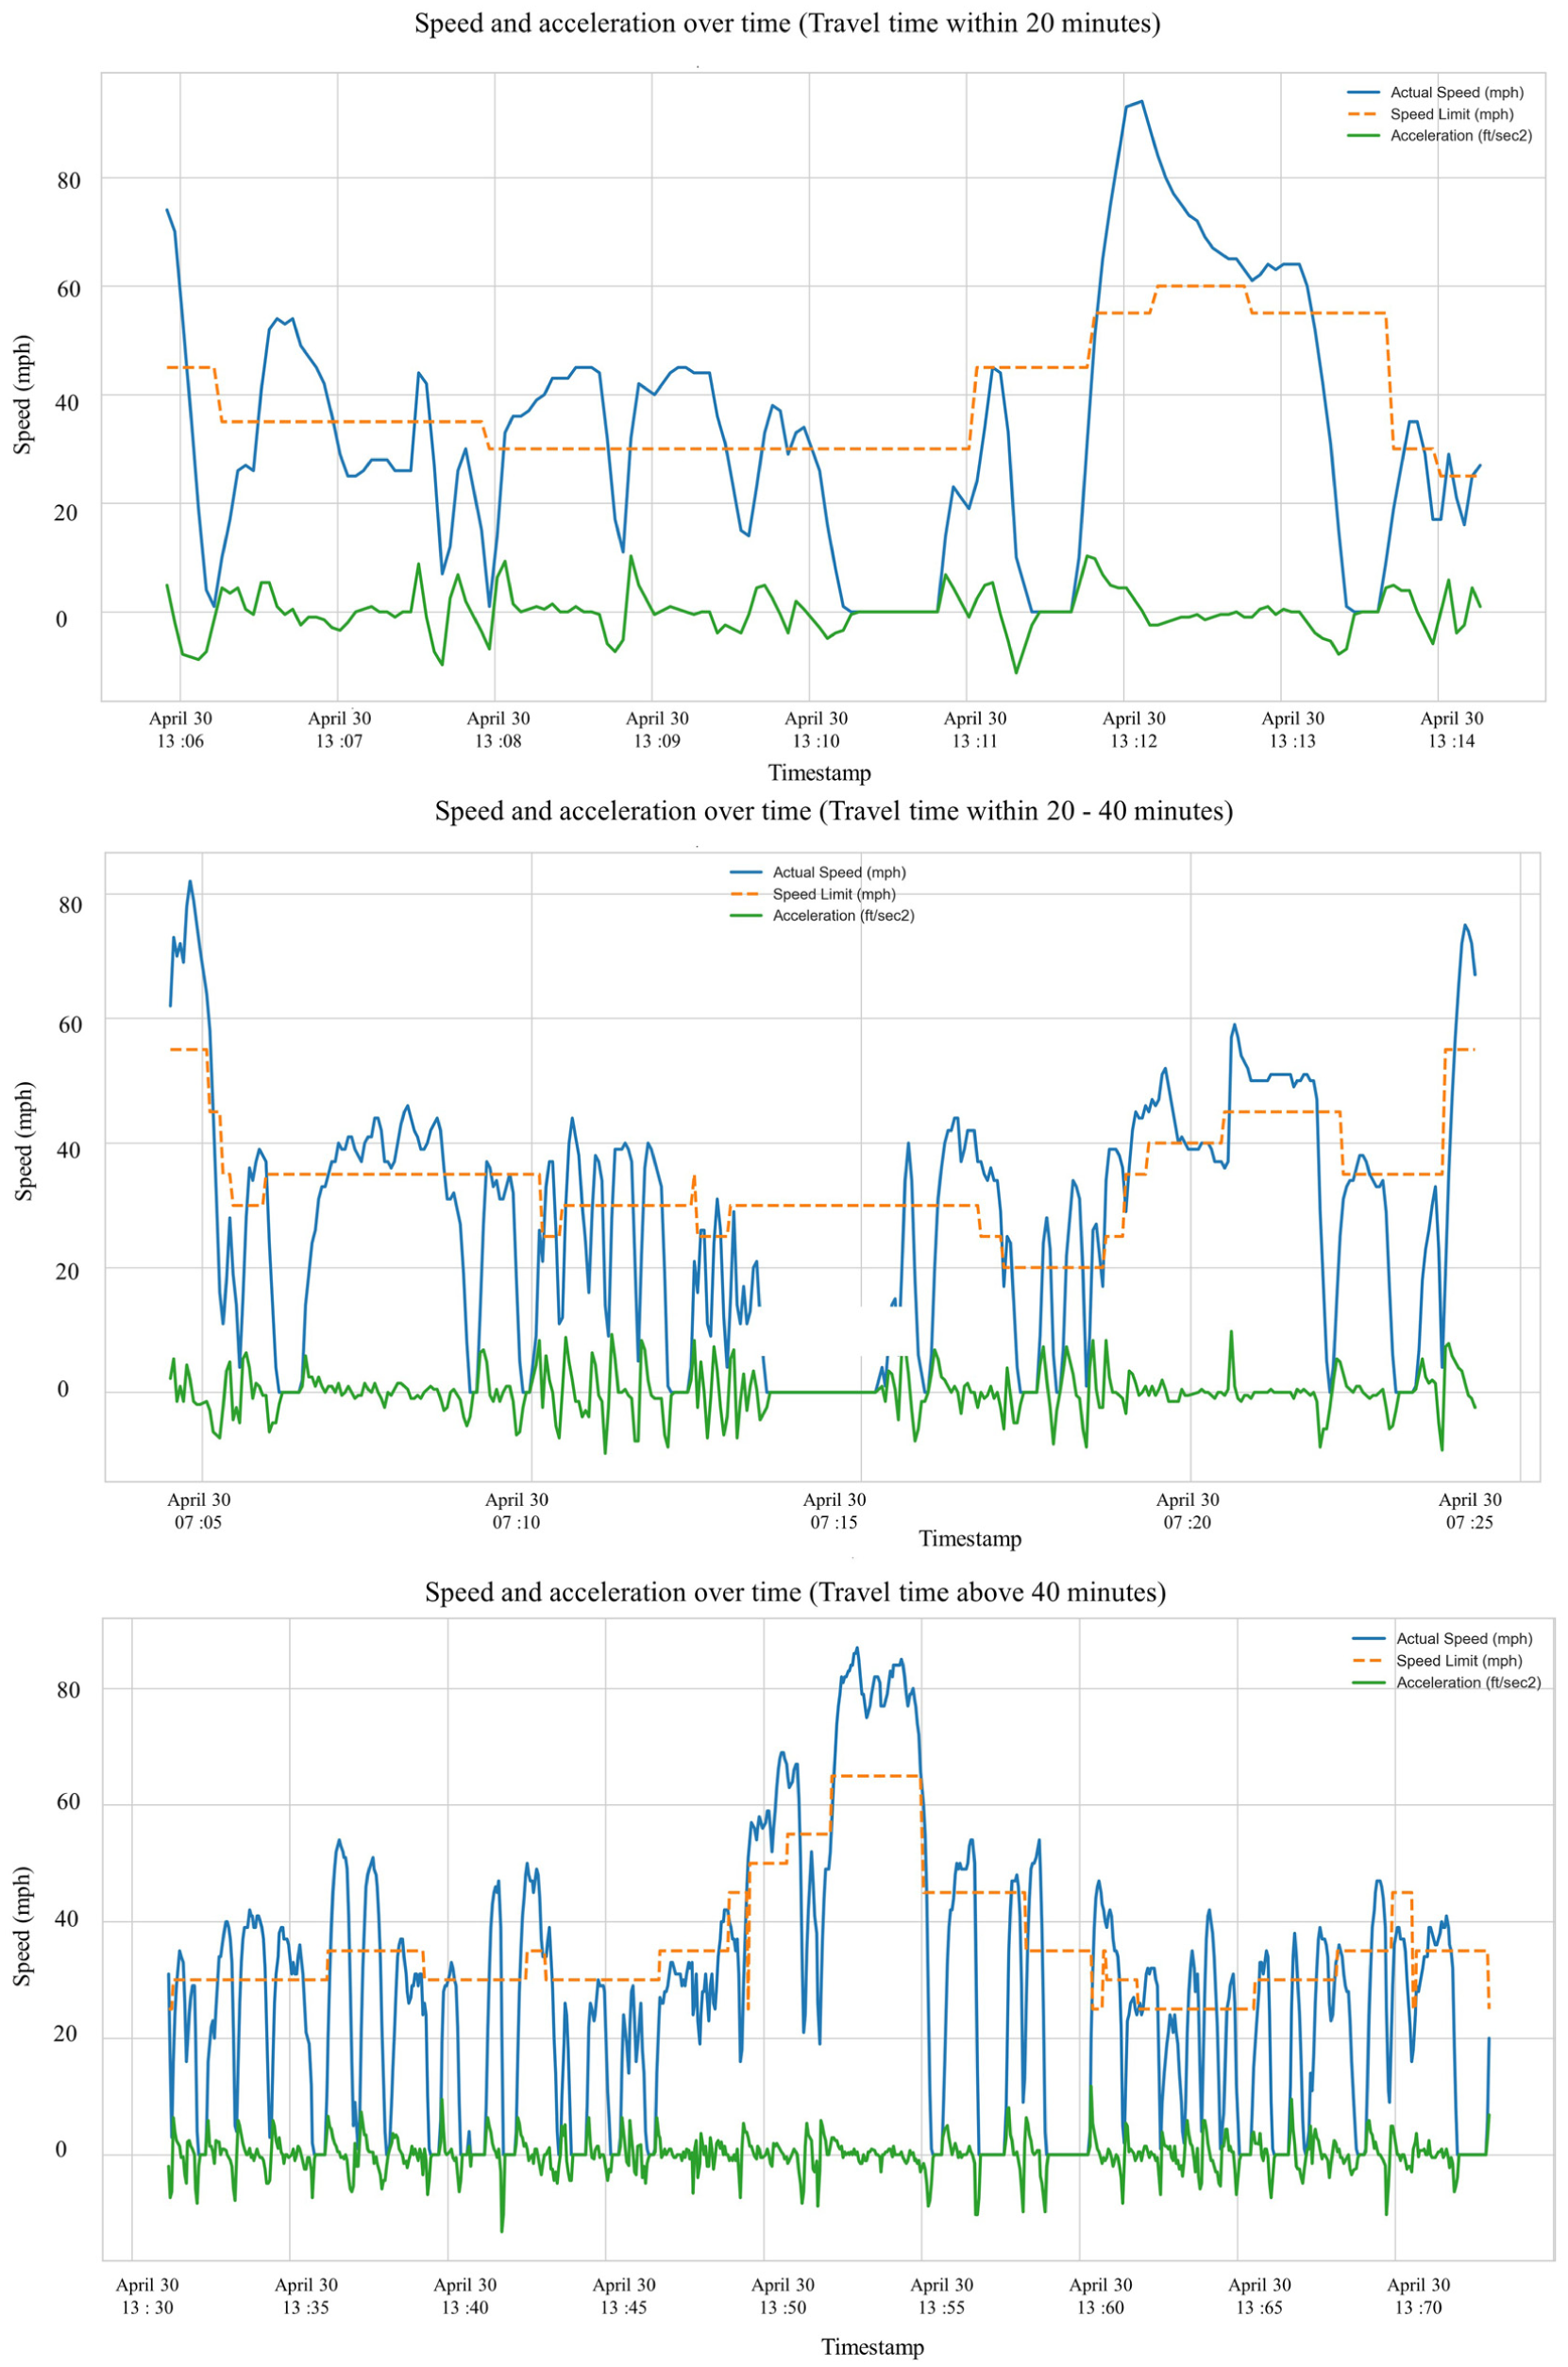
Speed and acceleration profile for journeys with high driving behavior index.
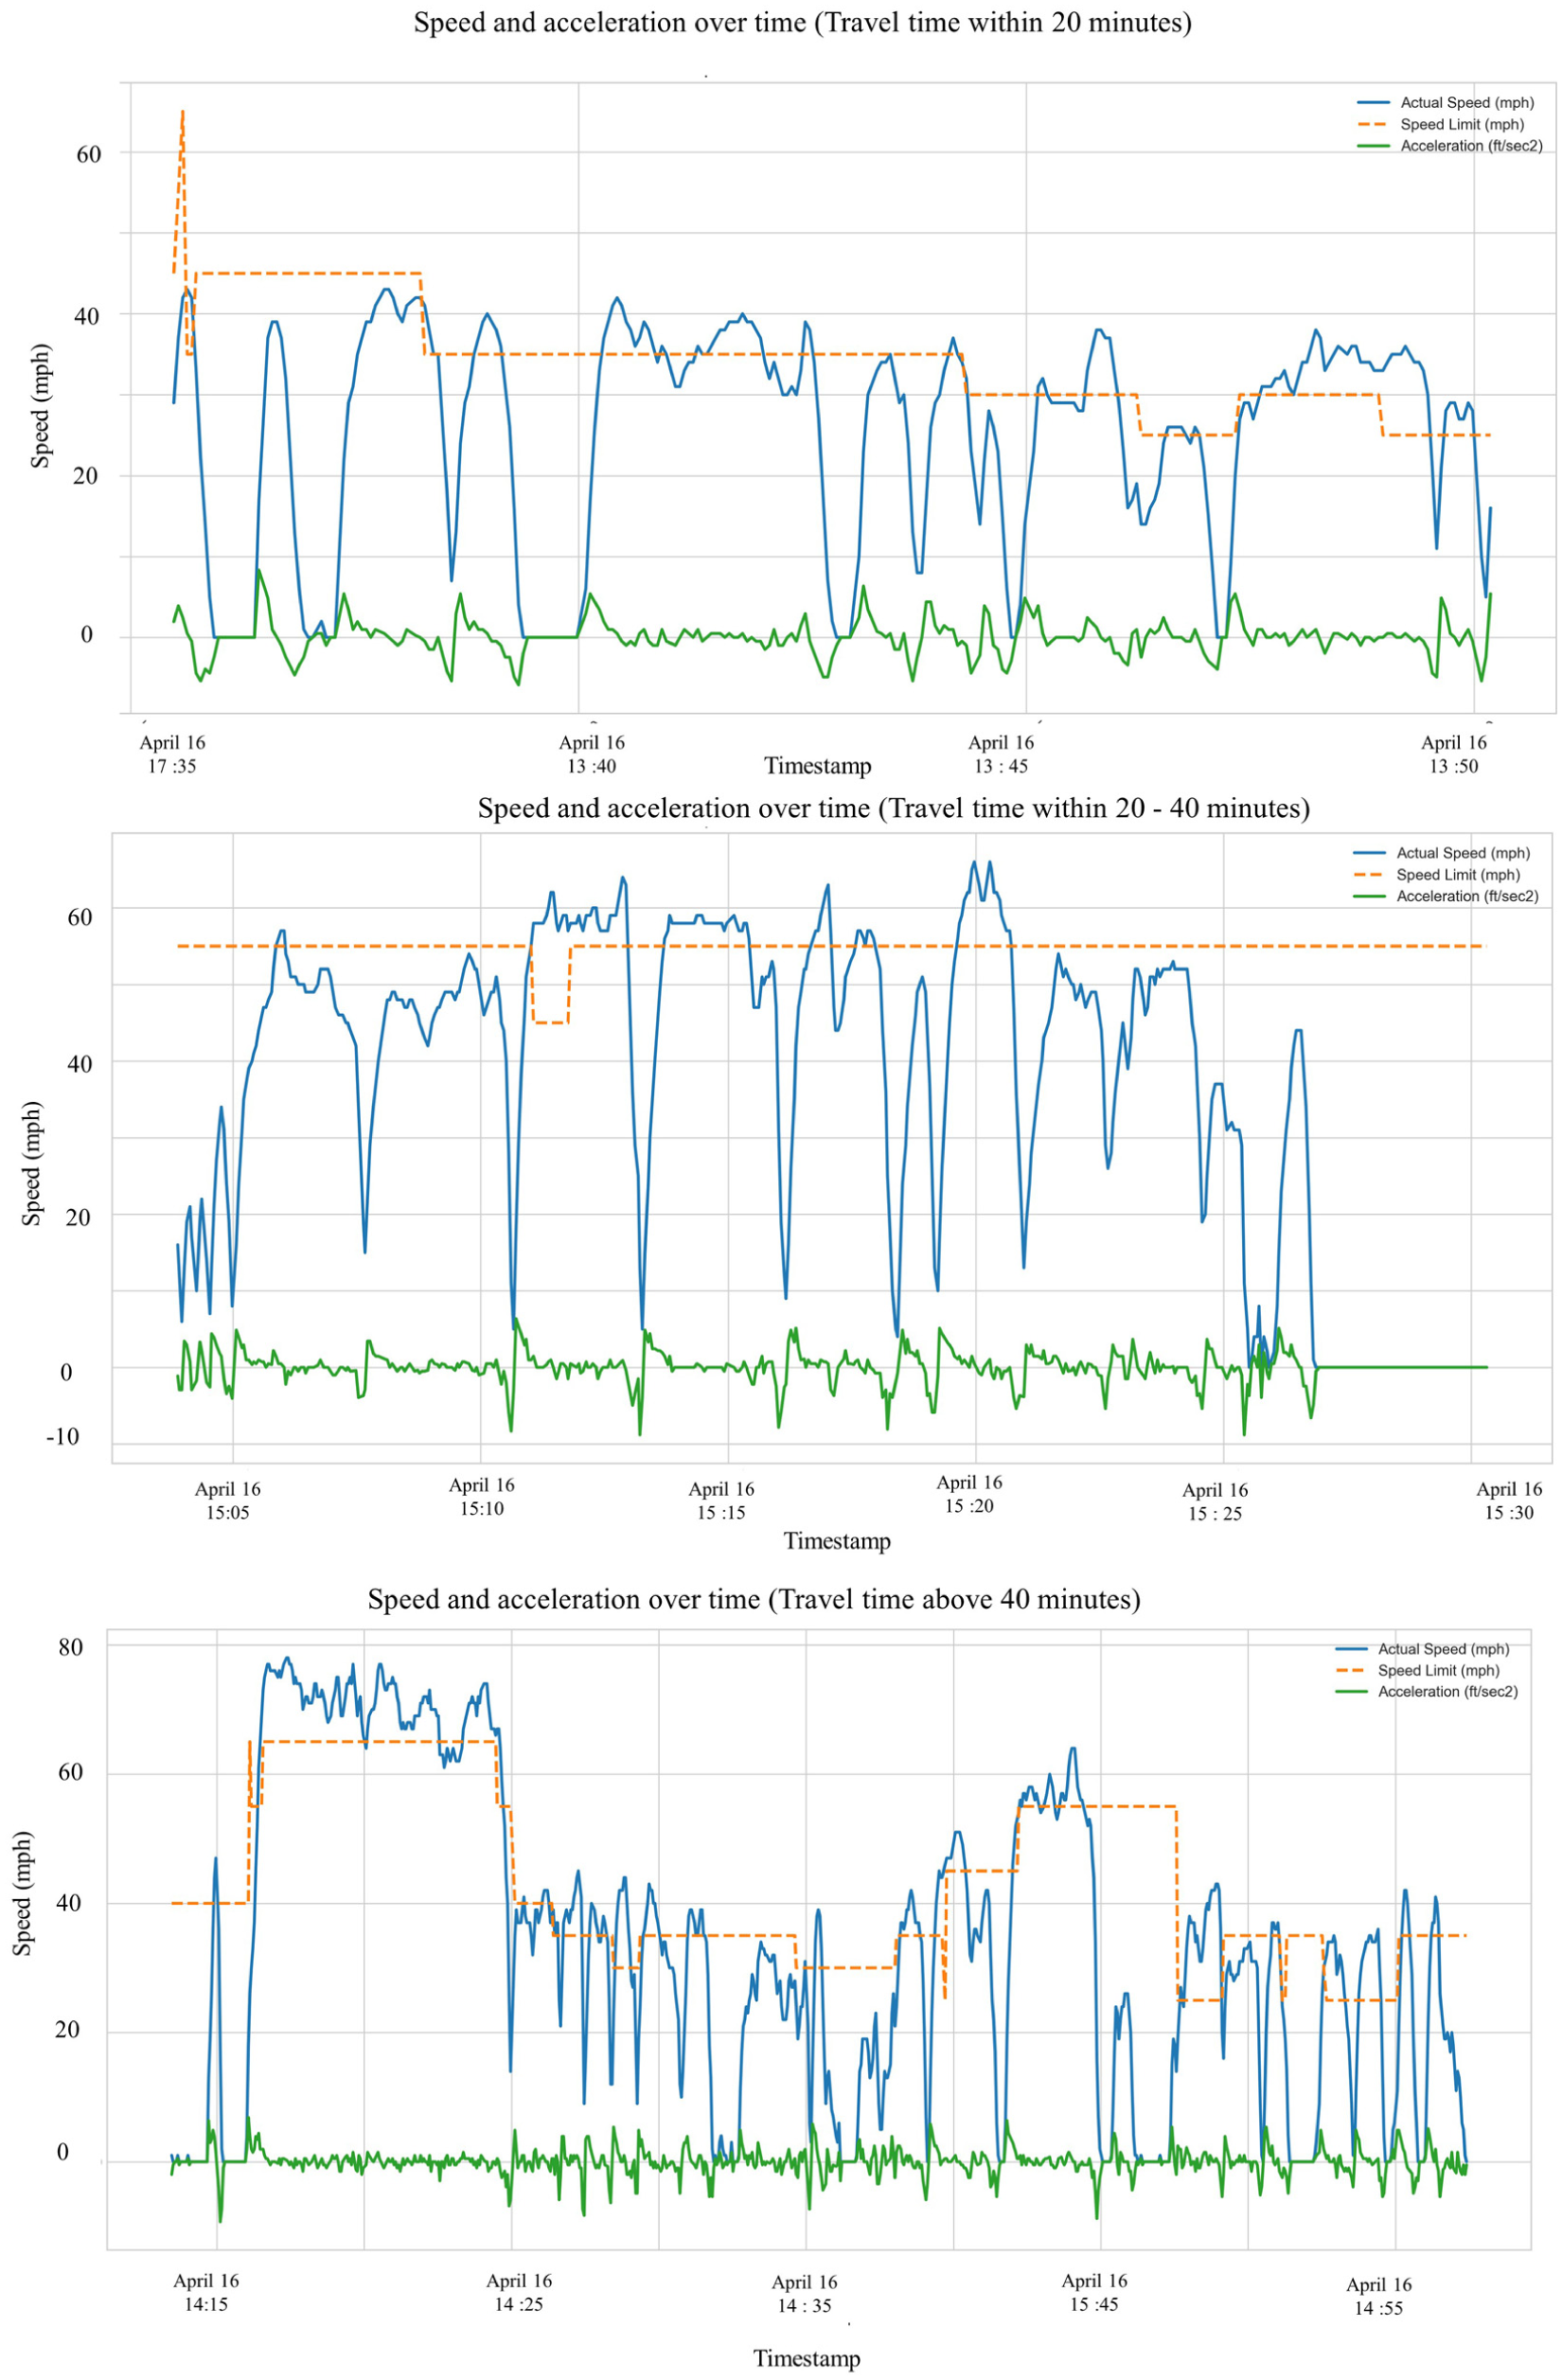
Speed and acceleration profile for journeys with medium driving behavior index.
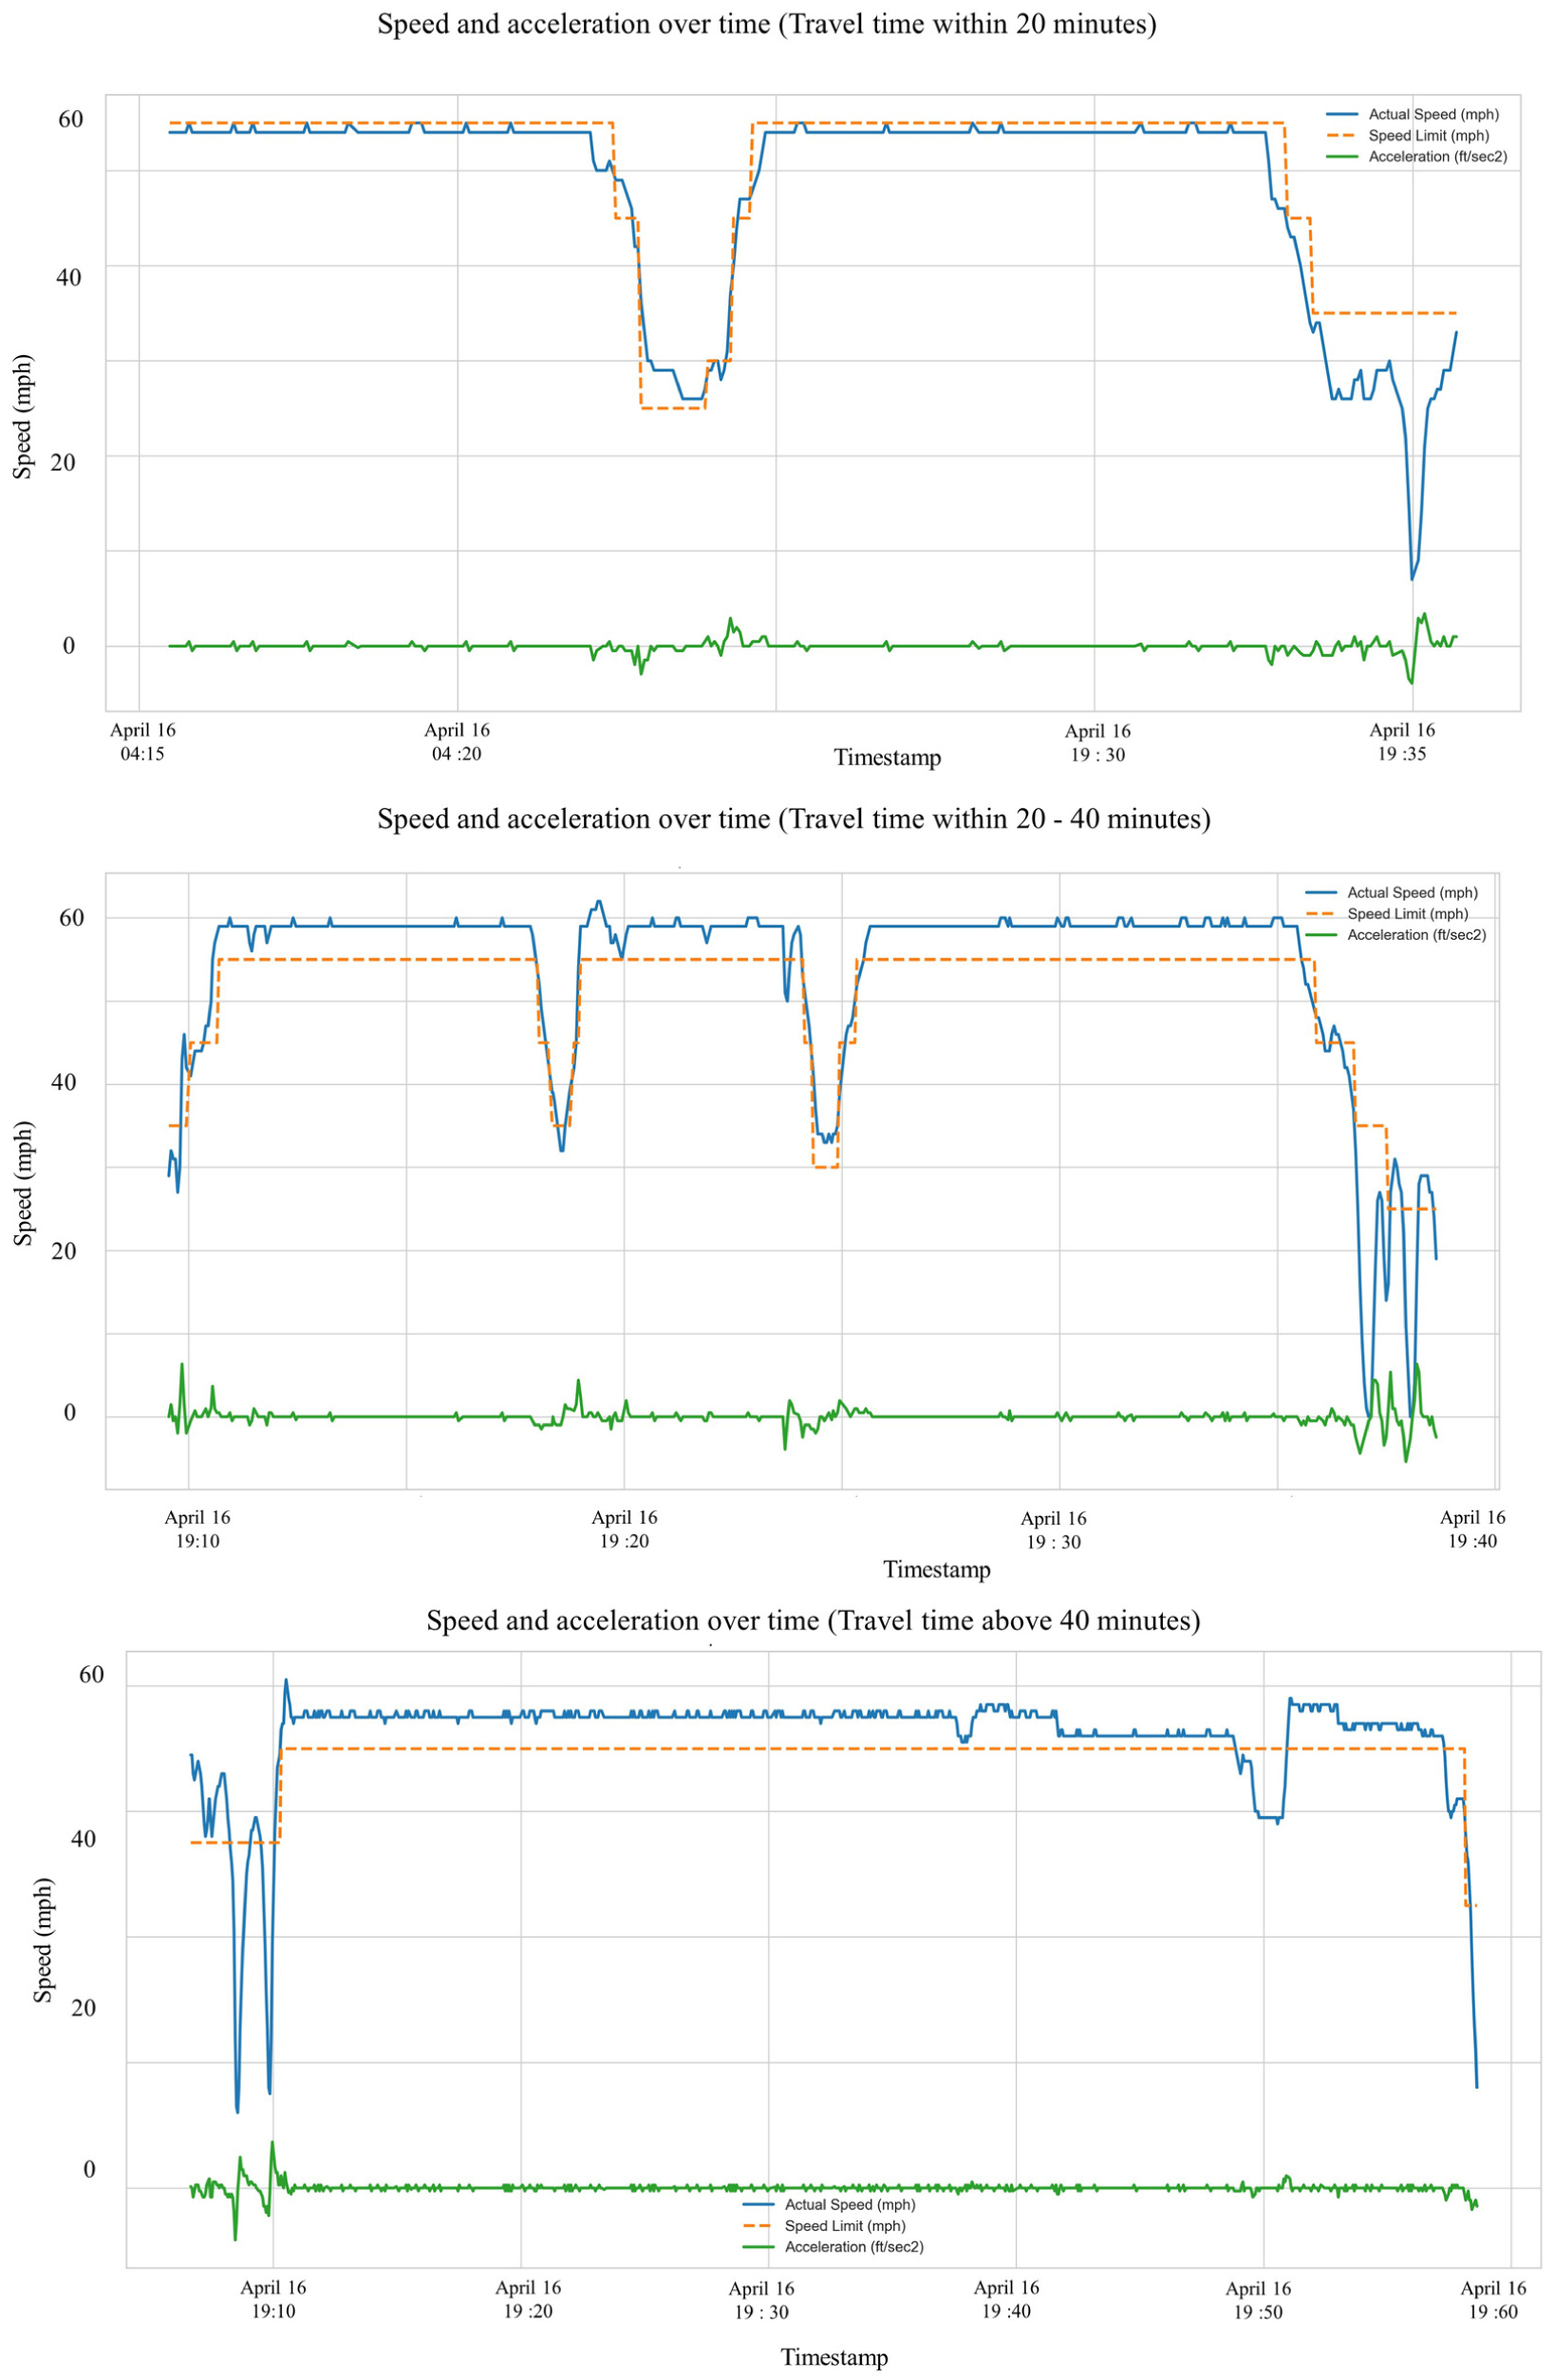
Speed and acceleration profile for journeys with low driving behavior index.
Early Driving Behavior Analysis
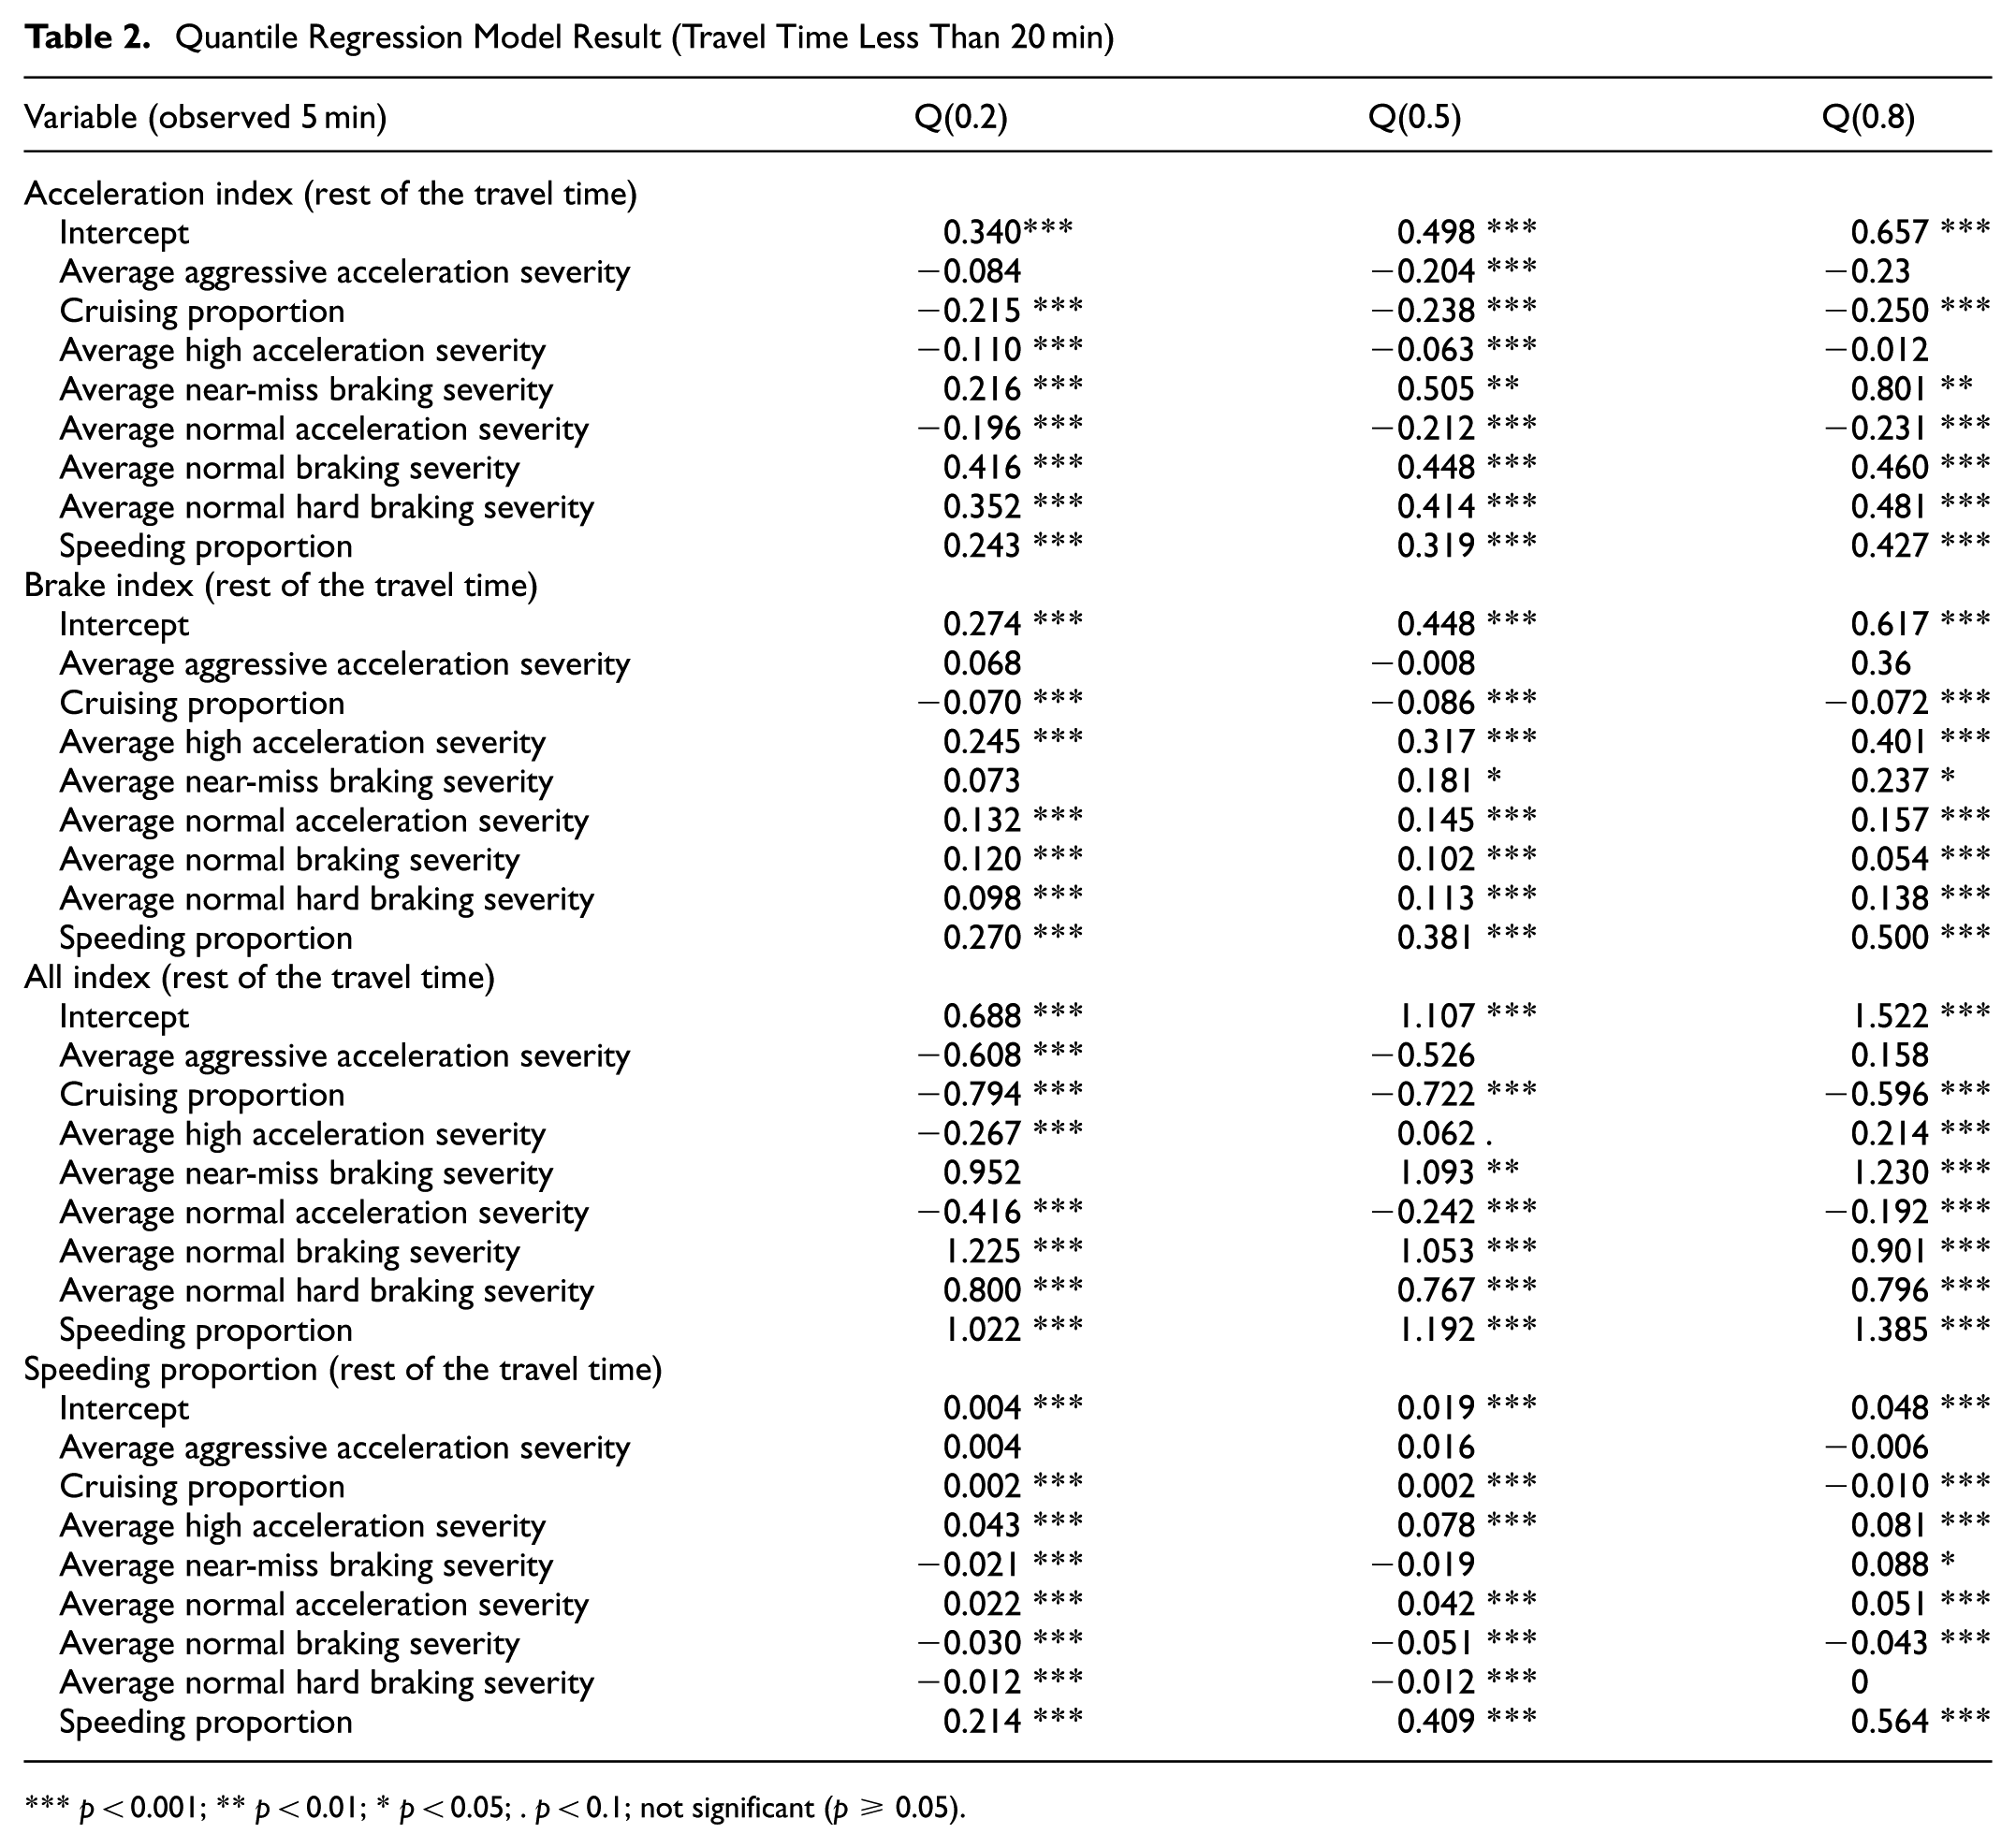
In the second part of the study, drivers’ behavior during the first few minutes of a trip was explored to assess if it could offer insight into how they drive for the remainder of the journey. To examine this, we used data from the first 5 min of each trip and applied quantile regression analysis to evaluate its relationship with four outcome measures: Acceleration Index, Braking Index, All Index, and Speeding Proportion, each calculated based on the rest of the trip. These outcome variables are defined in detail in the methodology section. This analysis allowed us to examine whether early trip behavior is meaningfully associated with driving tendencies observed later, which could be valuable for safety monitoring or real-time driver feedback systems. To account for differences in trip length, we ran separate quantile regression models for three subsets of the data: trips less than 20 min (228,264 journeys), 20 to 40 min (95,533 journeys), and more than 40 min (9,377 journeys). Table 2 presents the regression results for trips with less than 20 min of travel time.
Quantile Regression Model Result (Travel Time Less Than 20 min)
***p < 0.001; **p < 0.01; *p < 0.05; . p < 0.1; not significant (p ≥ 0.05).
In Table 2, which presents coefficient values for independent variables for journeys under 20 min, all braking-related behaviors from the initial 5 min, including near-miss, hard, and normal braking are associated with an increase in the Acceleration Index during the remainder of the trip. In contrast, a higher proportion of early cruising is linked to a lower Acceleration Index, indicating that smoother initial driving corresponds to more stable behavior throughout the journey. This effect is more pronounced at the upper quantile (Q0.8). Interestingly, early acceleration-related measures, particularly mean acceleration severity, show a negative relationship with Acceleration Index. This may suggest that drivers who accelerate early are doing so to reach a desired speed quickly and then maintain a cruising pattern, reducing the need for further acceleration. This trend holds across other models in Tables 2 and 3 as well. Most variables in Tables 1, 2, and 3 are statistically significant, which is expected given the large sample size. However, the more meaningful insight comes from examining how these variables change across different quantiles, both in direction and in magnitude rather than relying on statistical significance alone. For the braking index model, early cruising again shows a consistently negative impact across all quantiles, while all other variables (except aggressive acceleration) have a positive association. Given the low frequency of aggressive acceleration events in the dataset, results for this variable should be interpreted with caution.
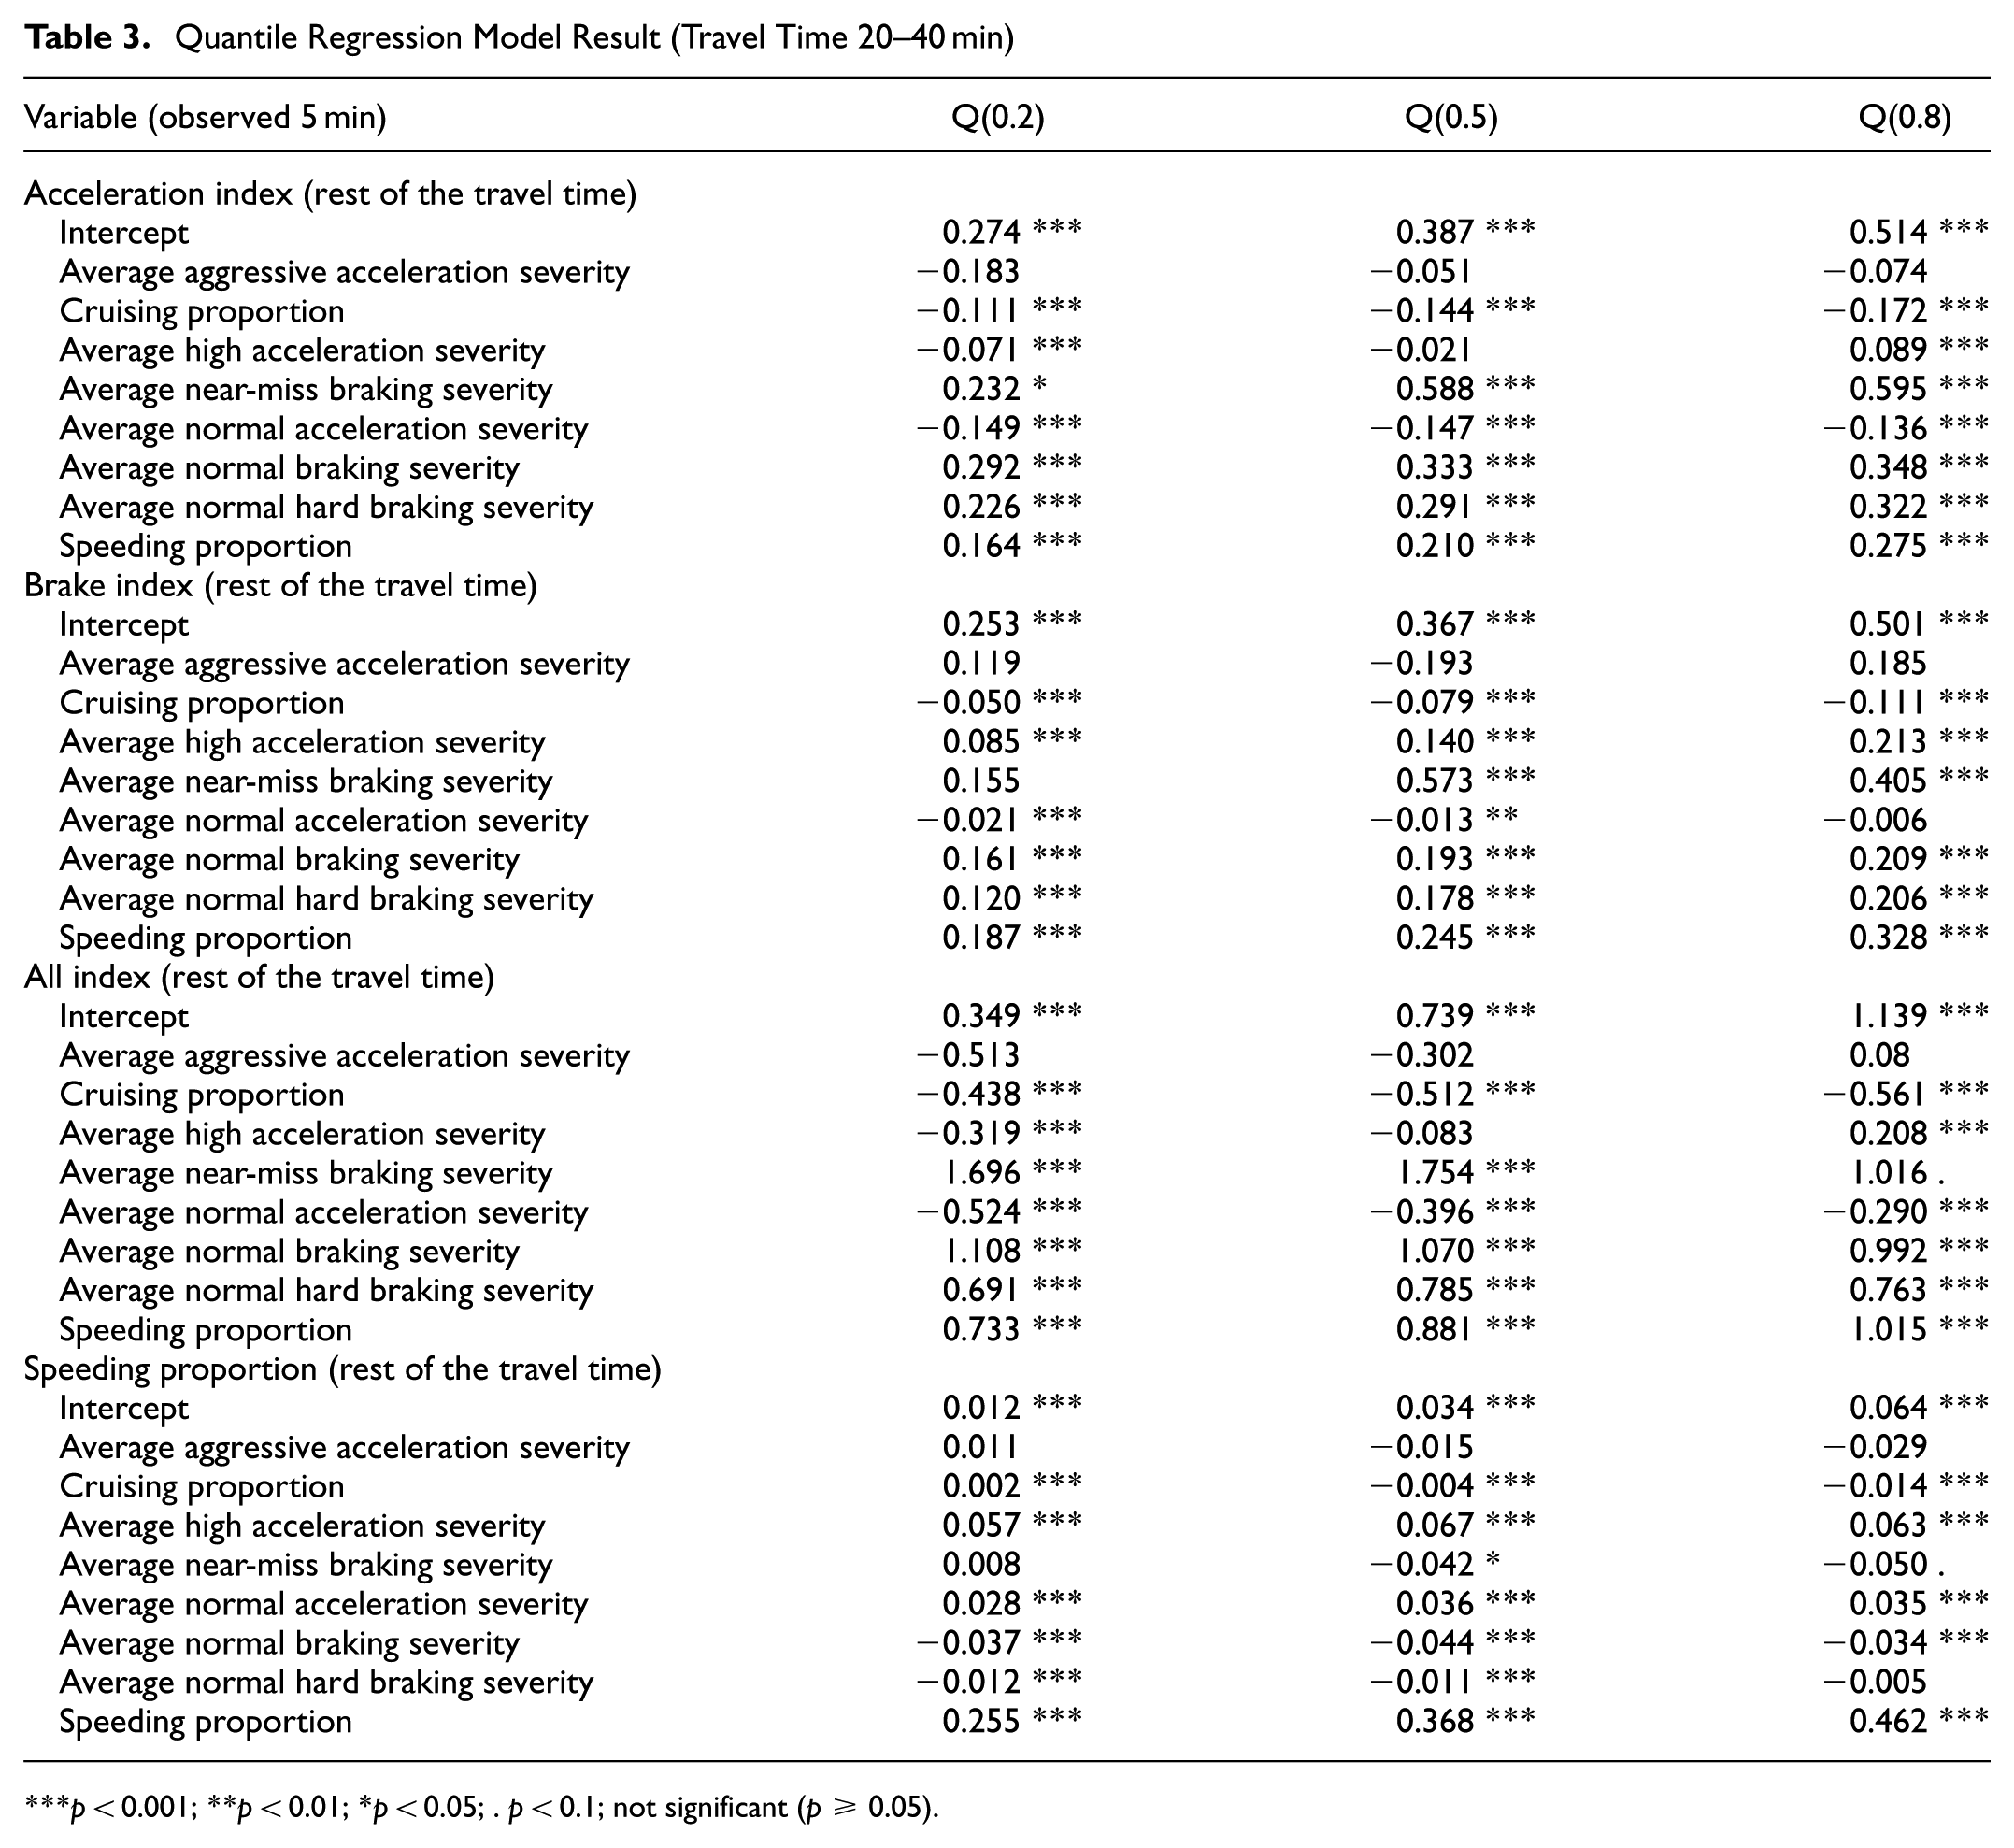
Quantile Regression Model Result (Travel Time 20–40 min)
***p < 0.001; **p < 0.01; *p < 0.05; . p < 0.1; not significant (p ≥ 0.05).
For the All Index in Table 2, aggressive acceleration severity shows a negative effect at the 0.2 and 0.5 quantiles, though only statistically significant at the 0.2 level. This suggests that, for low- to medium-risk drivers, early aggressive acceleration does not lead to riskier behavior later in the journey. It also implies that this behavior may contribute less to overall risk and could be assigned a lower weight in scoring models. This interpretation aligns with guidance from the vehicle tracking company Quartix ( 26 ), which recommends assigning lower weights to acceleration events. Early cruising behavior consistently reduces the All Index by 0.794 and 0.722 at the 0.2 and 0.5 quantiles, respectively. Although the reduction is slightly smaller at the 0.8 quantile (0.596), the trend persists, indicating that cruising retains a protective effect even for higher-risk drivers. In contrast, all types of braking events and the speeding proportion from the initial period show strong positive associations with the All Index later in the trip, reinforcing their importance in scoring frameworks and suggesting they should be weighted more heavily in driver performance metrics.
For the Speeding Proportion, all types of braking events during the early period are associated with a decrease in speeding behavior, except for near-miss crash braking severity at the 0.8 quantile. This exception suggests that while braking generally opposes speeding, high-risk drivers may exhibit both speeding and abrupt, unsafe deceleration behaviors, reflecting an overall erratic driving pattern.
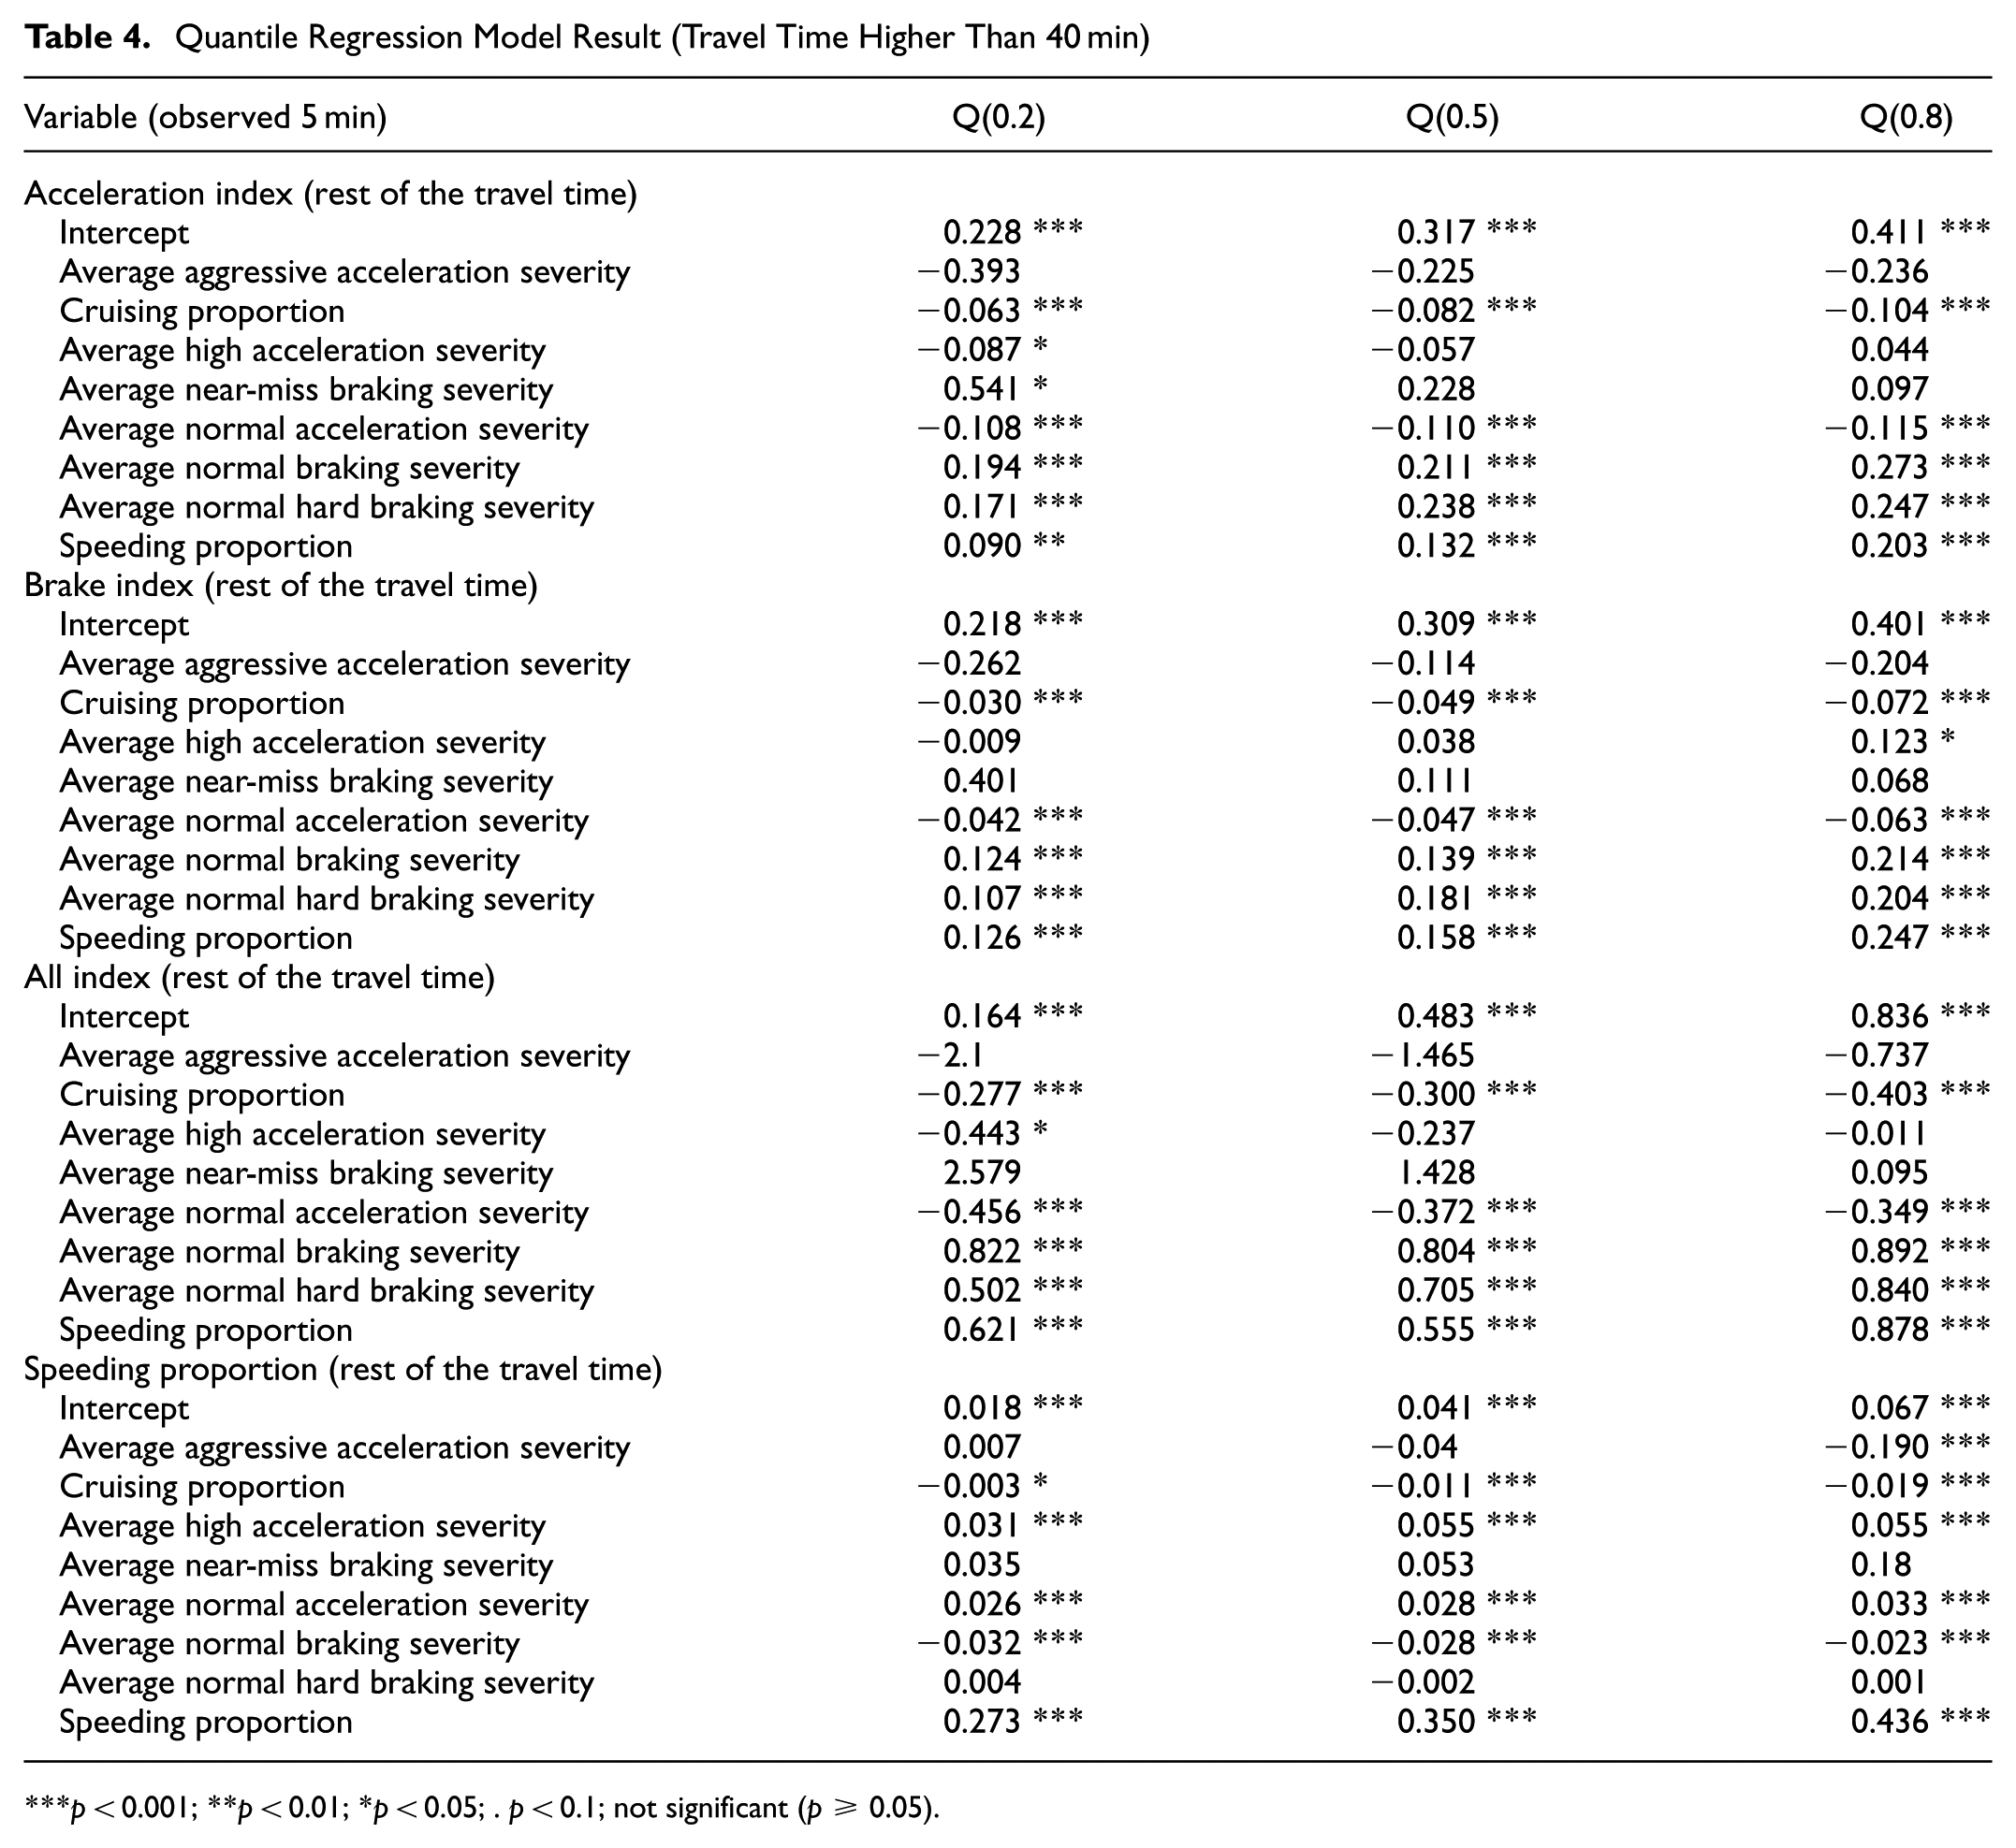
The variables across Tables 3 and 4 follow broadly similar trends as seen in Table 2, but with several important differences in magnitude and direction. For example, normal acceleration severity during the early portion of the trip has a positive effect on the Braking Index in Table 2 (short trips), but turns negative or negligible in Tables 3 and 4 (medium and long trips). This suggests that the influence of early normal acceleration on later braking behavior diminishes as travel time increases. Another notable shift occurs in the All Index at the 0.8 quantile: in Table 3, aggressive and high acceleration severity both show positive effects, indicating riskier patterns among high-risk drivers.
Quantile Regression Model Result (Travel Time Higher Than 40 min)
***p < 0.001; **p < 0.01; *p < 0.05; . p < 0.1; not significant (p ≥ 0.05).
Coefficient values for several key indicators also diminish with increasing trip length. For instance, the cruising proportion at the 0.2 quantile in the All Index model is −0.794 in Table 2, −0.438 in Table 3, and −0.277 in Table 4. This declining trend suggests that the stabilizing (i.e., risk-reducing) effect of early cruising is more pronounced in short trips and gradually weakens in longer ones. These findings reinforce the idea that driving behavior metrics should be benchmarked within similar trip durations; otherwise, comparisons across dissimilar trip types could obscure meaningful behavior patterns and lead to misinterpretation in performance measures or driving scores.
Figure 8 shows how different early driving indicators affect the rest of the driving behavior in three models.
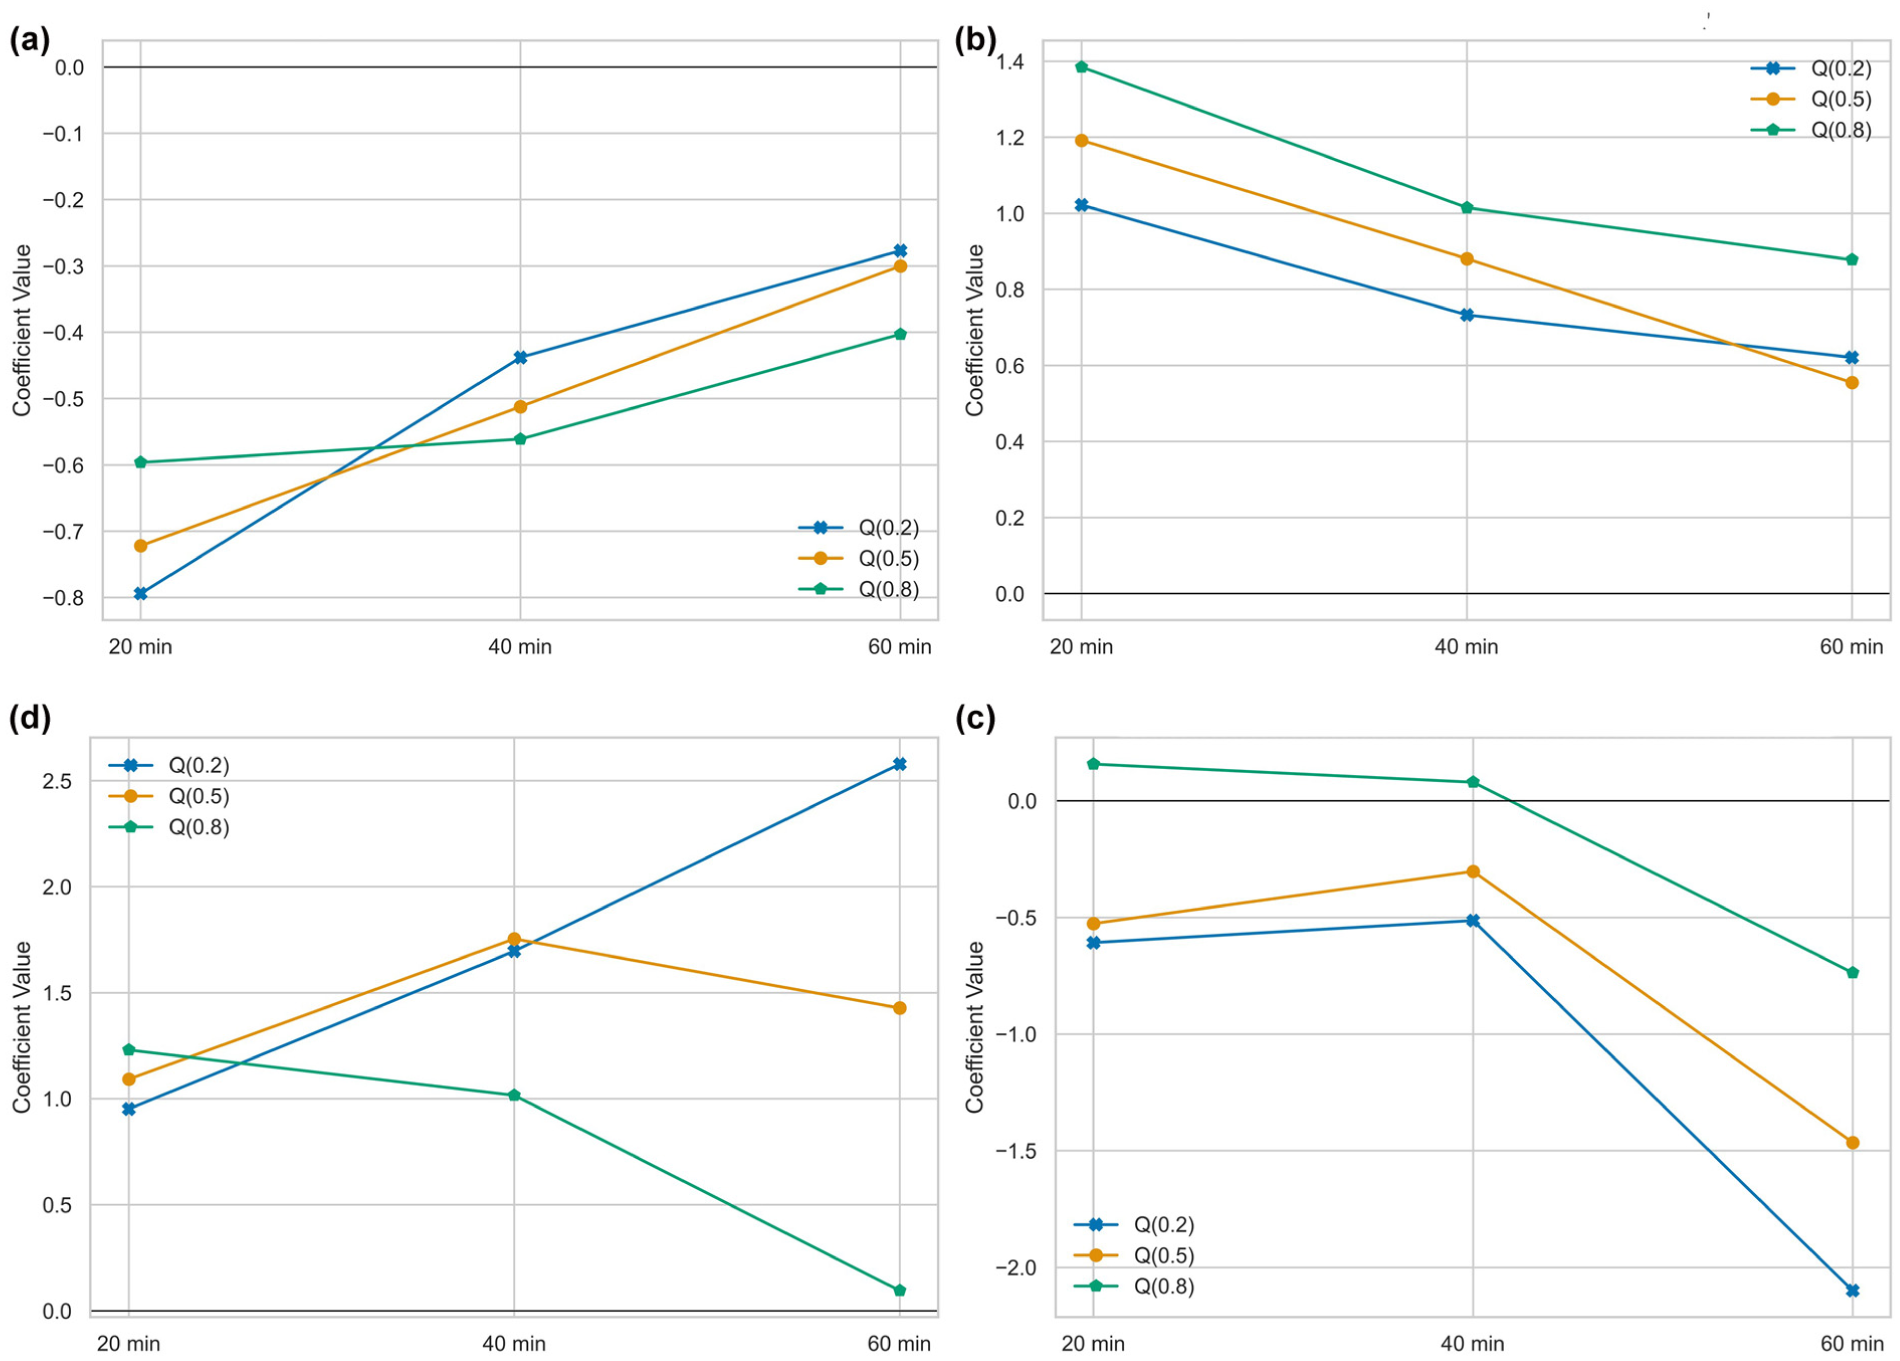
Impact of (a) cruising proportion, (b) speeding proportion, (c) average near-miss braking severity, and (d) average aggressive acceleration severity on the All Index for rest of the time period.
In Figure 8a, Cruising proportion shows a stable negative effect across all quantiles and time windows.
The magnitude becomes less negative as the window length increases, suggesting that the initial cruising behavior during the first few minutes becomes less representative of driving behavior over longer periods. The cruising effect indicates that cruising is a weaker indicator of overall driving behavior as travel time increases. In Figure 8b, the speeding proportion exhibits a consistently positive effect across all quantiles and time windows. The magnitude of this effect is highest with shorter travel times. Aggressive acceleration severity shows a mixed effect across quantiles and time windows (at Figure 8c). At shorter windows (20–40 min), the effect is slightly negative at the lower and middle quantiles but shifts toward a small positive influence at the upper quantile, indicating that more extreme driving behavior (Q 0.8) is more sensitive to aggressive acceleration. As the time window increases to 60 min, the effect becomes strongly negative across all quantiles, suggesting that brief bursts of aggressive acceleration might lose their influence when driving behavior is averaged over longer periods. In Figure 8d, Near-miss braking severity shows a strong and consistently positive effect across all quantiles and time windows. The magnitude of this effect increases noticeably as the time window expands, especially at the lower quantile. Across quantiles, the effect is largest at Q0.2 and Q0.5, indicating that trips with generally lower index values are more sensitive to near-miss braking. At Q0.8, the influence tapers off at the 60-minute window, suggesting that in higher-risk trips, the impact of near-miss events becomes less dominant when averaged over longer durations.
Additional models using the first 1, 3, and 7 min of data were tested, but several 1-minute models could not run because of limited events. Results for other models are omitted here because of space constraints.
Conclusions
This study developed a severity-weighted driving behavior index using CV trajectory data and examined whether early trip behavior is associated with driving patterns during the remainder of the journey. Using over 330,000 trips across Iowa, the index incorporated speeding, acceleration, braking, and cruising metrics, revealing a right-skewed distribution. Trips with higher index scores were marked by frequent speed limit violations and erratic maneuvers, while lower scores reflected smoother, more controlled driving behavior. Quantile regression results showed that early trip cruising was consistently associated with safer outcomes, while early braking, particularly near-miss and hard braking events and speeding, were strongly linked to elevated risk for the rest of the journey. In contrast, acceleration variables had a comparatively weaker association with later driving behavior, suggesting that braking and speeding may be more reliable indicators of overall risk. These effects were observed differently across different travel durations, suggesting that trip length should be considered when developing or benchmarking any driving score.
From a practical standpoint, when a high-index value is detected early in a trip, it provides a direct signal that a trip is trending toward more aggressive driving, allowing fleet supervisors to act before an unsafe event occurs. In practice, this can involve a quick check of the trip in the telematics dashboard, sending a reminder through an in-vehicle feedback system, or scheduling a short coaching session for drivers who repeatedly appear in the upper range of the index. Fleets can also utilize the index to adjust assignments by placing higher-risk drivers on lower-stress routes or relocating them away from peak traffic periods. When viewed across many trips, the index helps identify routes, shifts, or operating conditions that consistently produce elevated risk, which supports broader operational changes such as route redesign, time-of-day adjustments, or targeted training. This gives the index clear value as a proactive management tool.
The results of this study highlight the promising potential of early trip behavior analysis using CV trajectory data to identify drivers who are likely to engage in high-risk actions throughout the rest of their journey. As commercial CV datasets continue to expand in coverage and fidelity, future research can leverage higher-resolution vehicle telemetry (including acceleration, braking, and steering data) to capture more detailed aspects of driver behavior. A particularly valuable direction for future work involves collaboration with freight companies and commercial fleet operators. Vehicle tracking data from these operators can enable driver-level monitoring, allowing researchers to more accurately profile repeated speeding tendencies, identify high-risk drivers, and develop individualized safety interventions. For example, fleet managers could receive automated alerts about aggressive drivers within their fleet, enabling timely corrective actions or route adjustments. Furthermore, the integration of predictive analytics and real-time telematics could support systems that forecast speeding risks based on a vehicle’s initial driving patterns, potentially within the first few minutes of a trip. These systems could trigger in-vehicle warnings or mobile alerts aimed at reducing speeding behavior before it escalates. Ultimately, there is significant potential for the development of intelligent driver monitoring systems using CV data to enhance roadway safety and optimize fleet management.
The study acknowledges several important limitations. First, the analysis relies on CV data collected in Iowa, which may introduce geographic or behavioral biases linked to regional driving culture, roadway design, or enforcement patterns. As a result, the predictive relationships observed here may not fully generalize to areas with different traffic compositions or urban environments. Second, CV trajectories do not include driver demographic characteristics such as age, gender, or driving experience, which limits our ability to examine how individual-level factors interact with early trip behaviors. Another limitation is that roadway-level attributes, such as average annual daily traffic, number of lanes, road type, and cross-section characteristics, were not incorporated into the driving score formulation. These features influence operating speed and driver behavior but are not directly controlled by the driver, and excluding them may leave some contextual variation unexplained. Future research can integrate these roadway attributes into the scoring framework to better distinguish between driver-controlled behaviors and infrastructure-driven conditions.
Footnotes
Acknowledgements
The authors would like to acknowledge the Iowa Department of Transportation for providing access to the third-party connected vehicle data used in this analysis.
Authors’ Note
Large language models (Gemini 2.0 and Gemini 3.0 and Grammarly) were used for language editing and grammar checking. All technical content, results, and references were reviewed and verified by the authors.
Author Contributions
The authors confirm contribution to the paper as follows: study conception and design: M. Mumtarin, S. Mahmud; data collection: M. Mumtarin, S. Mahmud. Author; analysis and interpretation of results: M. Mumtarin, S. Mahmud, C. M. Day, J. Wood.; draft manuscript preparation: M. Mumtarin, S. Mahmud. All authors reviewed the results and approved the final version of the manuscript.
Declaration of Conflicting Interests
The authors declared the following potential conflicts of interest with respect to the research, authorship, and/or publication of this article: Christopher Day is a member of Transportation Research Record’s Editorial Board.
Funding
The authors received no financial support for the research, authorship, and/or publication of this article.

The contents of this paper reflect the views of the authors, who are responsible for the facts and the accuracy of the data presented here and do not necessarily reflect the official views or policies of the sponsoring organizations. These contents do not constitute a standard, specification, or regulation.