






Abstract
Transitioning to electric and hybrid vehicles (EHVs) for all communities is a pivotal step toward sustainable transportation and environmental conservation. This paper aims to understand the adoption of EHVs, focusing on burdened communities (BCs) in the United States. The EHV ownership-based analysis combines two datasets—behavioral data from the Puget Sound Regional Travel Survey integrated with BCs (Justice40) data covering transportation insecurity, environmental burden, social vulnerability, health vulnerability, and climate and disaster risk burden. After creating this unique database, descriptive analysis and modeling are used to analyze the data and predict EHV ownership in the future. Specifically, we use a new method that combines particle swarm optimization (PSO) with a stacking model named PSO-Stacking, which incorporates heterogeneous base learners of machine learning and deep learning. PSO applies a customized objective function to select the optimal hyperparameters for heterogeneous learners within the stacking model, effectively addressing challenges such as multicollinearity, data imbalance, nonlinearity, and overfitting. The proposed solution covers more accurate results than standard benchmark models for EHV ownership in BCs and non-BCs. In addition, the results of the PSO-Stacking method are explained using the local interpretable model-agnostic explanations technique. Results show a negative correlation between the BCs indicators, that is, higher transportation insecurity associated with lower EHV ownership. Furthermore, BCs have higher future climate risk scores, diesel particulate matter levels, and PM2.5 in the air than non-BCs because of higher conventional vehicle ownership. These communities are at higher risk and can benefit from electrification, EV infrastructure, and EV policies to address environmental challenges.
Keywords
Introduction
Sustainable transportation systems, energy crises, and global environmental challenges require close monitoring of electric and hybrid vehicle (EHV) ownership in the era of rapid urbanization. Automobile driving is the primary mode of transportation in the United States, where vehicles are conventional and rely on nonrenewable fuels such as gasoline and diesel. In the United States, each household has an average number of 1.88 vehicles, and 87% of daily trips are made using personal vehicles ( 1 ). The latest report stated that in 2020, 253 million cars and light trucks traveled about 2.9 trillion miles ( 2 ). Meanwhile, in relation to fuel consumption, US transportation accounted for 67% of the total petroleum consumption, which is 80% of the total petroleum production in the United States in 2021. Specifically, 63% of petroleum usage accounts for cars and light trucks ( 2 , 3 ).
Regular vehicles (RVs) are the major source of air pollution, adverse health issues, and rapid climate change because of carbon emissions, as globally, 13% of greenhouse gases are emitted by the transportation sector ( 4 – 6 ). Specifically, 36.9% of CO2 was emitted by cars and light trucks in the United States in 2021 ( 2 ). Therefore, various strategies have been proposed in recent years to address the negative impacts of automobile travel around the globe. These strategies include investment in improving public infrastructure ( 7 ), increasing road prices ( 8 ), creating awareness of carbon emissions ( 7 ), promoting EHVs, and expanding bicycle lanes and land use such as more compact and mixed-use public transport ( 4 – 9 ). However, these strategies are still inconsistent for auto-dominant countries like the United States. Therefore, transport electrification such as EHVs gained substantial interest in recent years for mitigating the adverse impacts of climate change to achieve sustainability, which is the main focus of this study ( 10 , 11 ).
The burdened communities (BCs) in the United States have less penetration of EHVs because of low annual incomes, lack of infrastructure, and limited support. Therefore, understanding EHV ownership trends for both BCs and non-BCs becomes a pivotal endeavor in urban transportation planning, decision-making, energy management, climate analysis, and automotive industry advancements. A little attention is paid in the literature to analyze EHV ownership for BCs and non-BCs. Primarily, the studies characterize individual-level factors to estimate the overall ownership of EHVs for households in non-BCs, whereas the other studies use aggregated level features ( 12 – 15 ). These studies use conventional models such as logistic regression (LR) and probabilistic models to estimate the ownership of EHVs. In addition, their hyperparameters are optimized using limited searches such as grid search or random search. Specifically, the conventional EHV ownership estimation techniques are inefficient in dealing with data imbalance problems, nonlinearity, and multicollinearity and use accuracy as a performance indicator ( 3 , 6 , 10 , 12 – 18 ). The research objectives of this study are: 1) to develop an accurate model for predicting EHV ownership in both BCs and non-BCs by using a combination of household-level and regional data to understand EHV ownership trends; 2) to identify and analyze the factors that influence EHV ownership in BCs, while also examining the impact of CVs on climate change; 3) to compare the effectiveness of the proposed PSO-Stacking model with conventional methods in estimating EHV ownership; and 4) to provide useful insights to inform policy decisions, infrastructure planning, and strategies for promoting sustainable transportation in BCs.
This study proposes a new solution to understand EHV ownership for BCs and non-BCs by combining aggregated and disaggregated data. The solution utilizes the Puget Sound Regional Travel Survey (PSRTS) for household-level information and Justice40 data for regional travel and climate characteristics of BCs ( 19 – 21 ). Furthermore, the study incorporates crucial climate-related indicators from Justice40 data, highlighting the environmental challenges facing these communities as a result of less penetration by EHVs. The core of the approach is a PSO-Stacking model, which integrates an ensemble learning stacking model with particle swarm optimization (PSO) for hyperparameter tuning. This model combines machine learning and deep learning algorithms to address challenges such as nonlinearity, imbalanced data, multicollinearity, and overfitting. The model uses the F1-score as the performance metric for optimization and employs K-fold cross-validation for improved generalization. Extensive analysis demonstrates the proposed solution’s effectiveness in understanding EHV ownership for BCs and non-BCs compared with conventional methods. The model’s performance is evaluated using multiple metrics, including F1-score, precision, recall, area under the curve (AUC), balanced accuracy (B_accuracy), and Matthews correlation coefficient (MCC). In addition, the PSO-Stacking model results are interpreted using local interpretable model-agnostic explanations (LIME), an explainable AI (XAI) technique. This comprehensive approach provides valuable insights for decision-making, infrastructure planning, EHV market analysis, and policy evaluation related to zero-emission vehicle mandates and consumer awareness. By offering a more accurate and nuanced understanding of EHV ownership in BCs, this method can contribute to developing more effective strategies for promoting sustainable transportation in BCs.
Literature Review
Transport electrification has gained the interest of academia and industry over the past few years in the areas of EHV load estimation ( 11 , 22 ), bus and taxi fleet travel ( 23 , 24 ), ownership usage and prediction ( 25 ), and shared mobility ( 26 ). Specifically, several studies have been presented in the last few years to estimate the ownership of RVs and EHVs, while the prime focus of this study is to analyze the ownership of EHVs for both BCs and non-BCs. These studies are characterized into three levels: aggregated, disaggregated, and combined.
At the aggregated level, Goh et al. ( 11 ) proposed stochastic uncertainty analysis to predict the charging load of electric vehicles (EVs). In addition, another solution is proposed for EVs ownership prediction based on the improved grey model method using the 2013 to 2015 dataset of Wuhan, China. The authors use electric buses, official vehicles, taxis, and car features excluding hybrid vehicles. Gao et al. ( 27 ) have employed the Bass diffusion model for regional EVs ownership prediction using regional factors such as energy price, total EVs, and Xinjiang, China media promotion. In Maino et al. ( 28 ) and Dixon et al. ( 29 ), the authors have presented deep neural network (DNN)-based solutions to predict the CO2 emissions by EHV and RV ownership where the hyperparameters are tuned using an automated search tool and grid search, respectively. The solution is optimized based on R2 as a goodness of fit to minimize the error rate using eight input features related to CO2 emissions. A similar approach called the MIFS-AdaBoost model was developed in Wang et al. ( 30 ), where it combines mutual information feature selection and adaptive boosting to forecast the adoption of EVs in China. Zhang et al. ( 31 ) have presented a PSO-based neural network (NN) for private car ownership using 2005 to 2021 data from China. The PSO is used to tune both weights and thresholds of the NN model using accuracy as a criterion. The authors in Lu et al. ( 32 ) have employed an aggregated approach to characterize the growth of RVs ownership while using GDP per capita as an indicator.
At the disaggregated level, the authors in Liu et al. ( 3 ) and Li et al. ( 33 ) have proposed a geographically weighted regression model to estimate the alternative fuel vehicles ownership patterns in the United States using the National Household Travel Survey (NHTS) data. The research work in Khattak and Khattak ( 16 ) has explored the adoption of EHVs using consumer preferences through Bayesian hierarchical modeling utility functions. Another recent study ( 10 ) uses the same NHTS data and support vector machine (SVM) along with the hyperparameters optimization technique, known as Bayesian optimization for RVs ownership prediction. Chaipanha and Kaewwichian ( 17 ) and Kaewwichian ( 34 ) have focused on the handling of the data imbalance problem using synthetic minority oversampling technique (SMOTE) and K-nearest neighbors (KNN) model for vehicle ownership prediction. A similar approach in Jia et al. ( 15 ) uses the NHTS data and SMOTE with a decision tree (DT), which obtains the highest true positive rate (TPR) of 0.721 among different alternatives at unseen data for EVs ownership. In Wang ( 35 ), the solution begins with extracting potential features using the grey correlation analysis technique and NN is used to predict the EVs ownership. Liu and Cirillo ( 6 ) and Cui et al. ( 18 ) have proposed a multinomial linear regression (MNL) to estimate the household preference for the future car adoption such as vehicle type choice from RVs to EHVs.
There are very few studies that focus on both aggregated and disaggregated levels. Considering both individuals’ characteristics and high-level factors for EHV ownership is important. Ma et al. ( 14 ) and Sabouri et al. ( 12 ) have employed extreme gradient boosting (XGB) and random forest (RF) techniques to capture the nonlinearity between households’ characteristics as well as the environmental factors in relation to vehicle ownership using 2017 NHTS data. Ma et al. ( 14 ) have provided estimations for three states of the United States: California, Missouri, and Kansas. The hyperparameters of the XGB model are optimized using grid search. Gehrke and Reardon ( 13 ) have focused on the identification of spatiotemporal and environmental features contributing to the usage and purchasing patterns of EVs from 2008 to 2016 in Massachusetts. The authors have used LR to estimate the early adoption of EHVs and demonstrated that the adoption of EVs is an urban phenomenon and seen in higher income households.
Previous studies on examining CVs and EHV ownership have largely overlooked BCs. While some studies have incorporated both individual and aggregated level characteristics, many have relied on conventional models such as LR, RF, MNL, XGB, DT, SVM, KNN, and statistical models ( 3 , 6 , 10 , 12 – 17 , 34 ). These models often struggle with nonlinearity, multicollinearity, imbalanced and high-dimensional data, and overfitting. Their performance is typically measured using accuracy, which can be misleading for imbalanced datasets, and they often exhibit low TPR. In addition, these models’ effectiveness heavily depends on hyperparameters, which are selected through limited search techniques such as grid or random search ( 14 , 29 , 36 ). Some studies have attempted to address data imbalance using SMOTE, but this method generates synthetic samples that may not accurately represent real-world data ( 15 , 17 ). Considering these limitations, this paper proposes a new method that accounts for both behavioral and regional characteristics of BCs and non-BCs to improve EHV ownership prediction. The proposed approach uses a stacking model with heterogeneous learners, including LR, RF, light gradient boosting (LGB), and DNN. This diverse ensemble is designed to handle the aforementioned various data challenges effectively. In addition, the model employs PSO for hyperparameter tuning, aiming to improve on the limitations of previous learners and EHV ownership analysis for promoting sustainability and equity in BCs.
Methodology
The methodology consists of four main steps to characterize the EHV ownership for both BCs and non-BCs: data description, data preprocessing, permutation feature selection (PFS), and PSO-Stacking, as shown in Figure 1. The proposed methodology uses two datasets, PSRTS and Justice40, to capture aggregated and disaggregated level features. Afterward, these features are integrated into a single dataset and preprocessed based on handling missing values and outliers. Then, the PFS mechanism is applied to select the potential features that significantly affect EHV ownership. The proposed solution, PSO-Stacking, is applied to understand the EHV ownership for both BCs and non-BCs and is evaluated using the most appropriate performance indicators. Lastly, the predictive power of the proposed solution is analyzed using LIME. The flowchart of the proposed methodology is shown in Figure 2.
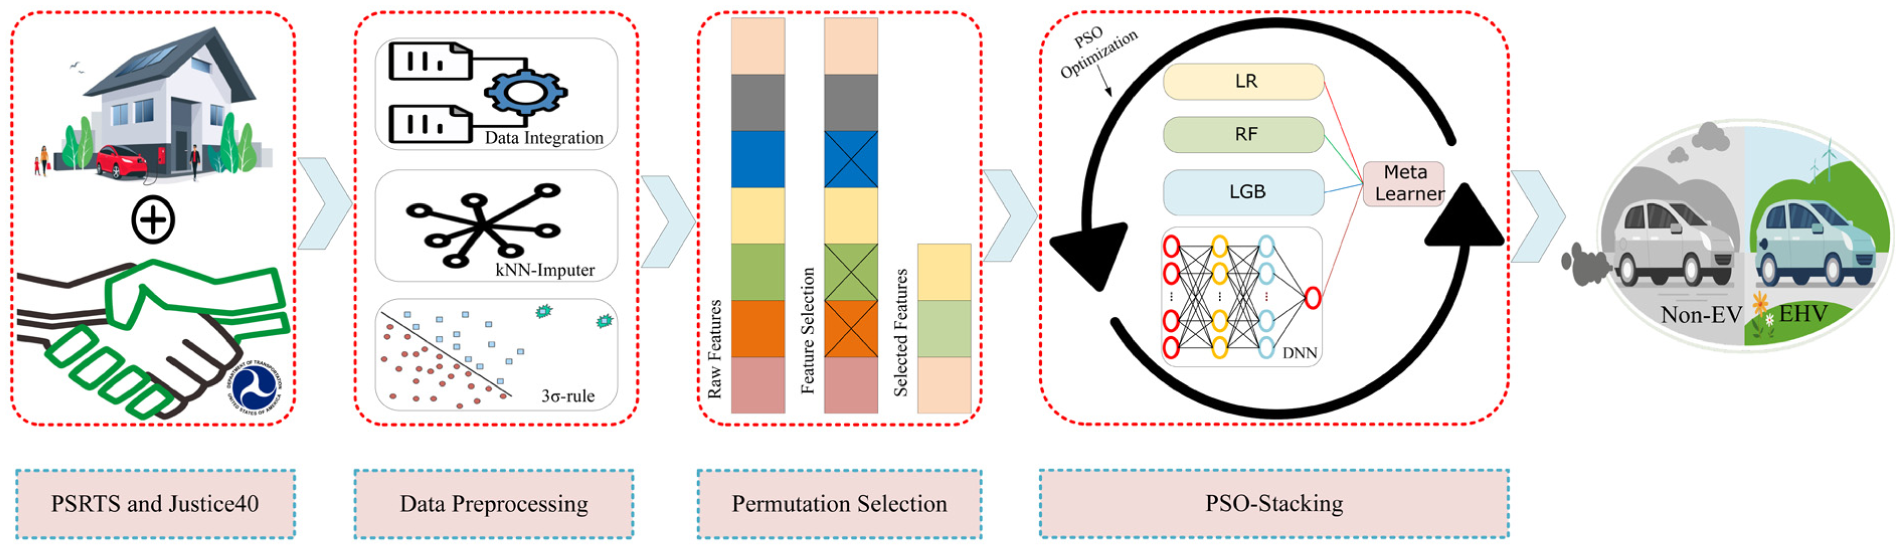
Systematic overview of EHV ownership analysis for BCs.
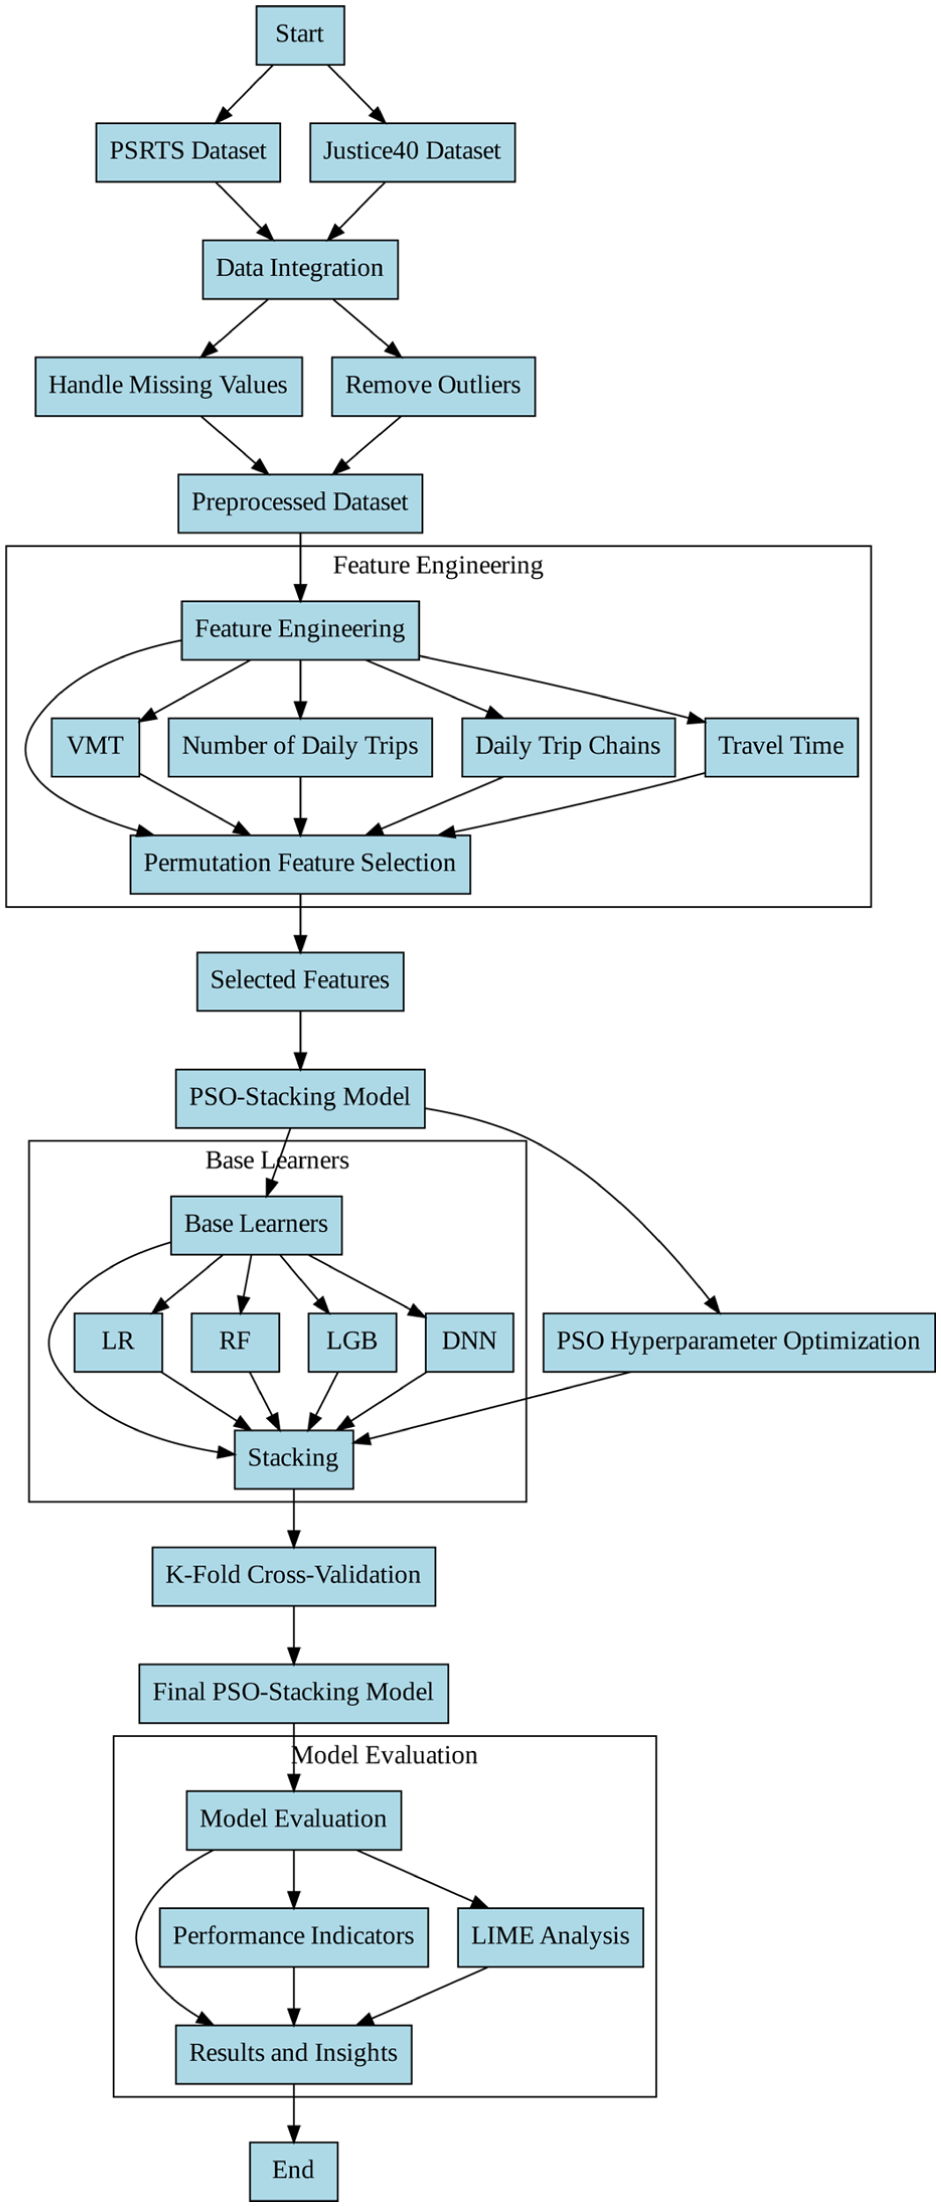
Flowchart of the proposed PSO-Stacking model.
Data Description
This study uses two datasets, known as PSRTS data and the BCs data, also known as Justice40 data ( 19 – 21 , 37 ). The PSRTS dataset consists of four waves from 2017 to 2023, with four files containing information about households, person demographics, vehicles, and daily trips of the Seattle metropolitan area. The PSRTS dataset is concatenated with the Justice40 data based on the 2020 census tract FIPS code. This study examines EHVs information for both BCs and non-BCs, referred to as “fuel” in the vehicle file.
The various fuel types, such as gas, hybrid, EHV, electric, diesel, natural gas, and others are categorized into two main groups: EHVs (1) and non-EHVs (0). Afterward, using household and person indentifications, vehicle information is linked to identify the unique individuals. The dataset includes 30,490 distinct individuals, with 2,995 using EHVs in BCs and the rest in non-BCs. The distribution of EHVs in BCs and non-BCs is notably uneven, with a proportion of 13.18% and 86.82%, respectively. The dataset contains different household income values ranging from less than $10,000 to more than $250,000, which are categorized into four major categories: less than $49,999, $50,000 to $99,999, $100,000 to $149,999, and more than $150,000. Likewise, the gender is categorized into male, female, and others. An individual’s rent/own characteristics are also available. The residence duration of the individual is broadly categorized into two categories: less than five years and more than five years. Then, the age of individuals is partitioned into three categories: less than 25 years, 25 to 45 years, and more than 45 years. Lastly, employment status is an important feature in analyzing the EHV ownership in BCs and non-BCs, divided into four types: full-time, part-time, self-employed, and not employed. Detailed information about PSRTS and Justice40 data features is available in codebooks ( 19 – 21 ).
Data Preprocessing
The data preprocessing step covers data integration, handling missing values, and outliers. Handling missing values and outliers is important, as machine learning models are sensitive to these values and perform adversely. Thus, the missing values are handled in two folds. In the first fold, if there are more than five contiguous missing values, these observations are removed from the data. Likewise, the missing values are imputed in the second fold using the KNN imputer where k is the number of nearest neighbors considered for imputation ( 38 ). The KNN-based imputation method fills missing values based on the prediction of the five nearest neighbors without undersampling the data. Likewise, the data contains outliers that adversely affect the model performance. Thus, the outliers are removed from the dataset using the sigma rule (3σ-rule) ( 39 ). This approach treats any values falling outside three standard deviations as outliers and removed from the dataset. The cleaned dataset comprises a total of 22,716 observations, with 2,995 individuals using EHVs from BCs and the remaining from non-BCs. Afterward, vehicle miles traveled (VMT), number of daily trips, daily trip chains, and travel time are calculated, as shown in Figure 2. These metrics are crucial for representing the daily travel behavior of individuals in BCs and non-BCs to understand their EHV ownership.
Permutation Feature Selection
The preprocessed dataset contains the overall BCs and non-BCs features related to households, trips, sociodemographics, and regional characteristics. It is significant to select potential features from the dataset to improve model performance and reduce time and memory complexity. Therefore, the PFS technique is applied, which evaluates the importance of individual features in the dataset, as shown in Figure 3. The figure shows the potential features for understanding the ownership of EHVs in BCs and non-BCs. In this study, the PFS technique uses the RF as a selection technique that randomly shuffles the values of a single feature while keeping all other features intact. It measures the models’ performance again with the permuted feature and calculates the difference in performance before and after the PFS. The more significant drop in performance, the more essential the feature. In addition, it provides the importance of features and captures complex and nonlinear relationships. Therefore, to deal with the high-dimensional data, a PFS technique is applied that reduces the complexity and overfitting problem. The features identified through PFS are utilized to analyze EHV ownership in BCs and non-BCs, as illustrated in Figure 3. Furthermore, the descriptive statistics for the key quantitative features of BCs and non-BCs are presented in Table 1. The statistics for the categorical variables are given in Table 2.
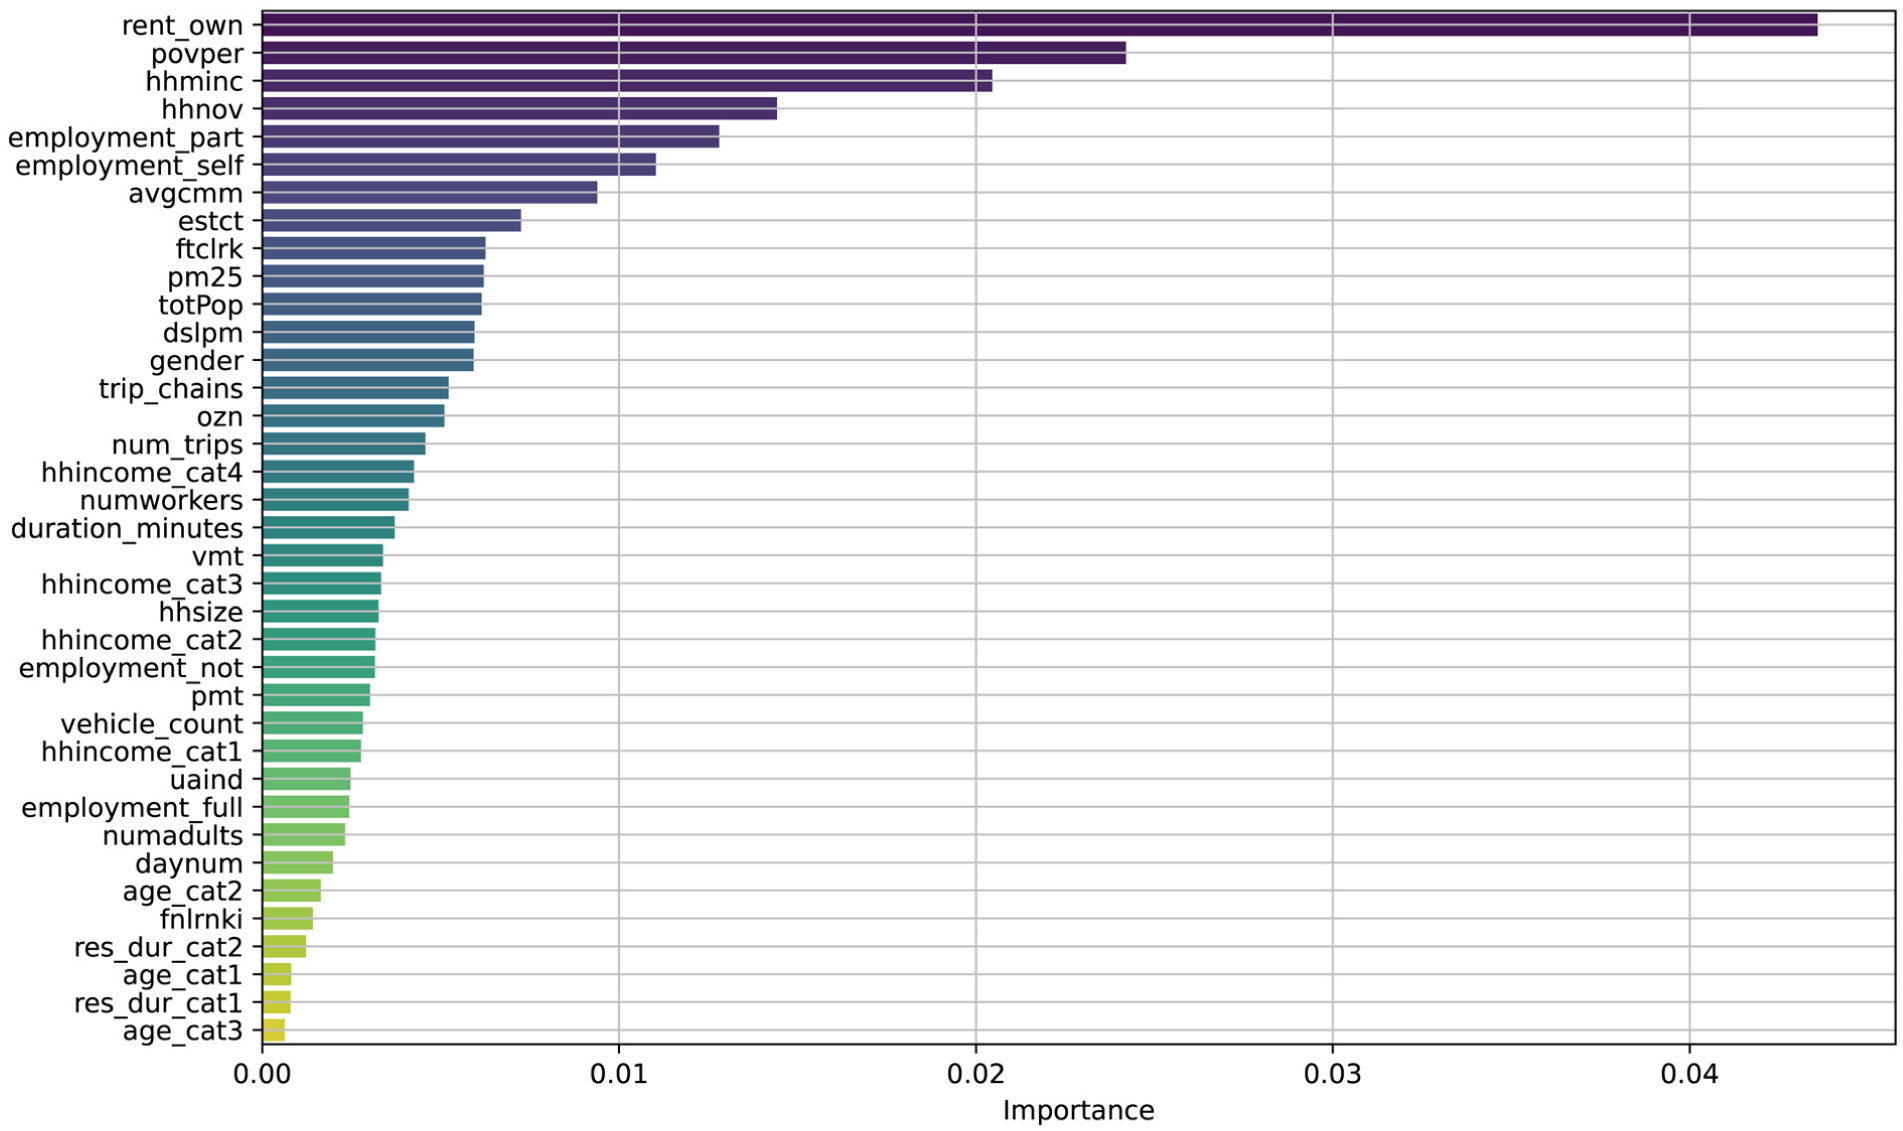
Ranking of potential indicators using permutation feature selection.
Descriptive Statistics of Selected Features for EHVs adoption in BCs and Non-BCs
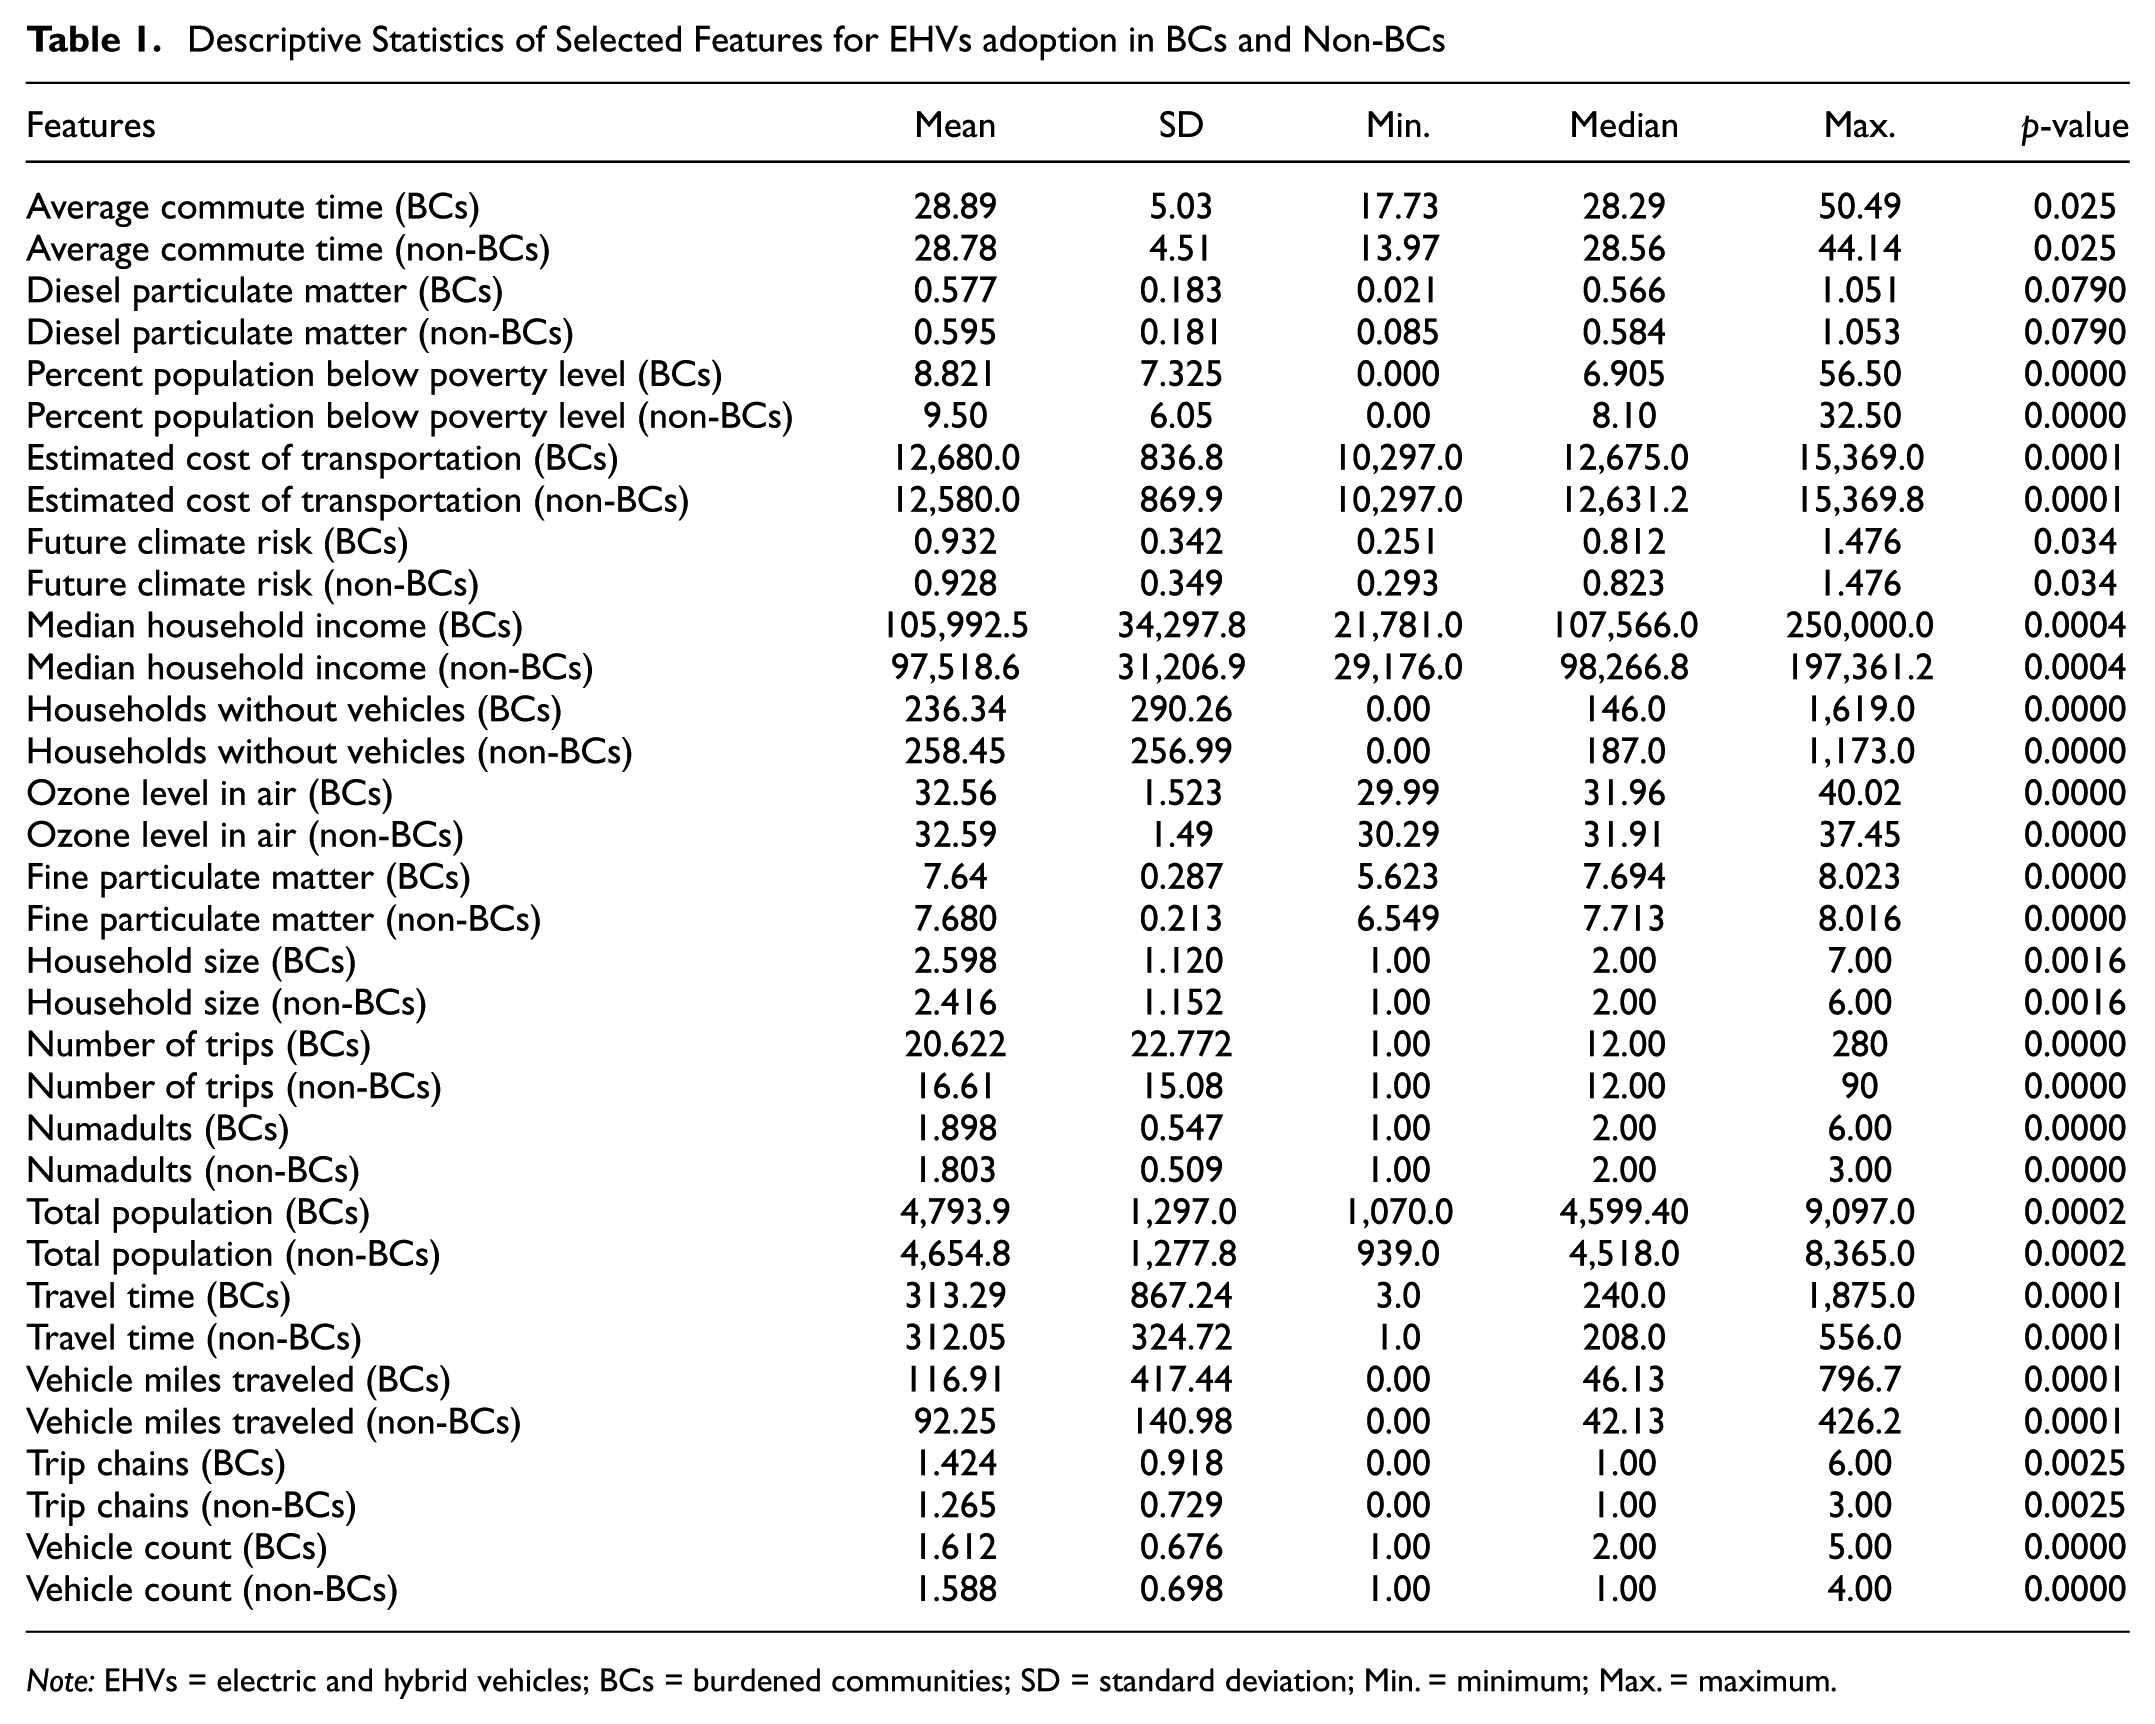
Note: EHVs = electric and hybrid vehicles; BCs = burdened communities; SD = standard deviation; Min. = minimum; Max. = maximum.
Descriptive Statistics of Categorical Features for EHVs in BCs and non-BCs
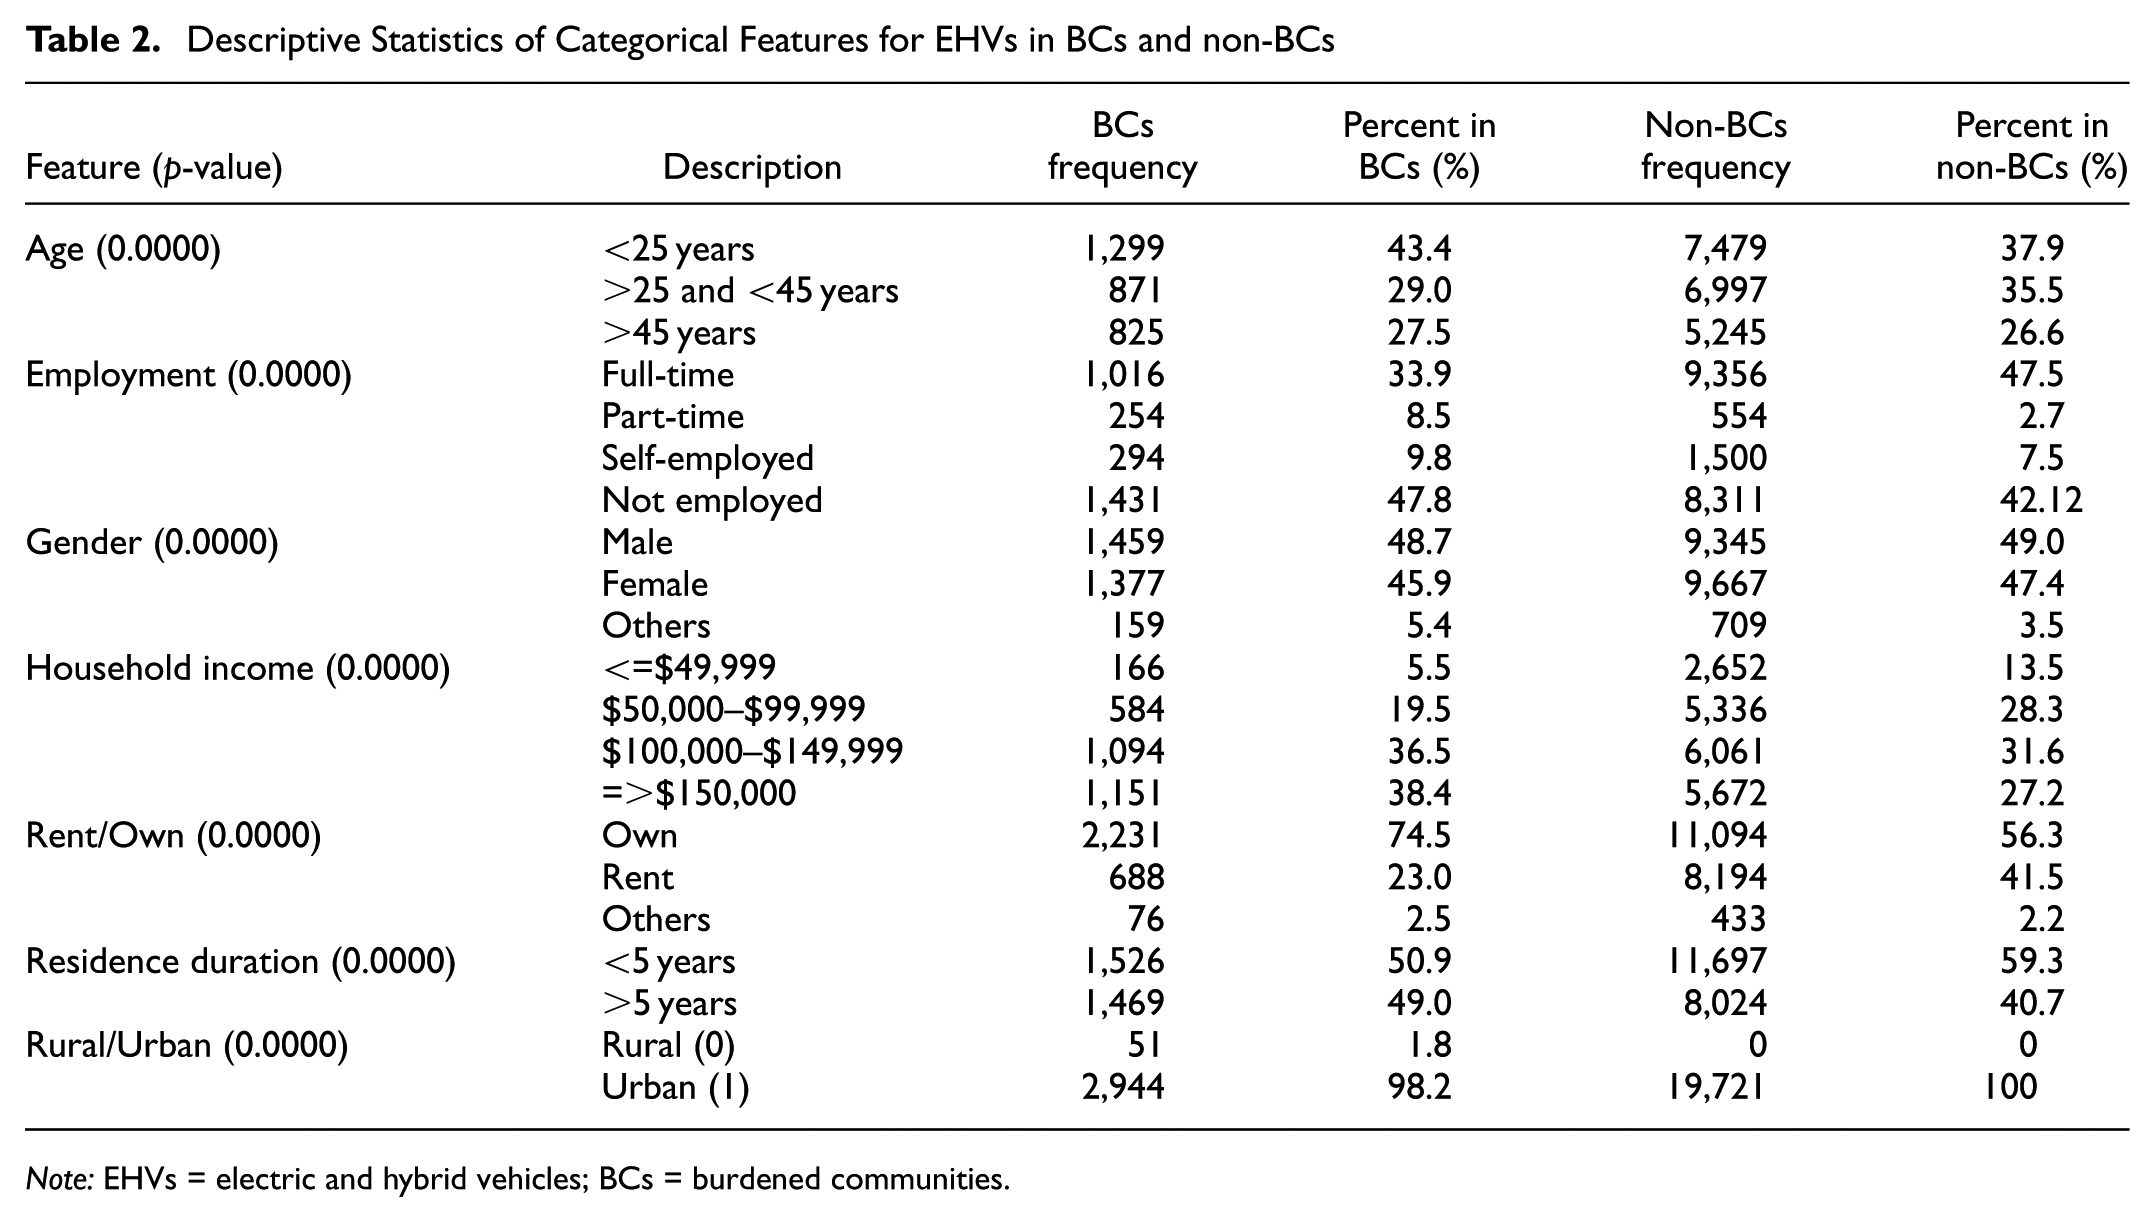
Note: EHVs = electric and hybrid vehicles; BCs = burdened communities.
Proposed PSO-Stacking Model
The proposed solution uses an ensemble learning mechanism known as stacking, which uses the projections of different base models to create a more robust and accurate model ( 40 ). Specifically, stacking involves a meta-learner that uses the estimations of base models as input and provides the final outcome. In this way, it exploits the diversity of base models, allowing them to capture various data patterns that single models may miss ( 41 ). The conventional studies’ methods such as LR, SVM, DT, and RF for analyzing EHV ownership lead to the overfitting problem because of the unbalance between bias and variance ( 3 , 6 , 10 , 12 – 17 ). The stacking method efficiently finds the balance between bias and variance by aggregating different base models, which helps to handle the overfitting problem and improves the model performance. In addition, the stacking ensemble method itself helps to handle imbalanced data by combining predictions from multiple models. Therefore, this study uses a stacking model consisting of heterogeneous base learners, including LR, RF, LGB, and DNN to capture nonlinearity, multicollinearity, and handling of high-dimensional data.
The diverse base learners are used for their complementary strengths in handling various data aspects based on the literature. The reason for using heterogeneous learners is that some models, such as LR and DT, are good at capturing linear relationships. The rest are good at capturing nonlinearity and multicollinearity, such as RF, SVM, LGB, and DNN, to reduce variance and bias. Thus, the proposed solution efficiently overcomes the limitations of conventional models and significantly improves the EHV ownership prediction in BCs and non-BCs. The mathematical description for the stacking model is defined in Equation 1:

where (
The performance of base learners, such as machine learning and deep learning models in the stacking, relies on the optimal selection of their hyperparameters. The conventional studies used grid search, random search, and Bayesian optimizer to select the optimal hyperparameters ( 10 , 12 , 14 ). However, these searching techniques either randomly search or limit the specific grid values for the optimal selection of hyperparameters, which limits the model performance. Therefore, the innovation of the proposed solution lies in integrating a population-based metaheuristic optimization technique, known as PSO, with stacking to enhance the selection of optimal hyperparameters ( 31 ).
The optimal hyperparameter selection for base learners and the meta learner improves the overall stacking model, which is crucial in handling challenges such as multicollinearity and data imbalance. PSO simulates the social behaviors of birds or particles and handles complex optimization problems by balancing exploration (searching for new regions in the search space) and exploitation (refining solutions in known promising areas). The reason for using PSO for hyperparameter optimization is that it efficiently finds the global optima and global convergence. In addition, it is effective for nonlinear problems and iteratively explores the search space. The PSO algorithm begins with initializing population size, defining the initial velocities and positions of “particles” within the feasible solution space ( 31 ). Each particle’s position and velocity are updated based on its own experience and that of its neighbors, as given in Equations 2 and 3:


where

We use a K-fold cross-validation mechanism combined with a stacking model to develop a robust model and address overfitting. In this approach, K-1 folds are dedicated to training, while the other fold is for validation. This strategy enhances the model’s generalization to unseen data. In addition, the stacking model efficiently captures variance, mitigates overfitting, and improves performance in understanding EHV ownership in BCs and non-BCs compared with traditional methods.
Experimental Results and Discussion
The proposed solution begins by integrating and preprocessing data from both PSRTS and Justice40. Then, the potential features are selected using the PFS technique, and the data is partitioned into training and testing sets with a ratio of 75% to 25%. The training and testing sets are randomly generated, ensuring they include households with EHVs from BCs and non-BCs. The training set consists of 14,775 observations for non-BCs and 2,262 for BCs, while the testing set has 733 for BCs and 4,946 for non-BCs. The PSO-Stacking model is trained using five-fold cross-validation. The PSO algorithm runs for 10 iterations to optimize hyperparameters for the base learners, improving the customized F1-score-based objective function with each iteration. The best hyperparameters are then applied to the PSO-Stacking model to estimate EHV ownership for BCs and non-BCs. The optimal hyperparameters obtained using PSO for the proposed model are given in Table 3.
Optimal Hyperparameters for the Proposed Solution Using PSO
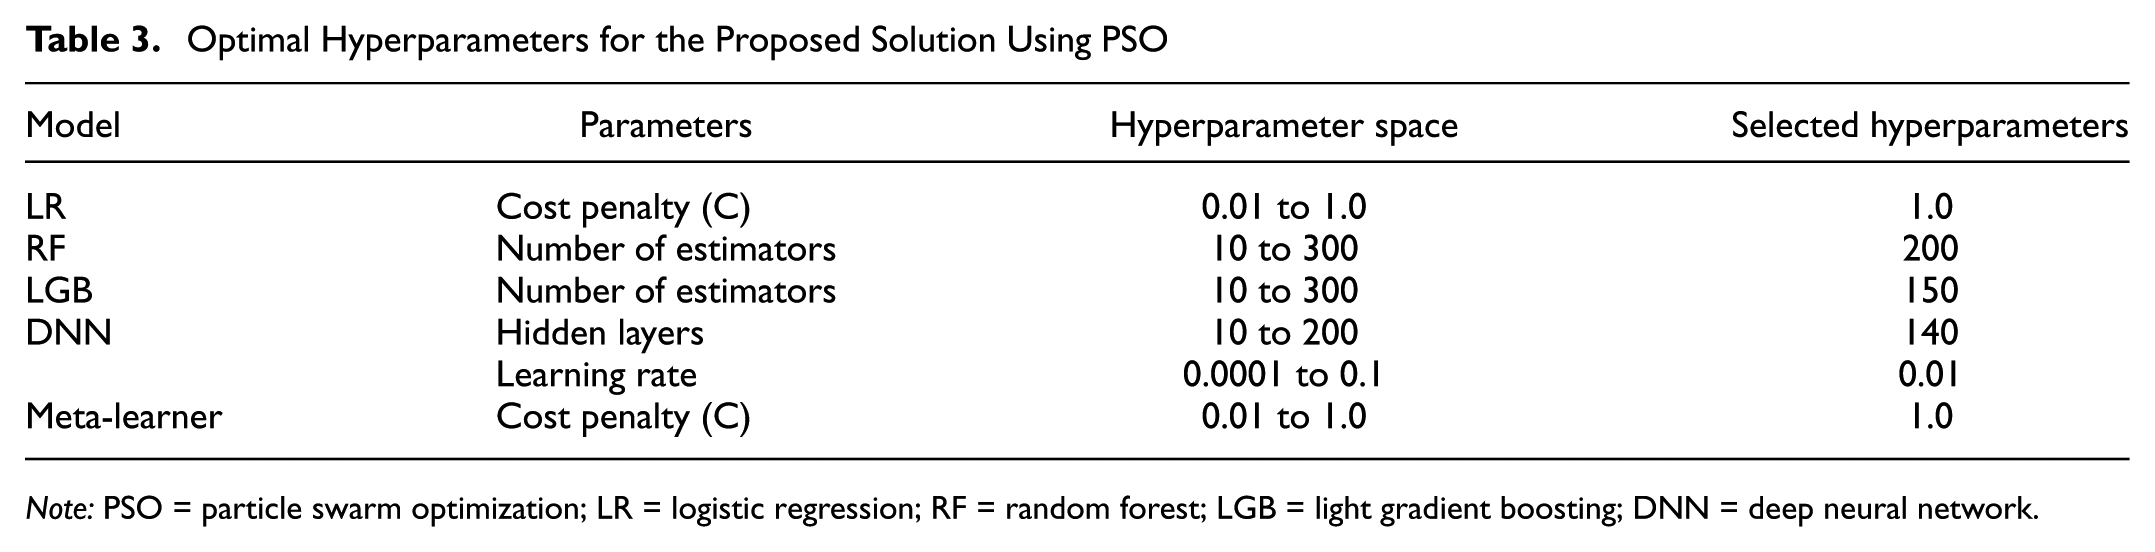
Note: PSO = particle swarm optimization; LR = logistic regression; RF = random forest; LGB = light gradient boosting; DNN = deep neural network.
Performance Metrics
The EHV ownership analysis for BCs and non-BCs is a data imbalance problem where the non-BCs class is in majority. Conventional studies have used accuracy as a performance measure, which is less accurate in indicating the model’s performance in relation to data imbalance. Therefore, it is crucial to measure the performance of the proposed solution against the most appropriate performance indicators for the class imbalance problem. In this context, this study uses the seven most suitable performance indicators to analyze the performance of the PSO-Stacking model from different perspectives. The seven performance indicators are recall, precision, AUC, F1-score, MCC, accuracy, and B_accuracy. These performance metrics are acquired through the confusion matrix, which provides true positives (TP), false positives (FP), true negatives (TN), and false negatives (FN) as outcomes where positive (1) is BCs and negative (0) is non-BCs. The mathematical formulations of the seven adopted performance indicators are defined in Equations 5–10, as follows ( 15 ):




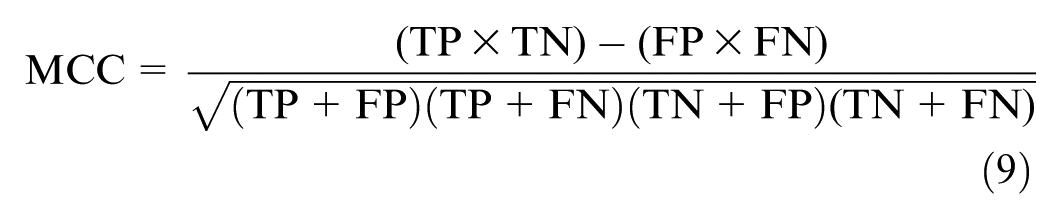

The TPR, also known as recall and sensitivity, provides the results about positive cases, that is, the EHVs for BCs correctly predicted by the model. Likewise, precision is the proportion of correctly predicting positive instances, which are positive. The precision and recall are not solely appropriate for the imbalanced class problem. Thus, the balance of both TPR and precision is provided by the F1-score. The F1-score is a more reliable and suitable performance index for analyzing BCs EHV ownership. AUC and MCC scores are the other reliable and practical measures for understanding EHV ownership. The AUC, also known as the receiver operating characteristics curve (ROC-AUC), focuses on improving TPR with a higher rank than the negative prediction by following a threshold. An AUC of 0.5 suggests random chance, while an AUC score closer to 1.0 indicates the perfect prediction of EHV ownership for BCs. Likewise, MCC captures the relationship between all possible outcomes, such as TP, FP, TN, and FN. The MCC score is more appropriate than the other performance measures in relation to imbalanced data where the score ranges from −1 to 1, showing the accurate characterization of EHV ownership for BCs. Furthermore, to compare the accuracy measure, another reasonable metric, identified as B_accuracy, is used in this study, which offers the arithmetic mean of TPR and true negative rate (TNR). Therefore, the performance of the proposed PSO-Stacking model for understanding BCs and non-BCs EHV ownership is evaluated using the most appropriate and reliable performance measures.
Performance Comparison and Results Discussion
Table 4 compares the performance of the proposed PSO-Stacking model with traditional models for understanding EHV ownership in BCs and non-BCs. The PSO-Stacking model performs exceptionally well, with a high precision of 96.10%, meaning it rarely misclassifies non-BC owners as BCs. It also achieves an 85.29% recall, successfully identifying many actual EHVs owners in BCs and outperforming other models despite data imbalance. The model’s F1 score of 88.50% reflects a good balance between precision and recall. An AUC score of 96.80% shows excellent discrimination between BCs and non-BCs in relation to EHV ownership. The MCC score of 87.10% further confirms its strong predictive power, which is crucial for imbalanced datasets. Although the model’s accuracy is high at 97.50%, the B_accuracy of 90.37% provides a more reliable measure for imbalanced data, considering both recall and TNR. The PSO-Stacking model is particularly effective in analyzing the minority BCs class, consistently performing well across various metrics and demonstrating its capability in addressing the challenges of EHV ownership in BCs.
Performance Comparison of PSO-Stacking versus Benchmarks
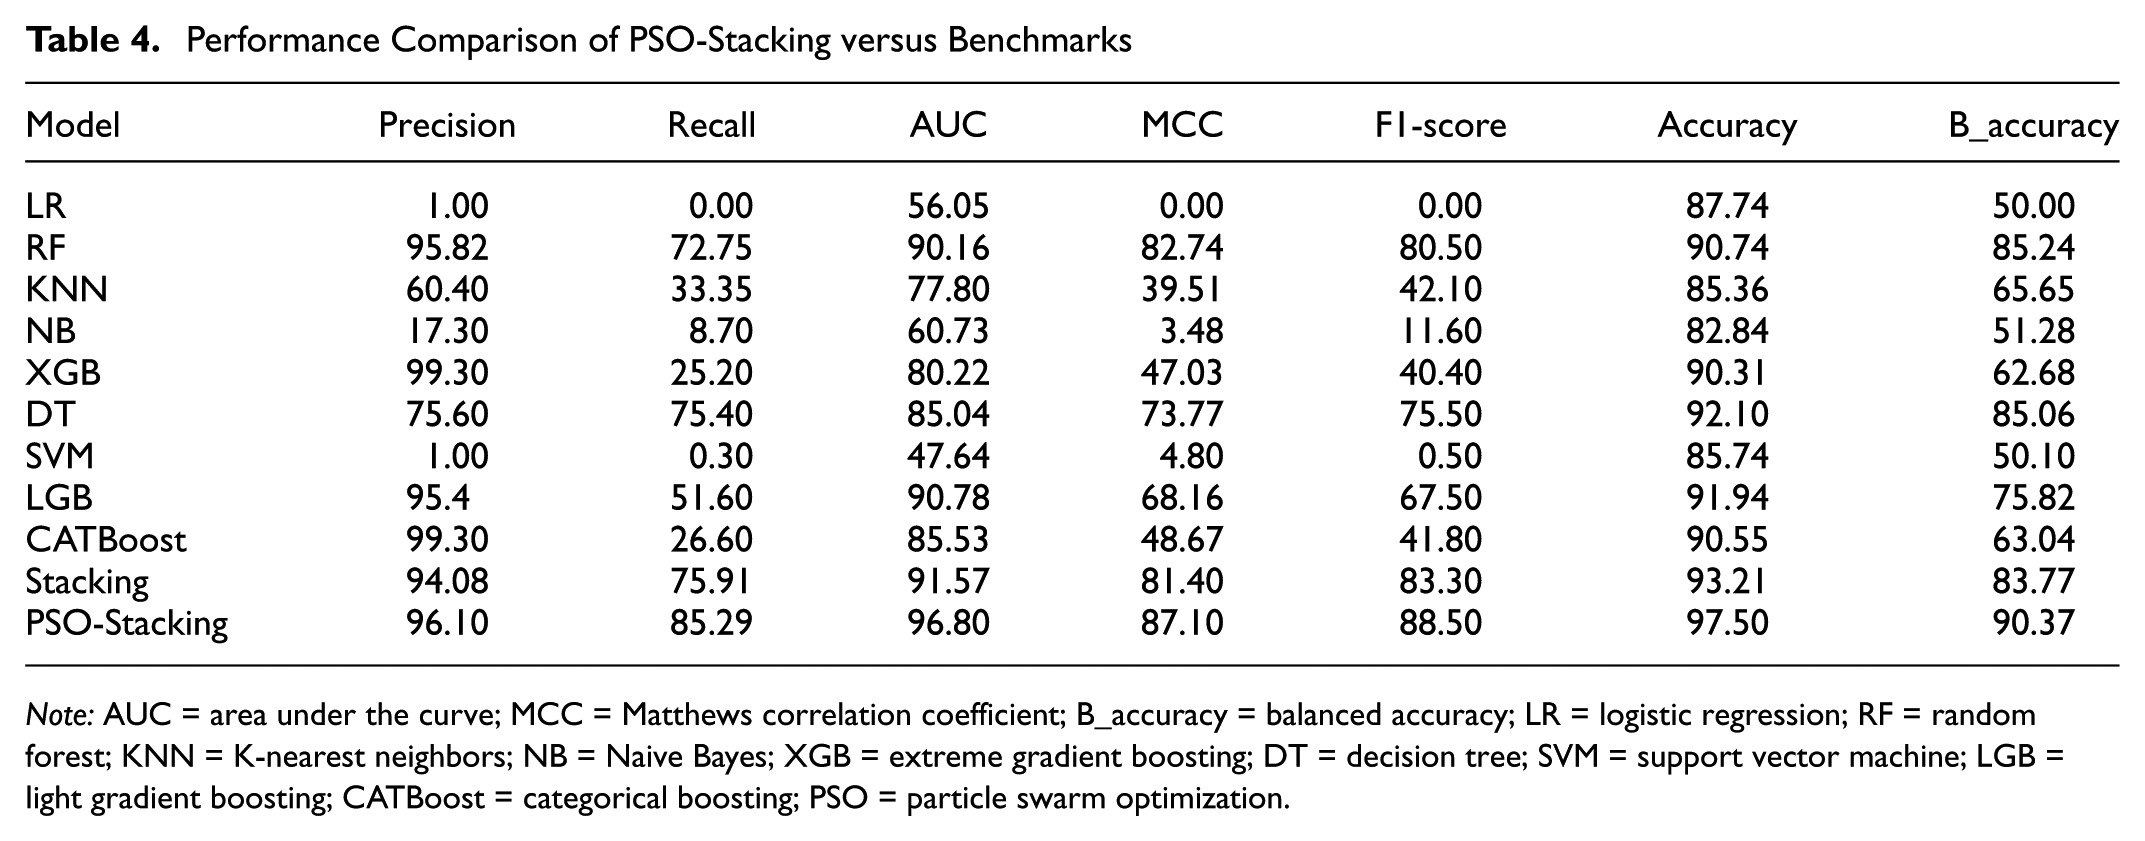
Note: AUC = area under the curve; MCC = Matthews correlation coefficient; B_accuracy = balanced accuracy; LR = logistic regression; RF = random forest; KNN = K-nearest neighbors; NB = Naive Bayes; XGB = extreme gradient boosting; DT = decision tree; SVM = support vector machine; LGB = light gradient boosting; CATBoost = categorical boosting; PSO = particle swarm optimization.
Furthermore, the proposed solution is compared with the benchmark models for EHV ownership analysis, including LR, RF, KNN, Naive Bayes (NB), XGB, DT (also known as classification and regression tree [CART]), support vector machine (SVM), LGB, categorical boosting (CATBoost), and a variant of the proposed solution, that is, proposed stacking model without PSO-based hyperparameters tuning. The benchmark models are trained and evaluated using the same training and testing sets to construct the proposed solution. The results for performance comparison are given in Table 4. The results in Table 4 show that the proposed PSO-Stacking model outperforms all benchmark models in characterizing EHV ownership for BCs and non-BCs. The PSO-Stacking model achieves the highest scores across all metrics, demonstrating its superior performance. It achieves a precision of 96.10%, slightly higher than XGB and CATBoost, which both have precision scores of 99.30%. However, XGB and CATBoost have low recall scores of 25.20% and 26.60%, respectively, indicating a high false negative rate and potential overfitting.
These models struggle to capture the complex patterns of EHV ownership in BCs. In contrast, the PSO-Stacking model has a high recall of 85.29%, effectively identifying a large proportion of actual EHVs owners in BCs. RF, DT, and the standard stacking model without PSO show moderate performance, with precision scores above 75% and recall scores between 72% and 76%. Models such as LR, SVM, and NB perform poorly, with some precision and recall scores near 0%, indicating their inability to handle the complex, nonlinear patterns in the data. These low scores suggest that these models incorrectly estimate many BCs owners as non-BCs owners because of the presence of high nonlinearity, multicollinearity, and complex patterns.
The PSO-Stacking model outperforms other models across various metrics. It achieves the highest F1-score (88.50%) and MCC (87.10%), while other models score between 0% and 83%. In addition, it leads in AUC score with 96.80%, outperforming LGB and RF with 90.78% and 90.16%, respectively. In relation to accuracy, PSO-Stacking excels with 97.50%, followed by Stacking (93.21%) and DT (92.10%). For balanced accuracy, PSO-Stacking is the best at 90.37%, with RF next at 85.24%. It is noted that several models in Table 4 exhibit high precision and accuracy scores but suffer from low recall, indicating a notable imbalance in their predictive performance, such as XGBoost and CATBoost. This pattern shows that these models are highly conservative in their positive predictions, rarely misclassifying non-BCs owners but frequently failing to identify actual BC owners. The discrepancy between high precision and accuracy scores, and low recall underscores the importance of considering multiple metrics, especially in imbalanced classification tasks. It highlights that high accuracy alone is misleading and requires other reliable metrics such as F1-score and MCC.
Notably, ensemble learning techniques such as RF, XGB, LGB, and CATBoost generally perform better than simpler models such as LR and SVM, highlighting the complexity of the EHV ownership understanding problem for BCs and non-BCs. The PSO-Stacking model consistently outperforms all other models across all metrics. It successfully balances precision and recall, demonstrating its effectiveness in handling the imbalanced nature of the EHV ownership prediction for BCs and non-BCs while minimizing both FP and FN. The model improves the prediction of EHVs owners in BCs without sacrificing FP.
To further demonstrate the performance comparison of the proposed PSO-Stacking model against conventional methods, Figures 4 to 6 show the run-time performance in relation to accuracy, F1-score and ROC-AUC using unseen dataset. Figure 4 demonstrates that the PSO-Stacking model achieves the highest accuracy in characterizing EHVs adoption in both BCs and non-BCs, followed by RF and DT. Likewise, Figures 5 and 6 illustrate the highest F1-score and ROC-AUC score of the proposed PSO-Stacking model against the conventional techniques on testing data, which shows the excellent strength of the proposed solution for handling class imbalance problem and getting balance between bias and variance, respectively. The CART, RF, and LGB have similar performance to each other. It is seen from the performance comparison results that the proposed solution efficiently deals with the class imbalance problem, nonlinearity, multicollinearity, overfitting problem, and getting balance between bias and variance. The results state that the proposed solution provides a more robust, generalized, and accurate model for EHV ownership understanding in both BCs and non-BCs.
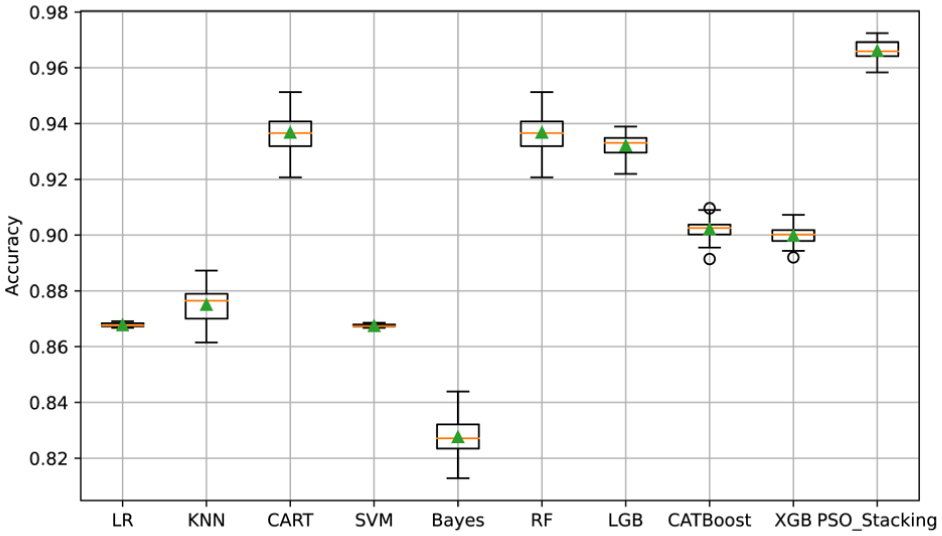
Accuracy-based comparison of PSO-Stacking versus benchmarks.
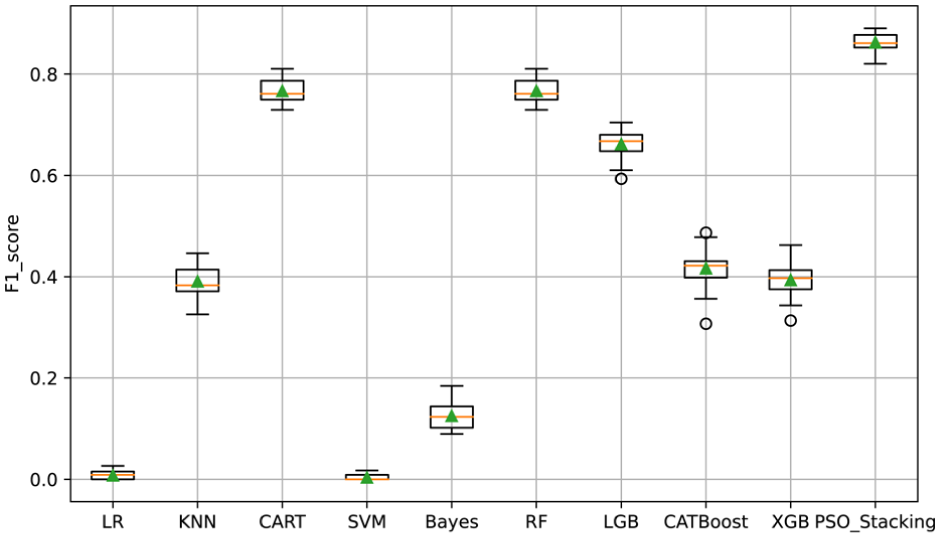
Comparison of PSO-Stacking and benchmarks using F1-Score.
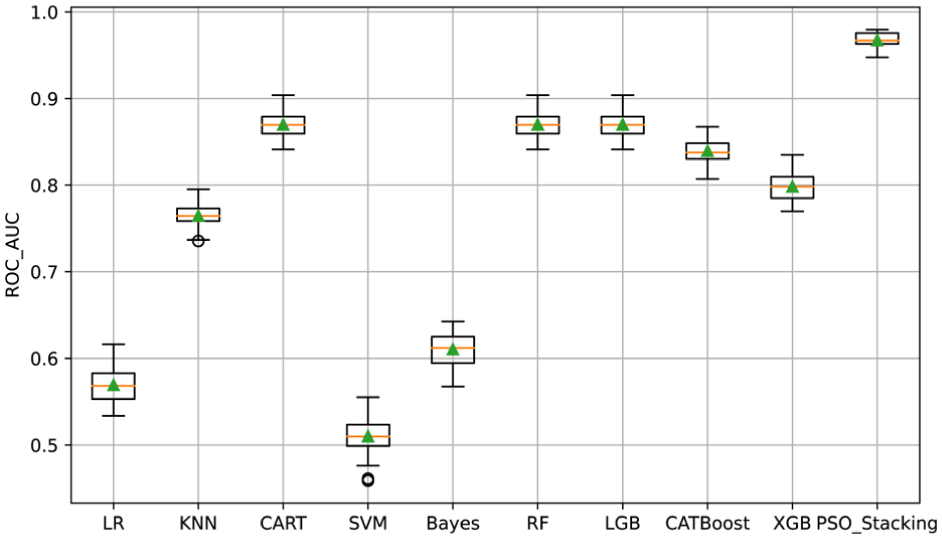
ROC-AUC-based performance comparison of PSO-Stacking versus benchmarks.
Furthermore, ROC-AUC and precision-recall AUC (PR-AUC) curves are shown in Figure 7. It is seen from Figure 7, a and b , that the proposed solution in relation to ROC-AUC and PR-AUC performs better than the other models while examining EHV ownership for BCs using the unseen dataset, respectively. The PSO-Stacking has a higher TPR and better precision-recall trade-off than the other models while estimating EHV ownership for BCs. The Stacking model without PSO also shows strong performance, but not as high as PSO-Stacking. Traditional models such as LR, RF, and others have lower performance in comparison, as indicated by their ROC and PR curves.
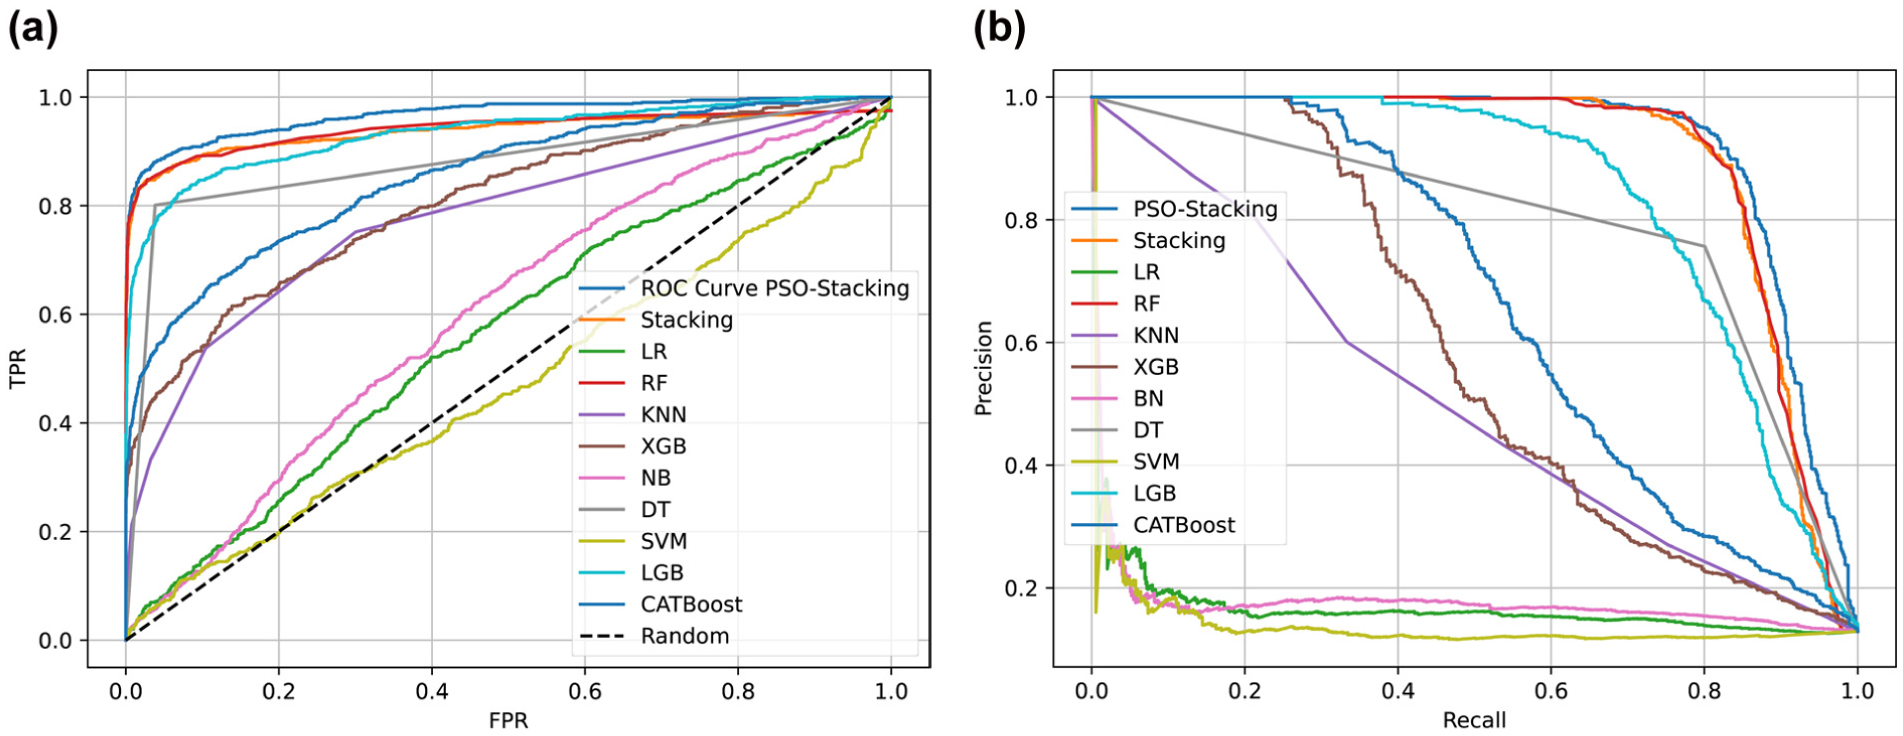
ROC-AUC and PR-AUC-based performance comparison: (a) ROC curve (TPR vs. FPR) and (b) precision recall curve (precision vs. recall) for PSO-Stacking and the benchmark models in predicting EHV ownership for BCs.
To interpret the results of the proposed PSO-Stacking model, an XAI technique LIME is used, with explanations provided for both EHVs in BCs and non-BCs, as shown in Figures 8 and 9, respectively. LIME explanations include three parts: the overall class prediction probabilities of the model, the contribution of features, and the true values of these contributing features. The x-axis shows the contribution of the features against the true values of features on y-axis. Figure 8a shows that self-employment status such as owning a business, owning a house, single vehicle count, the household income is not falling in either first or second income category, and ozone value less than equal to 31.49 represents a BCs household with EHV ownership. These are the major factors using PSO-Stacking model to characterize EHV ownership for BCs. Likewise, another example in Figure 8b indicates that a household belongs to BCs with EHV ownership if it has more than two trip chains, owns a house, falls into the highest income category (over $150,000), and having regional population above 5,598. The LIME explains the excellence of the proposed solution while understanding the ownership of EHVs in BCs and non-BCs. It is seen from the LIME explanations that the model considers a multifaceted approach, examining socioeconomic factors, housing conditions, employment status, and travel patterns to predict EHVs adoption.
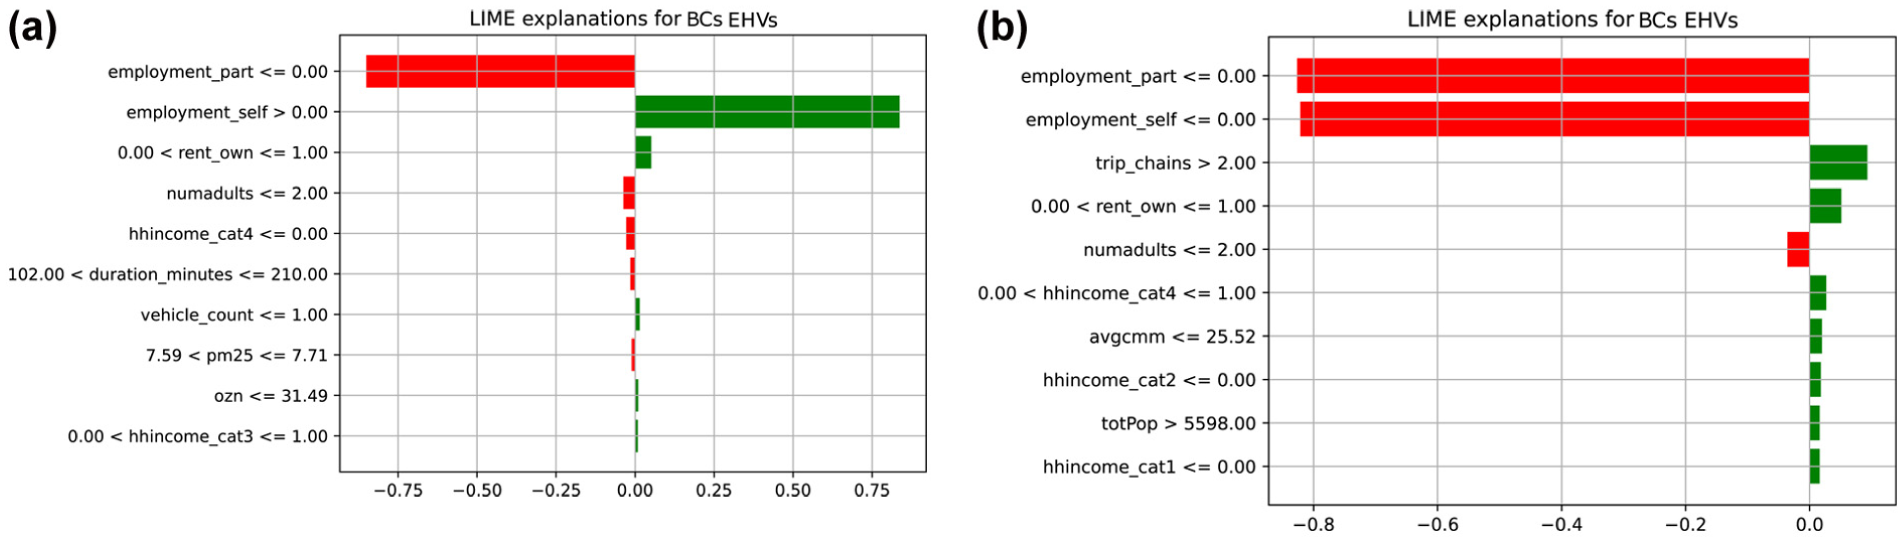
LIME-based interpretation of the PSO-Stacking model's results for EHVs ownership in BCs: (a) and (b) show LIME explanations for two representative BC household instances, each displaying the model's class prediction probabilities, the contribution of features (x-axis) toward the prediction, and the true values of those features (y-axis).
In contrast, Figure 9 explains the PSO-Stacking analysis results using LIME for EHVs in non-BCs. Figure 9a shows that the model has assigned the highest class estimation probabilities to non-BCs class with EHV ownership based on having a job, two or fewer adults, one or fewer trip chains, rental status, and household income in the first to third categories. The analysis shows that the household belongs to a non-BC household because of the less than 12018 mean transportation cost. These factors indicate a household with low income and rental status in non-BCs. Another example of EHVs in non-BCs is shown in Figure 9b, where LIME highlights employment status is job holder, rental housing status, more than $150,000 income, number of adults and trip chain less than 2, and less populated area act as major predictors in defining EHV ownership in non-BCs. The LIME explanation shows that key predictors are population size, household composition (typically 2 or fewer adults), and specific income categories. The model considers travel patterns (limited trip chains), mobility metrics (high household vehicle numbers), and employment status (minimal self or part-time employment). Housing tenure and additional environmental indicators also play significant roles. These explanations demonstrate that EHVs adoption is not driven by a single factor, but rather by a combination of socioeconomic, demographic, and environmental characteristics that differ between BCs and non-BCs communities.
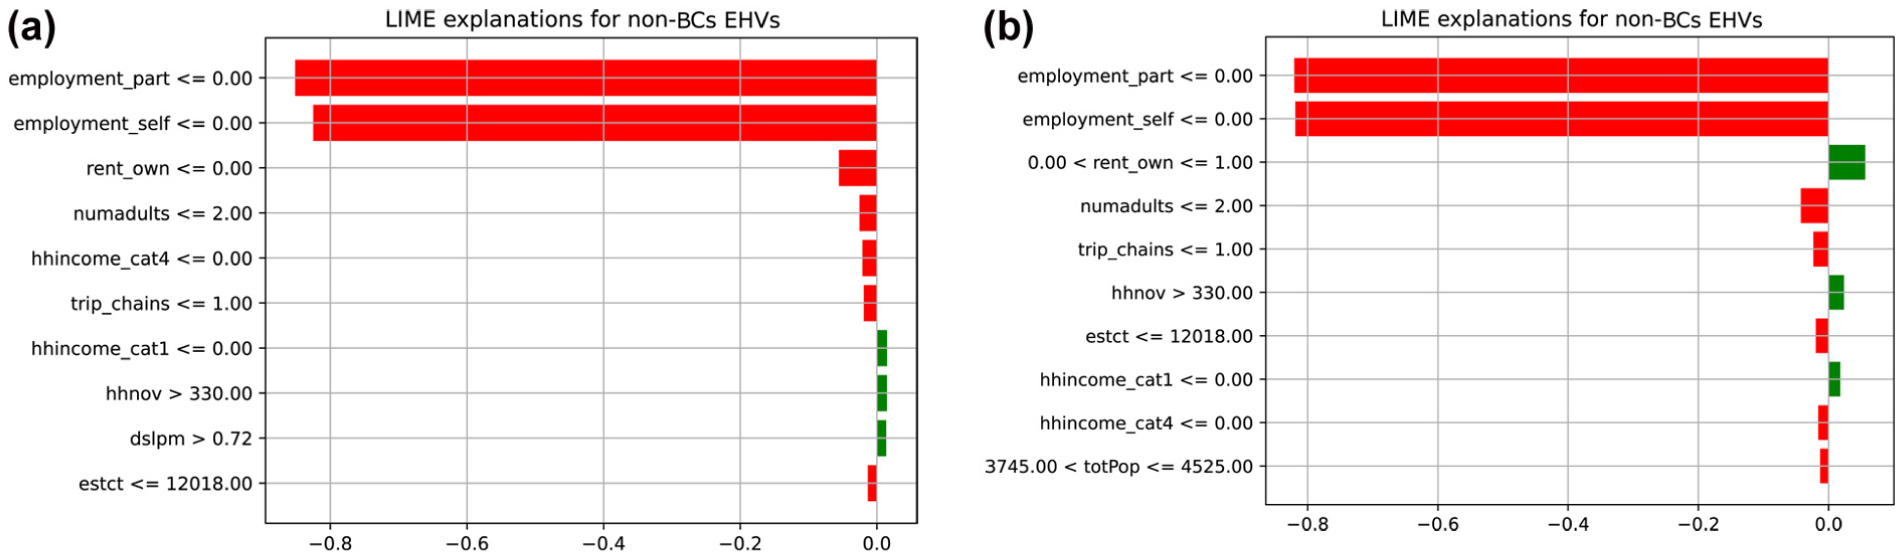
LIME-based interpretation of the PSO-Stacking model for EHV ownership in non-BCs: Panels (a) and (b) present local explanations for two representative non-BC household instances, each reporting the predicted class probabilities, the per-feature contributions to the prediction (x-axis), and the corresponding observed feature values (y-axis).
BCs Spatial Analysis Based on EHV Ownership
The spatial analysis at both BCs and non-BCs levels is depicted in Figure 10. In this analysis, “fuel” indicates regions with EHVs and non-EHVs, while a “BCs” value of 1 represents burdened areas. In BCs, regions with significant EHVs penetration see an average of about 20 daily trips per household, compared with around 17 in non-BC areas. The daily VMT and travel time in BCs regions range from 0 to 100 mi and 3 to 300 min, respectively, reflecting the economic fuel consumption of EHVs. These regions also exhibit higher average commute times (avgcmm), household incomes (HH_income) exceeding $100,000, and mean population sizes (totpop) of 5,000. This suggests a positive correlation between higher incomes, more daily trips, longer avgcmm, and EHV ownership in both BCs and non-BCs areas. Conversely, non-BC areas with EHVs tend to have lower totpop, higher annual household incomes, and higher rates of full-time employment, which contribute to EHVs adoption. In addition, the estimated transportation cost (estct) in EHVs-based non-BC regions is higher than that of non-BCs.
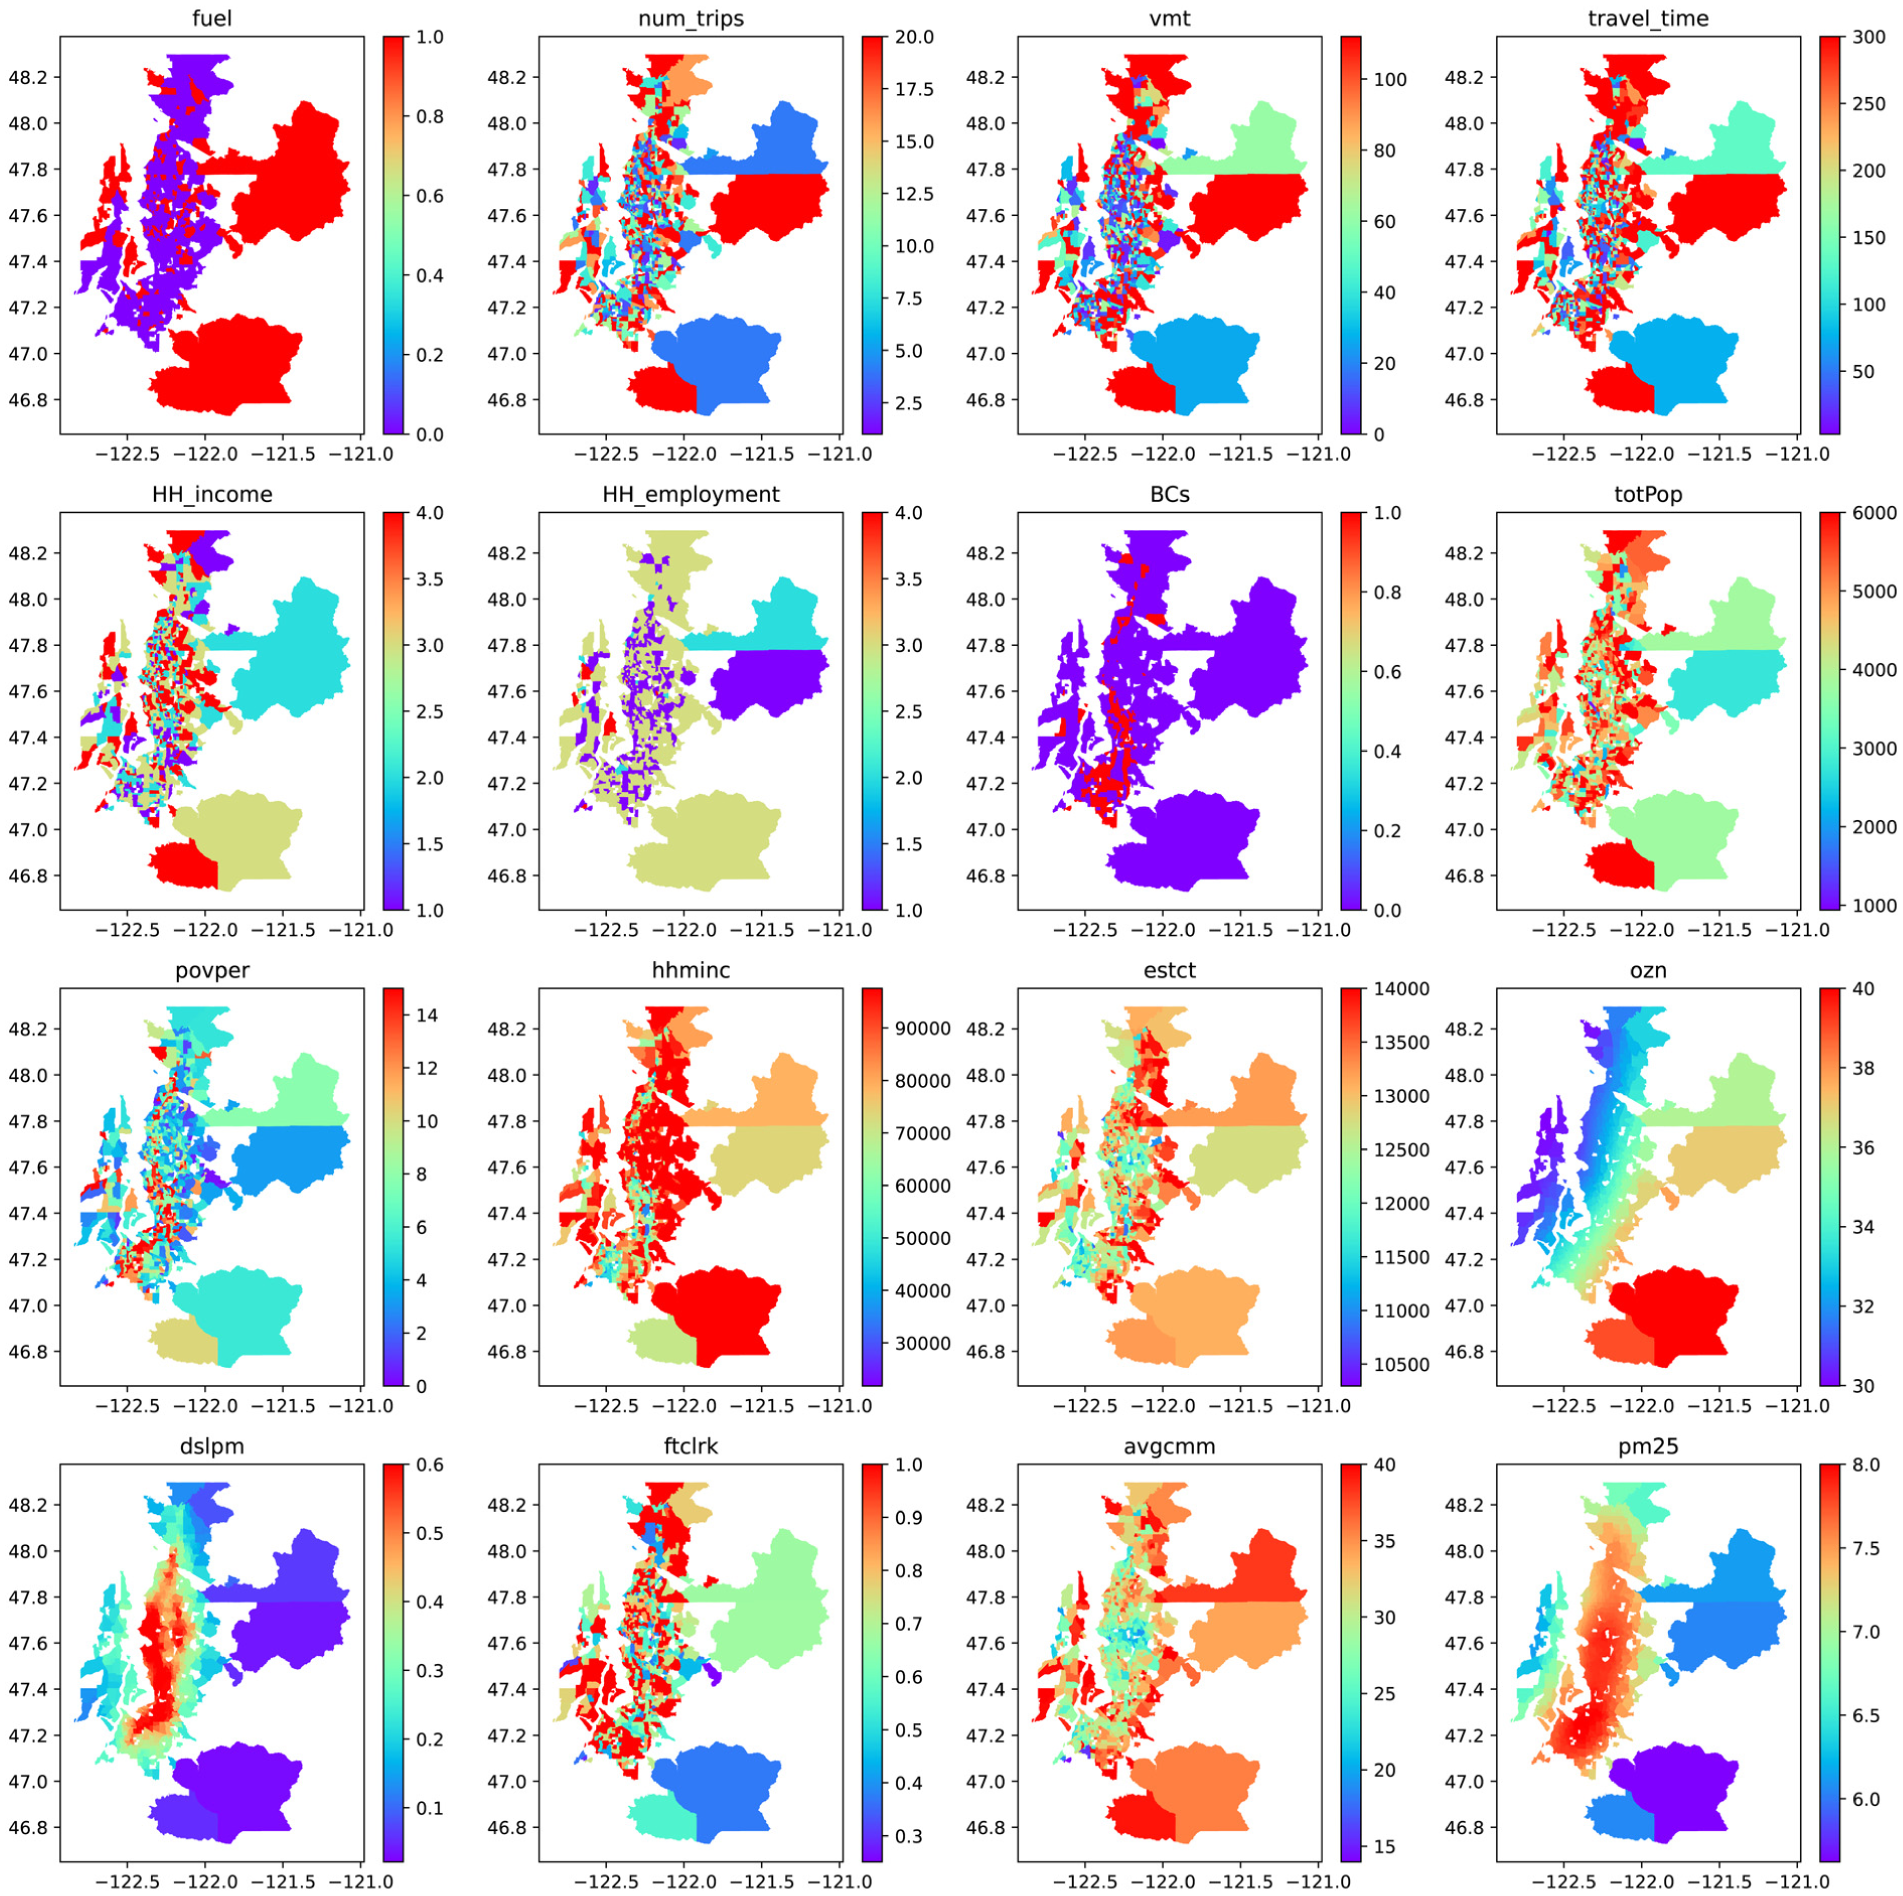
BCs and non-BCs-based spatial analysis to analyze the influence of EHVs.
Environmentally, the non-BCs regions with more EHVs have lower diesel particulate levels (Dslpm), averaging around 0.58, because of fewer diesel emissions. The BCs, however, exhibit higher levels of dslpm, highlighting the need for sustainable infrastructure. The air quality indicator, fine particulate matter PM2.5, is lower in high-EHVs non-BCs regions, but very high in BCs, as shown in Figure 10. The excessive level of PM2.5 in the air increases the risk of chronic diseases including heart disease, lung cancer, and respiratory conditions. The non-BCs regions with more EHVs have a low future climate risk score (ftclrk), below 0.7, while burdened regions have higher scores above 0.8, indicating greater climate risks. In addition, BCs have lower ground-level ozone (ozn) concentrations than the regions with more EHVs in non-BCs. This analysis underscores the socioeconomic and environmental disparities between areas with and without significant EHVs adoption in both BCs and non-BCs.
The proposed study on EHV ownership in BCs and non-BCs reveals significant socioeconomic and environmental disparities that have important implications for policy, climate risk mitigation, and future research. The BCs generally have lower EHVs penetration, primarily because of income constraints and inadequate infrastructure, highlighting the need for targeted incentives and the development of EVs infrastructure. In addition, these areas face greater climate-related risks, characterizing higher air pollutants such as Dslpm and PM2.5, poorer overall air quality, lower ground-level ozone, and higher Ftclrk score, emphasizing the urgency of environmental justice initiatives. Economically, BCs are marked by lower incomes, fewer daily trips, and less VMT. The combination of these factors results in a higher Ftclrk ratio in underserved areas. We find that the policy measures such as targeted EHVs incentives, infrastructure development, public transportation electrification, and community education are required to address these challenges in BCs. The adoption of EHVs in BCs could reduce emissions, enhance climate resilience, and provide economic benefits.
The proposed PSO-Stacking model aids in predicting EHV ownership in burdened areas, which is crucial for designing effective transport electrification policies, building the necessary infrastructure, managing energy, providing incentives, and analyzing climate change impacts and zero vehicle mandates. In addition, the model’s predictions help to strategically allocate resources to the BCs. Furthermore, the proposed framework is limited in analyzing the private EHV ownership in both BCs and non-BCs without considering the commercial fleets, heavy-duty vehicles, and highway infrastructure in BCs. For instance, if BCs are more likely to be located near major trucking routes or highways, this could be a major confounding factor in the air quality measurements not captured in the current analysis. In addition, it is challenging to characterize household characteristics with multiple individuals having both CVs and EHVs. Therefore, future research will focus on considering these limitations as well as energy management, such as grid load management, renewable energy, and charging stations.
Conclusion
The primary objective of this study is to understand the significance and characteristics of EHV ownership in both BCs and non-BCs. To achieve this, we introduced a new solution for understanding EHV ownership utilizing two datasets, PSRTS and Justice40, which encompass both aggregated and disaggregated characteristics. The proposed PSO-Stacking model employs heterogeneous base learners, including LR, RF, LGB, and DNN, to effectively capture nonlinearity, multicollinearity, and address data imbalance and overfitting issues. The model finds an optimal balance between bias and variance by optimizing hyperparameters through PSO with a customized objective function. The PSO-Stacking model outperformed benchmark models with impressive results. In addition, the model results are interpreted using the XAI technique, LIME. The PSO-Stacking model’s interpretability through LIME reveals distinct socioeconomic and environmental predictors for EHV ownership in BCs and non-BCs.
The model highlights significant factors, such as employment status, housing, income, trip chains, Ftclrk, Dslpm, PM2.5, and regional ozone values, emphasizing these regions’ disparities and specific needs for EHVs adoption. The spatial analysis reveals a negative correlation between BC indicators and EHV ownership. BCs exhibit higher Ftclrk, Dslpm, and PM2.5 concentrations in the air than non-BCs, largely because of the higher penetration of conventional fuel vehicles. These factors collectively indicate that BCs are at higher risk from climate change and poor air quality than the non-BCs. The proposed study underscores the need to promote EHVs adoption, improve infrastructure, and implement supportive government policies in BCs. However, its limitations include focusing solely on private EHV ownership without considering commercial fleets, heavy-duty vehicles, and highway infrastructure in BCs. In addition, it is difficult to characterize multivehicle households and potential non-coverage errors in behavioral data. Future research will address these limitations while focusing on energy management strategies, including grid load management and infrastructure.
Footnotes
Acknowledgements
This study uses Puget Sound Regional Travel Survey and Justice40 data. The authors would like to thank the reviewers and mentors for their insightful comments and suggestions, which significantly enhanced the quality of this manuscript. This manuscript has been authored by employees of UT-Battelle, LLC, under contract DEAC05-00OR22725 with the US Department of Energy (DOE). Accordingly, the publisher, by accepting the article for publication, acknowledges that the US government retains a nonexclusive, paid-up, irrevocable, worldwide license to publish or reproduce the published form of this manuscript, or allow others to do so, for US government purposes. DOE will provide public access to these results of federally sponsored research in accordance with the DOE Public Access Plan ( ).
).
Author Contributions
The authors confirm contribution to the paper as follows: study conception and design: Zeeshan Aslam, Asad Khattak, Moetasim Ashfaq; data collection: Zeeshan Aslam; analysis and interpretation of results: Asad Khattak, Zeeshan Aslam; draft manuscript preparation: Zeeshan Aslam, Asad Khattak, Moetasim Ashfaq. All authors reviewed the results and approved the final version of the manuscript.
Declaration of Conflicting Interests
The authors declared no potential conflicts of interest with respect to the research, authorship, and/or publication of this article.
Funding
The authors disclosed receipt of the following financial support for the research, authorship, and/or publication of this article: This work is supported by the National Climate-Computing Research Center, located within the National Center for Computational Sciences at the ORNL, and supported under a Strategic Partnership Project 2316-T849-08 between the US Department of Energy and the National Oceanic and Atmospheric Administration. This research used the Oak Ridge Leadership Computing Facility resources, a DOE Office of Science User Facility supported under Contract DE-AC05-00OR22725.