
Abstract
Level of service (LOS) is a fundamental performance measure in traffic engineering practice, widely used to evaluate roadway operating conditions and based primarily on average traffic measures such as mean speed. While effective for standardization, conventional LOS assessment may fail to capture the dynamic and stochastic nature of traffic flow, particularly under congested and transitional conditions. This study revisits LOS assessment by explicitly incorporating traffic flow variability into the evaluation framework. Traffic is conceptualized as a stochastic dynamic system in which traffic states with similar mean speeds may exhibit substantially different stability characteristics. Building on this premise, a variability-based LOS framework (LOS-V) is proposed, integrating standardized speed variability and acceleration noise as indicators of traffic stability. The proposed framework is evaluated using high-resolution vehicle trajectory data from the Next Generation Simulation dataset. A cross-classification analysis between conventional LOS and LOS-V reveals substantial redistribution across service categories, particularly for intermediate traffic states. Sensitivity analysis further confirms that the LOS-V classification is robust to variations in weighting coefficients. The results demonstrate that average speed alone is insufficient to distinguish between stable and unstable traffic states and may mask important operational deficiencies. Overall, the LOS-V framework enhances the interpretability and diagnostic capability of LOS assessment by providing a more behaviorally meaningful representation of traffic operating conditions in data-rich traffic environments.
Keywords
Introduction
Background
Level of service (LOS) has long been recognized as one of the most fundamental performance measures in traffic engineering and transportation planning. It provides a standardized framework for evaluating roadway operating conditions and has been widely adopted for planning, design, and operational decision-making through the Highway Capacity Manual (HCM) ( 1 , 2 ). By translating complex traffic conditions into discrete qualitative categories, LOS enables practitioners to communicate system performance in a clear and consistent manner across different roadway facilities.
In its current form, LOS assessment for freeways and urban roadways relies primarily on aggregate measures such as mean speed, traffic density, and delay ( 2 , 3 ). These measures implicitly assume that traffic conditions can be adequately represented by average states over space and time. LOS has become deeply embedded in traffic operations analysis, infrastructure investment decisions, and performance-based evaluation of roadway systems ( 4 – 6 ).
Despite its widespread use and practical value, several studies have highlighted that LOS, as currently defined, may not fully capture the dynamic and heterogeneous nature of traffic flow, particularly under congested or transitional conditions ( 1 , 3 ). With the increasing availability of high-resolution traffic data, new opportunities have emerged to revisit traditional performance measures and reassess their ability to represent actual operational conditions experienced by drivers.
Motivation
Traffic flow is inherently dynamic and stochastic, characterized by continuous fluctuations in speed, acceleration, and vehicle interactions, even under similar average operating conditions. Empirical studies have shown that traffic streams with comparable mean speeds may exhibit fundamentally different dynamic behaviors, ranging from stable flow to pronounced oscillations and stop-and-go waves ( 7 – 9 ). These dynamics are closely related to speed variability, acceleration noise, and traffic flow instability, which are not explicitly accounted for in conventional LOS definitions.
Speed variability, in particular, has been shown to play a critical role in shaping traffic operations. Variations in speed are associated with traffic oscillations, lane-changing behavior, capacity degradation, and driver workload ( 7 , 10 – 12 ). High levels of speed and acceleration variability often indicate unstable operating conditions, even when average speeds suggest acceptable performance levels ( 8 , 13 ). Consequently, reliance on mean speed alone may mask important differences in operational quality across roadway segments.
The increasing availability of high-resolution vehicle trajectory data, such as the Next Generation Simulation (NGSIM) dataset, enables direct observation of microscopic traffic dynamics at fine temporal scales ( 14 , 15 ). These data provide a unique opportunity to quantify speed variability and acceleration noise with unprecedented detail, allowing traffic performance to be evaluated beyond traditional average-based measures. This motivates a systematic re-examination of LOS assessment through the lens of traffic flow variability and dynamic stability.
Research Gap
Previous research has extensively examined LOS concepts, their applications, and their limitations across various roadway contexts ( 1 – 6 ). Parallel streams of research have investigated speed variability, traffic oscillations, and flow instability from both empirical and theoretical perspectives ( 7 – 9 , 11 – 13 , 16 – 20 ). In addition, several studies have proposed alternative or complementary performance indicators, such as travel time reliability and variability-based measures, to enhance traffic operations assessment ( 21 , 22 ).
However, despite these advances, a clear gap remains between traffic flow theory and operational LOS evaluation. Existing studies on speed variability and traffic instability largely focus on understanding underlying mechanisms, safety implications, or control strategies, without explicitly integrating these dynamics into LOS classification frameworks ( 7 – 9 , 13 , 23 , 24 ). Conversely, LOS-based studies continue to rely predominantly on mean speed or delay, with limited consideration of intra-period variability and dynamic fluctuations.
To date, no widely accepted framework has explicitly incorporated speed variability and acceleration noise into LOS assessment in a manner that is both operationally meaningful and practically applicable. As a result, current LOS classifications may assign similar service levels to traffic states that are operationally distinct in stability, driver experience, and susceptibility to breakdown ( 25 – 27 ).
Objectives and Contributions
The primary objective of this study is to revisit LOS assessment from a traffic operations perspective by explicitly incorporating speed variability and acceleration noise into the evaluation framework. Using high-resolution vehicle trajectory data, this research aims to move beyond average-based performance measures and provide a more comprehensive representation of traffic operating conditions.
The specific objectives of this study are to:
1) Quantify speed variability and acceleration noise under different freeway operating conditions using high-resolution trajectory data.
2) Develop a variability-based LOS framework (LOS-V) which complements traditional LOS definitions.
3) Examine the extent to which conventional LOS classifications fail to distinguish between stable and unstable traffic states.
4) Demonstrate the operational relevance of variability-based indicators for traffic performance assessment.
This study makes three main contributions to the evaluation of traffic operational performance. First, it introduces the LOS-V framework which integrates speed variability and acceleration noise into a unified, standardized index, providing a complementary perspective to conventional mean-speed-based measures. Second, it develops a cross-classification analysis framework that enables systematic comparison between conventional LOS and variability-based traffic states, revealing conditions where average-based metrics may mask underlying instability. Third, the study demonstrates the practical applicability of the proposed framework using high-resolution trajectory data, highlighting its potential to support more informative and behaviorally meaningful traffic performance assessment.
Literature Review
LOS in Traffic Operations
LOS has been widely used as a primary indicator for evaluating roadway operational performance in traffic engineering practice. Through its adoption in HCM, LOS provides a standardized framework for assessing traffic conditions based mainly on aggregate measures such as mean speed, density, and delay ( 1 – 3 ). This framework has been extensively applied to freeways, urban streets, and signalized intersections to support planning, design, and operational decisions ( 4 – 6 ).
Despite its practicality, several studies have noted that traditional LOS definitions rely heavily on average conditions and may not adequately reflect the dynamic nature of traffic flow ( 1 – 3 ). As traffic systems become more complex and data-rich, the limitations of average-based LOS measures have motivated researchers to reconsider how operational performance is defined and evaluated ( 2 , 6 ).
Speed Variability and Traffic Flow Stability
Traffic flow stability has been shown to be closely related to speed variability and the emergence of traffic oscillations. Empirical and theoretical studies have demonstrated that speed fluctuations can lead to stop-and-go waves, capacity reductions, and transitions from stable to unstable traffic states ( 7 – 9 , 23 ). Even under similar mean-speed conditions, traffic streams may exhibit markedly different dynamic behaviors depending on the level of speed variability and driver interactions ( 8 , 13 ).
Speed variability has also been linked to microscopic driving behavior, including lane-changing activity and car-following dynamics ( 10 , 12 ). Higher variability is often associated with increased acceleration noise and frequent speed adjustments, indicating unstable operating conditions ( 18 , 28 ). These findings suggest that speed variability provides valuable information about traffic stability that is not captured by conventional LOS measures.
Variability, Reliability, and Operational Performance
Several studies have explored traffic variability from the perspective of travel time reliability and operational consistency ( 21 , 22 ). Reliability measures typically focus on inter-period or day-to-day variations in travel time, offering insights into the predictability of system performance. While these measures are useful for planning and policy evaluation, they differ fundamentally from the intra-period variability that characterizes traffic flow dynamics at finer temporal scales.
In contrast, operational variability reflects short-term fluctuations in speed and acceleration that directly affect traffic stability and driver experience. Although previous research has examined variability-related indicators independently, these measures have rarely been integrated into LOS assessment frameworks ( 1 , 22 ). This disconnect highlights the need for a performance evaluation approach that explicitly accounts for dynamic variability while remaining compatible with operational LOS concepts.
Conceptual and Mathematical Framework
Traditional LOS Formulation
In traffic operations, LOS is traditionally defined as a qualitative representation of roadway operating conditions based on aggregate traffic characteristics. Mathematically, conventional LOS assessment can be expressed as a function of macroscopic average measures:

where
k = the traffic density, and
d = average delay.
This formulation implicitly assumes that traffic conditions within the evaluation interval are homogeneous and stationary. As a result, LOS classification primarily reflects the central tendency of traffic performance while neglecting temporal fluctuations around the mean state. Consequently, traffic streams with identical mean speeds may be assigned the same LOS, despite exhibiting fundamentally different dynamic behaviors.
Traffic as a Stochastic Dynamic System
Traffic flow is inherently dynamic, and exhibits stochastic characteristics arising from driver heterogeneity, vehicle interactions, and external disturbances. At the microscopic level, the speed of an individual vehicle i can be represented as a time-dependent stochastic process:

where
While conventional LOS captures only

indicating identical average performance but different dynamic qualities. This distinction motivates the explicit inclusion of variability measures in traffic performance evaluation.
Speed Variability Metrics
Speed variability is quantified by statistical dispersion measures computed over a predefined time window T and spatial segment S. For a set of observed vehicle speeds
Mean speed:

Speed standard deviation:

Speed coefficient of variation:

These metrics capture the magnitude of speed fluctuations relative to the operating speed level. Higher values of acceleration noise or speed coefficient of variation indicate increased instability and a greater propensity for traffic oscillations, even when average speed remains unchanged.
Acceleration Noise as Stability Indicator
Speed variability alone does not fully describe the dynamic nature of traffic flow. Acceleration behavior reflects the frequency and intensity of driver speed adjustments and provides additional insight into traffic stability. Vehicle acceleration is defined as:

Acceleration noise is quantified using the standard deviation of acceleration:

where
High acceleration noise indicates frequent corrective actions by drivers and is commonly associated with unstable car-following behavior and traffic oscillations. In contrast, stable traffic flow is characterized by low acceleration variance and smooth speed trajectories. Thus, acceleration noise serves as a complementary indicator of microscopic traffic stability beyond speed-based measures.
Proposed LOS-V Framework
Building on the preceding concepts, this study proposes the LOS-V framework, which augments traditional LOS assessment by explicitly accounting for traffic dynamics. Because the two LOS-V components are measured on different scales and units, direct aggregation may lead to scale imbalance and reduced interpretability. Specifically, the speed coefficient of variation is dimensionless, whereas acceleration noise has units of acceleration. To ensure meaningful aggregation, both variables were standardized before combination using Z-score normalization.
The standardized variables are defined as:


where
The revised LOS-V index is then formulated as:

where
α = the relative contribution of speed variability, and
β = the relative contribution of acceleration noise.
Since both variables α and β are expressed on a comparable standardized scale, the weighting coefficients become directly interpretable and neither variable dominates the composite index because of scale differences.
LOS-V classification is then defined through a set of threshold values

Unlike traditional LOS, the proposed framework distinguishes traffic states with similar mean speeds but differing levels of dynamic stability. By incorporating both speed variability and acceleration noise, LOS-V provides a multi-dimensional representation of traffic operating conditions that is mathematically transparent, operationally interpretable, and compatible with existing LOS concepts.
In this study, the threshold values
For ease of reference, the definitions of all variables and symbols used in the mathematical formulation are provided in Table 1.
Definition of Variables and Symbols Used in the Variability-Based Level of Service (LOS-V) Framework
Data Description
Dataset Overview
This study utilizes the NGSIM vehicle trajectory dataset provided by the U.S. FHWA. The NGSIM dataset contains high-resolution microscopic vehicle trajectories collected from real-world freeway segments using video-based detection systems. Vehicle positions, speeds, and accelerations are recorded at a temporal resolution of 0.1 s, enabling detailed analysis of traffic dynamics at fine temporal scales ( 14 , 15 ).
The dataset includes individual vehicle trajectories with associated attributes such as lane position, vehicle class, headway, speed, and acceleration. Its high temporal resolution makes it particularly suitable for examining short-term speed fluctuations, acceleration noise, and traffic flow stability, which are central to the proposed LOS-V framework. Because of its extensive use in traffic flow research, NGSIM provides a well-established benchmark for trajectory-based traffic operations analysis ( 10 , 14 , 15 ).
In this study, the dataset is used to analyze freeway traffic operating conditions over predefined spatial segments and temporal windows, enabling a cross-classification between conventional average-based LOS measures and the proposed variability-based indicators, thereby distinguishing between average traffic conditions and variability-driven traffic instability.
Data Preprocessing
Although the NGSIM dataset offers high-resolution trajectory information, previous studies have reported the presence of measurement noise and inconsistencies, particularly in derived speed and acceleration profiles ( 14 , 15 ). Therefore, a systematic preprocessing procedure is applied before analysis to ensure physical plausibility and computational reliability.
The preprocessing steps include:
1) Data consistency checks, ensuring continuity of vehicle trajectories and removal of incomplete records.
2) Physical validity screening, where unrealistic speed and acceleration values are filtered based on plausible operational bounds.
3) Trajectory smoothing, applied to reduce high-frequency noise in speed and acceleration time series while preserving essential traffic dynamics, following established reconstruction approaches in the literature ( 10 , 29 ).
These preprocessing steps ensure that the extracted speed variability and acceleration noise metrics accurately reflect traffic flow dynamics rather than artifacts of data collection or numerical differentiation. The resulting cleaned dataset forms the basis for all subsequent variability analysis and LOS-V computation.
Given the known sensitivity of acceleration estimates in the NGSIM dataset to measurement noise, a trajectory smoothing procedure was applied before computing variability metrics. Specifically, speed–time series were smoothed using a moving-average filtering approach to reduce high-frequency fluctuations introduced by numerical differentiation and measurement inconsistencies.
The smoothing window was selected to balance noise reduction and signal preservation, ensuring that short-term traffic dynamics, such as genuine acceleration and deceleration patterns, were retained. This step is particularly important for the computation of acceleration noise, which is highly sensitive to small variations in speed measurements.
As a result, the computed variability metrics represent physically meaningful traffic behavior, minimizing the influence of artificial oscillations caused by data noise while preserving true traffic flow dynamics.
Methodology
This section describes the implementation of the conceptual and mathematical framework presented in previous sections. The methodology outlines the procedures used to operationalize the proposed LOS-V framework, including spatiotemporal segmentation, computation of variability metrics, LOS-V classification, and comparison with conventional LOS assessment. The entire data processing and analysis workflow is designed to ensure consistency and reproducibility across all steps.
The study corridor is discretized into spatial segments of 150 m in length to ensure consistent spatial resolution while maintaining relatively homogeneous traffic conditions within each segment. In addition to spatial segmentation, the data are aggregated over fixed temporal intervals of 10 s, forming consistent segment–time-window analysis units.
Each spatiotemporal unit represents a localized traffic state defined by all vehicle observations occurring within the corresponding segment and time interval. This structured segmentation ensures that all traffic performance indicators are computed over consistent and reproducible analysis units.
Study Area and Segmentation
The analysis focuses on freeway traffic operations using high-resolution vehicle trajectory data. To ensure consistency in operating conditions, the study corridor is divided into spatial segments selected to maintain homogeneous geometric and operational characteristics within each segment.
All conventional LOS measures and variability-based indicators are computed over identical spatiotemporal units to ensure methodological consistency and enable direct comparison between LOS frameworks.
Computation of Variability Metrics
For each spatiotemporal analysis unit, individual vehicle trajectories are extracted and used to compute traffic performance indicators. Mean speed is first computed to represent aggregate operating conditions within the analysis unit. For each segment–time window, all vehicle observations falling within the defined spatial and temporal boundaries are grouped and aggregated. Mean speed is computed as the average of all vehicle speeds within the unit, while speed variability and acceleration noise are derived from the corresponding distributions of speed and acceleration.
Speed variability metrics are then calculated to quantify fluctuations around the mean operating state, following the definitions introduced in conceptual and mathematical framework section. These metrics capture the dispersion of vehicle speeds and provide insight into the dynamic behavior of traffic flow beyond average-based measures.
Acceleration profiles are derived from smoothed speed trajectories to mitigate high-frequency measurement noise. Acceleration variability is subsequently quantified to reflect the frequency and intensity of microscopic speed adjustments within each analysis unit. Together, speed variability and acceleration noise provide complementary indicators of traffic flow stability.
All variability metrics are computed consistently across spatiotemporal units to ensure comparability. Only spatiotemporal units with sufficient observations are retained to maintain statistical reliability of the computed indicators.
The smoothing of speed and acceleration profiles is performed using a moving average filter with a window size of five observations, applied along individual vehicle trajectories to reduce noise measurement while preserving essential traffic dynamics.
It should be noted that the coefficient of variation may become unstable when mean speed approaches zero, which can artificially inflate variability under highly congested conditions. To address this issue, a minimum speed threshold of 2 m/s is introduced when computing the coefficient of variation. Specifically, the denominator is bounded to avoid division by near-zero values, ensuring that the resulting variability measure remains physically meaningful and numerically stable.
LOS-V Classification
LOS-V is computed for each spatiotemporal analysis unit using the standardized composite formulation introduced in the conceptual framework. Before aggregation, the speed coefficient of variation and acceleration noise are transformed using Z-score normalization to ensure comparability and remove unit inconsistencies. This standardization ensures that both components contribute proportionally, and prevents dominance because of scale differences.
In the absence of previously established coefficients for combining short-term speed variability and acceleration noise within an LOS framework, this study adopts equal weighting (
For classification purposes, the continuous LOS-V index was grouped into six ordered categories (A–F) using a quantile-based empirical scheme. This baseline implementation was adopted to examine the relative redistribution of traffic states across spatiotemporal units and to identify how variability-based assessment reshapes the conventional service-level structure. Accordingly, the resulting LOS-V grades should be interpreted as relative empirical classes within the analyzed dataset rather than universal operational thresholds.
To improve interpretability, the LOS-V index is further associated with qualitative dynamic-state categories reflecting increasing levels of traffic instability. Specifically:
Stable: low LOS-V values, representing smooth traffic flow with minimal speed and acceleration fluctuations.
Transitional: moderate LOS-V values, representing emerging instability with noticeable fluctuations.
Unstable: high LOS-V values, representing pronounced traffic oscillations and frequent corrective driver behavior.
This classification framework enables a cross-classification between conventional mean speed-based LOS and variability-based traffic states, allowing the analysis to identify situations where average operating conditions mask important dynamic instability.
Comparison with Conventional LOS
For each spatiotemporal analysis unit, conventional LOS is determined using standard mean speed-based criteria consistent with current practice. The resulting LOS classifications are then evaluated jointly with LOS-V outcomes derived for the same spatiotemporal units.
It is important to note that conventional LOS and LOS-V do not measure identical aspects of traffic performance. Conventional LOS primarily reflects average operating conditions, whereas LOS-V captures traffic variability and dynamic instability. Therefore, the analysis is framed as a cross-classification between two complementary dimensions of traffic performance, rather than a direct one-to-one comparison.
This cross-classification framework enables the identification of traffic states where similar average conditions correspond to different levels of dynamic stability, highlighting the limitations of conventional LOS in capturing variability-driven operational characteristics.
Results
Descriptive Statistics of Speed Variability and Acceleration Noise
This section presents the descriptive characteristics of the traffic dynamics indicators used to construct the proposed LOS-V framework. Summary statistics for mean speed, speed variability, and acceleration noise computed at the segment–time-window level are reported in Table 2.
Descriptive Statistics of Traffic Performance Indicators
Note: CV = coefficient of variation; SD = standard deviation.
The results indicate substantial dispersion in both speed variability and acceleration noise across the analyzed spatiotemporal units. While mean speed values span a wide operational range, coefficient of variation exhibits pronounced right-skewness, with extreme values observed under near-zero mean speed conditions. These values are primarily associated with highly congested traffic states where small absolute speed fluctuations can lead to disproportionately large coefficient of variation values. To ensure robustness, a minimum speed threshold is applied in the revised analysis to prevent numerical instability in coefficient of variation computation.
The distribution of speed variability is illustrated in Figure 1, which shows that the majority of observations fall within low-to-moderate variability ranges, while a non-negligible tail corresponds to extreme variability conditions. These extreme values are particularly relevant from an operational perspective, as they capture unstable regimes that are not identifiable through average speed alone.
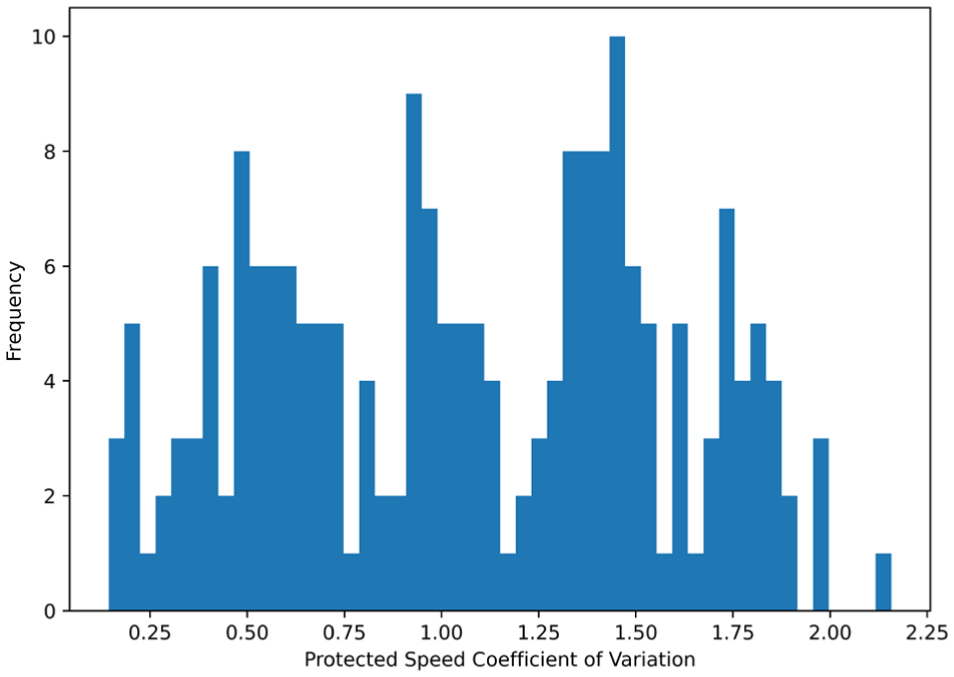
Distribution of speed coefficient of variation across segment–time windows.
Similarly, the distribution of acceleration noise, shown in Figure 2, reveals a broad spectrum of longitudinal driving instability. Acceleration variability remains elevated across a wide range of traffic conditions, suggesting that speed-based measures alone are insufficient to characterize traffic quality. Together, these descriptive results confirm that traffic flow exhibits inherently stochastic and dynamic behavior, motivating the need for a variability-sensitive LOS formulation.
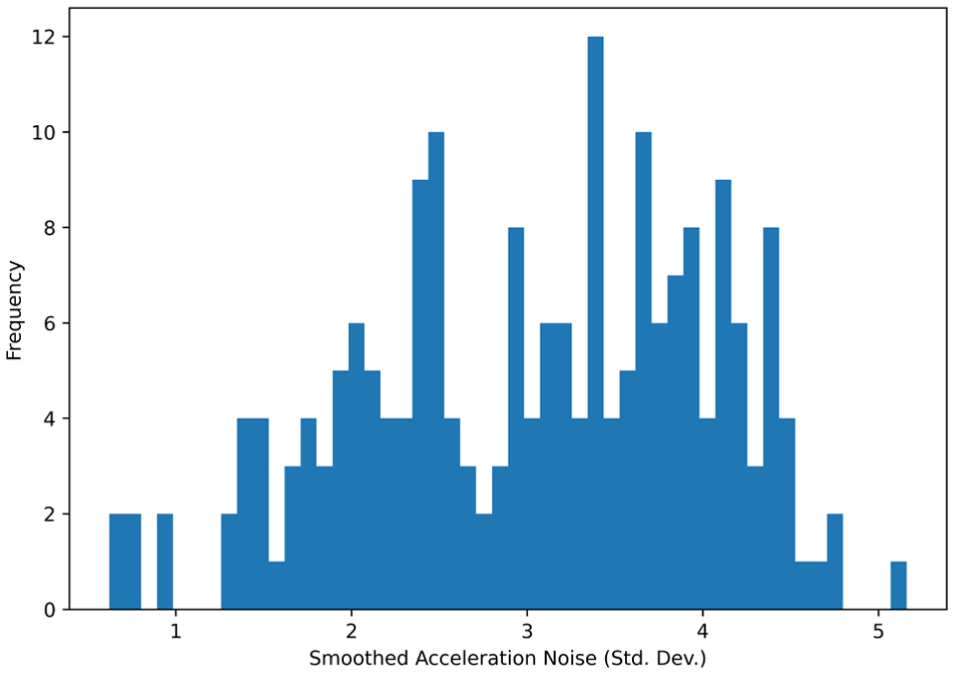
Distribution of acceleration noise across segment–time windows.
To ensure comparability between variables with different scales and units, both the speed coefficient of variation and acceleration noise were standardized using Z-score normalization before aggregation.
Figure 3 illustrates the distributions of the standardized components, showing that both variables are centered around zero with comparable dispersion, thereby ensuring that neither variable dominates the composite LOS-V index.
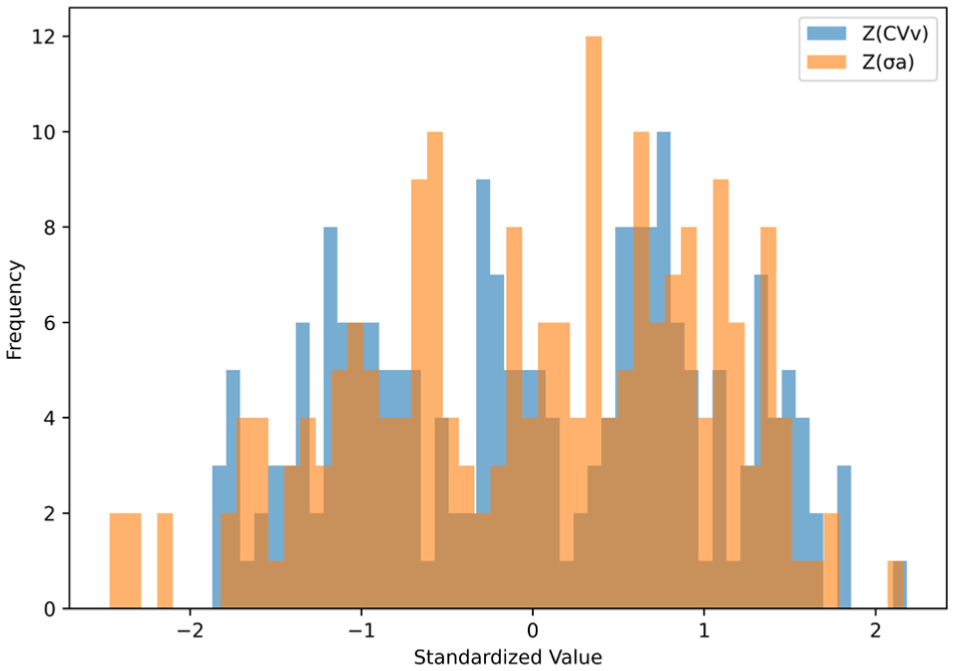
Distribution of standardized speed variability (Z(CVv)) and standardized acceleration noise (Z(σ a)) components used in the variability-based level of service framework (LOS-V) formulation.
LOS Reclassification Analysis
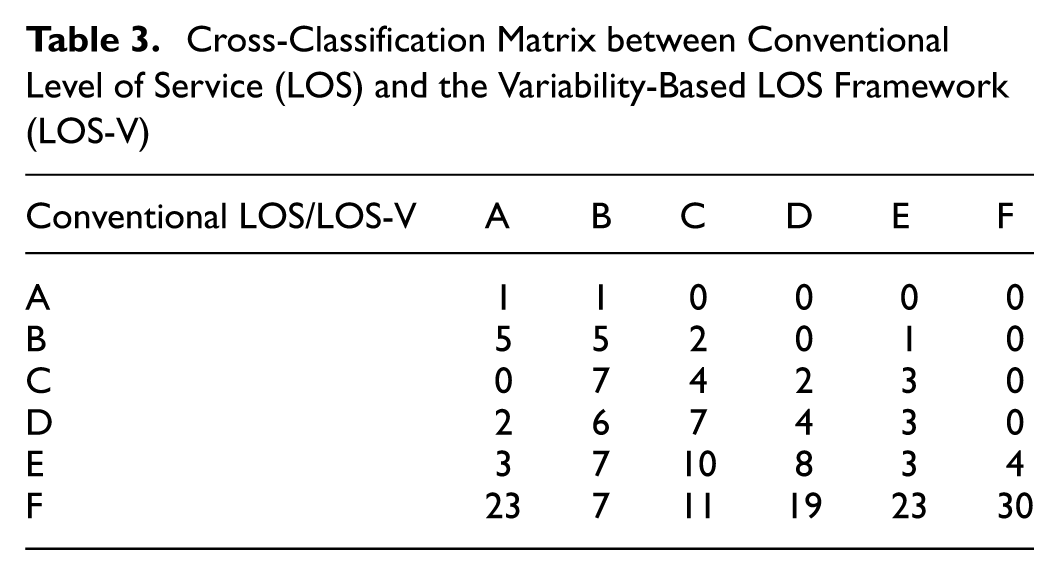
To evaluate the operational implications of incorporating traffic variability into LOS assessment, the proposed LOS-V classification was cross-classified against the conventional HCM speed-based LOS. Because the baseline LOS-V categories were derived using an empirical quantile-based classification, the analysis focuses on relative redistribution patterns across traffic states rather than a one-to-one equivalence between conventional LOS and LOS-V grades. The joint distribution of conventional LOS and LOS-V is summarized in Table 3 (counts).
Cross-Classification Matrix between Conventional Level of Service (LOS) and the Variability-Based LOS Framework (LOS-V)
The reclassification patterns are visualized in Figure 4, which presents a heatmap of the percentage of observations transitioning from each conventional LOS category to the corresponding LOS-V levels.
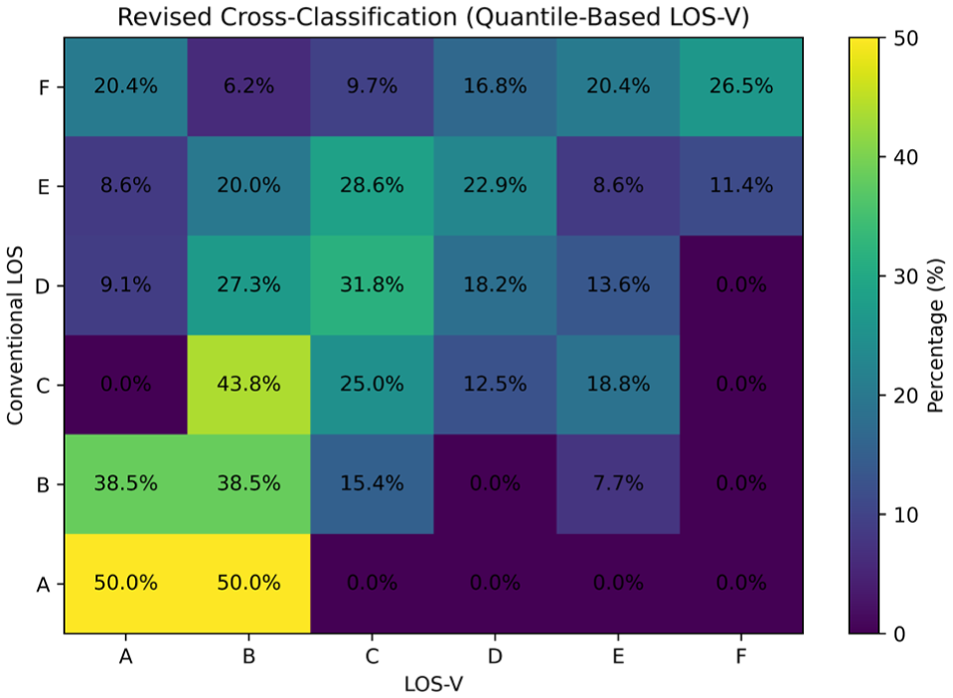
Heatmap of level of service (LOS) reclassification from conventional LOS to the variability-based LOS framework (LOS-V).
The cross-classification results presented in Figure 4 indicate substantial, but more balanced, redistribution across service levels compared with the initial formulation. Unlike the earlier extreme shifts, the revised LOS-V classification exhibits a gradual transition pattern, reflecting the underlying distribution of traffic variability.
Notably, higher conventional LOS categories (i.e., A and B), which represent high average speeds, are not consistently associated with favorable LOS-V levels. Instead, a significant portion of these observations is distributed across multiple LOS-V categories, including lower service levels. This indicates that high mean speeds may coexist with elevated variability and acceleration instability, particularly under oscillatory or transitional traffic conditions.
Conversely, some lower conventional LOS categories (e.g., F) are partially associated with better LOS-V levels. This occurs because certain congested states exhibit low variability because of uniformly low speeds, resulting in relatively stable, albeit slow, traffic conditions.
These findings highlight that LOS and LOS-V capture fundamentally different dimensions of traffic performance—average operating conditions versus dynamic stability—thus reinforcing the need for a cross-classification interpretation rather than a direct comparison.
Figure 5 shows that, while conventional LOS reflects average operating conditions, the LOS-V index captures variability-driven differences, resulting in a redistribution of traffic states across service levels. Because conventional speed-based LOS and the proposed LOS-V index are expressed on different numerical scales and have different ranges of variation, separate discretization intervals were used for visualization. The purpose of Figure 5 is, therefore, not to provide a direct one-to-one comparison of bin widths, but to support a cross-classification interpretation of how observations are redistributed when variability and acceleration noise are incorporated into the LOS assessment.
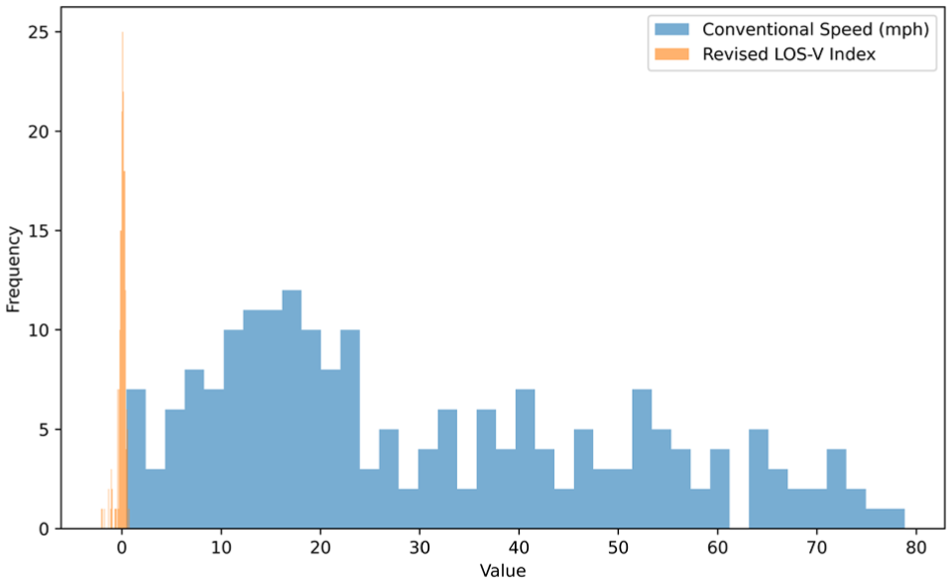
Comparison of conventional speed-based level of service (LOS) and variability-based LOS framework (LOS-V) distributions using scale-specific discretization intervals.
To further illustrate the magnitude and pattern of reclassification, Figure 6 compares the overall distribution of observations across service categories under conventional LOS and LOS-V. The results show that LOS-V redistributes observations more broadly across categories, reflecting the influence of traffic variability and dynamic instability beyond average-based operating conditions..
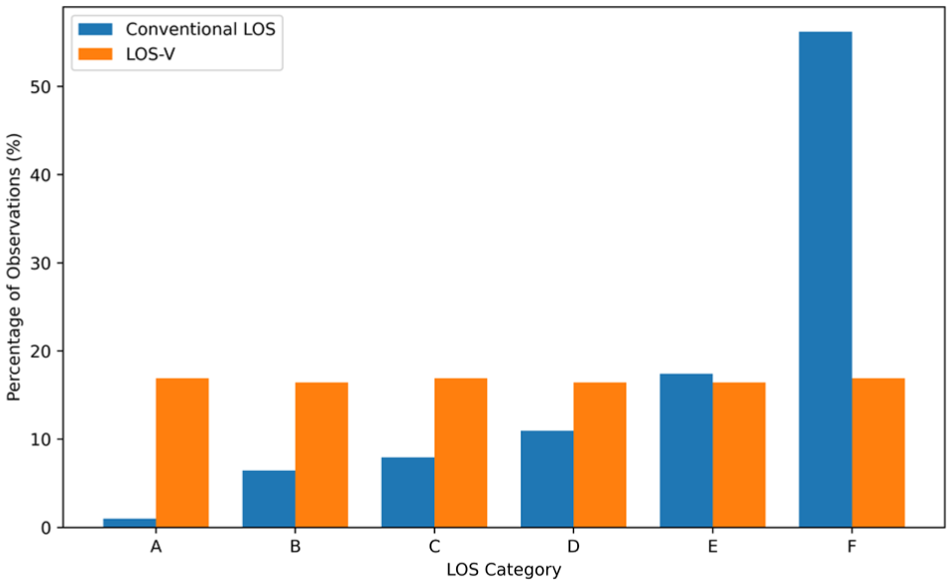
Distribution of observation across conventional level of service (LOS) and the variability-based LOS framework (LOS-V) categories.
These findings demonstrate that the proposed LOS-V framework provides a more discriminative and behaviorally meaningful characterization of traffic operations by explicitly accounting for temporal fluctuations and dynamic instability.
Operational Interpretation and Illustrative Cases
To further elucidate the operational relevance of the proposed framework, representative segment–time windows with comparable mean speeds but differing variability profiles were examined. The qualitative labels “Stable,”“Transitional,” and “Unstable” used in Table 4 follow the dynamic-state interpretation defined in the methodology and are intended to describe increasing levels of short-term traffic instability reflected by the LOS-V index.
Representative Segment–Time Windows Illustrating Similar Mean Speeds with Contrasting Variability-Based Level of Service Framework (LOS-V) Classifications
Note: CV = coefficient of variation.
The relationship between mean speed and speed variability for these cases is illustrated in Figure 7. The results clearly show that traffic states with similar average speeds may exhibit markedly different levels of speed fluctuation and instability, leading to substantially different LOS-V classifications.
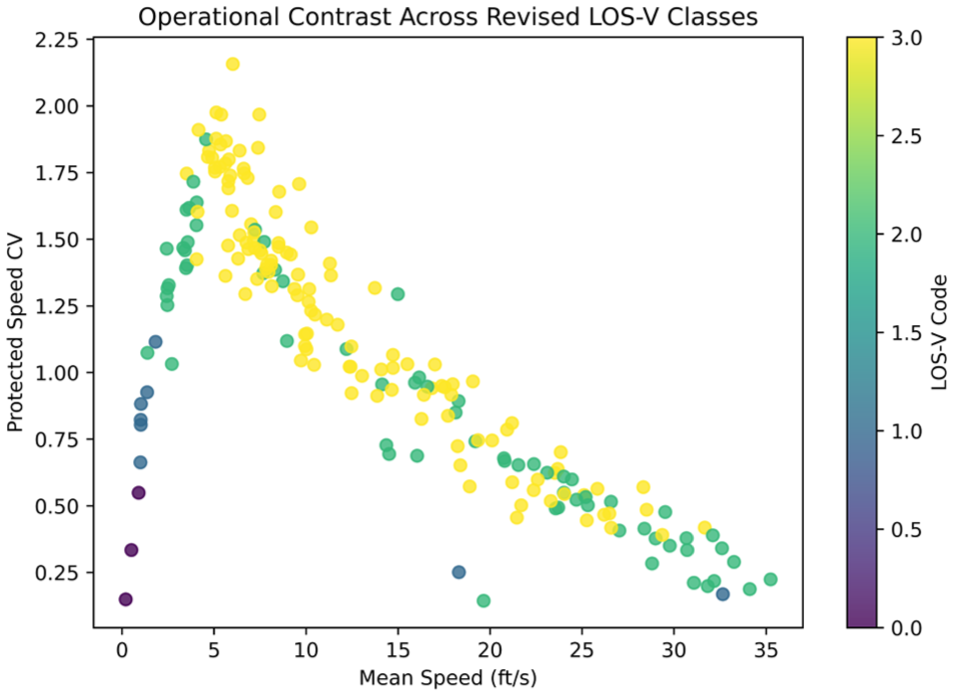
Relationship between mean speed and speed variability colored by the variability-based level of service framework (LOS-V) classification.
In particular, several observations with moderate mean speeds—traditionally associated with acceptable LOS—are characterized by high-speed variability and acceleration noise, resulting in poor LOS-V ratings. These conditions correspond to stop-and-go behavior, frequent speed adjustments, and unstable car-following dynamics, all of which are operationally undesirable despite seemingly adequate average speeds.
Conversely, some higher-speed observations display relatively low variability and smooth acceleration profiles, yielding favorable LOS-V classifications that more accurately reflect stable and reliable traffic operations. These contrasts highlight the limitations of conventional LOS metrics and demonstrate the practical advantages of incorporating variability-based indicators into LOS assessment.
Overall, the operational analysis confirms that the proposed LOS-V framework enhances the interpretability and diagnostic power of LOS evaluation by distinguishing between stable and unstable traffic states that would otherwise be indistinguishable under traditional approaches.
To evaluate the ability of the proposed LOS-V framework to capture traffic instability, a validation analysis was conducted using a shockwave-based proxy derived from spatiotemporal speed variations. This proxy reflects the magnitude of speed differences across adjacent segments and time intervals, which are commonly associated with the formation and propagation of traffic disturbances.
Figure 8 compares the distribution of the shockwave proxy across conventional LOS and LOS-V classifications. The results show that LOS-V provides a clearer differentiation of instability levels, with higher LOS-V categories consistently associated with higher shockwave intensity.
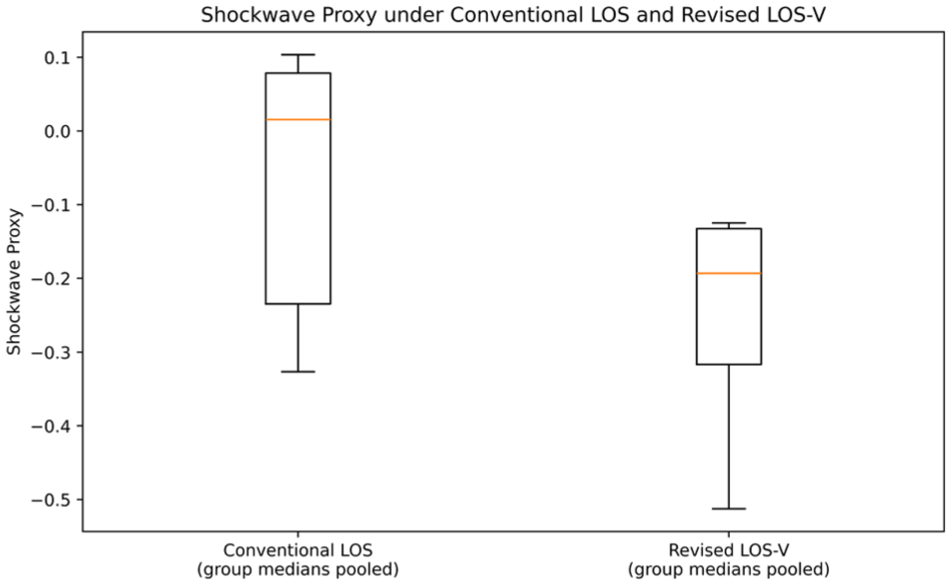
Comparison of shockwave-based instability proxy across conventional level of service (LOS) and the variability-based LOS framework (LOS-V) classification.
These results indicate that LOS-V is more closely aligned with traffic flow instability than conventional mean-speed-based LOS, suggesting improved diagnostic capability in identifying unstable traffic conditions.
Sensitivity Analysis of Weighting Coefficients
To further strengthen the methodological transparency of the proposed LOS-V framework, a sensitivity analysis was conducted to evaluate the influence of alternative weighting coefficients on the LOS-V index and its resulting classification structure. As defined in the conceptual formulation, the LOS-V index integrates standardized speed variability and acceleration noise through weighting coefficients α and β. While equal weighting (
To this end, multiple combinations of weighting coefficients were examined, ranging from higher emphasis on acceleration noise (e.g.,
Figure 9 presents the distribution of the LOS-V index under different weighting combinations. The results show that, while minor shifts in the distribution are observed as the relative contribution of each component changes, the overall structure of the LOS-V index remains largely consistent. In particular, the central tendency and spread of the distributions exhibit only moderate variation across weighting scenarios, indicating that no single component disproportionately dominates the index after standardization.
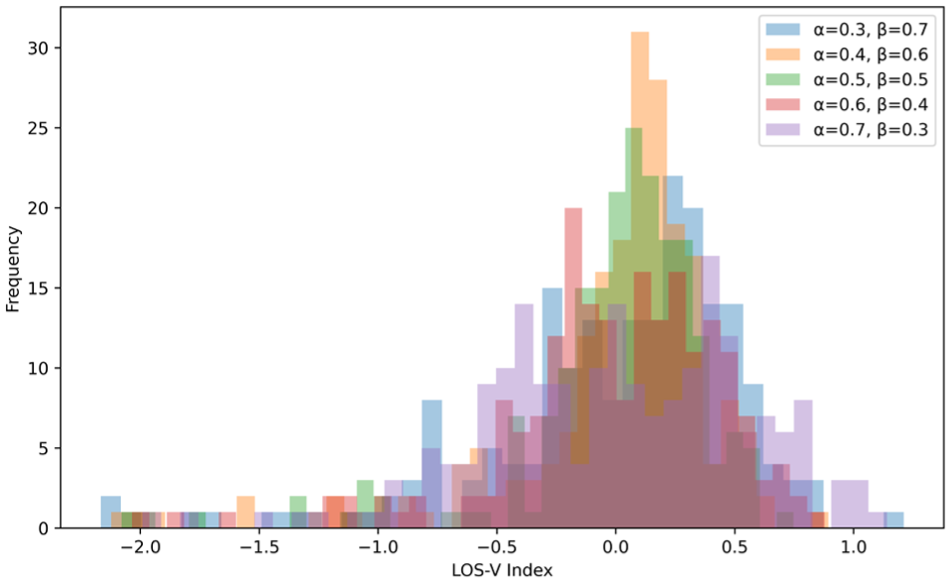
Sensitivity of the variability-based level of service framework (LOS-V) index distribution under alternative weighting coefficients
To provide a quantitative summary, Table 5 reports key descriptive statistics of the LOS-V index under different weighting combinations. The results indicate that variations in α and β lead to relatively small changes in mean, dispersion, and percentile values of the index. This further confirms that the LOS-V formulation is robust to reasonable variations in weighting coefficients.
Summary Statistics of Variability-Based Level of Service Framework (LOS-V) Index under Different Weighting Scenarios
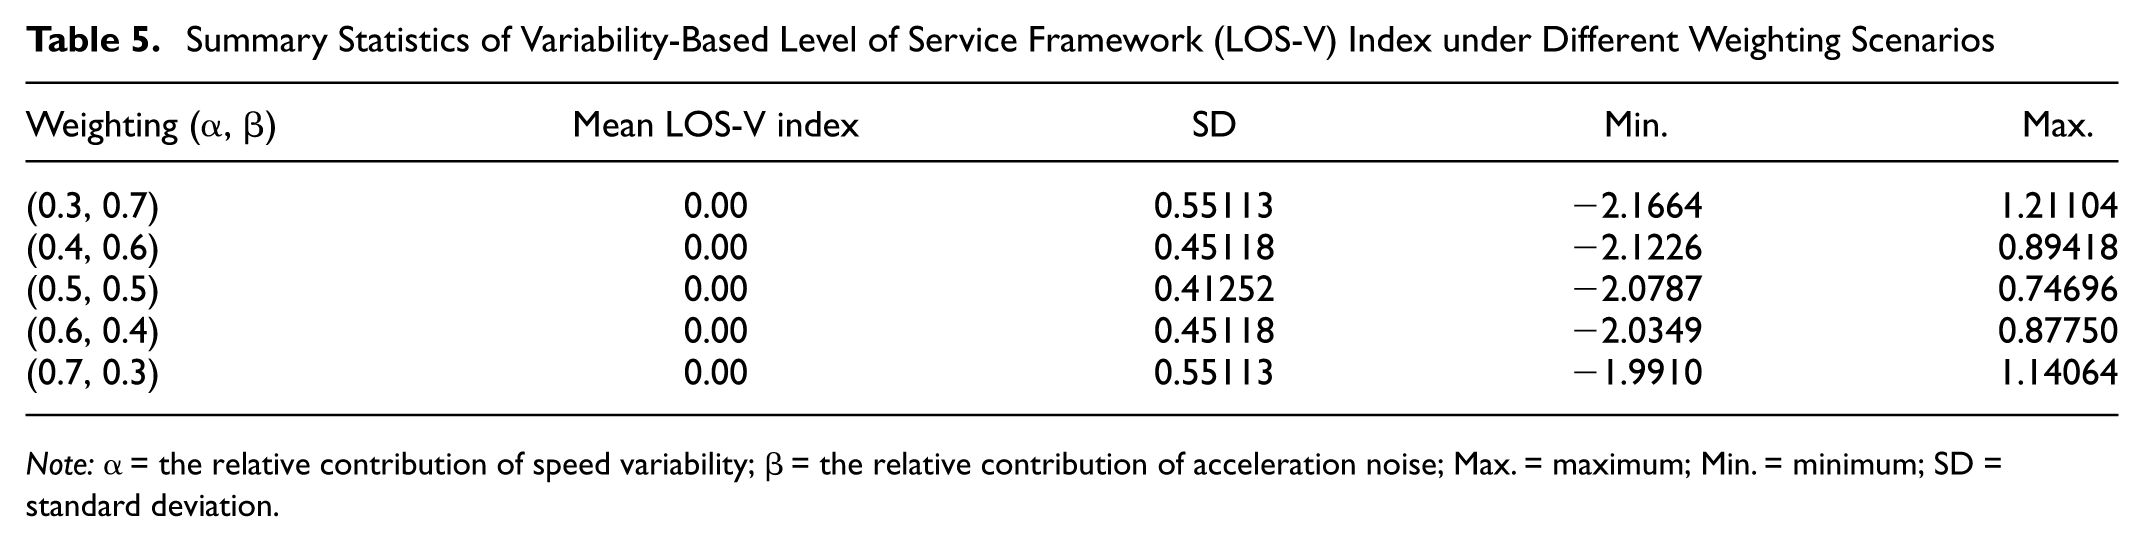
Note: α = the relative contribution of speed variability; β = the relative contribution of acceleration noise; Max. = maximum; Min. = minimum; SD = standard deviation.
Overall, the sensitivity analysis demonstrates that the proposed LOS-V framework is not overly sensitive to the specific choice of α and β. This supports the use of equal weighting as a transparent and balanced baseline assumption, while still allowing flexibility for future calibration based on local traffic conditions, operational priorities, or policy objectives.
Discussion
Key Insights
The findings of this study demonstrate that conventional mean-speed-based LOS measures provide a limited representation of the dynamic quality of traffic operations. By explicitly incorporating speed variability and acceleration noise, the proposed LOS-V framework reveals additional heterogeneity in traffic states that is not captured under traditional LOS classification.
A key insight is the extent of redistribution observed across service levels when variability is considered. The cross-classification analysis shows that traffic states categorized under similar conventional LOS levels may correspond to different LOS-V categories, reflecting differences in dynamic stability rather than average operating conditions. This indicates that mean speed alone is not sufficient to distinguish between stable and unstable traffic regimes, particularly under transitional and congested conditions.
The descriptive analysis further highlights that speed variability and acceleration noise exhibit noticeable dispersion, even within relatively narrow mean speed ranges. This supports the conceptualization of traffic flow as a stochastic dynamic system, where traffic states with similar average speeds may differ in their temporal structure and susceptibility to instability.
Importantly, the operational case analysis demonstrates that high mean speed does not necessarily correspond to high-quality service. Some high-speed-traffic states exhibit elevated variability and acceleration fluctuations, resulting in less stable operating conditions. Conversely, certain lower-speed states may display relatively stable dynamics because of uniform traffic behavior, despite lower average speeds.
Overall, these findings reinforce the premise that incorporating variability-based indicators into LOS assessment provides a more behaviorally meaningful and operationally informative representation of traffic conditions. Rather than replacing conventional LOS, the LOS-V framework offers a complementary perspective that captures dynamic traffic characteristics beyond average-based measures.
Practical Implications
From a traffic operations and planning perspective, the proposed LOS-V framework offers several important practical advantages.
First, it enhances diagnostic capability by enabling practitioners to distinguish between stable and unstable traffic states that are indistinguishable under conventional LOS definitions. This distinction is particularly valuable for identifying locations or time periods prone to flow breakdown, stop-and-go behavior, and driver discomfort.
Second, LOS-V provides a complementary performance measure that can support better-informed operational decision-making. For example, roadway segments classified as acceptable under conventional LOS but exhibiting poor LOS-V may warrant targeted operational interventions, such as ramp metering adjustments, speed harmonization, or lane management strategies aimed at improving flow stability, rather than simply increasing average speed.
Third, the framework is inherently flexible and compatible with existing practice. The proposed LOS-V formulation is mathematically transparent and relies on metrics that can be computed directly from high-resolution trajectory data or advanced traffic monitoring systems. In this study, equal weighting and quantile-based classification are adopted as a transparent baseline to demonstrate the operational applicability of the LOS-V framework, while allowing transportation agencies to calibrate weighting coefficients and classification thresholds according to local operational priorities, safety objectives, and policy considerations.
Finally, the integration of speed variability and acceleration noise into LOS assessment aligns well with emerging trends in data-driven traffic management. As connected vehicle data and high-resolution sensing technologies become more widespread, the ability to evaluate traffic performance based on dynamic stability rather than solely on average conditions will become increasingly feasible and relevant for real-world applications. The framework can be integrated into existing traffic monitoring workflows by computing LOS-V at the segment–time-window level alongside conventional LOS.
Limitations
Despite its contributions, this study is subject to several limitations that should be acknowledged.
First, the empirical analysis is based on the NGSIM dataset, which, although widely used and well-documented, represents a limited set of freeway environments and traffic conditions. The results may, therefore, not be directly generalizable to all roadway types, traffic compositions, or geometric configurations without further validation.
Second, the LOS-V framework relies on the selection of weighting coefficients and classification thresholds, which were implemented in this study using a data-driven baseline approach. While this choice ensures objectivity and reproducibility, alternative calibration strategies may yield different LOS-V distributions. Future research could explore sensitivity analyses or optimization-based calibration to tailor the framework to specific operational objectives.
Third, this study focuses on intra-period traffic variability observed over short temporal windows. While this perspective is essential for capturing dynamic instability, it does not explicitly address longer-term variability such as day-to-day travel time reliability. Integrating LOS-V with broader reliability measures could provide a more comprehensive assessment of traffic performance across multiple temporal scales.
Finally, although acceleration noise serves as a useful indicator of microscopic instability, it may also reflect driver behavior heterogeneity or measurement noise in certain contexts. Continued improvements in trajectory reconstruction and filtering techniques will further enhance the robustness of variability-based performance measures.
Conclusions and Future Research
Conclusions
This study revisited LOS assessment by explicitly integrating traffic flow variability into the evaluation framework. The main conclusions are summarized as follows:
1) Conventional LOS measures based on average speed alone provide a limited representation of traffic operating conditions, particularly in capturing dynamic stability.
2) Speed variability and acceleration noise offer complementary indicators that reflect underlying traffic dynamics and stability characteristics not captured by traditional LOS definitions.
3) The proposed LOS-V framework provides a mathematically transparent and operationally interpretable extension to conventional LOS assessment by incorporating standardized variability measures.
4) The cross-classification analysis demonstrates that traffic states with similar conventional LOS levels may correspond to different variability-based conditions, highlighting the influence of dynamic instability on traffic performance.
5) The LOS-V framework enhances the interpretability and diagnostic capability of traffic performance evaluation while maintaining compatibility with existing LOS-based practices.
Future Research
Future research may build on this work in several directions:
1) Application of the LOS-V framework to other facility types, including arterials and signalized intersections.
2) Exploration of alternative calibration strategies for weighting coefficients and classification thresholds.
3) Integration of LOS-V with longer-term reliability measures to develop multi-scale performance assessment frameworks.
4) Investigation of real-time LOS-V implementation using connected and automated vehicle trajectory data.
Footnotes
Acknowledgements
The author(s) would like to acknowledge the availability of the Next Generation Simulation (NGSIM) vehicle trajectory dataset provided by FHWA, which made this research possible.
Author Contributions
The author confirms sole responsibility for the following: study conception and design, data collection, analysis and interpretation of results, and draft manuscript preparation.
Declaration of Conflicting Interests
The authors declared no potential conflicts of interest with respect to the research, authorship, and/or publication of this article.
Funding
The author received no financial support for the research, authorship, and/or publication of this article.