






Abstract
This paper discusses a permanent deformation model (PD model) developed with data collected from previous full-scale pavement testing experiments to improve the prediction of rutting development on airfield asphalt pavements. The data, including rut depths, pavement stiffness, and instrumentation, were collected from 34 different test items trafficked with a heavy vehicle simulator and deployable load-cart. The loading conditions of the test traffic corresponded to heavy aircraft including the C-17 (single wheel load of 45,000 lb), C-130 (single wheel load of 35,000 lb), and P-8 (total gear load of 89,000 lb). Pavement-Transportation Computer Assisted Structural Engineering (PCASE) version 7.0 was used to determine the predicted passes to failure based on measured pavement layer thickness and material properties and compare the predicted and measured passes to failure. It was observed that approximately 75% of the data fell below the line of equality, indicating that the current design methodology underpredicts passes to failure. A PD model was developed that computes a mechanistic response at predefined points within a theoretical unsaturated poroelastic multilayered structure caused by an aircraft load and then relates these responses to progressive rutting performance through an incremental-recursive rutting model. The performance of the PD model was verified with the data collected from full-scale test experiments. Results showed that the PD model consistently performed well over a range of different passes to failure.
Introduction
Current military pavement design procedures were developed based on the results of full-scale test experiments to assess the anticipated performance of permanent operating bases. The pavement sections consisted primarily of robust pavement structures with the capability to support thousands of aircraft operations over common design life durations. The design procedure utilized a relationship between a mechanistic response determined from initial pavement conditions and empirical observations to forecast allowable aircraft passes at a single future point in time. The derived mechanistic-empirical (M-E) relationship is acceptable for the prediction of performance, given the inherent variability in pavement conditions and traffic projections anticipated over a 20-year design life. Additionally, airfield pavement structures are constructed to meet or exceed existing specifications, and stringent quality control/quality assurance programs verify that the material and construction specifications are met. However, no consideration is given for pavement deterioration from aircraft operations, changes in subsurface moisture conditions, or changes in pavement stiffness properties over the life of the pavement. Thus, the operation of aircraft on substandard pavements that may deteriorate quickly is outside the breadth of data used to develop current M-E design relationships, and their ability to adequately predict pavement performance is questionable.
Several full-scale accelerated pavement testing (APT) experiments have been performed by the U.S. Army Corps of Engineers Engineer Research and Development Center (ERDC) to answer specific operational concerns about the pavement performance of substandard pavements under unique military aircraft loading conditions. Specifically, Robinson investigated newly constructed thin asphalt layers under a covered test facility subjected to cargo aircraft loading conditions ( 1 ). Furthermore, Robinson et al. conducted a controlled full-scale experiment to assess the impact of a heavily loaded dual wheel aircraft gear on relatively weak pavement structures ( 2 ). Finally, Garcia and Robinson, and Garcia et al. performed APT at several field sites that consisted of flexible pavements composed of substandard structural designs or nontraditional paving materials ( 3 , 4 ). These studies were designed to assess a low volume of aircraft passes on substandard pavements to inform the operational boundaries of each respective aircraft.
While these experiments have provided valuable empirical data that defines the operation of the specific aircraft under the conditions of each experiment, the effect of variations in pavement structure or aircraft loading conditions remain unknown. As a result, the field performance data must be leveraged to develop robust analytical models capable of adequately predicting pavement performance for pavement structures and loading conditions that are outside the confines of traditional U.S. Department of Defense (DOD) flexible pavement design methodology.
Objectives
The study presented in this paper leverages performance data collected from full-scale pavement testing experiments to develop a permanent deformation model (PD model) for accurate prediction of rutting development on substandard asphalt pavements. Rutting, pavement stiffness, instrumentation, and surveying data were collected at different traffic intervals to capture the structural performance of substandard pavements under a low volume of heavy aircraft passes. Experiment test results were compared against predicted pavement service life, in relation to passes to failure, which highlighted the need for an improved performance model for pavement evaluation.
Background
The structural design and evaluation procedures of airfield pavements for DOD are described in Unified Facilities Criteria (UFC) 3-260-02 “Pavement Design for Airfields” and UFC 3-260-03 “Airfield Pavement Evaluation,” respectively. Current airfield pavement design and evaluation procedures consist of the stress-based California bearing ratio (CBR)-Beta method, which limits the vertical stress on the subgrade as a function of subgrade CBR ( 5 ). This procedure ensures that adequate pavement structure designs protect the subgrade by dispersing the applied stress through a series of sufficiently strong pavement layers that gradually decrease in quality. By leveraging data collected from full-scale testing beginning in the 1940s, performance curves have been developed to relate the structural features of the pavement to the number of allowable aircraft passes that the pavement can sustain. In addition, minimum pavement design and stringent construction specifications were implemented to provide airfield asphalt pavements with competent structural designs. As such, Priddy et al. reported that existing pavement performance curves have served well for predicting the structural capacity of airfield pavements built to DOD specifications ( 6 ). Nonetheless, several airfield pavements have not been constructed to meet minimum pavement design requirements (e.g., thin pavement structures and low-quality paving materials).
Only a limited number of studies have been conducted since the early 1990s to investigate the influence of different pavement design variables, including overall pavement structure thickness, surface layer thickness, base course material quality, and subgrade strength. Webster conducted a full-scale evaluation of a flexible airfield pavement section, which included several test items that are relevant to the current study ( 7 ). The test section was surfaced with a 2.2–2.6 in. thick hot mix asphalt (HMA) layer that met FAA specifications. The test items were constructed with a high-quality crushed limestone base course of varied thicknesses, from 6 to 18 in. in increments of 3.9 in., while the subgrade material consisted of a high-plasticity clay with CBRs of 2.8 and 7.1. It was observed that the structural capacity of the pavement test items was more sensitive to the subgrade strength than the thickness of the aggregate base course.
Apart from the impact of geomaterials, the asphalt layer thickness could be considered another key characteristic that influences the structural performance of airfield pavements. Studies have shown that the minimum layer thickness should be at least three times the nominal maximum aggregate size when coarse graded asphalt mixtures are used, specifically for ease of constructability of airfield asphalt pavements ( 8 , 9 ). From a structural capacity perspective, Barker et al. reviewed several studies and concluded that 4 in. of asphalt thickness was adequate for airfield asphalt pavements ( 10 ). A more detailed study by Bell and Mason investigated the effect of reduced asphalt thickness on pavement performance and verified the DOD minimum asphalt thickness criteria ( 11 ). Asphalt layer thicknesses ranging from 2.5 to 5 in. were evaluated in this study. The base and subbase courses for these test items varied in thicknesses and strengths, but, more importantly, the subgrade material consisted of a high plasticity clay material with a CBR ranging from 9.1 to 9.9. Overall, the DOD minimum asphalt thickness criteria of 4 in. for a 100 CBR base and 5 in. for an 80 CBR base were found to be reasonable. In addition, the pavement’s design life could be reduced by half if the minimum required asphalt thickness was not provided.
Recently, Robinson et al. examined the need to improve DOD’s structural evaluation techniques for substandard airfield pavements to provide realistic estimates of pavement performance and corresponding remaining service life to satisfactorily sustain critical aircraft missions ( 12 ). That study reported how existing performance curves and pavement evaluation techniques do not accurately predict the structural capacity of airfield pavements that have not been constructed to DOD construction standards. The researchers used the collected performance data to adjust the CBR-Beta base criterion for a more appropriate evaluation of asphalt pavements with aggregate base layers built with substandard materials or asphalt layers with relatively small thicknesses. Additionally, Robinson, and Robinson et al. concluded that, when sufficient asphalt layer thickness was not provided to distribute the stress from the applied traffic loads to the subgrade, the failure mechanism of the flexible pavements could shift from a subgrade to a base course failure, which is not fundamentally accounted for in current failure criteria ( 1 , 12 ).
DOD may be required to operate on asphalt pavements that may not meet minimum design and construction requirements. When dealing with these substandard airfield pavements in contingency environments, it is important to recognize that the existing subgrade material may exhibit poor quality and insufficient strength, which has been identified to significantly influence the pavement’s structural capacity. Similarly, the surface and subsurface layers could be composed of nontraditional materials (i.e., sandy asphalt, coral aggregates, or field sands) as reported in Priddy and Rutland ( 13 ). These lower-quality materials are expected to produce weaker pavement layers relative to pavement layers built to DOD requirements. Furthermore, the airfield pavements of interest may have been abandoned for decades without experiencing major rehabilitation or maintenance throughout their service life. Therefore, they may experience a rapid pavement structural deterioration under heavy aircraft loads after a low volume of traffic. An accurate prediction of the remaining service life of these substandard pavements requires not only assessing the initial state of the pavement structure but fundamentally capturing the impact of the aforementioned unique characteristics and conditions by a robust performance model.
Full-Scale Experiments
Following are brief descriptions of each experiment used in the modeling study. Each description is simply to provide the reader with a general overview of the pavement and loading conditions of each test section. Details of the material properties and complete trafficking results can be found in the respective references.
Evaluation of Thin Flexible Pavements under Simulated Aircraft Traffic
This study consisted of 16 test items that had varying flexible pavement thickness and base course types. Asphalt surface thickness ranged from 1.5 to 2.5 in., and the base course consisted of either a high-strength crushed limestone or a weak gravel. Test traffic was applied with a single C-17 wheel utilizing one of ERDC’s load carts from 2019 to 2020. (Figure 1a). The C-17 load cart was loaded to a total single wheel load of 45,000 lb and the tire inflation pressure was maintained at either 142 or 115 pounds per square inch (psi). The failure criterion was a rut depth of 3 in., which included both permanent deformation inside the wheelpath and upheaval outside the wheelpath. The complete project report can be found in Robinson ( 1 ).
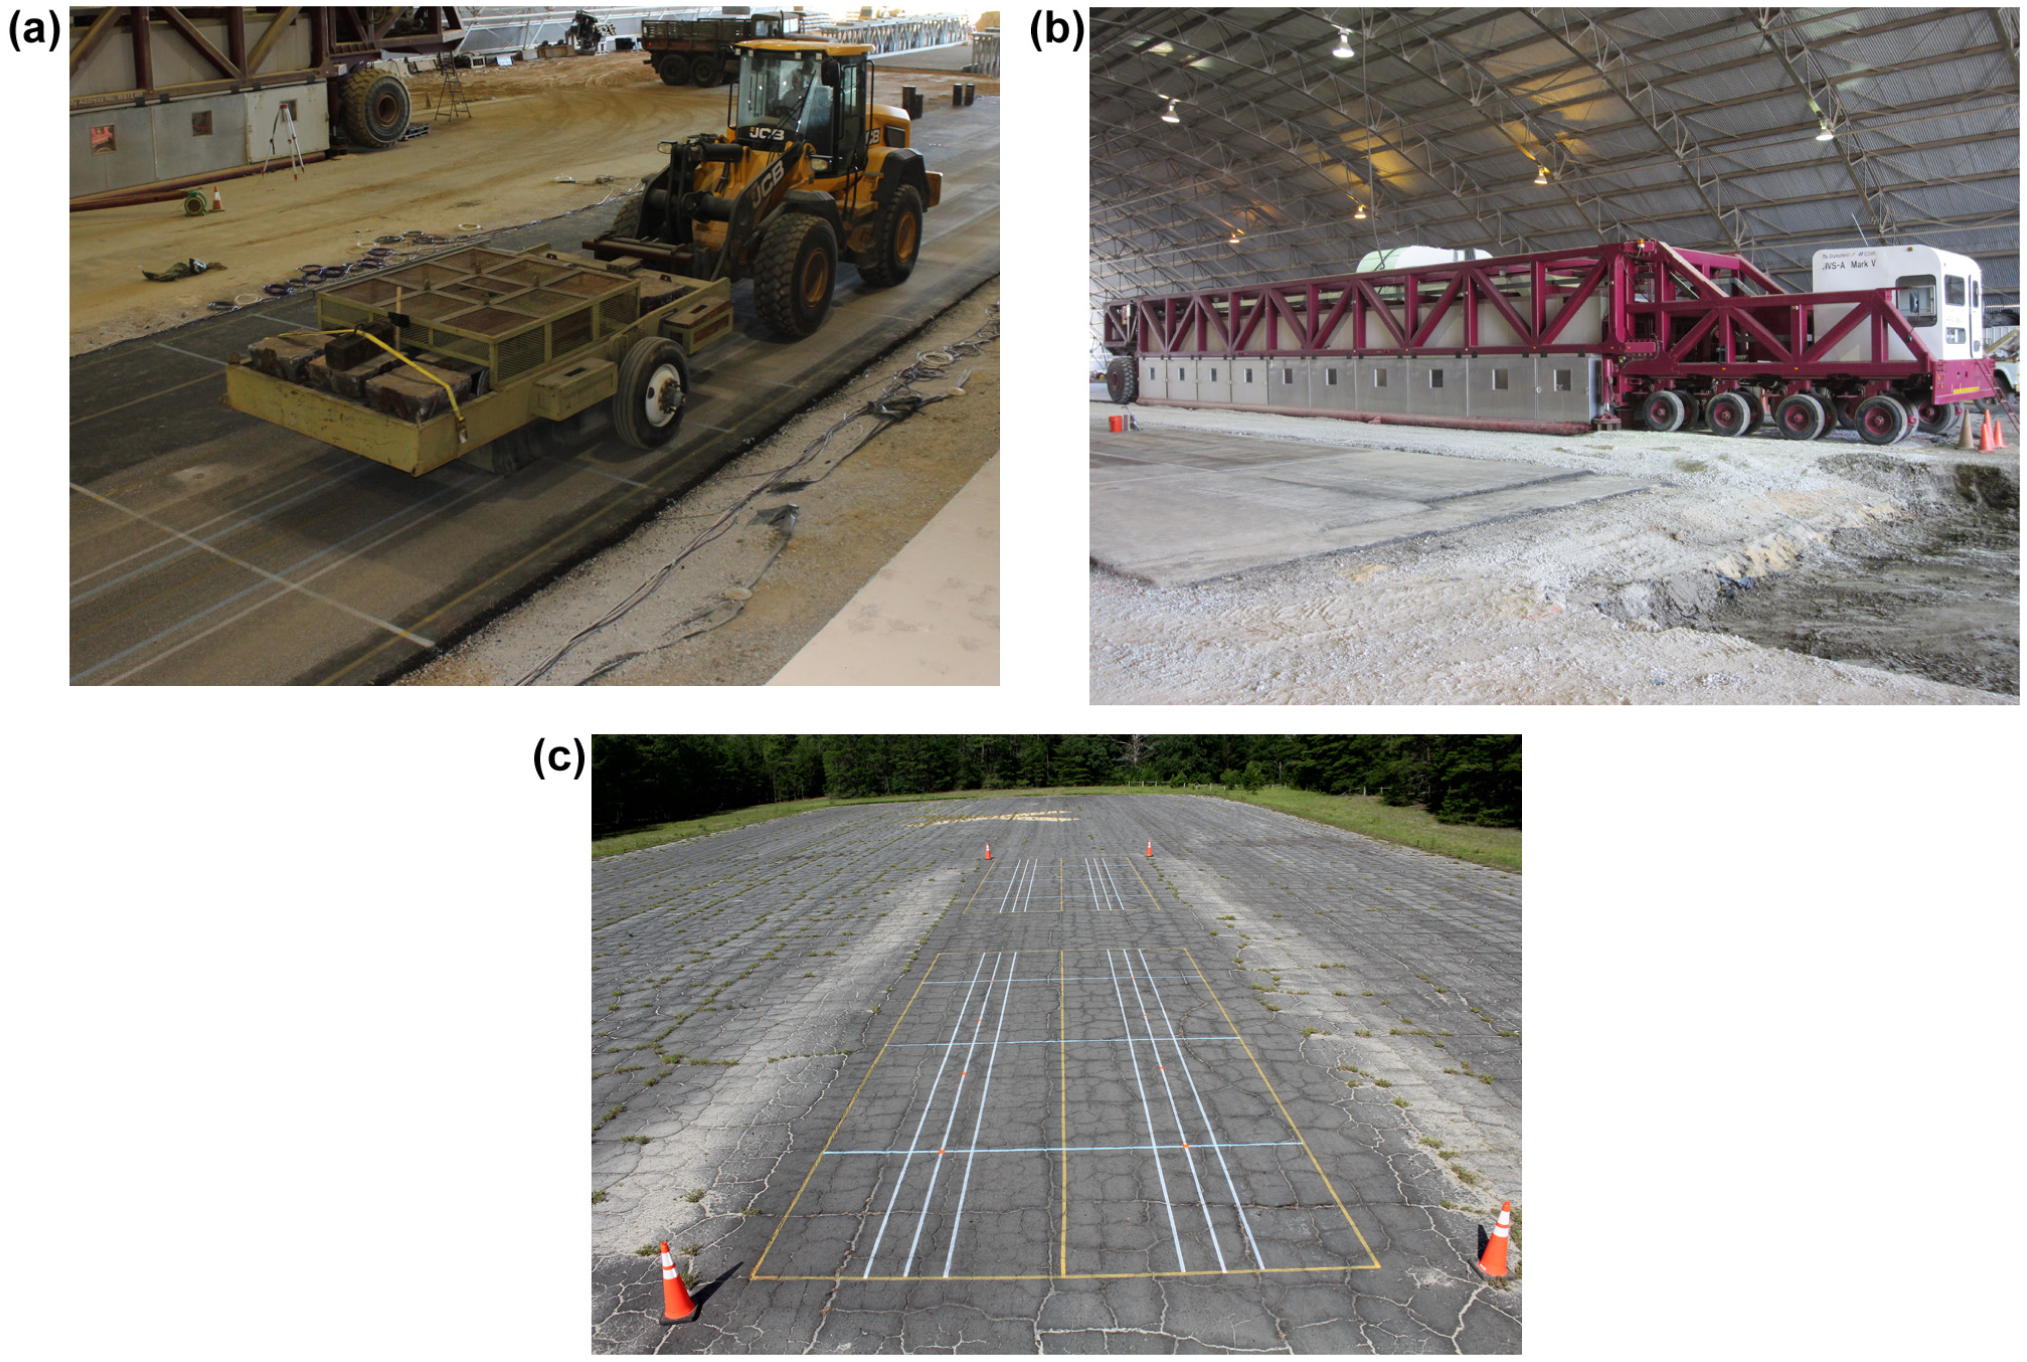
Load application equipment: (a) C-17 load cart in hangar facility; (b) heavy vehicle simulator, and (c) typical field test site.
Naval Expeditionary Runway Construction Criteria: P-8 Poseidon Pavement Requirements
This study consisted of two flexible pavement thickness (i.e., asphalt surface thickness of 2 and 4 in.), two base course types (i.e., a high-strength crushed limestone and a weak gravel), and two subgrade strengths (i.e., 6 and 10 CBR). Test traffic was applied from 2021 to 2022 with a heavy-vehicle simulator (Figure 1b) that was outfitted with a dual-wheel P-8 aircraft gear. The P-8 gear was subjected to a total load of 89,000 lb and the tire inflation pressure was 220 psi. Each test item was trafficked to a target failure criterion of 2 in. of rutting, where rutting included deformation inside the wheelpath plus upheaval outside the wheelpath. The full project report can be read in Robinson et al. ( 2 ).
Field Study of Nontraditional Airfield Pavements
Multiple field sites were located throughout the U.S. to conduct APT experimentation on nontraditional airfield pavements. The field test sites (example in Figure 1c) included aged asphalt surface layers of varying material properties and substandard base course layers such as clay gravel or shells. Each test site was trafficked with a C-17 or C-130 load cart in 2022. The C-17 loading conditions were the same total loads and tire inflation pressures as those described by Robinson ( 1 ). The C-130 cart was loaded to a total single wheel load of 35,000 lb and the tire inflation pressure was maintained at either 100 or 80 psi. Information generated from this study can be found in Garcia and Robinson, and Garcia et al. ( 3 , 4 ).
Comparison of Observed Field Performance with Existing Evaluation Predictions
The observed passes to failure from the full-scale trafficking tests were compared with performance predictions utilizing current DOD analytical models and failure criteria. Pavement-Transportation Computer Assisted Structural Engineering (PCASE) version 7.0 was used to determine the predicted passes to failure based on measured pavement layer thickness and material properties. The Airfield Pavement Evaluation module provides the user with the ability to select material layer type, input material layer thickness, and input layer CBR properties. Predicted passes to failure are based on traditional long-term design failure criteria for flexible pavements of approximately 1 in. rut depth. A summary of the actual and predicted passes to failure for each experiment are shown in Tables 1–3. Contingency/expeditionary failure criteria are generally greater than traditional failure criteria (i.e., up to 2 in. of rutting) for a P-8 aircraft, and up to 3 in. rutting for C-17 and C-130 aircraft. This caveat further complicates the design/evaluation of contingency pavement structures, where ultimate failure conditions are aircraft-specific, limiting the use of an overarching M-E relationship that is based on a single failure criterion.
Summary of Results from Project “Evaluation of thin flexible pavements under simulated aircraft traffic” ( 1 )
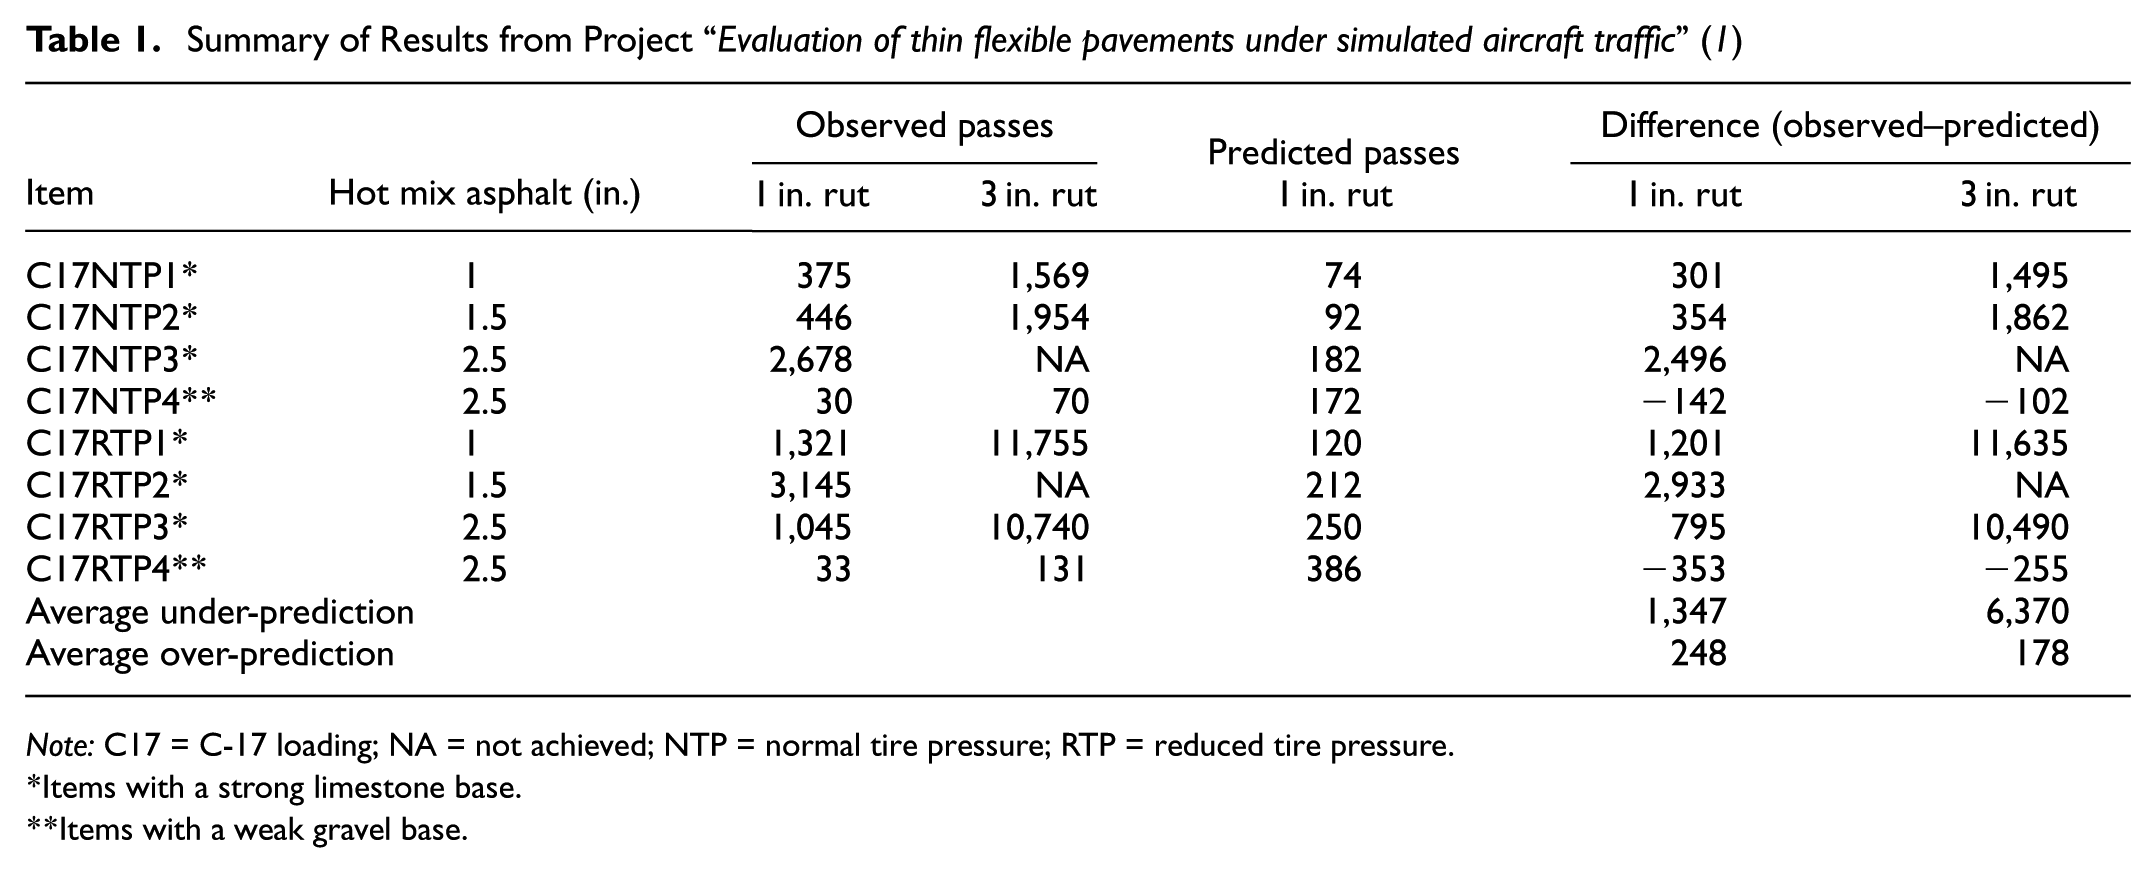
Note: C17 = C-17 loading; NA = not achieved; NTP = normal tire pressure; RTP = reduced tire pressure.
*Items with a strong limestone base.
**Items with a weak gravel base.
Summary of Results from Project “Naval expeditionary runway construction criteria: P-8 Poseidon pavement requirements” ( 2 )
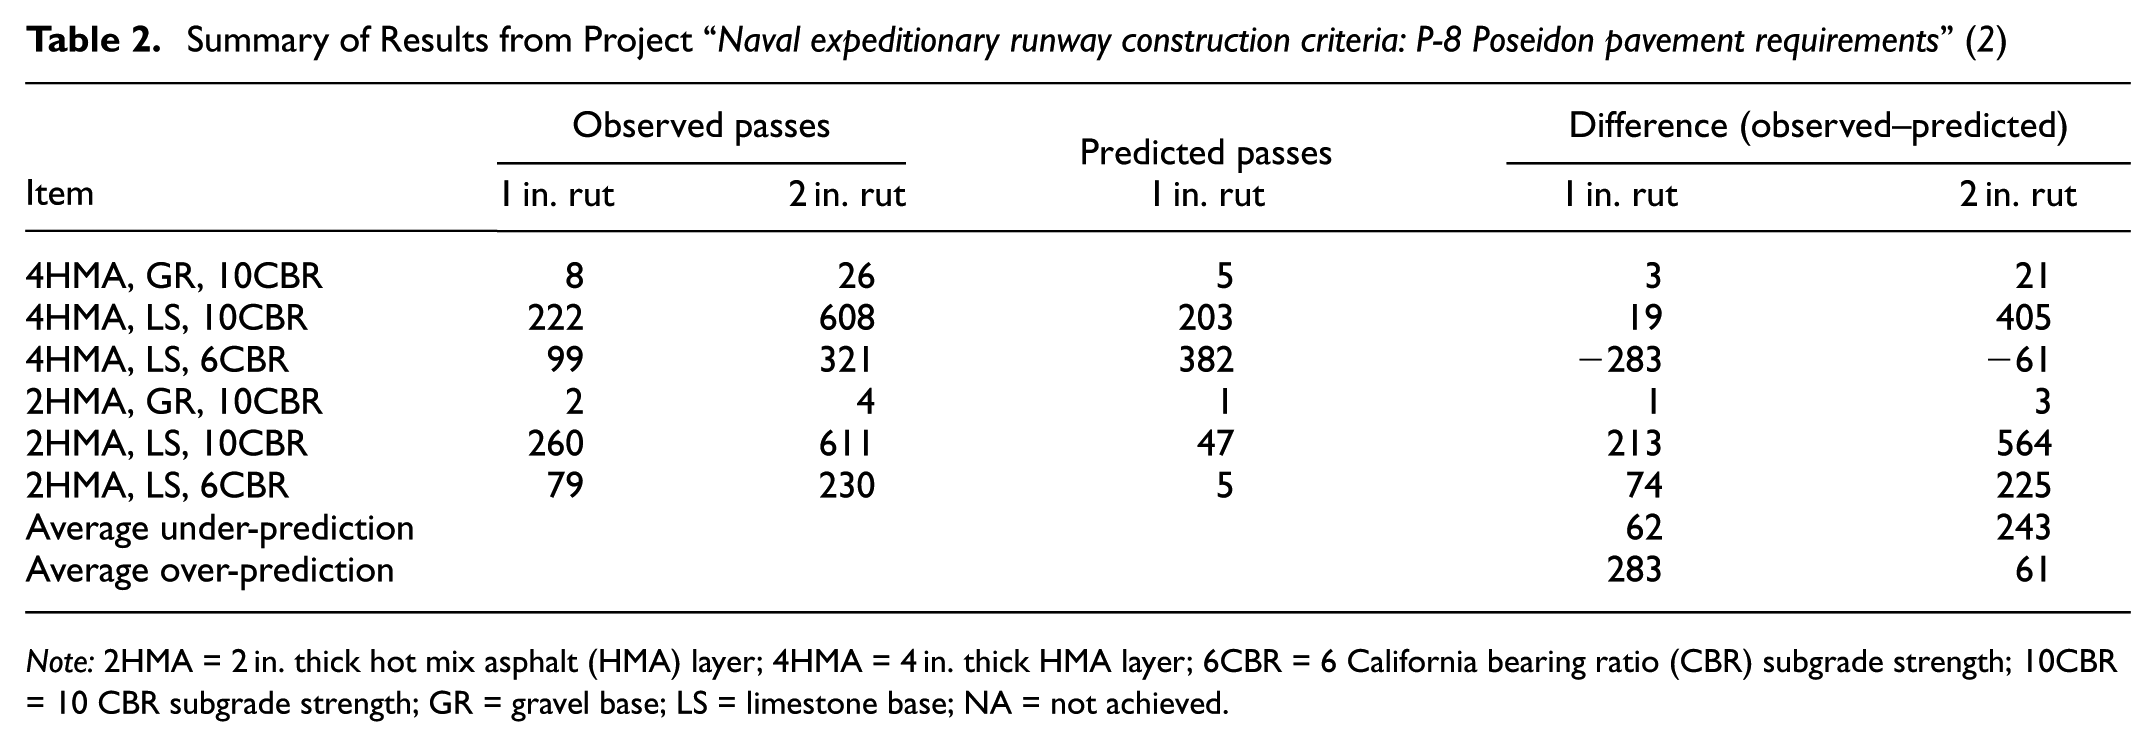
Note: 2HMA = 2 in. thick hot mix asphalt (HMA) layer; 4HMA = 4 in. thick HMA layer; 6CBR = 6 California bearing ratio (CBR) subgrade strength; 10CBR = 10 CBR subgrade strength; GR = gravel base; LS = limestone base; NA = not achieved.
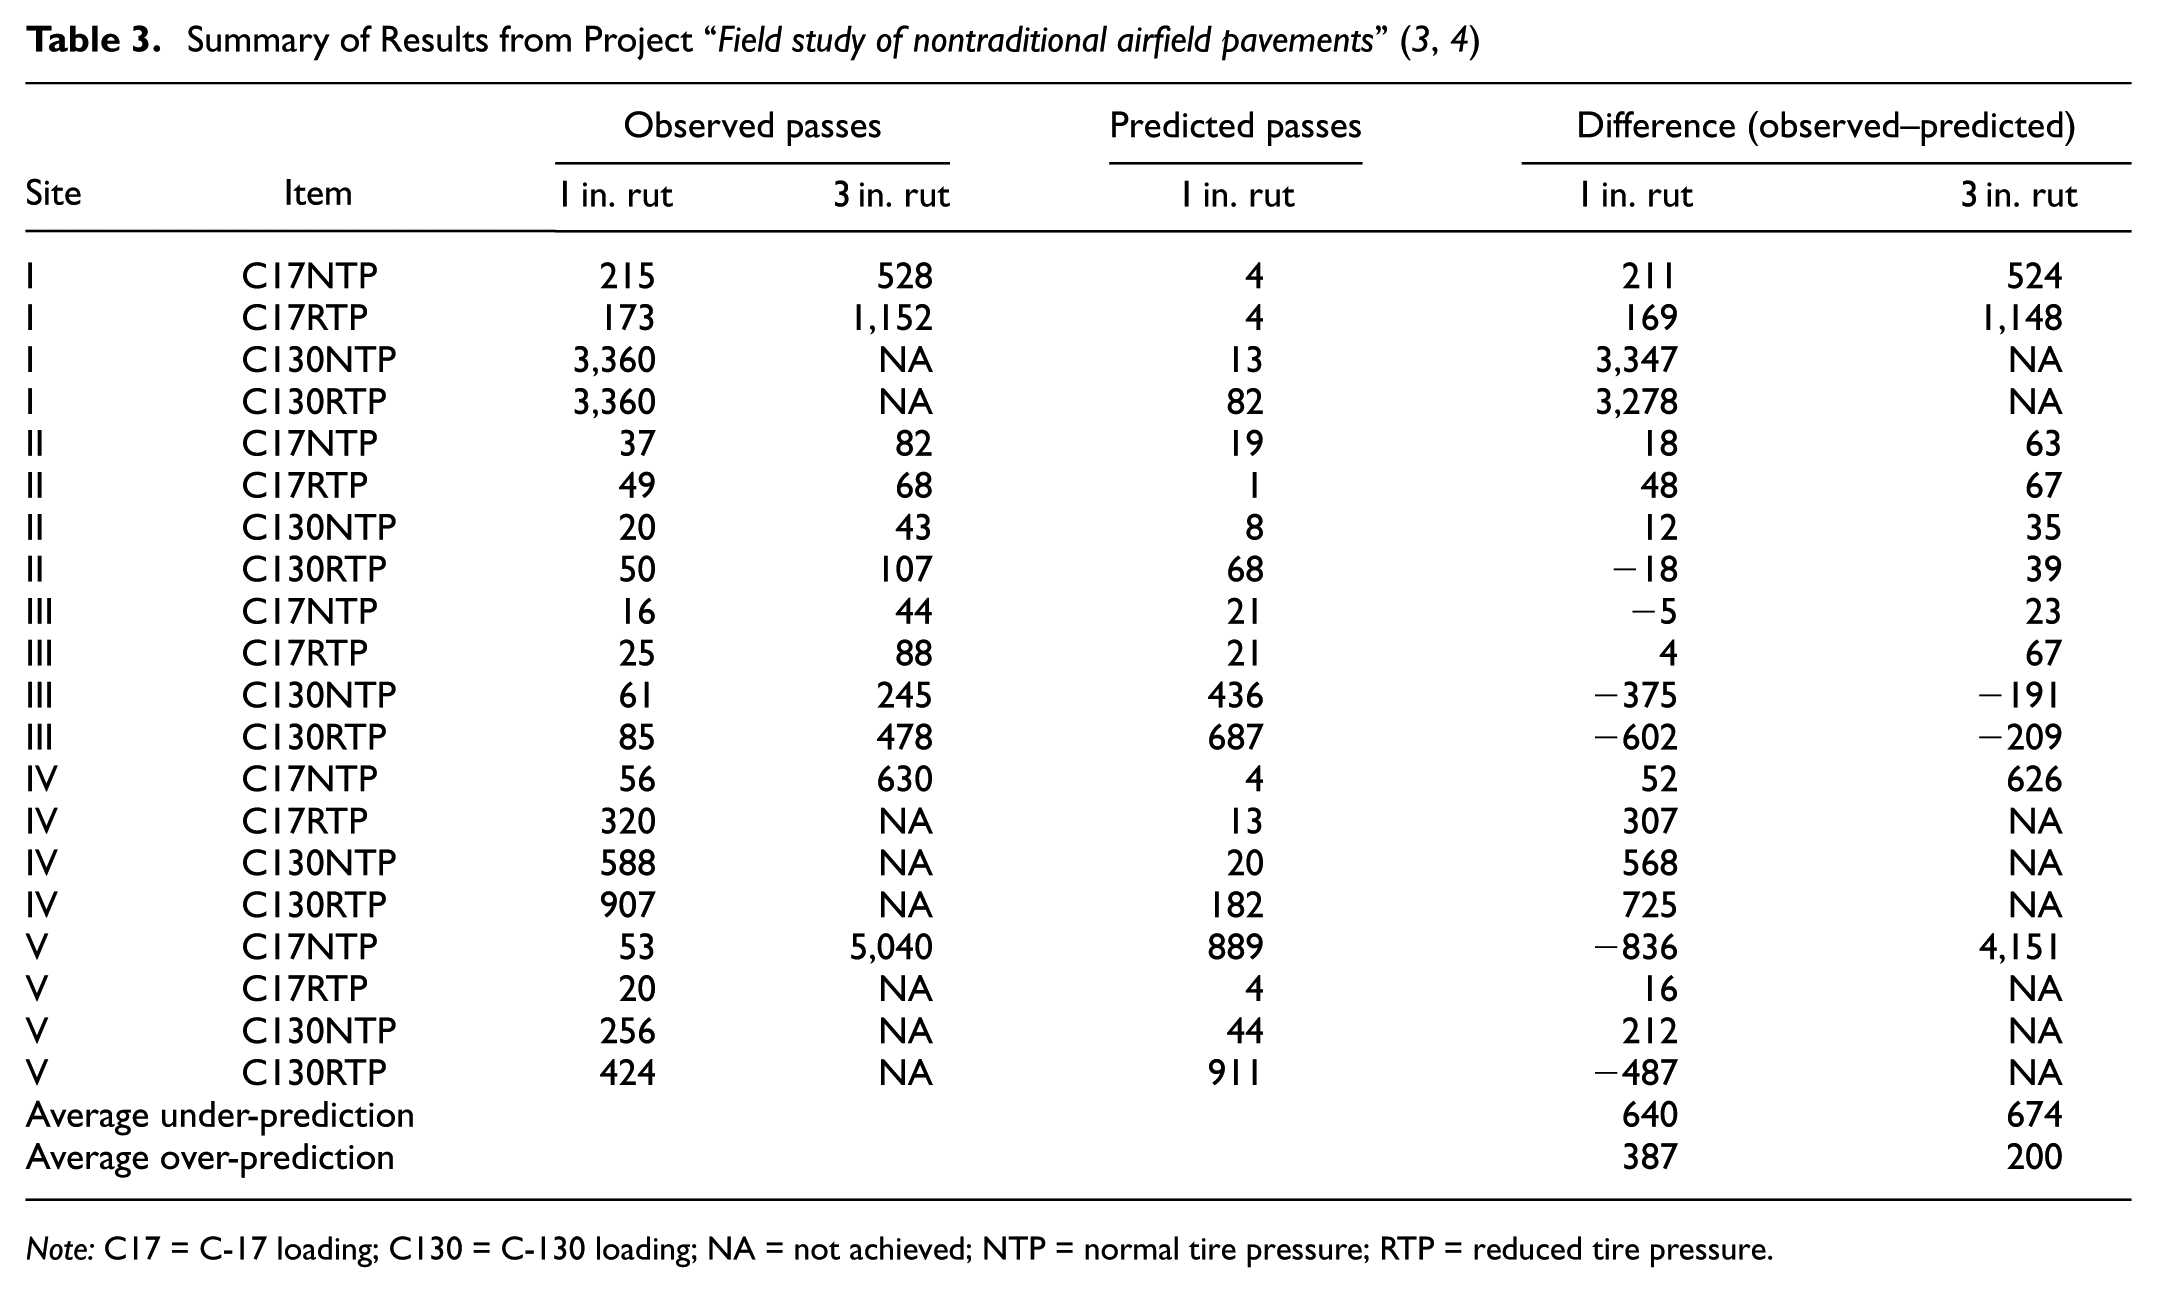
Note: C17 = C-17 loading; C130 = C-130 loading; NA = not achieved; NTP = normal tire pressure; RTP = reduced tire pressure.
The existing procedure tended to show a poor prediction of performance. In some cases, the number of predicted passes was much lower than observed passes. While this suggests that there is a level of conservatism in the design procedure, this presents a challenge for logistical decision-makers. Put simply, an airfield that is capable of sustaining aircraft operations based on the observed test section performance may be excluded from consideration because of a low level of operations predicted by the existing design methodology. Conversely, the overprediction of allowable passes could result in accelerated pavement damage, yielding an airfield that was thought to be adequate unsuitable for operation. The average difference in actual and observed performance for each test site did not reveal a quantifiable trend in the performance difference.
The observed passes and predicted passes from Tables 1–3 were combined and plotted on an equality plot, as shown in Figure 2 to determine if finite observations could be assessed from the overall dataset at 1 in. rut depth. Approximately 75% of the data fell below the line of equality (LOE), where values below the LOE indicated that the current design methodology underpredicted passes to failure. A closer review of the data that fell above the LOE found that those pavements were composed of a base course that had strength values below currently specified values, or asphalt surface layers that were composed of substandard asphalt mixtures, that would not meet current mixture design requirements. Data that fell below the LOE tended to meet material quality requirements but had layer thicknesses less than currently specified minimum values. These observations tend to confirm the need for a more robust design methodology, particularly for a low level of aircraft operations in a contingency environment.
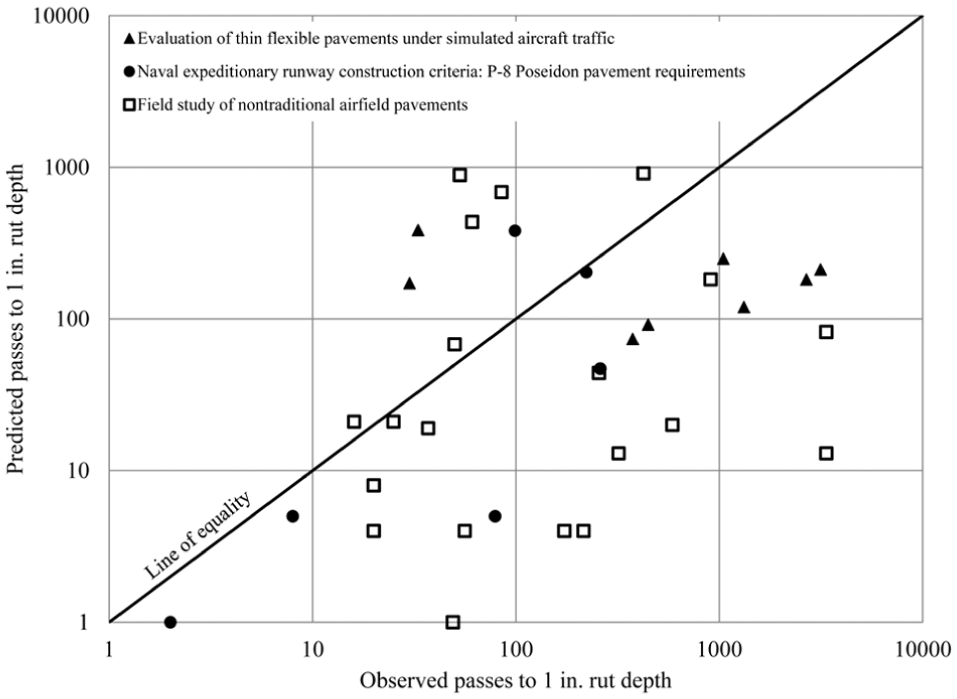
Comparison of combined datasets for contingency pavements.
Model Development
Historical Context of Deformation Models
The M-E type models to assess the permanent deformation of flexible pavement structures can take many different forms, but they generally fall into three categories: the classic M-E (cME) method, the incremental M-E (IME) method, and the incremental-recursive M-E (I-RME) method ( 14 ).
In the cME method, such as that currently used in PCASE evaluation techniques, a pavement response is calculated under the initial structural condition of the pavement, and the empirical transfer function is used to predict the number of load repetitions to failure. The load repetitions to failure are constrained by data gathered during APT, which traditionally is based on approximately 1 in. of rutting for the operation of most aircraft on airfield asphalt pavements. Furthermore, this procedure may be best suited to determine the performance of airfield pavements designed for sustainment and permanent aircraft missions, which entail an extended number of load repetitions (i.e., greater than 5,000 passes).
Both the IME and I-RME methods are noticeably different from the cME methods. Instead of relating the vehicle-loaded pavement response under initial conditions to a predetermined (i.e., field-calibrated) failure state, the IME and I-RME methods accumulate permanent deformations over continued load applications to a specified rutting threshold.
The IME and I-RME methods estimate the permanent deformation at the surface by integrating the plastic vertical strains over a desired depth through the pavement structure, utilizing Equation 1:

where
N = number of passes of vehicle,
NL = number of pavement layers, and
NSL = number of sublayers in a particular pavement layer.
This approach (both for the IME and I-RME methods) is described in the literature. Yoder and Witczak refer to the deformation accumulation approach as the “quasi-elastic approach,” owing to the use of elastic theory to estimate plastic response ( 15 ). They mention that this procedure was first introduced by Heukelom and Klomp, where laboratory experiments were performed to estimate permanent vertical strains at different stress states expected to occur at different depths in the pavement structure ( 16 ). More recently, Huang refers to the deformation accumulation approach as the “direct method” ( 17 ).
However, an important difference between the IME and I-RME approaches is that the I-RME method recursively updates the pavement structure layer moduli as it accumulates damage from load repetitions. Therefore, the implementation of the I-RME method was considered more effective to capture the structural response, in relation to permanent deformation, of flexible pavement structures under heavy and repetitive aircraft loads.
Proposed Deformation Model
The performance model presented in this study consists of an analytical solution that accommodates the temperature-frequency-dependent viscoelastic behavior of the asphalt layer and the coupled solid-pore fluid interaction of partially saturated unbound and subgrade layers. The empirical material models were greatly simplified, reducing them to well-behaved power functions with only two regression coefficients. A new modulus deterioration model that took the form of a simple Duncan-Chang soil constitutive model was developed to replace the empirical deterioration model previously developed for asphalt pavement performance predictions ( 2 ). While the initial Duncan-Chang model was stress-dependent, the rutting model described by Equation 1 is based on the approximation of incremental plastic strains in each layer ( 18 ). Thus, it is more beneficial for the tangent modulus to be updated based on the damage incurred with respect to this approximate plastic strain, as shown in Equation 2:
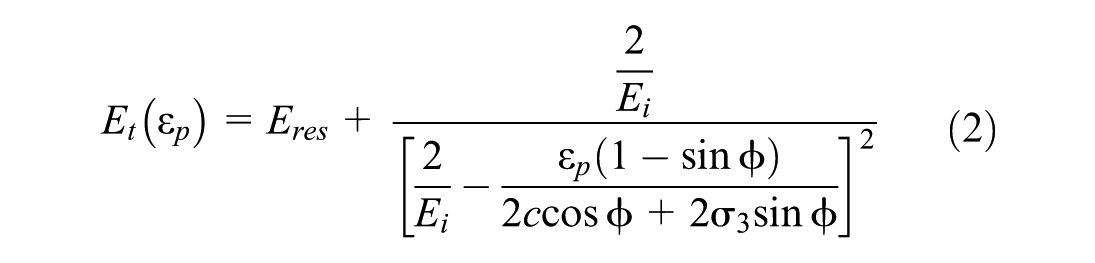
where
c = the Mohr-Coulomb shear strength parameter of cohesion,
ϕ = the Mohr-Coulomb shear strength parameter of friction angle,
As the accumulated plastic strain increases, the tangent modulus described in Equation 2 decreases until it converges to
A new analytical solution was derived using the integral transform approach to accommodate the complex behavior of granular and fine-grained materials exhibited under partially saturated conditions.
The derived algorithm is similar to the solution for multi-layered steady-state unsaturated soils recently published by Zhang et al., but with some important differences ( 19 ). The proposed solution extends the stress state variables to include radial and tangential stresses to compute the required vertical strain that is an input for the PD model. Also, the proposed solution implements a partial-bond frictional model similar to that in the Layered Elastic Analysis of General Loadings ( 20 ). Finally, the proposed solution generates a dynamic modulus curve from asphalt mix properties and performs an internal modulus adjustment based on temperature and load frequency (see Figure 3). To accurately simulate these viscoelastic and poroelastic constitutive behaviors, dynamic modulus master curves and soil–water characteristic curves (SWCCs) are required.
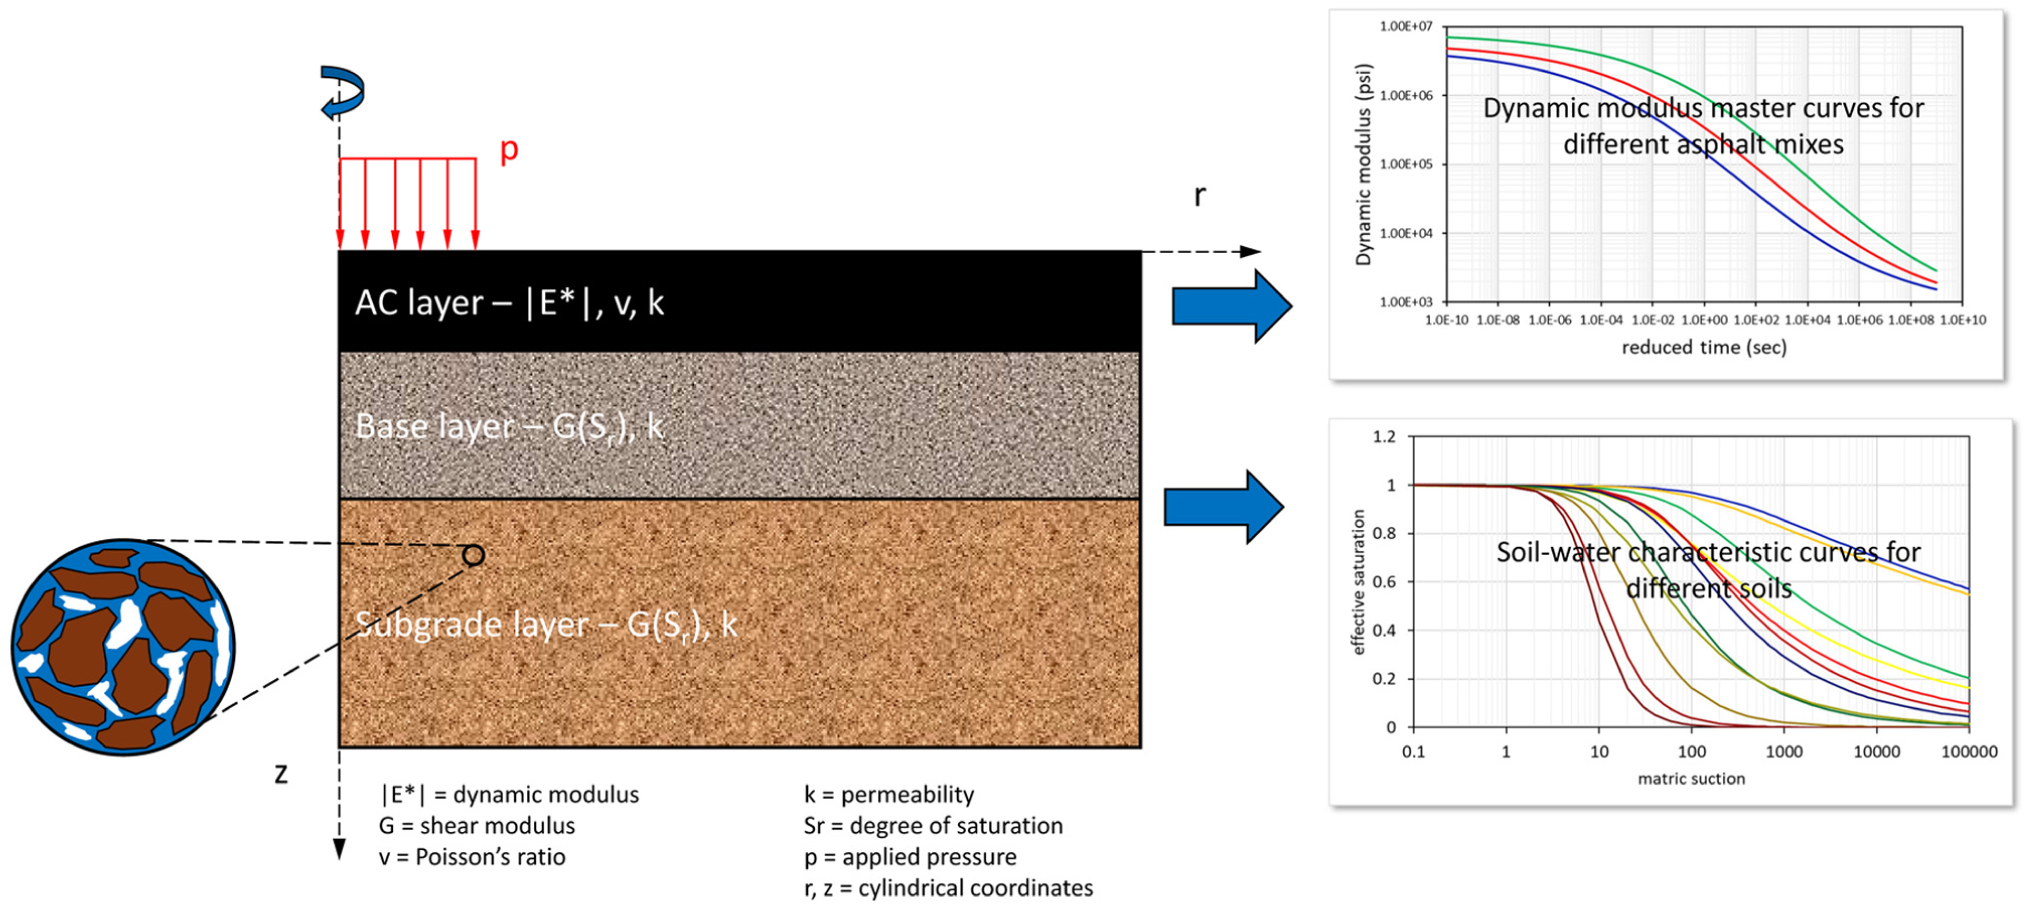
New proposed analytical response model.
The PD model is fundamentally an M-E method, as it first computes a mechanistic response at predefined points within a theoretical layered poroelastic structure caused by an aircraft load, and then relates these responses to progressive rutting performance through empirical relations. The PD model uses a fully coupled Biot layered poroelastic theory to compute this mechanistic response. Whereas, traditionally, the cME method computes the vertical strain (or stress) at the top of the subgrade only to relate to subgrade rutting performance, the PD model accumulates permanent strains from deep within the subgrade up through the structure to the surface. This is accomplished through a sub-layering approach.
The permanent deformation is computed by accumulating the plastic strains from each sublayer within their respective thicknesses. There are three different material models used to compute the plastic strain used in Equation 1: an asphalt material model, an unbound granular material model, and a subgrade material model. The asphalt material model is given in general form shown in Equation 3 and is the simplified, incremental variant of the Mechanistic-Empirical Pavement Design Guide (MEPDG) asphalt PD model ( 21 ).

where
The material model for unbound and subgrade layers is given in Equation 4, using a slightly modified form to accommodate the initial, secondary, and tertiary stages of deformation. This is the incremental variant of the PD model described by Rahman et al. in their software ERAPave PP ( 22 ).

where
The two unbound material models (i.e., granular and subgrade) accommodate all three stages of deformation, and this is particularly helpful in modeling overloaded contingency pavement structures. The form of the proposed model is simple and transparent, but the presence of the computed vertical strain in the exponential term allows for an increase in the slope of the plastic strain as the vertical strain increases, thus enabling the approximation of the tertiary stage of deformation.
The viscoelastic behavior of the asphalt is to be characterized by a dynamic modulus master curve, while the moisture sensitivity of the unbound granular and subgrade layers is characterized by unique SWCCs. The dynamic modulus master curve can either be obtained through laboratory testing or through correlation to asphalt index properties (i.e., gradation, air voids, and binder content). A laboratory-determined master curve would be considered more accurate, but there may be situations (e.g., availability of equipment, a competent laboratory, or both) where laboratory determination could be challenging. While either method could be used for the response model, the computed dynamic modulus through correlation was used in this study because index properties were considered to be more readily accessible in a contingency location. Figure 4 shows the computed dynamic modulus curve from the asphalt index properties input into the upper left portion of the graphical user interface.
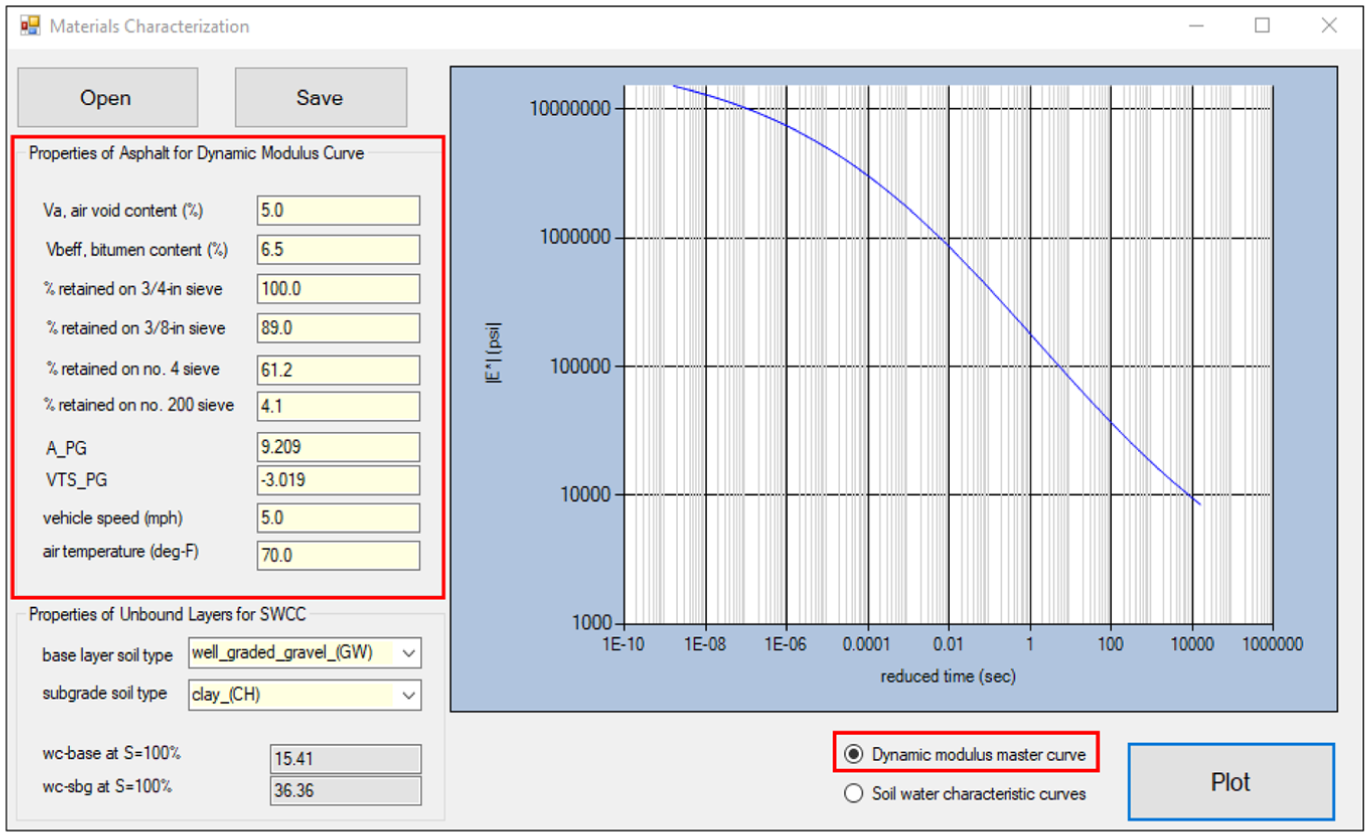
Computed dynamic modulus master curve using original Witczak equation.
To quantify the moisture sensitivity of the unbound granular and subgrade layers, it is necessary to make use of SWCCs. The SWCC is unique for each soil type. The shape of the SWCC is also a function of the initial void ratio and the stages of wetting or drying the soil undergoes. These latter variables are beyond the scope of this version of the model but perhaps will be revisited in future developments.
A popular model for fitting to laboratory measured SWCCs is the Van Genuchten model, which takes the general form of Equation 5 ( 23 ):

where
A library of SWCCs for different soil types was used to fit the Van Genuchten model. The SWCCs were obtained from a national database ( 24 ). The SWCC information can be accessed through the lower left portion of the Material Characterization form in the user interface, as shown in Figure 5.
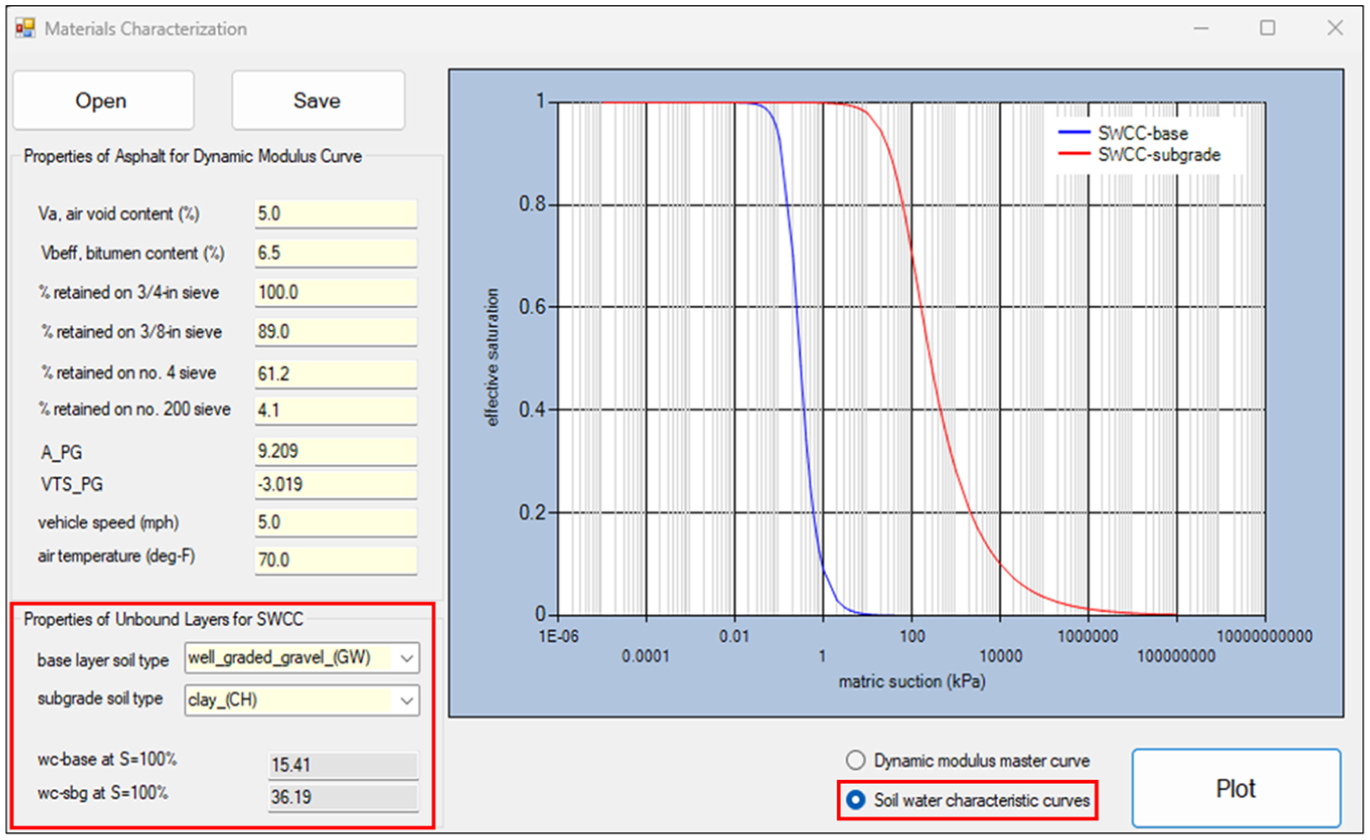
Example soil–water characteristic curves (SWCCs) for the base and subgrade layers.
An important feature of the PD model is its discrete approach to modeling vehicle wander. In addition to the predefined analysis depths using the sublayer approach, a series of analysis points aligned in the transverse direction extending across the entire width of the test section are used to account for the accumulated permanent deformation caused by different lateral offsets of the aircraft tire. Stated differently, pavement damage (i.e., permanent deformation) is accumulated at each transverse analysis point with every single pass of the traffic tire. Damage is, then, a function of the degree of stress experienced with each tire pass, rather than the tire location. From Figure 6, one can see a single tire moving laterally each pass as the load cart shifts each pass. The permanent deformation caused by the moving gear load is computed at each analysis point (red dots) along the entire width of the test section for each pass. The fundamental principle of the PD model used in this study is that stress is experienced, to some degree, at every analysis point, regardless of whether the tires from the load cart are directly over those points.
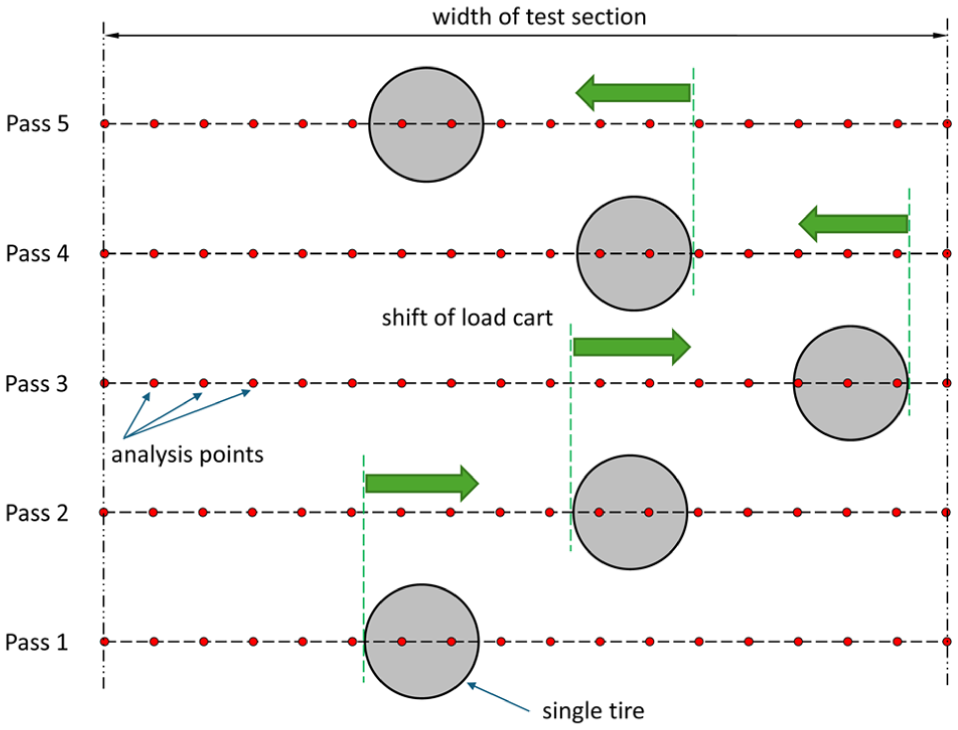
Use of transverse analysis points across width of test section to accumulate permanent deformation during each vehicle pass with wander.
One characteristic difference between the cME method and the proposed PD model is that the cME method provides only the projected number of load repetitions to a predefined failure level (e.g., 1 in. of rutting), while the PD model provides a history of accumulated permanent deformation for increased levels of load applications based on an incremental damage approach. Not only is damage accumulated across the entire transverse width of the test section with each load cart pass, but damage is also accumulated over time. This provides a “history” of the development of permanent deformation with increasing load applications to the pavement structure. In this manner, the PD model makes better use of the incremental data collected during full-scale testing and provides a more comprehensive pavement damage approach. Further, the model provides flexibility in defining failure criteria, which could be readily adjusted for future changes in aircraft performance.
Discussion of Results
To show the extensibility of the PD model to accommodate a range of different loading conditions, layer material properties and thicknesses, and environmental conditions, it is exercised against the various test sections described above. This includes the thin asphalt, P-8, and nontraditional pavement test sections. While most of these test items might be characterized as contingency pavement consisting either of thin layers or of marginal materials (or both), the range (i.e., number of passes) at which the given pavement structures failed varied significantly.
It is important to note at this point that, while all the test items had unique material properties and were subjected to different loading conditions and wander patterns, the parameters chosen for the rutting model in Equations 3 and 4 were not modified to better fit the measured performance data. The only aspect of the overall model that was changed were the pavement structure thicknesses, layer material properties (including master curves and SWCCs), and the loads with their corresponding wander patterns. The rutting model regression parameters for each layer are given in Table 4.
Permanent deformation model material parameters for Equation 3 (asphalt) and Equation 4 (unbound and subgrade layers) ( 21 , 22 )
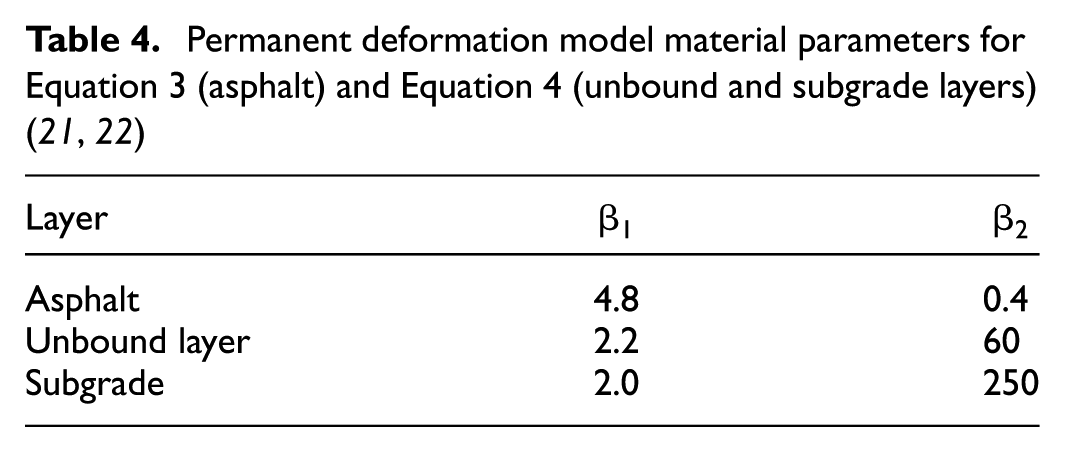
Figure 7 shows the comparisons between the predicted rutting history provided by the PD model and the measured rutting with passes for the different test items for the thin asphalt pavement test section. In general, the model performs very well in accurately predicting the rutting associated at various pass levels for the different test items up until traffic was halted. Furthermore, it is important to note the wide range of behavior exhibited by the different items: whereas C17NTP4 and C17RTP4 reached at least 3 in. of rutting by 100 passes, the other items performed noticeably better. The purpose of this test section was to examine the effects of reduced tire pressure on resulting performance of thin asphalt pavements. Consequently, it was also important for the PD model to capture the nuance in the change in contact pressure and its corresponding effect on the performance prediction. In all cases, the PD model predicted the general rutting behavior very well.
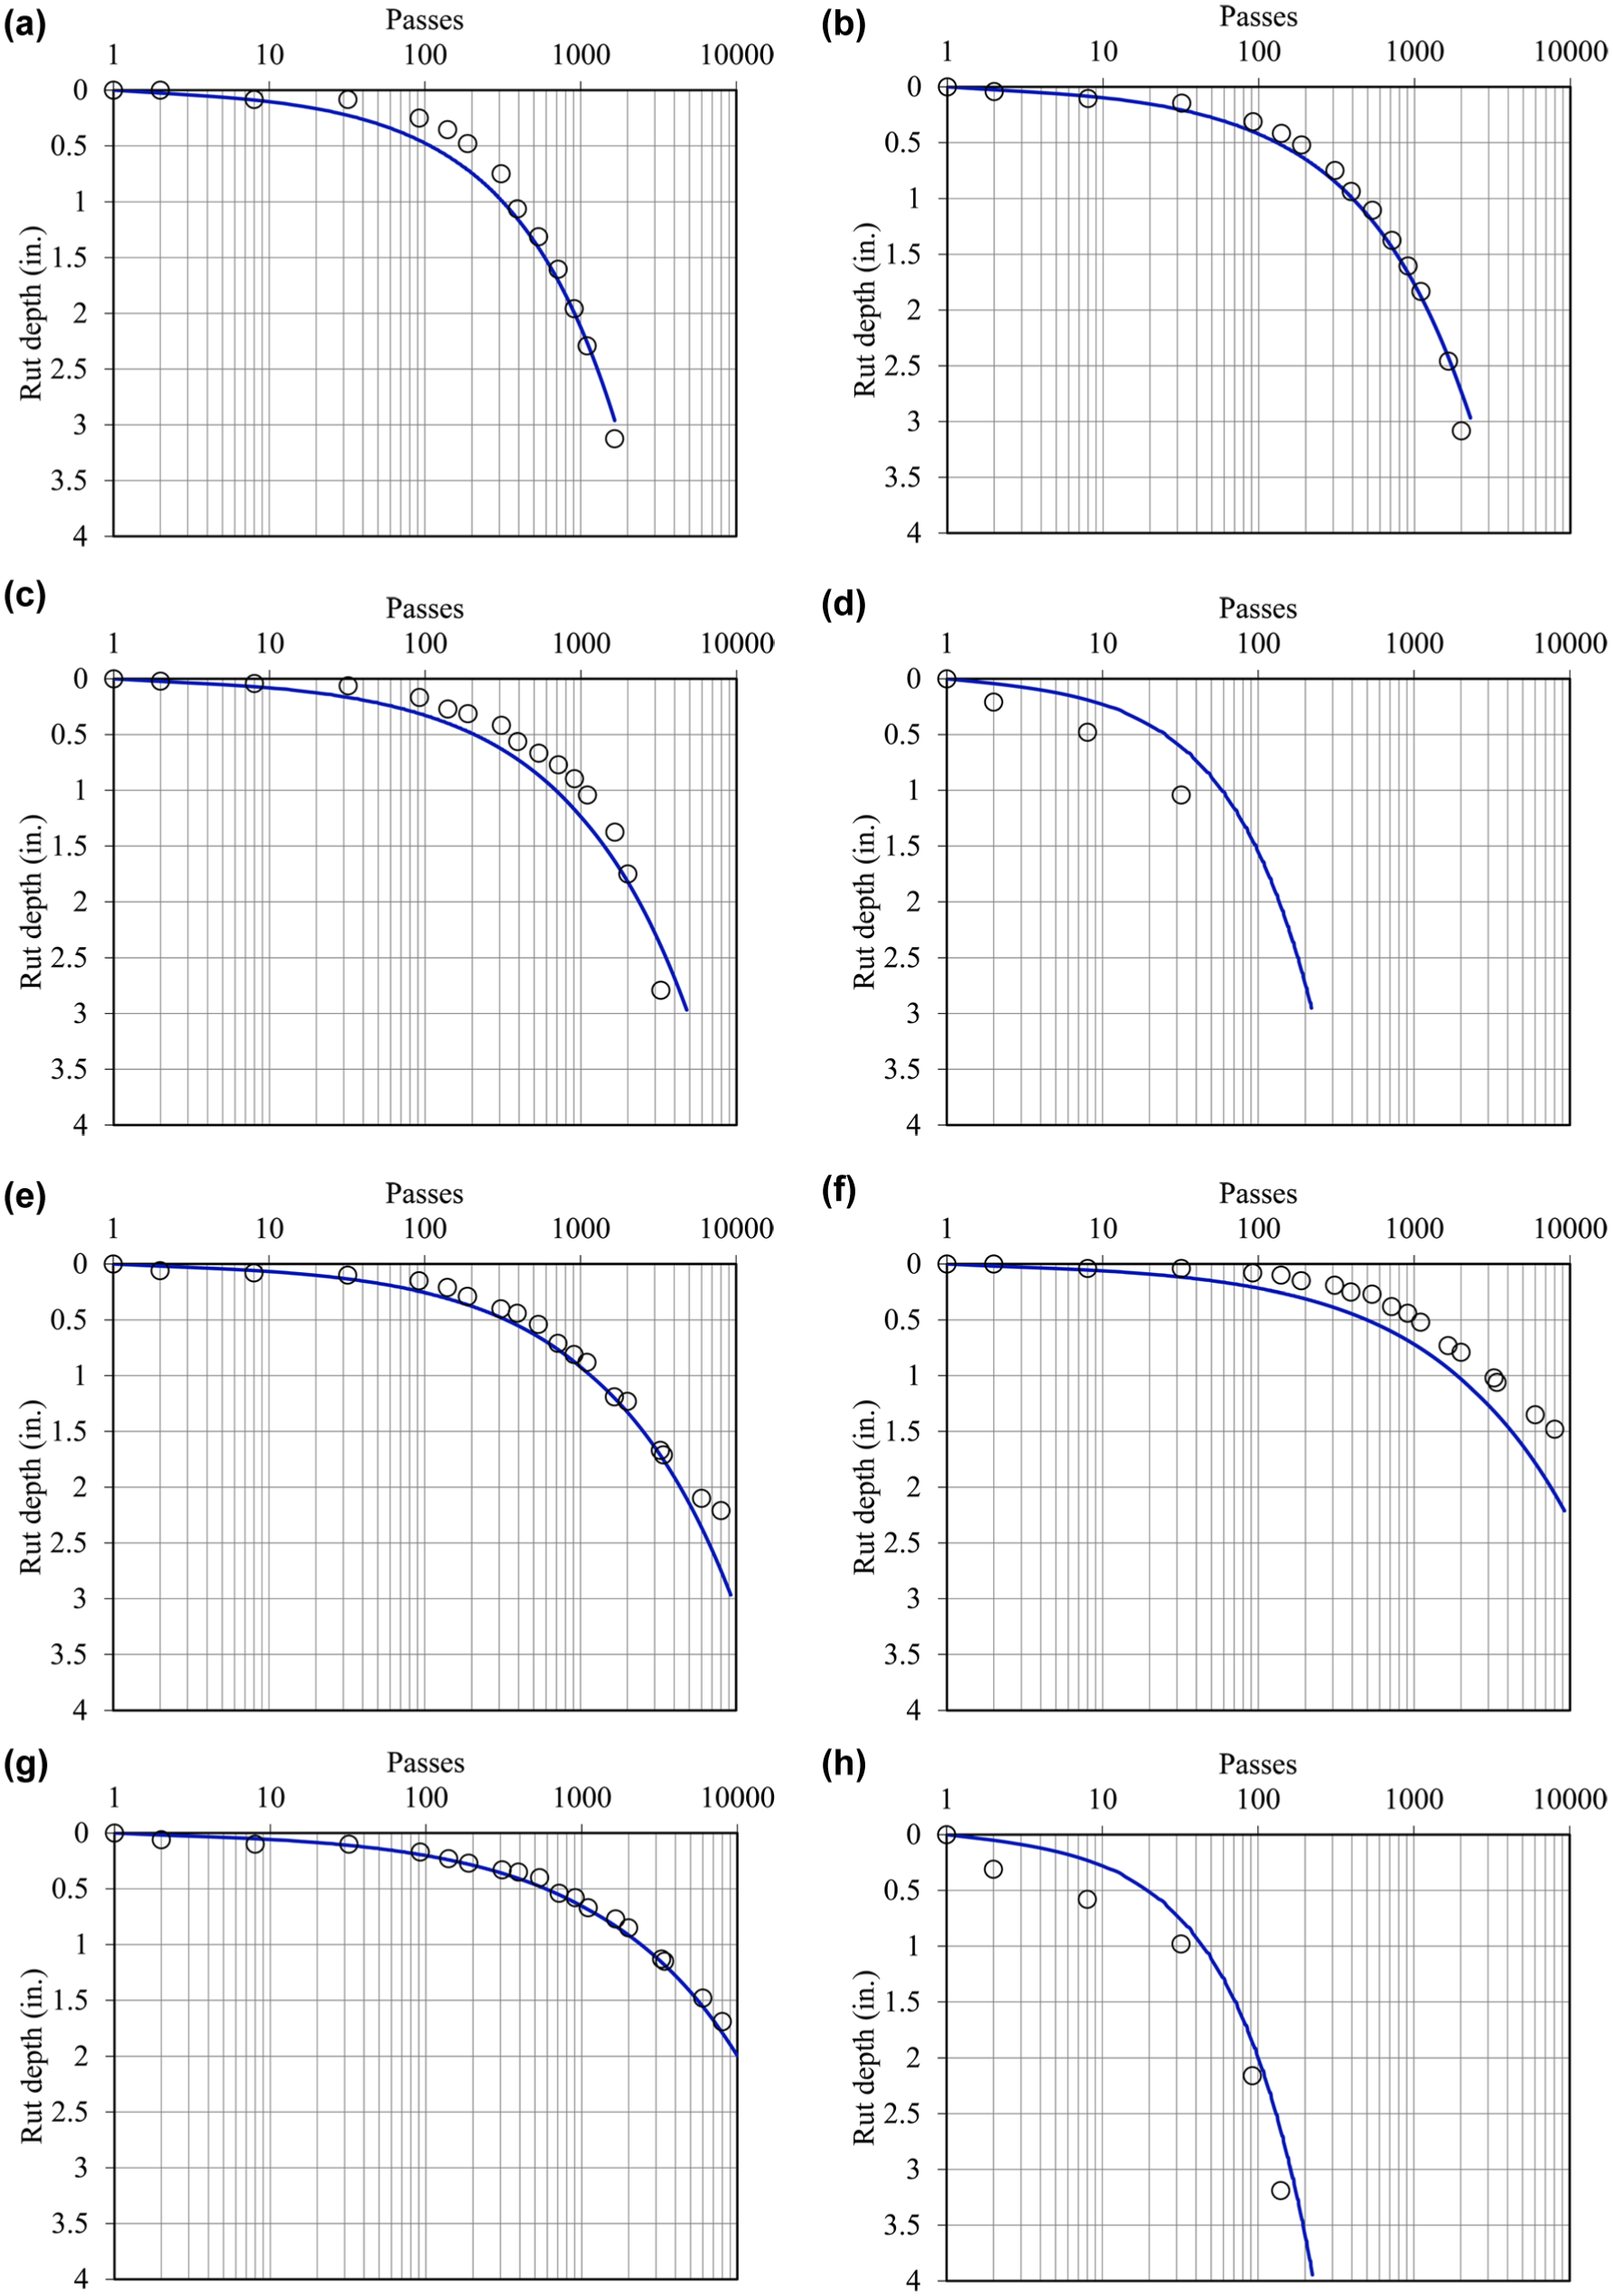
Comparison of measured (points) to predicted (blue line) rutting for thin asphalt pavements: (a) C17NTP1, (b) C17NTP2, (c) C17NTP3, (d) C17NTP4, (e) C17RTP1, (f) C17RTP2, (g) C17RTP3, and (h) C17RTP4.
Figure 8 shows the comparisons between the predicted rutting history provided by the PD model and the measured rutting with passes for the different test items for the P-8 pavement test section. Again, the PD model was able to capture the variety of different rutting rates of the different test items under simulated P-8 loading. Of particular note are “4HMA, GR, 10CBR” and “2HMA, GR, 10CBR” test items, which both failed in less than 100 passes. In both instances, the PD model also displayed a corresponding rapid rate of rutting that closely corresponded to the measured rut depths.
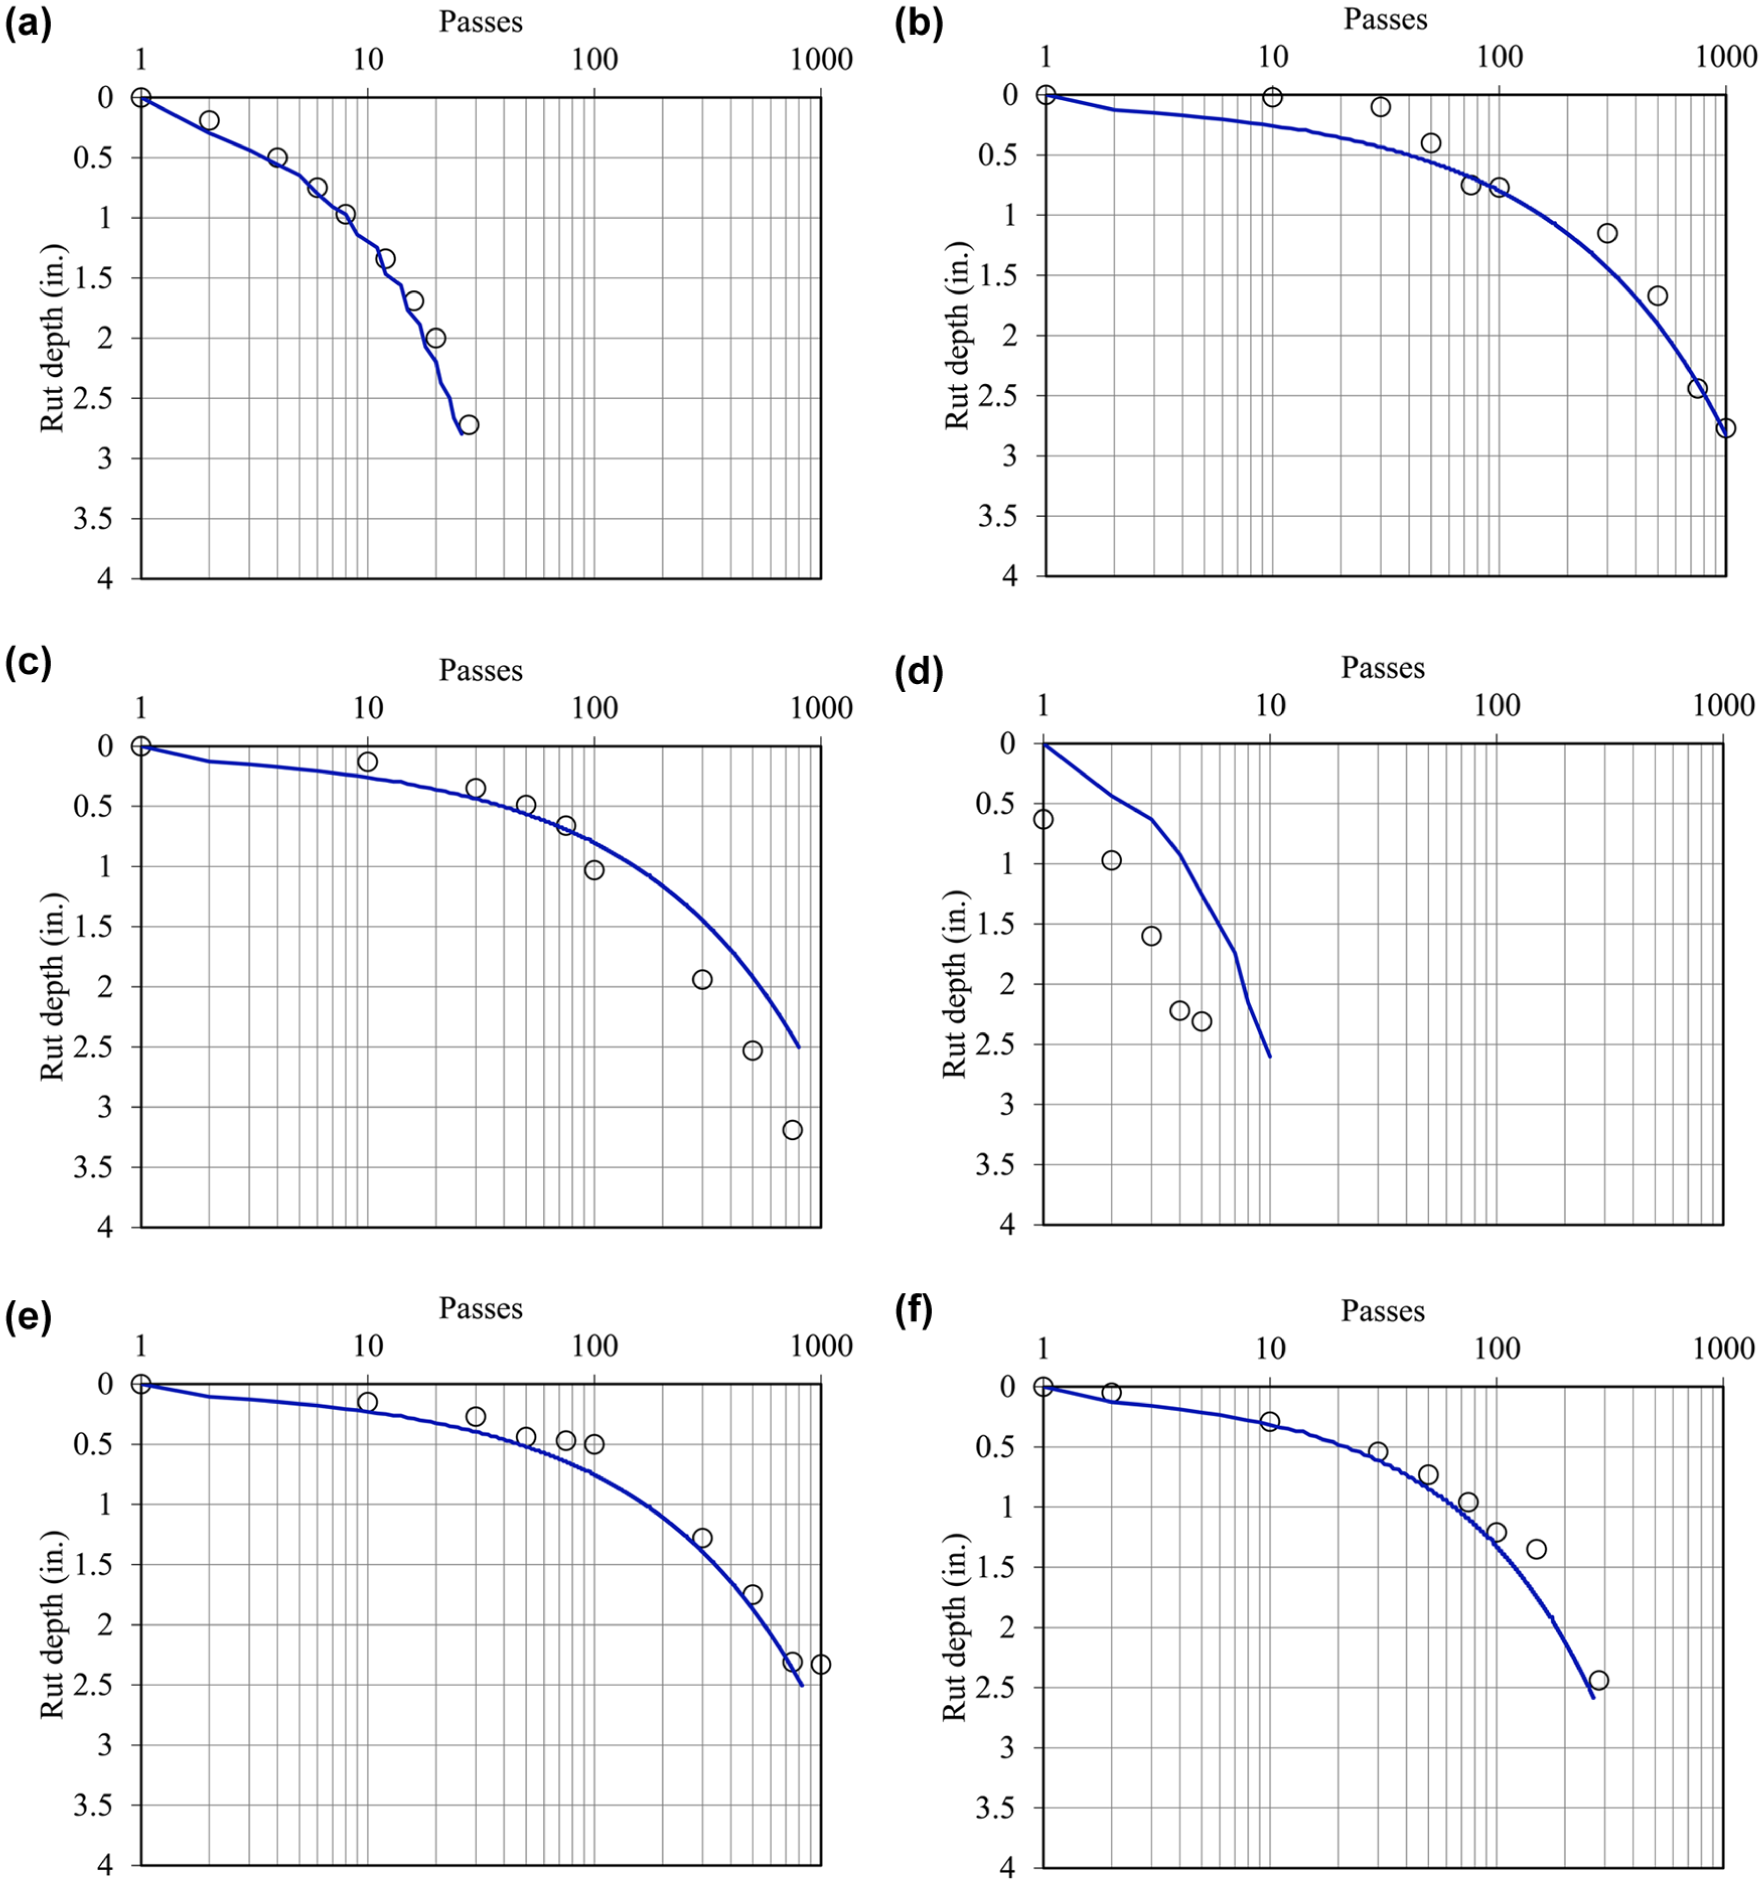
Comparison of measured (points) to predicted (blue line) rutting for P-8 asphalt pavement: (a) 4HMA, GR, 10CBR, (b) 4HMA, LS, 10CBR, (c) 4HMA, LS, 6CBR, (d) 2HMA, GR, 10CBR, (e) 2HMA, LS, 10CBR, and (f) 2HMA, LS, 6CBR.
Finally, Figures 9–13 show the comparison results of the test items from all the different sites from the nontraditional pavement test sections. As opposed to the thin asphalt and P-8 pavement test sections—which were newly constructed pavement structures where the material properties and environmental conditions were controlled—the nontraditional test sections were existing, older pavement structures that were exposed to variable climatic conditions. As such, it is clear that the PD model was not quite as successful at predicting rutting histories at different pass levels as the controlled APT sections. In some cases, as in Sites I and II, there is clear evidence of the PD model predicting higher rates of rutting than in the measured rut histories. On the other hand, it is clear that rutting occurred relatively quicker at Site V than the PD model was able to predict in the C17 items. In general, however, the PD model continued to perform very well in predicting the corresponding rutting histories under such variable conditions.
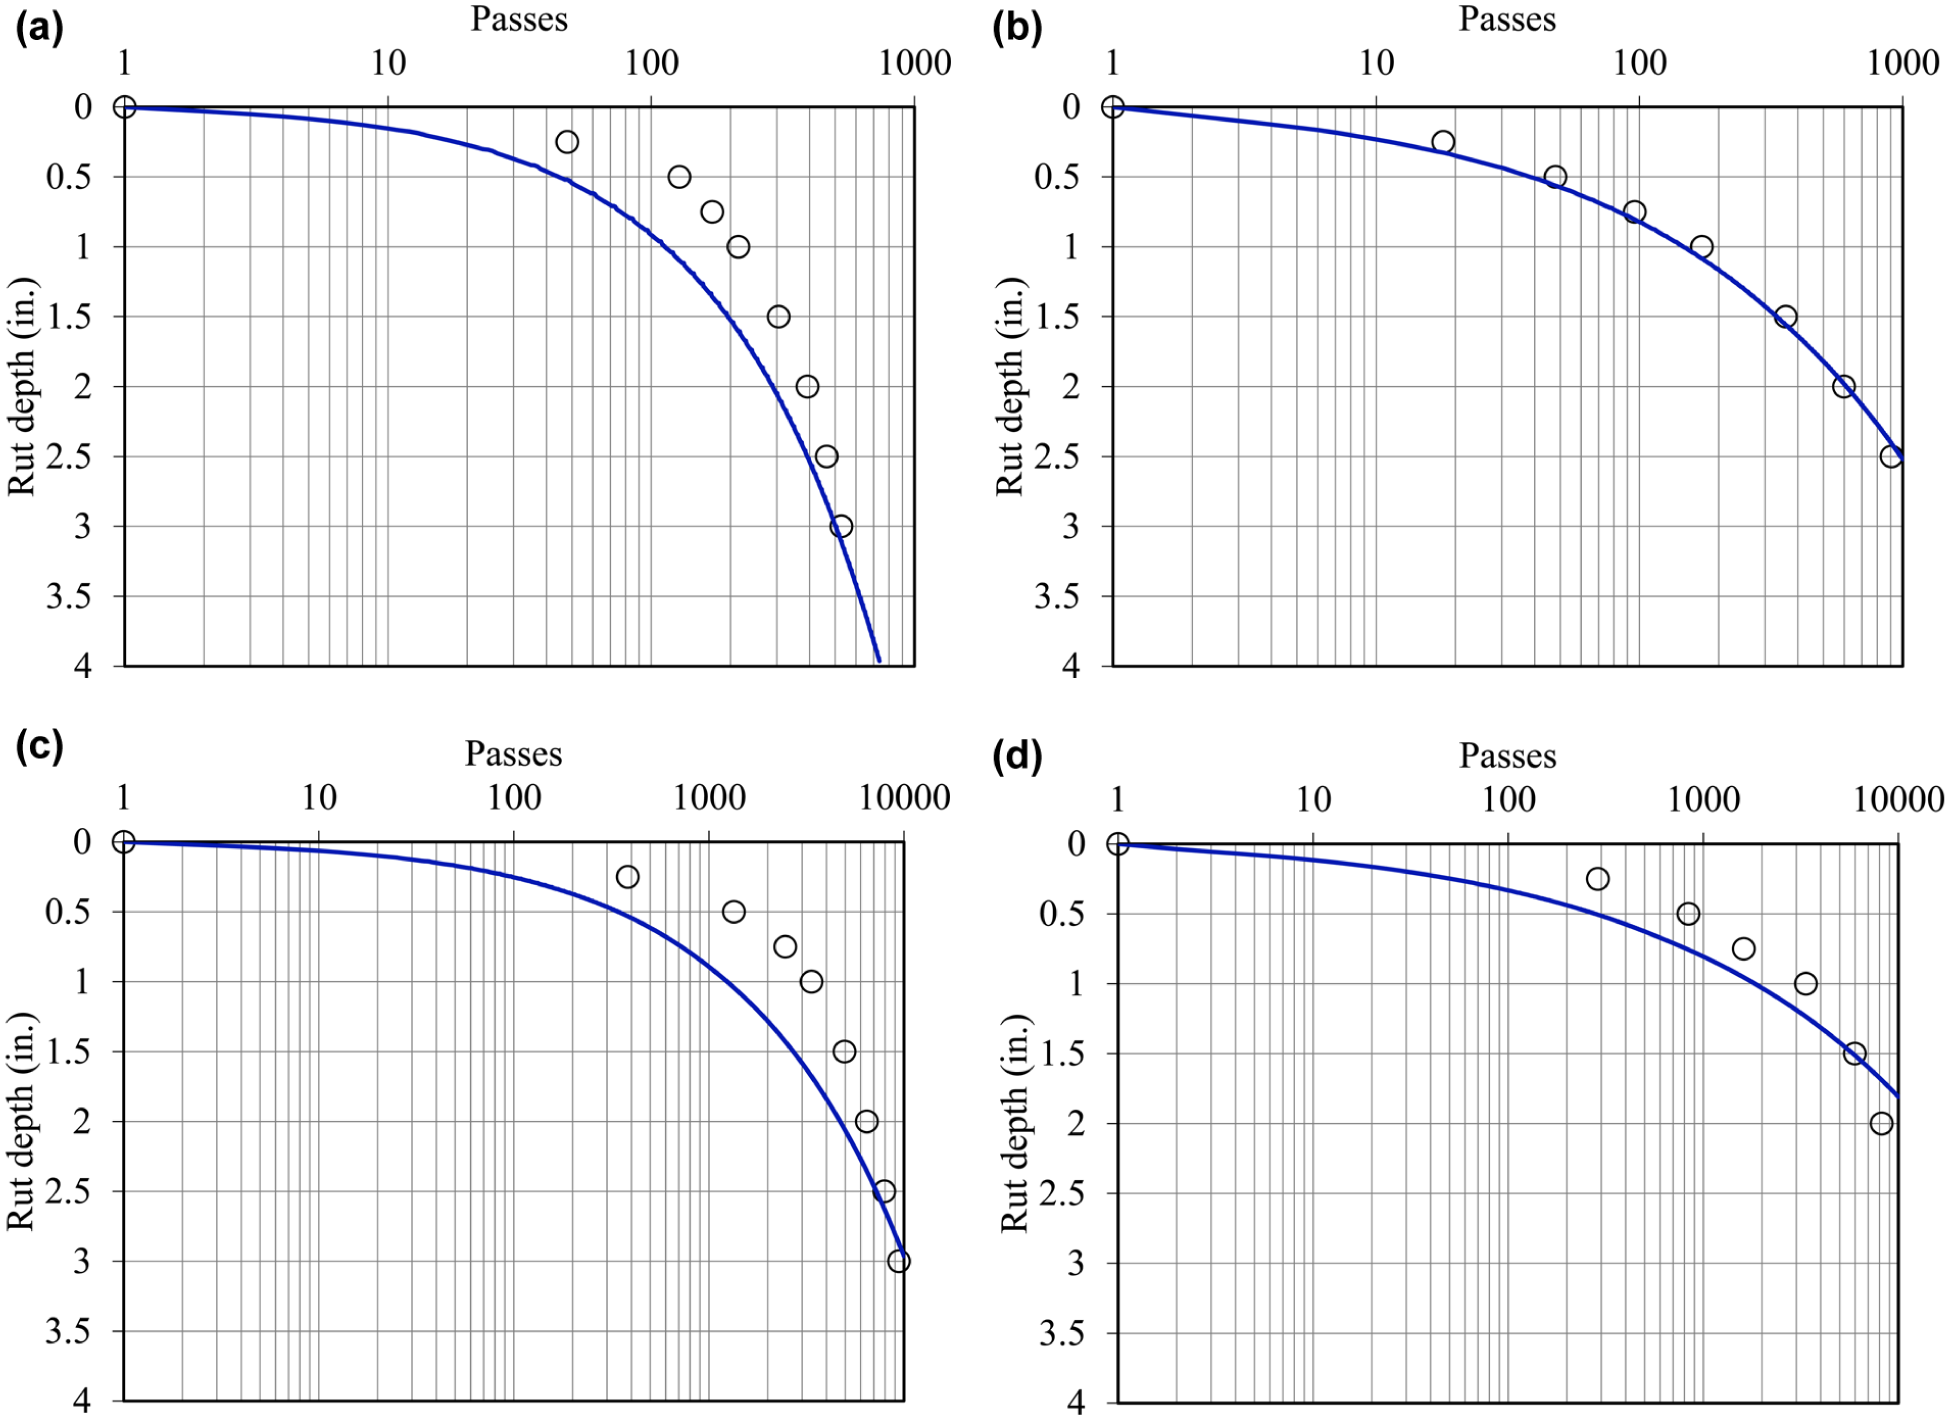
Comparison of measured (points) to predicted (blue line) rutting for nontraditional asphalt pavements Site I: (a) C17NTP, (b) C17RTP, (c) C130NTP, and (d) C130RTP.
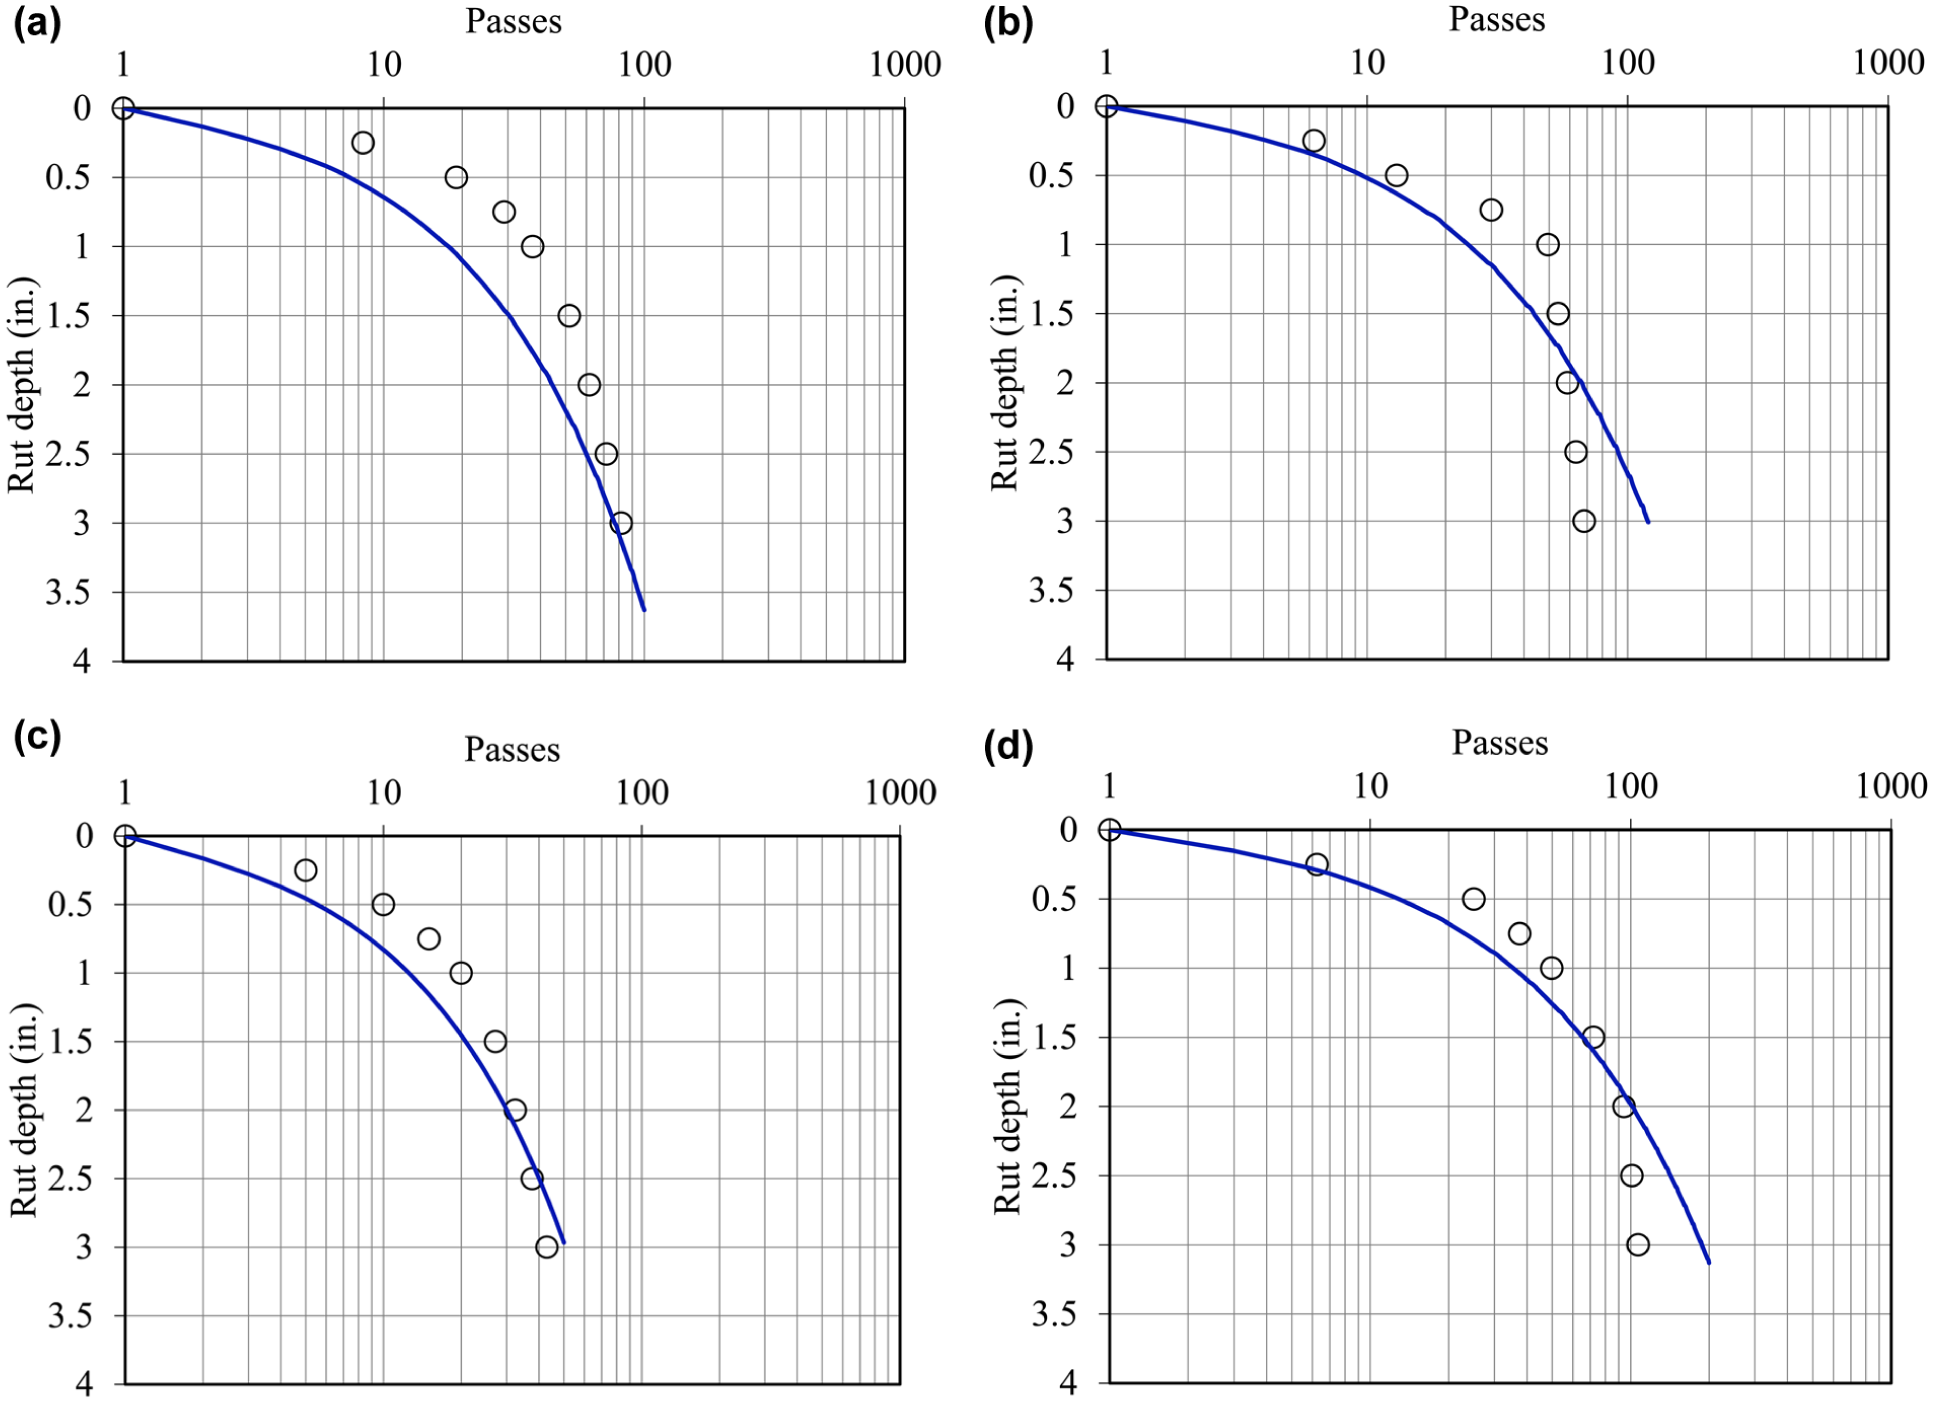
Comparison of measured (points) to predicted (blue line) rutting for nontraditional asphalt pavements Site II: (a) C17NTP, (b) C17RTP, (c) C130NTP, and (d) C130RTP.
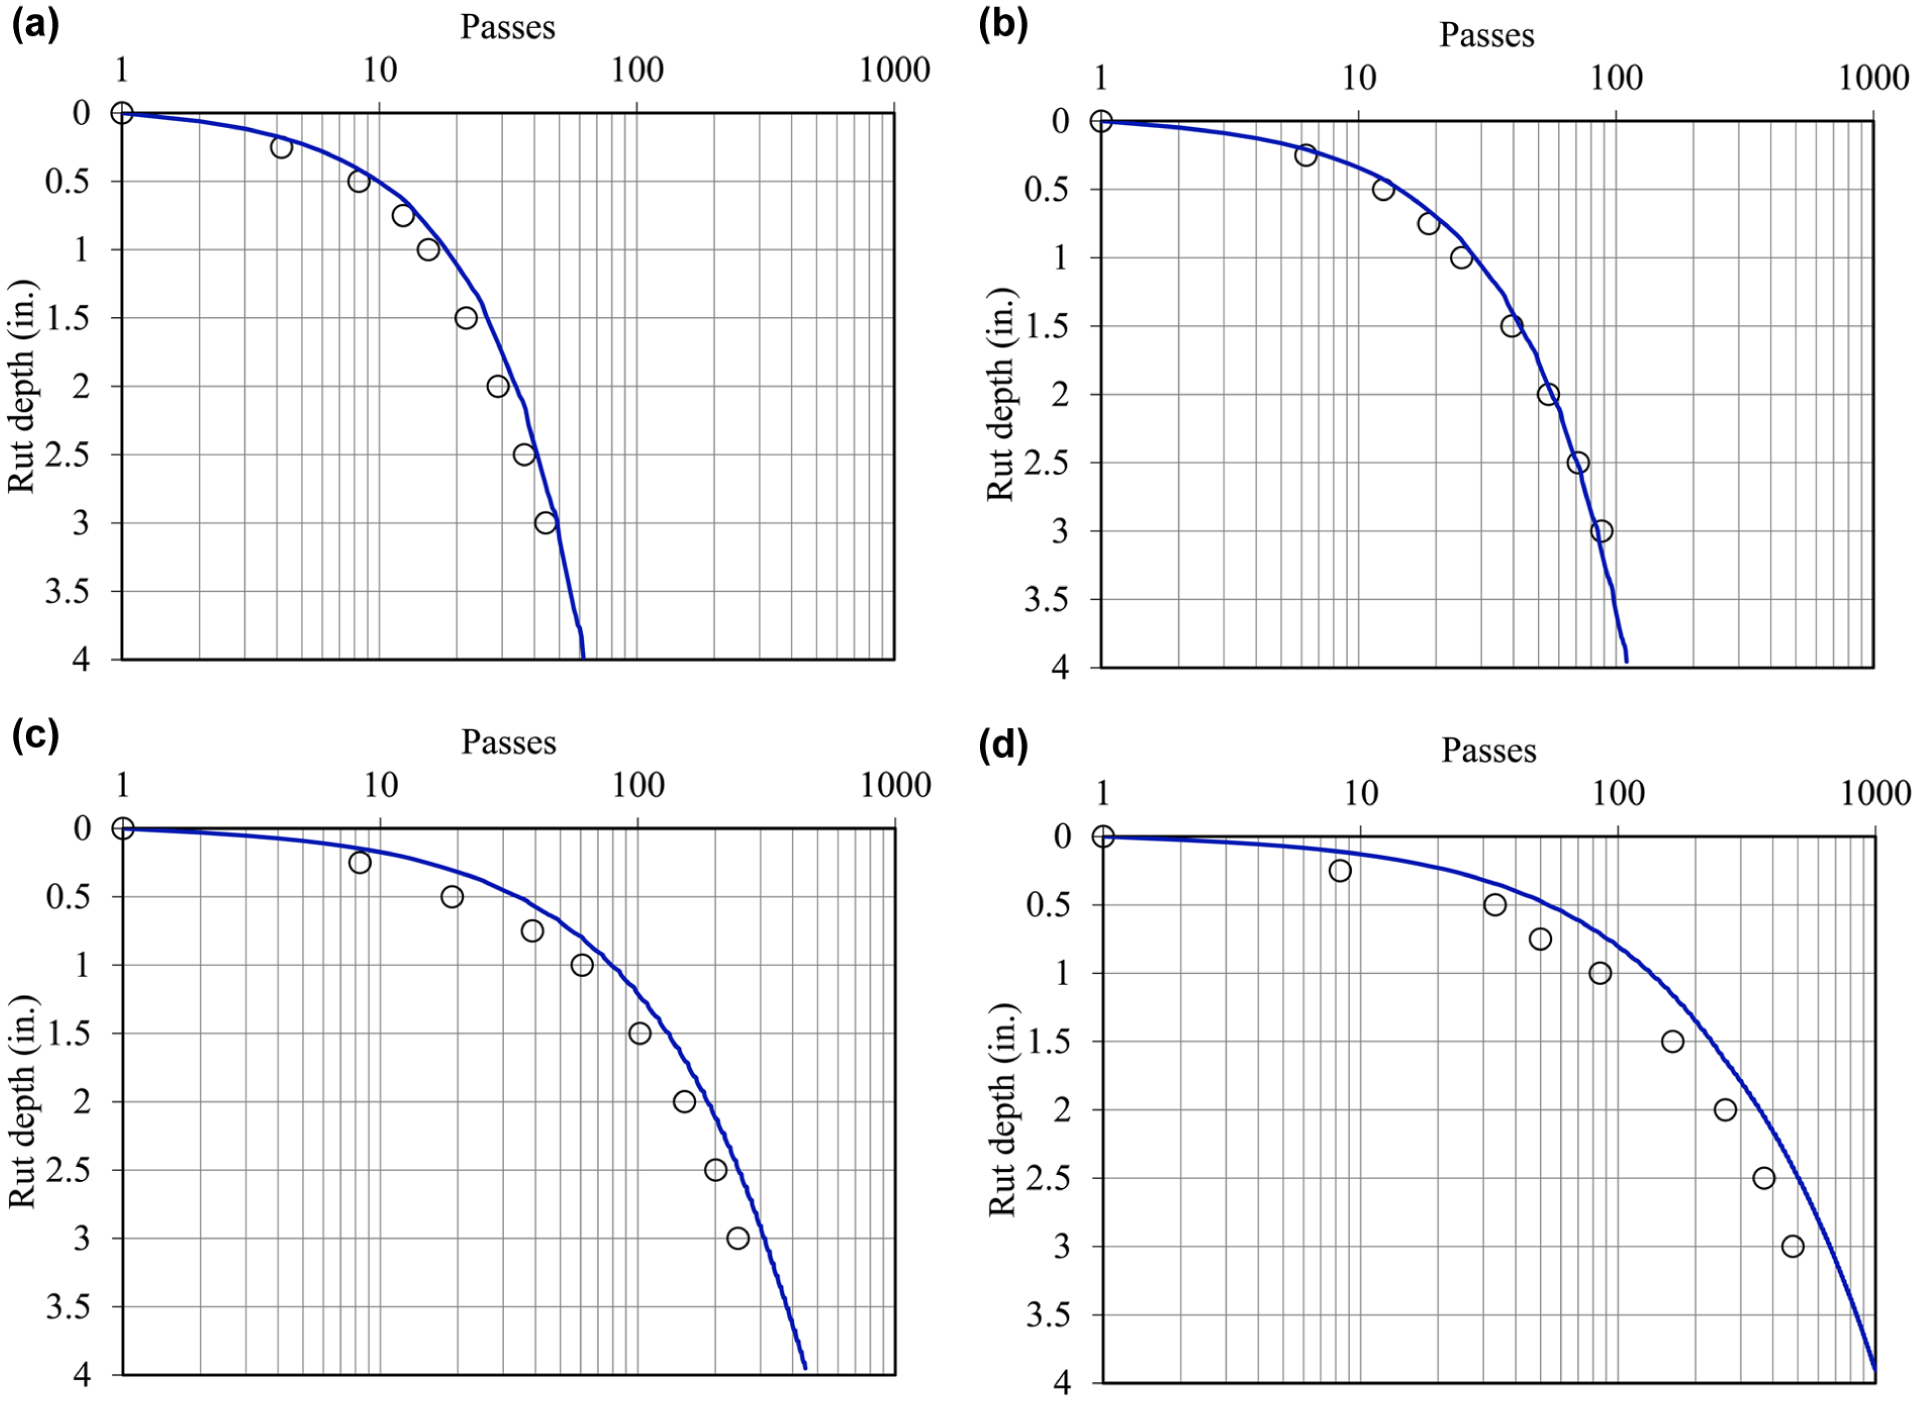
Comparison of measured (points) to predicted (blue line) rutting for nontraditional asphalt pavements Site III: (a) C17NTP, (b) C17RTP, (c) C130NTP, and (d) C130RTP.
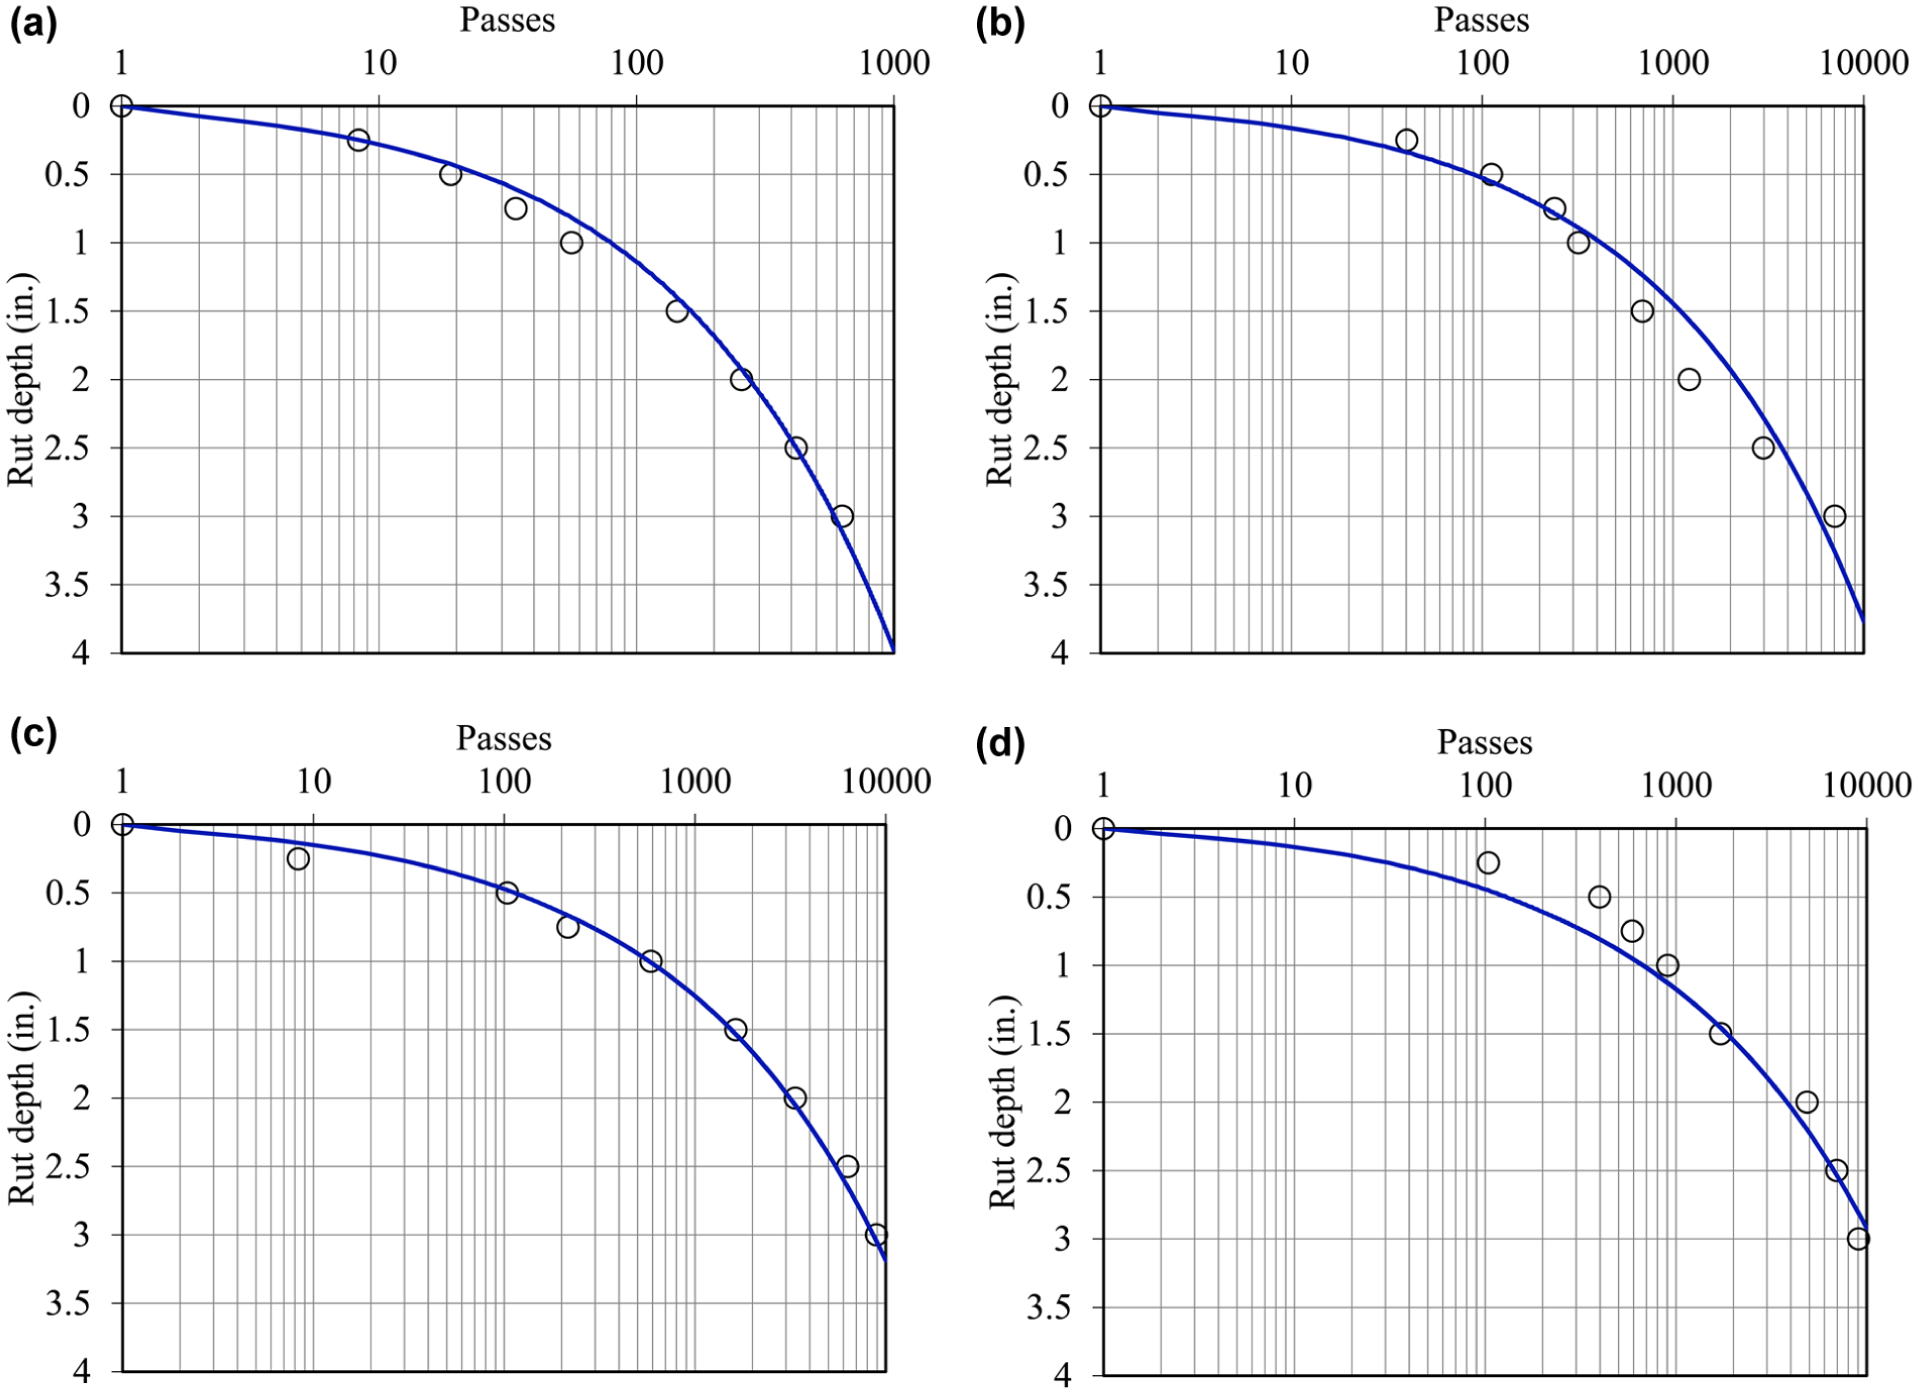
Comparison of measured (points) to predicted (blue line) rutting for nontraditional asphalt pavements Site IV: (a) C17NTP, (b) C17RTP, (c) C130NTP, and (d) C130RTP.
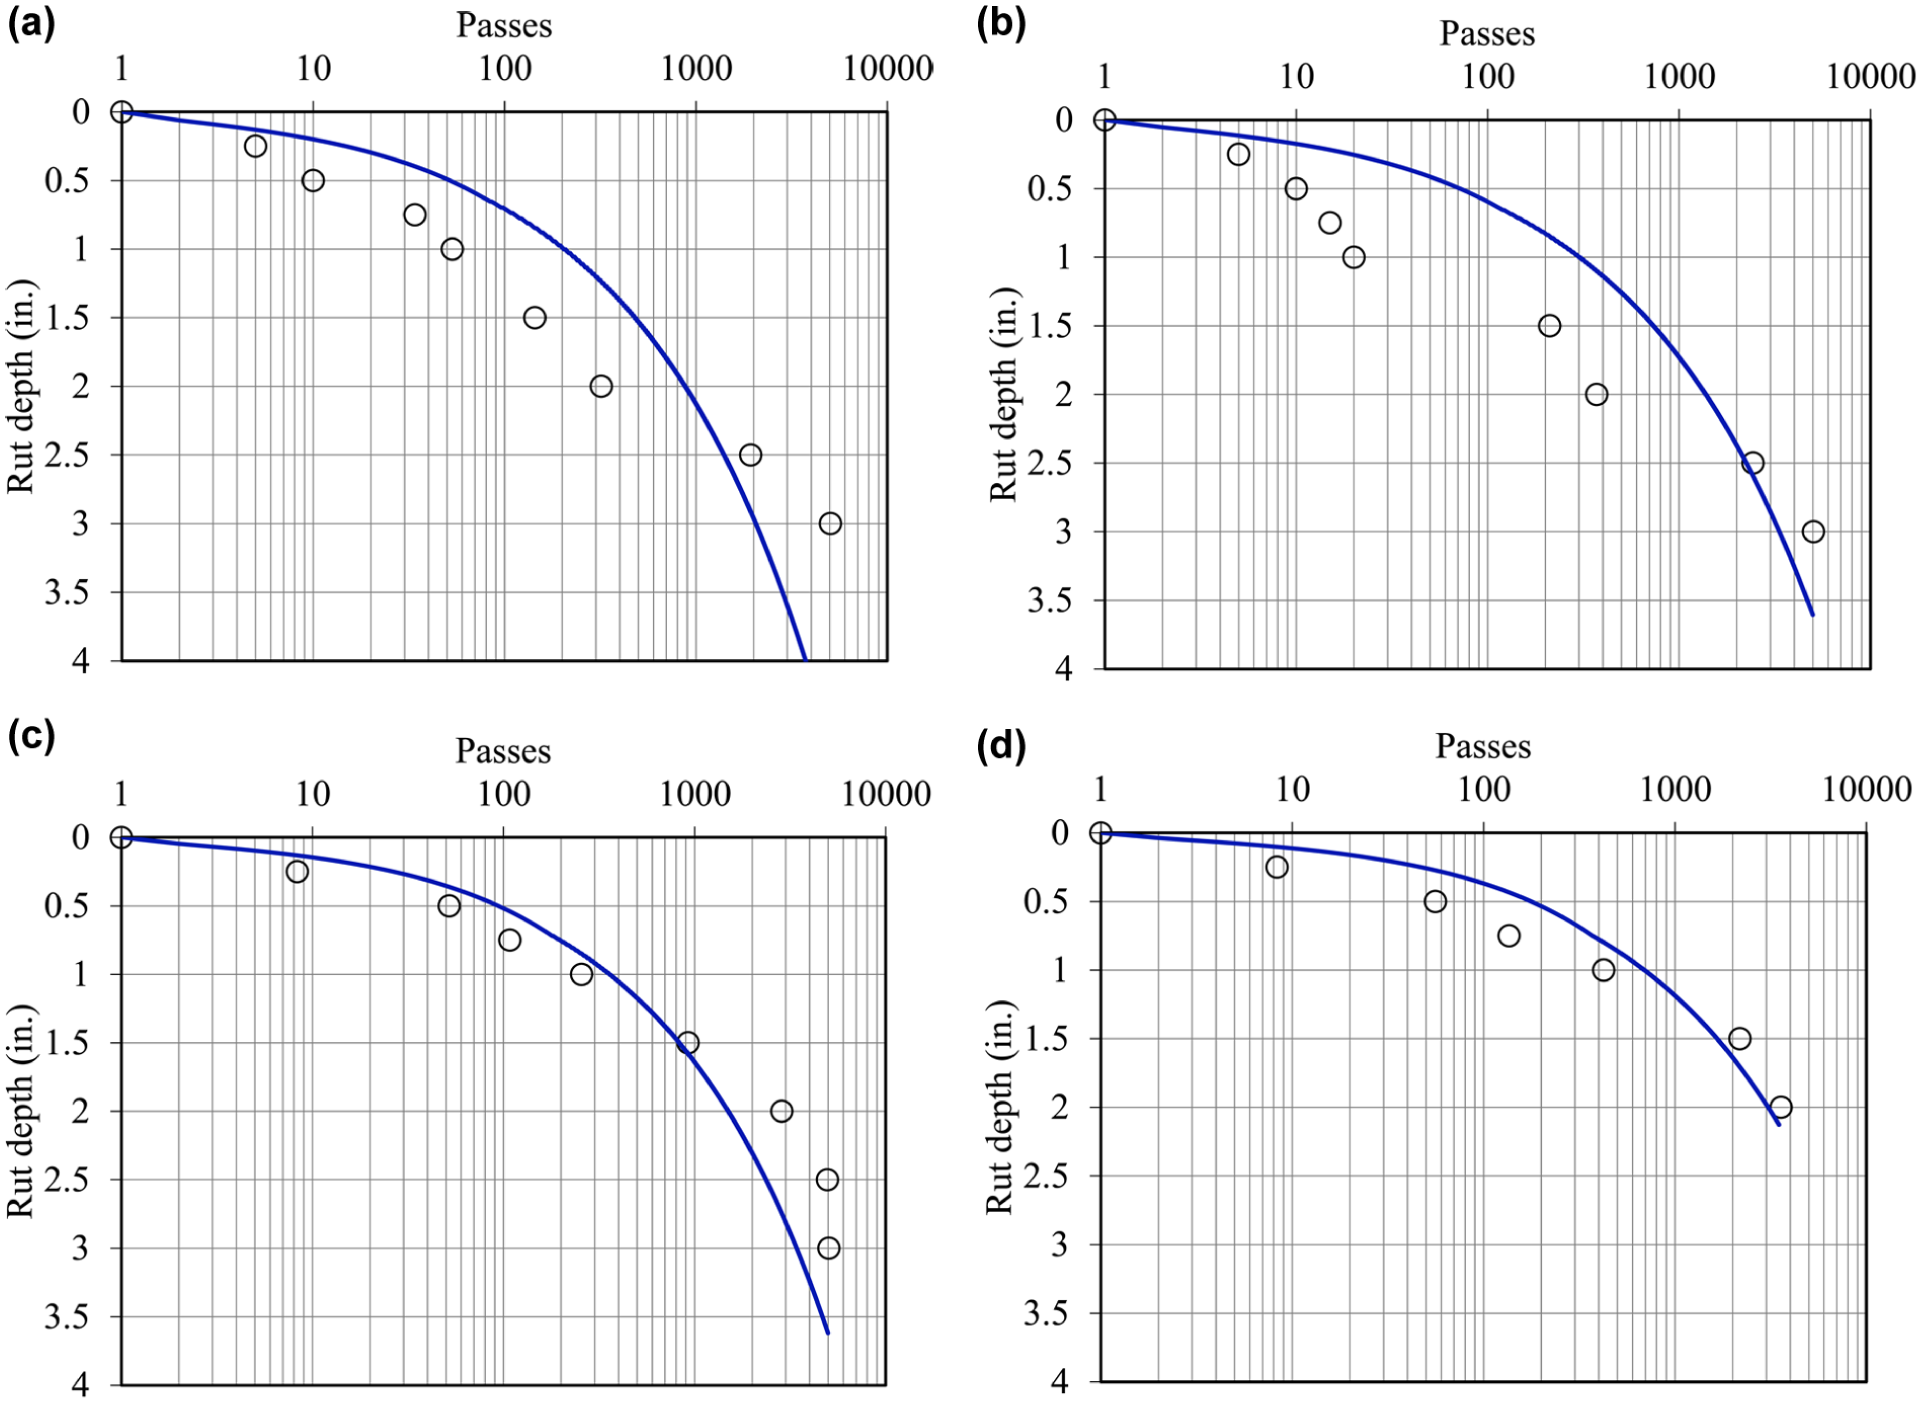
Comparison of measured (points) to predicted (blue line) rutting for nontraditional asphalt pavements Site V: (a) C17NTP, (b) C17RTP, (c) C130NTP, and (d) C130RTP.
Conclusions
This paper presents an I-RME-type PD model for contingency flexible pavements. As opposed to other PD models, such as those in the MEPDG, the PD model makes use of several distinguishing features: 1) As opposed to conventional layered elastic codes (e.g., Jacob Uzan layered elastic analysis [JULEA] in the MEPDG), the PD model implements an unsaturated poroelastic multilayer response model, which uses unique soil-water characteristic curves for different materials; 2) As opposed to the multivariable-regression models used in the MEPDG with parameters requiring calibration for each soil type, the PD model implements a simple incremental power law estimate for estimating plastic strains within sublayers, which have only two regression coefficients that do not have to be modified, despite the variety of conditions examined in the studied test sections; and 3) A modulus deterioration model that recursively updates the modulus of each layer as the approximated plastic strains continue to increase.
Using accelerated pavement test data collected under a variety of loading conditions, geometry, material properties, and environment conditions, the PD model was exercised to show its range of capability in accurately predicting rutting histories. Results showed that the PD model consistently performed well, even under conditions where it was clear that the thin, marginal pavement structures were overloaded and failed in less than 100 passes. The model provided a reasonable estimate of incremental damage that can be used to improve the prediction of anticipated aircraft operations at a relatively low operation level. The ability to develop rutting curves allows for planners to assess operations beyond typical failure criteria (i.e., 1 in. of rutting) to improve risk assessments for potentially overloaded or aged pavements. While the model was exercised against a variety of pavement conditions, materials, and thicknesses, the loading conditions were limited to three aircraft. Additional research is needed to investigate the model’s predictive capabilities under tactical aircraft loading conditions, which typically possess much higher tire inflation pressures.
Footnotes
Acknowledgements
The tests described and the resulting data presented in this paper, unless otherwise noted, were obtained from research sponsored by the U.S. Air Force and the U.S. Navy, and performed by the U.S. Army ERDC. Permission was granted by the Director, Geotechnical and Structures Laboratory, to publish this information.
Author Contributions
The authors confirm contribution to the paper as follows: study conception and design: J. Robinson, J. Stache, V. Garcia; data collection: J. Robinson, V. Garcia; analysis and interpretation of results: J. Stache, J. Robinson; draft manuscript preparation: J. Robinson, J. Stache, V. Garcia. All authors reviewed the results and approved the final version of the manuscript.
Declaration of Conflicting Interests
The authors declared no potential conflicts of interest with respect to the research, authorship, and/or publication of this article.
Funding
The authors disclosed receipt of the following financial support for the research, authorship, and/or publication of this article: The tests described and the resulting data presented in this paper, unless otherwise noted, were obtained from research sponsored by the U.S. Air Force and the U.S. Navy, and performed by the U.S. Army ERDC.
