






Abstract
Waste glass has shown promising results when used to stabilize soil, particularly in pavement applications. The elastic behavior of cement with recycled glass powder (RGP) in the lateritic soils has not been investigated yet. This study illustrates the potential use of RGP as a sustainable substitute for soil stabilization in urban pavement layers. The resilient behavior of clayey soils from southern Brazil, treated with high-early strength cement at contents of 3% and 6%, and RGP at contents of 3%, 6%, and 12%, was investigated. Resilient modulus (MR) tests were performed on untreated soil, soil–cement, and soil–cement-RGP specimens. Five MR prediction models were calibrated using data from repeated load triaxial (RLT) tests. Using Multiple Layer Elastic Analysis (AEMC) software, the useful life of an urban pavement was estimated, considering the properties of the subgrade, subbase, and base layers. Results showed that adding 3% RGP to cement-soil mixtures significantly improved the MR. Mechanistic analysis demonstrated that soil–cement-RGP mixtures C3RGP3 and C3RGP6 performed with a higher service life than cement-soil mixture C3, and soil–cement-RGP mixture C6RGP3 achieved a higher service life than cement-soil mixture C6. These findings underscore RGP’s effectiveness in enhancing pavement material properties. The results align with the integration of geotechnical engineering research and Brazilian national agencies, providing an effective alternative to traditional methods that benefits organizations such as the National Department of Transport Infrastructure, the National Land Transport Agency, the Road Research Institute, and highway contractors.
Introduction
Geotechnical engineers face frequent obstacles when working with soft soils because of their limited bearing capacity and significant settlement potential. The extensive distribution of these soils points out the importance of appropriate stabilizing measures. Although cement and lime are useful ( 1 – 7 ), their environmental and economical costs are becoming increasingly unacceptable. Soft soils are defined by their high plasticity, compressibility, moisture content, poor permeability, and high clay mineral concentration, combined with a large void ratio ( 8 ).
Heavy traffic vehicles require a base with high stiffness and a high resilient modulus (MR) to withstand axle loads. The traditional restorative method for clay soils under static or dynamic stresses entails substituting with superior quality soil, which can be rather expensive ( 9 ). Furthermore, a modified effort Proctor compaction is recommended in base layers to achieve the necessary strength and stiffness, ensuring serviceability.
On the other hand, stabilization of soil with cement and glass powder could be an effective strategy for solid waste management, minimizing the need for landfills and associated environmental problems. Several studies ( 10 – 15 ) have shown that glass powder can enhance the soil cement stabilization.
Because of its high concentration of amorphous silica and alumina, the recycled glass powder (RGP) is among the latest materials utilized in soil–cement stabilization as a pozzolanic additive ( 16 – 20 ). The incorporation of RGP as a pozzolanic material is considered a cost-effective alternative in decreasing Portland cement consumption ( 16 ).
Annually, around 130 million tonnes of glass waste is produced in the world, with an average recycling rate of only 21% ( 21 ). This waste primarily consists of crushed glass and fine dust produced during glass cutting and preparation processes ( 22 ). The United States, Canada, Australia, the United Kingdom, Germany, and India produce 11.4, 0.75, 1.1, 2.4, 2.5, and 21 million tonnes of glass waste annually. The recycling rates for these countries are 27%, 40%, 57%, 45%, 80%, and 45%, respectively ( 21 ).
In 2022, Brazil made 34.3 million tons of glass waste ( 23 ). The lack of recycling facilities for glass waste results in a significant accumulation of these materials, leading to adverse environmental impacts. Consequently, repurposing RGP for soil stabilization is essential to mitigate pollution and reduce environmental damage.
Unconfined compressive strength, splitting tensile strength, and California bearing ratio of soil stabilized with cement and glass powder has been widely investigated ( 15 , 16 , 24 – 26 ). However, there is a lack of knowledge concerning the resilient behavior of clayey soil stabilized with cement and glass waste, particularly in relation to its potential application in the base layers of pavements.
Mechanical investigations were conducted by Perera et al. ( 27 ) to evaluate the effects of crushed glass (dimensions < 5 mm) on clayey soil for application in pavement subgrade. The glass significantly enhanced the mechanical properties of the unconfined compressive strength, California bearing ratio, and MR. According to their results, the ideal crushed glass addition is between 10% and 15%.
The MR is defined as the ratio of cyclic axial stress to resilient axial strain, considered by the Mechanistic-Empirical Pavement Design Guide ( 28 ) as a fundamental parameter in the design of pavement bases. In Brazil, the currently adopted mechanistic-empirical method employs cyclic loading tests, such as the determination of the MR, to evaluate the materials that make up pavement layers. Thus, it is essential to properly characterize materials in relation to their MR to assess their suitability for asphalt pavements ( 29 – 33 ).
Although various studies have shown promising results for the application of RGP in pavement layers, the authors identified a knowledge gap in understanding the resilient behavior of cement-treated clayey soil mixed with RGP using RLT tests. The main goal of the study is to evaluate the potential use of RGP as a sustainable substitute for soil stabilization in urban pavement layers. Therefore, an experimental study is conducted involving RLT tests to assess the MR of untreated clay soil, cement-treated clay soil, and clay soil treated with both cement and RGP. The tests are carried out using two different cement dosages and three different RGP dosages, alternately, under modified Proctor energy and submitted to a curing period of 28 days. Subsequently, the MR values were analyzed using two-parameter and three-parameter MR characterization models. Finally, a mechanistic–empirical analysis was performed to evaluate the suitability of the mixtures for use in pavement base layers.
Research Significance
Research into alternative materials to Portland cement is essential in civil engineering because of environmental, economic, and technological issues. Geopolymer is an alternate material composed of a mixture of natural substances, silicate, and alumina, where the process of geopolymerization has developed. The utilization of waste glass powder for soil stabilization has shown as a substantial supply of silica, possessing significant potential for geopolymer cement manufacture, while also addressing environmental issues and facilitating the reintegration of glass waste into the manufacturing cycle ( 34 ).
Only a limited number of authors have addressed MR behavior under repeated loading tests and pavement design. Recent work such as Tabaroei and Bozorgvar ( 35 ) reports improvements in MR for clay–RGP mixtures, without a pavement design context. Yaghoubi et al. ( 36 ) noted that no experimental research has been conducted on the resilient properties of subgrade clay enhanced by the incorporation of recycled glass.
Therefore, comprehensive research on the stress-dependent resilient behavior of soil mixtures stabilized with RGP and applied to pavement design remains sparse in the literature, highlighting a gap that the present study aims to address.
Although RGP has proven substantial potential as a supplementary stabilizing agent in cement-treated clayey soils, adverse effects may be considered. Excessive glass powder content may cause inefficient soil–cement bonding ( 37 ). Furthermore, high additive contents have been linked to degradation under wet–dry cycles and increased moisture susceptibility ( 34 ). The pozzolanic reaction of glass powder is constrained by the availability of calcium hydroxide from cement, leading to reduced mechanical enhancements beyond an optimal dosage ( 38 ).
Mechanistic-empirical pavement design necessitates the successful determination of material parameters that result in estimated pavement responses. To accurately evaluate these parameters, it is crucial to model dynamic traffic loads in laboratory studies ( 39 ). The calibration accuracy of MR model parameters constitutes a critical step toward the mechanistic–empirical pavement design application ( 40 ), mainly in a local region of interest and stabilized soils with residual materials. Islam and Gassman ( 41 ), for instance, discovered that the MR computed from Falling Weight Deflectometer (FWD) testing values predicted less rutting than the laboratory-measured MR. Once calibrated parameters are properly determined, it is possible to predict stiffness, which is essential for performance-based design of pavements.
Experimental Program
The experimental program was divided into three parts. The first stage involved characterization tests of the soil, cement, and RGP. The second stage comprised molding, curing, and testing the specimens, involving RLT and MR prediction models. In the third stage, the useful life of an urban pavement was evaluated using the Multiple Layer Elastic Analysis (AEMC) software. The properties of the materials and the methodology employed are given in the next section.
Materials and Physical Properties
This research used a local clay soil, high early strength Portland cement, RGP, and distilled water. The clay soil (Figure 1a) was collected at coordinates of GPS 26°09′14.6″ S 52°42′26.7″ W by manual excavation in the Pato Branco city, southwest region of the state of Paraná, Brazil. The RGP (Figure 1b) was collected from a glass dealer in Curitiba, Brazil. The RGP utilized in this investigation is a postindustrial waste (sludge) that originates from the water treatment required for flat glass polishing and grinding, and it has no unexpected contaminants. The RGP was oven-dried, entirely ground by a planetary mill for 55 min and sieved in a no. 200 sieve (0.075 mm). Idir et al. ( 38 ) evaluated the pozzolanic activity of residual glass powder with particle sizes varying from 0.04 mm to 2.5 mm and concluded that pozzolanic activity enhanced as the particle size of residual glass powder diminished. Similar findings have been reported in other studies ( 42 , 43 ). Akoğuz ( 44 ) also concluded that wet–dry cycles and freeze–thaw cycles are inversely correlated with waste glass particle size. Then, all RGP material was homogenized.
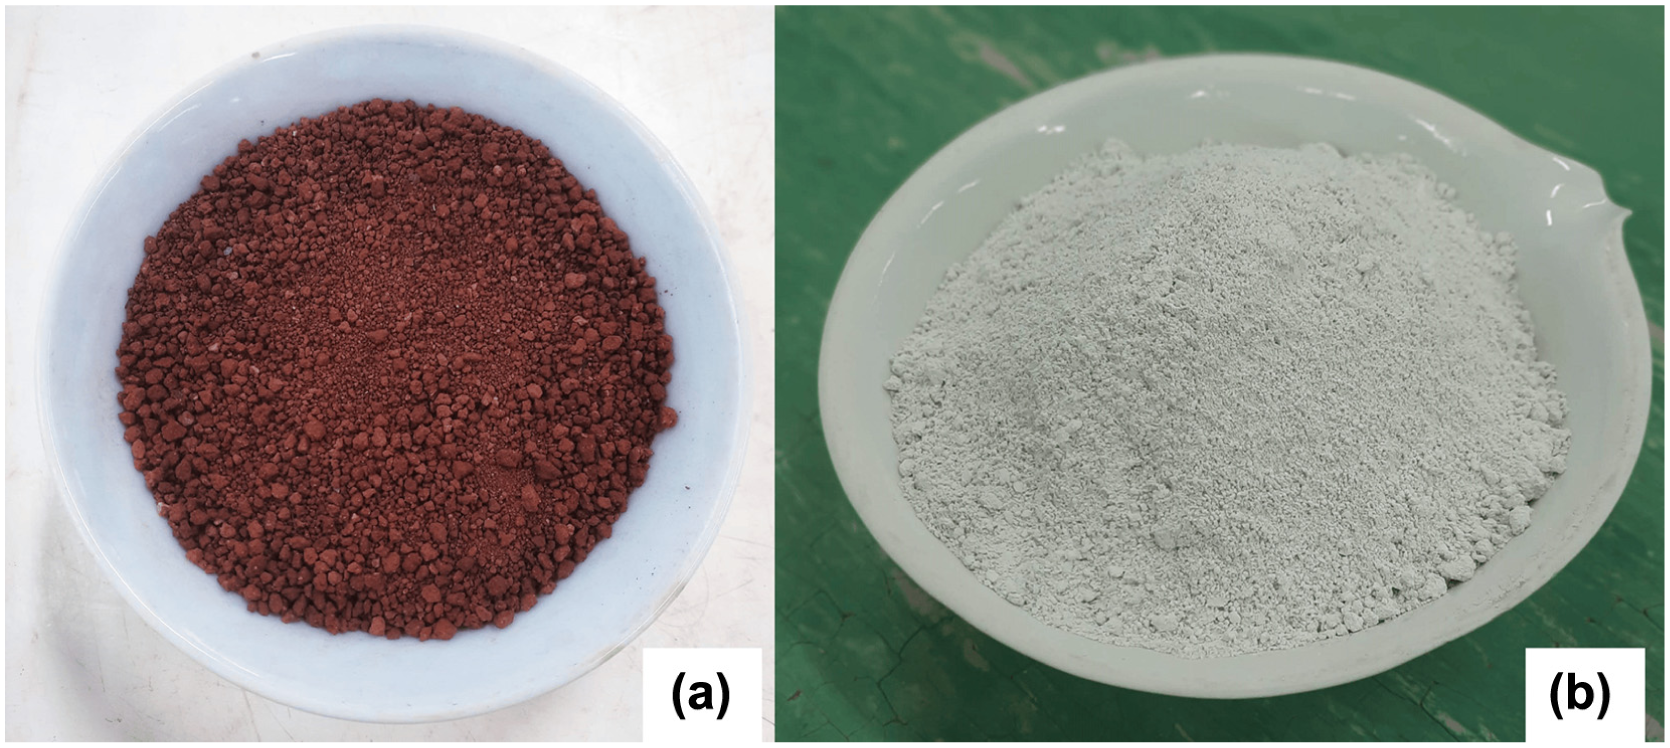
Materials: (a) soil, and (b) recycled glass powder.
The soil was characterized with the following methods: Atterberg limits ( 45 ), specific weight ( 46 ), compaction test ( 47 ), and granulometry analysis ( 48 ), including laser analysis of particles smaller than 0.15 mm. The laser analysis of particle sizes was performed using the Bettersize analyzer type S3 plus. The studies were conducted using purified water.
The particle size distribution of the soil and RGP is shown in Figure 2, approximately 78% of the soil consists of clay (less than 0.002 mm), and 19.3% consists of silt (between 0.002 mm and 0.06 mm). According to the Brazilian fine tropical soils classification ( 49 ), the soil is a lateritic clay (LG’), and, in consonance with the Unified Soil Classification System ( 50 ), an elastic silt (MH).
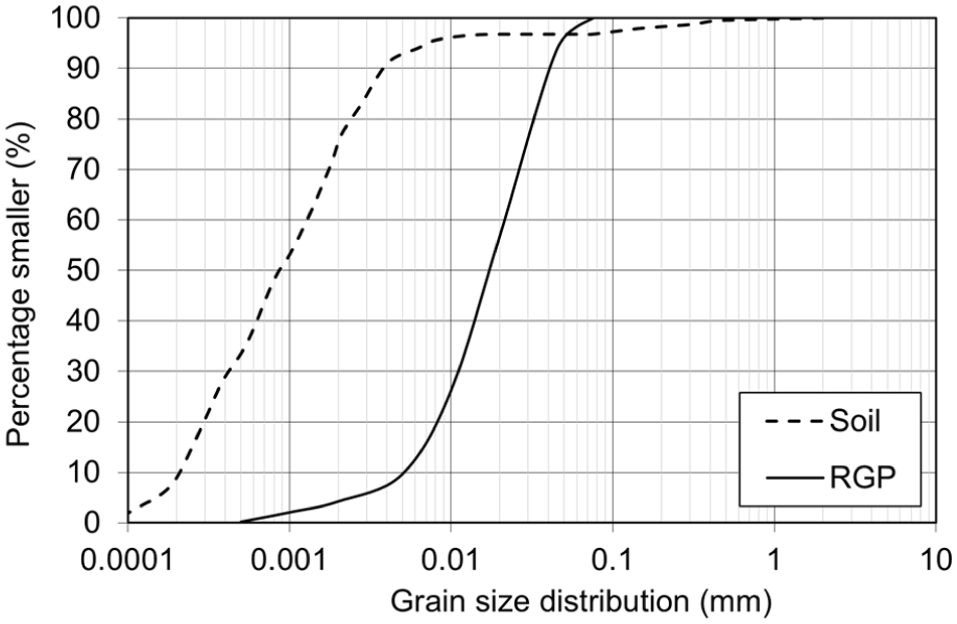
Grain size distribution of soil and RGP.
The soil specific gravity is 2.93 g/cm3 ( 46 ). The liquid limit and plastic limit are 56% and 50%, respectively, with a plastic index of 6. Table 1 displays the X-ray fluorescence (XRF) of soil, cement, and RGP. The soil predominantly contains SiO2 and Al2O3, and the RGP showed silicon dioxide (SiO2) as the main content.
Soil and RGP Properties
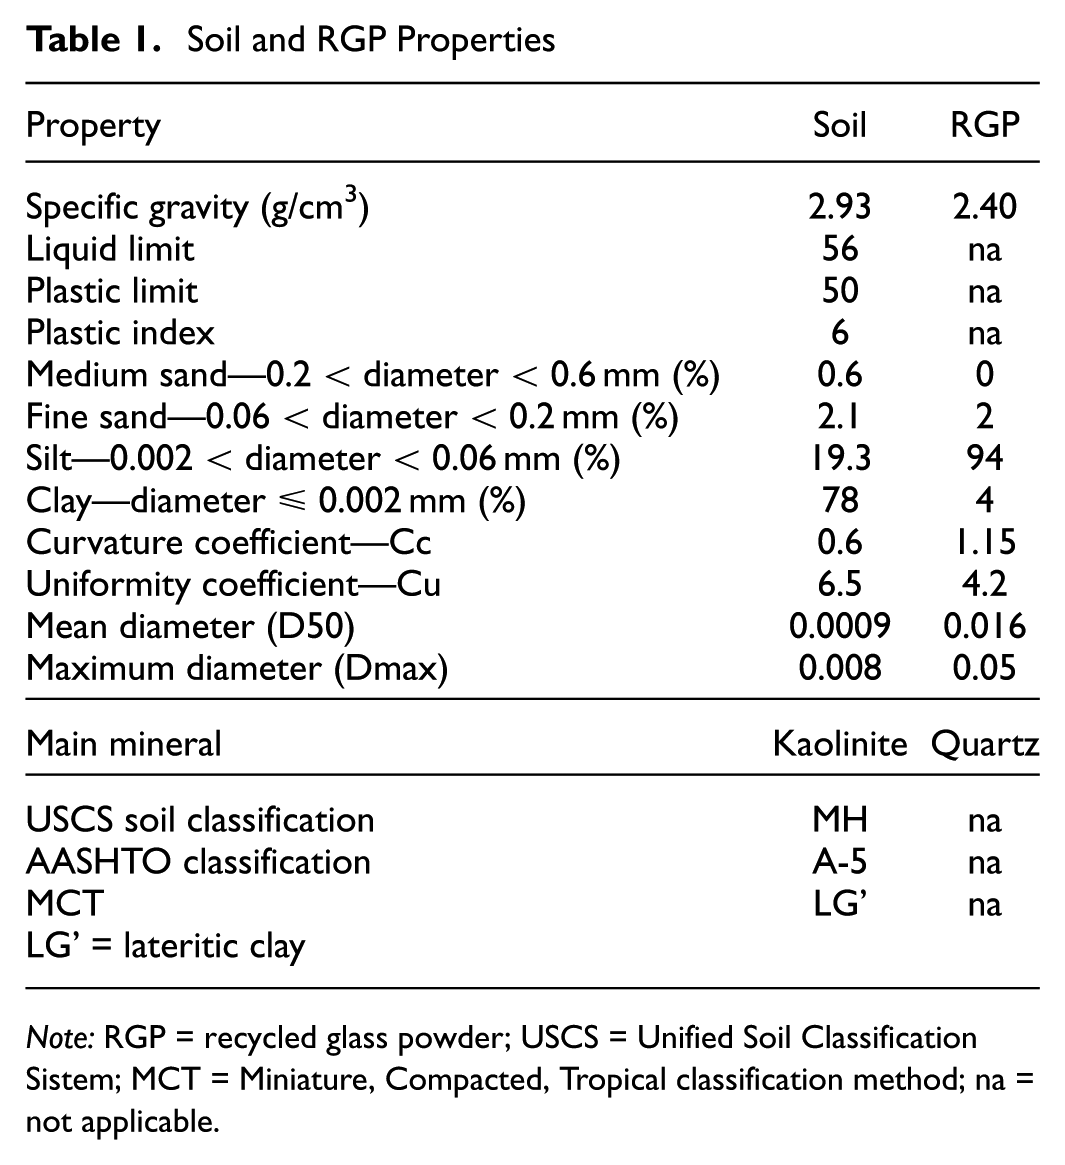
Note: RGP = recycled glass powder; USCS = Unified Soil Classification Sistem; MCT = Miniature, Compacted, Tropical classification method; na = not applicable.
Soil, RGP, and Cement Chemical Compositions
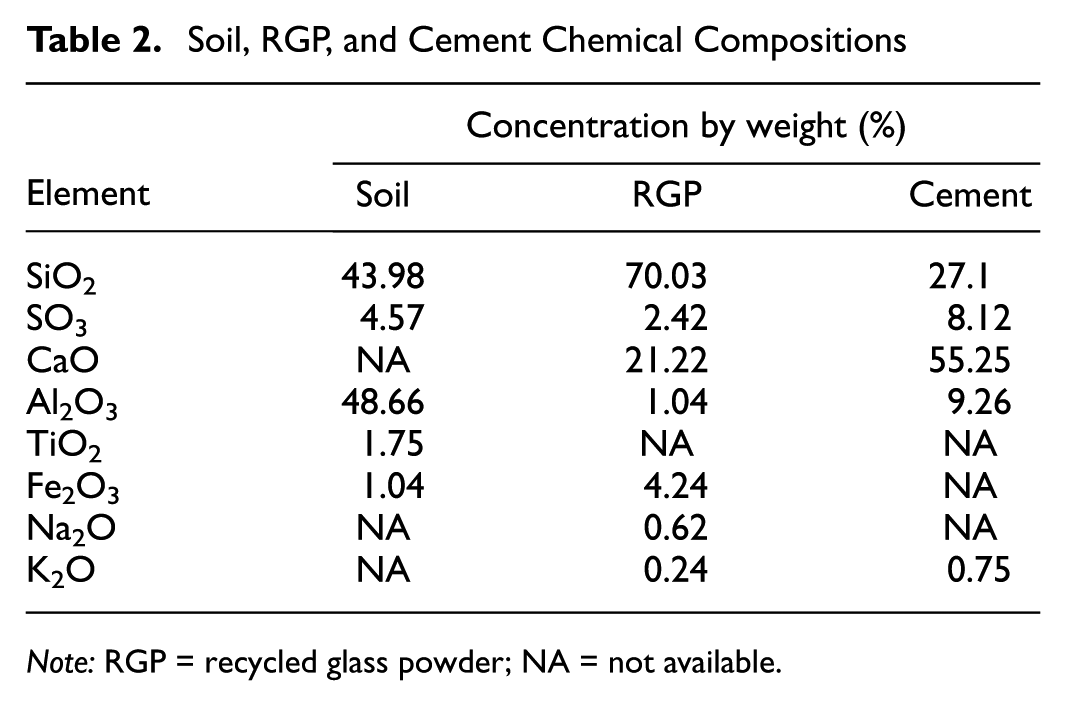
Note: RGP = recycled glass powder; NA = not available.
The X-ray diffractometry (XRD) of the RGP is shown in Figure 3, and it has identified a high presence of a noncrystalline amorphous halo.
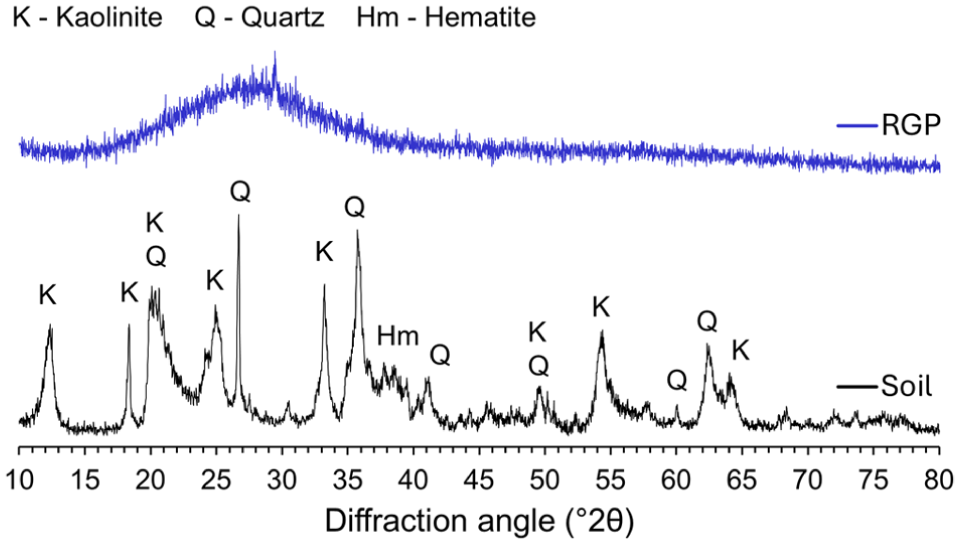
X-ray diffractometry of soil and RGP.
According to the XRD and XRF analyses of raw materials, the soil is rich in SiO2 and Al2O3, providing a source of reactive silica and alumina. The reaction between CaO from cement and reactive SiO2/Al2 is expected to promote the formation of cementitious compounds such as calcium aluminate hydrates ( 51 ). Studies have demonstrated that pozzolanic reaction increases the MR of fine-grained soils, and stabilized soils exhibit higher stiffness and a transition from stress-softening to stress-hardening behavior ( 52 , 53 ).
A high early strength Portland cement (CPV in Brazil and type PC III in the USA) produced and sold in southern Brazil was used for the study, composed principally of calcium oxide (CaO) and silicon dioxide (SiO2) (Table 2). The cement specific gravity is 3.09 g/cm3. High early strength cement was selected to ensure adequate calcium hydroxide availability and alkaline activation conditions for the RGP, since RGP is a slow reacting pozzolan ( 54 ). The higher C3S content and finer particle size of this cement enhance early Ca(OH)2 production, promoting silica dissolution and secondary C–S–H formation ( 55 ) within the 28-day curing period adopted.
Mixtures Preparation
The quantities of cement and RGP were calculated concerning the mass of dry soil. MR tests were initially performed on pure soil samples compacted in three efforts: standard effort ( 56 ), intermediate effort ( 57 ), and modified effort ( 47 ). The intermediate effort is a compaction energy level between the Standard Proctor and Modified Proctor tests and corresponds approximately to twice the standard effort and half of the modified effort. The intermediate compaction effort is largely adopted in Brazilian geotechnical practice because it more realistically represents the compaction conditions in road subgrades and stabilized soil layers, especially in tropical and lateritic soils ( 57 , 58 ). The soil–cement mixtures were molded with 3%, 6%, and 9% of cement in modified compaction efforts, and the MR tests were realized after a 28-day curing period.
The compaction curves for the soil and soil–cement mixtures are depicted in Figure 4a. The compaction curves after immediate mixing indicate that the addition of cement decreased maximum dry density (ρ dmax ) and increased the optimal moisture content (w op ). The presence of montmorillonite minerals in the soil primarily induces higher plasticity. Because of the charge deficiency in the crystal structure, cations are drawn to the cleavage surfaces to neutralize the negative charge. The initial cation exchange and flocculation processes take place. The cations are hydrated with water and are drawn to the surface of the clay along with water molecules, creating a porous double layer, consequently, the clay becomes plastic when the cation responsible for the neutralization is monovalent ( 59 ).
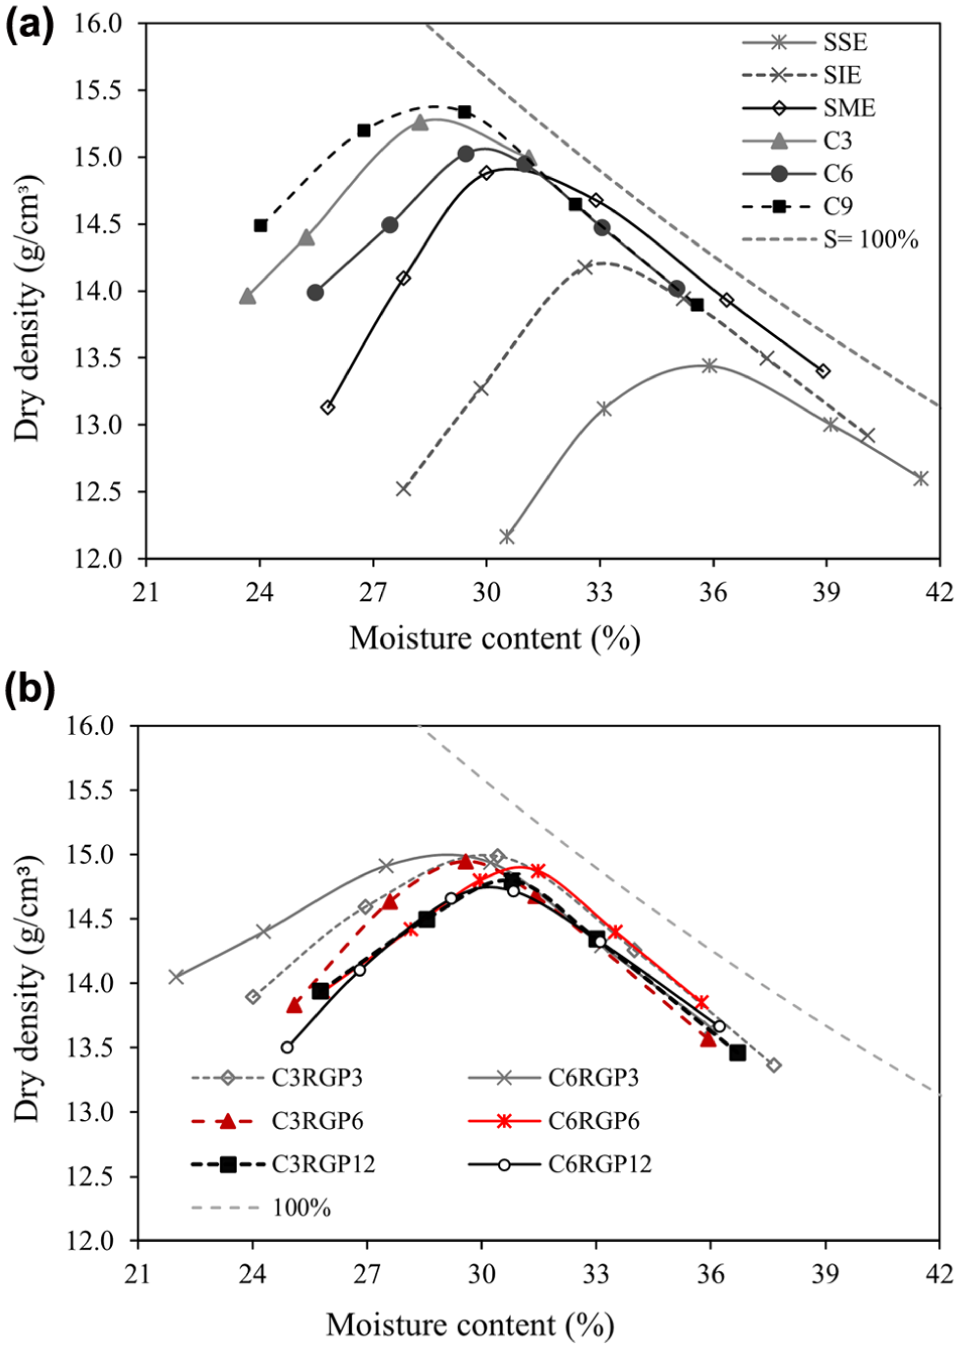
Compaction curves: (a) soil and soil–cement mixtures and (b) soil–cement–RGP mixtures.
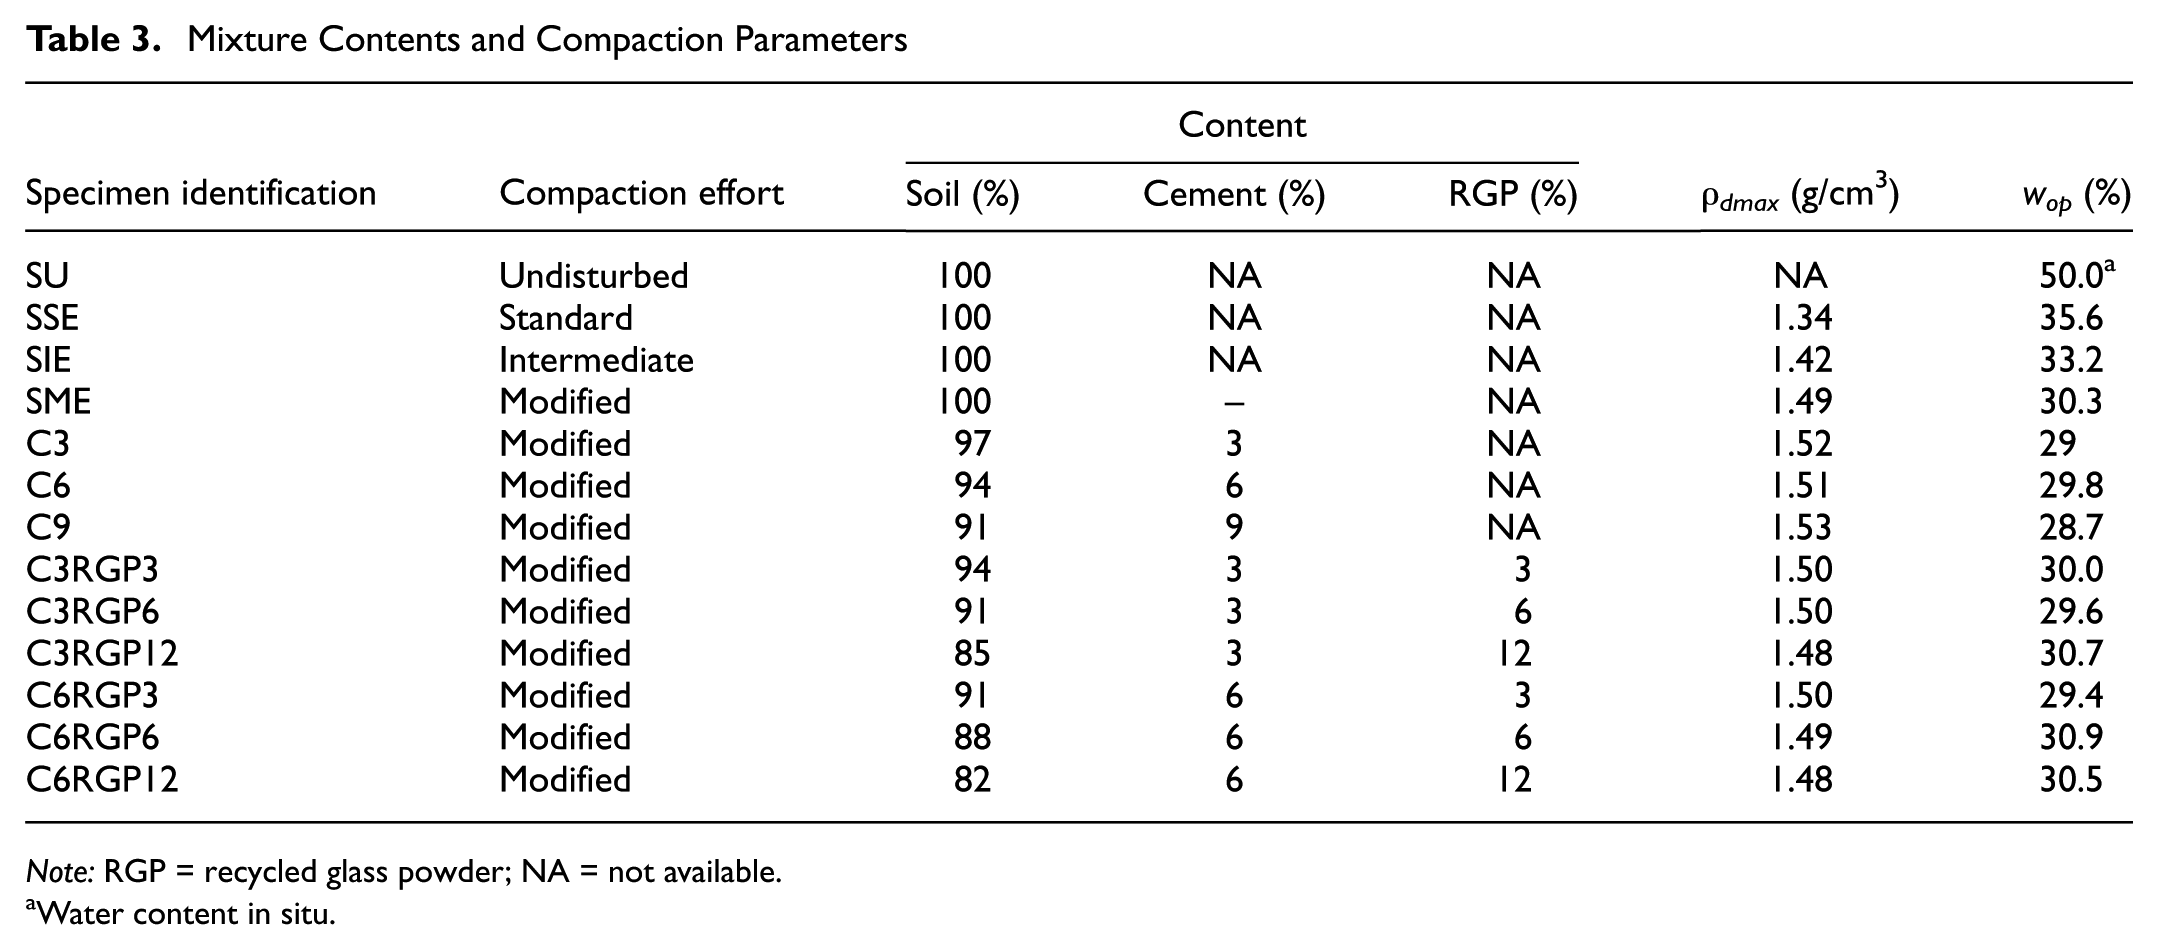
The percentages of 3%, 6%, and 12% of residue glass powder were used in the soil–cement–RGP mixtures, as presented in Table 3. Studies indicate that the ideal glass powder content frequently lies between 5% and 8% on geopolimerization ( 44 , 60 ), with the incremental gains in mechanical performance becoming progressively smaller beyond that. The 12% of glass powder captures the postoptimum behavior. The soil–cement–RGP combinations considered contents of 3% and 6% of cement, and the 9% of cement already provides a significant improvement ( 61 ). The RGP was conceived in this study primarily as a partial substitute for cement rather than as an additional stabilizing agent. From a practical perspective, stabilization strategies are typically optimized to achieve adequate mechanical performance with the lowest feasible binder content ( 62 ).
Mixture Contents and Compaction Parameters
Note: RGP = recycled glass powder; NA = not available.
Water content in situ.
The experiments were conducted using modified compaction efforts after a 28-day curing period. The compaction curves for the mixtures are depicted in Figure 4b. The optimal moisture content (w op ) and maximum dry density (ρ dmax ) for the pure soil, cement-treated soil, and cement–RGP-treated soil are shown in Table 3. The addition of RGP demonstrated a lower reduction in maximum dry density (ρ dmax ) and increased the optimal moisture content (w op ). The RGP particles act as fine aggregates of fillers and reduce the clay fraction, therefore, achieving better packing, lower plasticity, and lower swelling index ( 63 ).
Concerning molding the specimens (measuring 200 ± 3 mm in height and 100 ± 2 mm in diameter), moisture content, dimensions, and mass were checked, respecting the optimum moisture content of ± 1.0% and degree of compaction of 100 ± 2%. Subsequently, all specimens were wrapped in transparent plastic and stored in a humid chamber at a temperature of 23ºC ± 2. With the exception of the three undisturbed specimens, four were molded for each condition, resulting in 51 specimens.
Test Method for Resilient Modulus
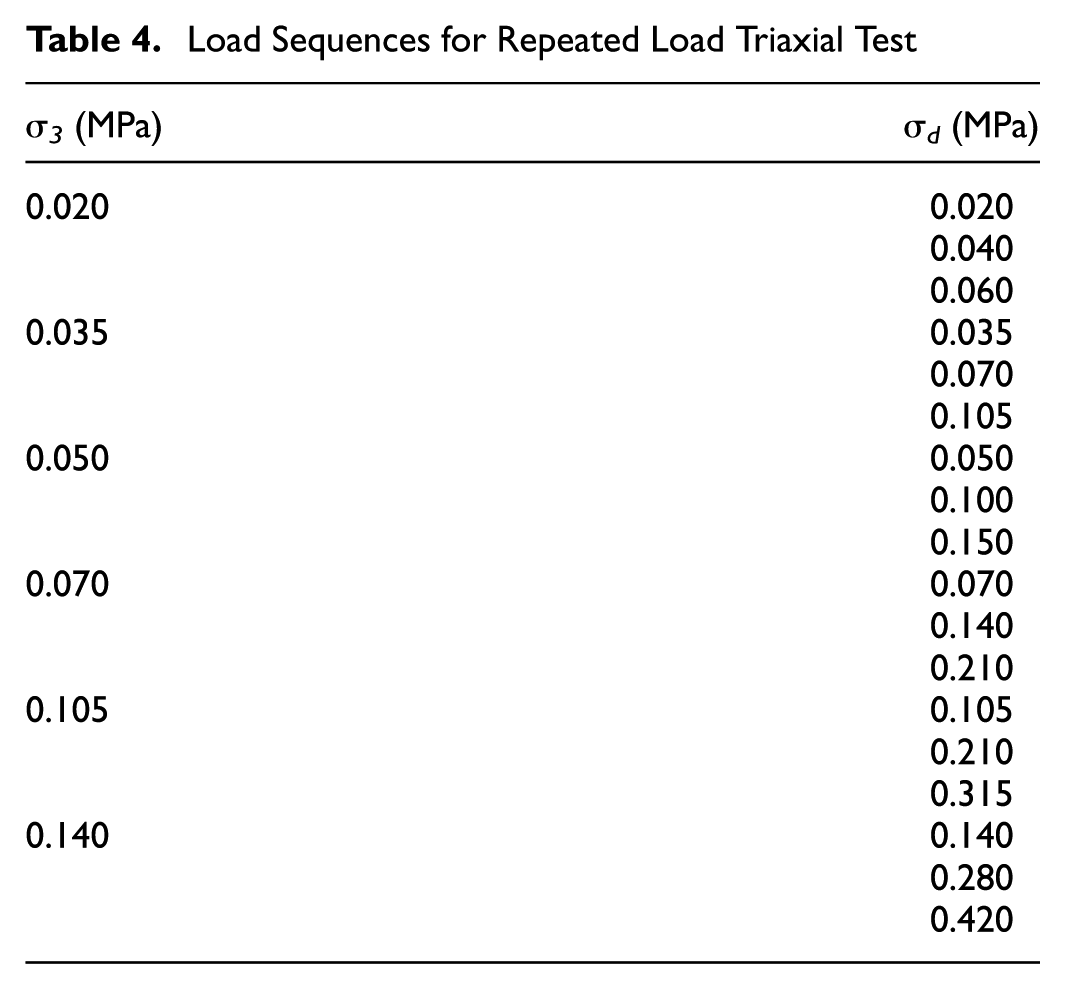
The MR test utilized the Geocomp Loadtrac II apparatus to apply a cyclic haversine-shaped load for 0.1 s, followed by a 0.9-second rest period (1 Hz). The independent load cell has a capacity of 8.896 kN (2.000 lbf). Two linear variable differential transformers (LVDT) mounted on the outside of the test chamber, on opposite sides and equally spaced from the piston, were used to measure the displacements. The maximum measured length of both LVDTs is 19.0 mm (3.15 in.). All 18 stress conditions were subjected to a minimum of 10 loading cycles, and a set of five minimum measurements was acquired, with a maximum difference of 5% among them. The method is in accordance with the Department of Transport Infrastructure ( 64 ) local standard. The test started with the conditioning phase and then moved on to the MR for each sequence listed in Table 4.
Load Sequences for Repeated Load Triaxial Test
The AASHTO design reference for flexible pavement suggests several MR characterization models to analyze the MR results ( 28 ). Equations 1 to 5 are models commonly used since they are models suggested by the AASHTO standard and other authors for tropical or fine and cohesive soils ( 58 , 65 – 68 ), except the Hicks model ( 69 ) for granular materials. Equations 1 to 5 were applied in this investigation since the soil is fine and cohesive (Table 5). The equations are based on the deviatoric stress (σ d ), the confining stress (σ 3 ), both (σ 3 ) and (σ d ) simultaneously, the bulk stress (Ø), and bulk stress and octahedral shear stress (τ oct ). The five MR models are often cited in the literature ( 35 , 70 – 72 ). Awed et al. ( 73 ) assert that these models are critical for analytical and mechanistic pavement structural design methodologies.
Equations of MR for Fine and Cohesive Soils
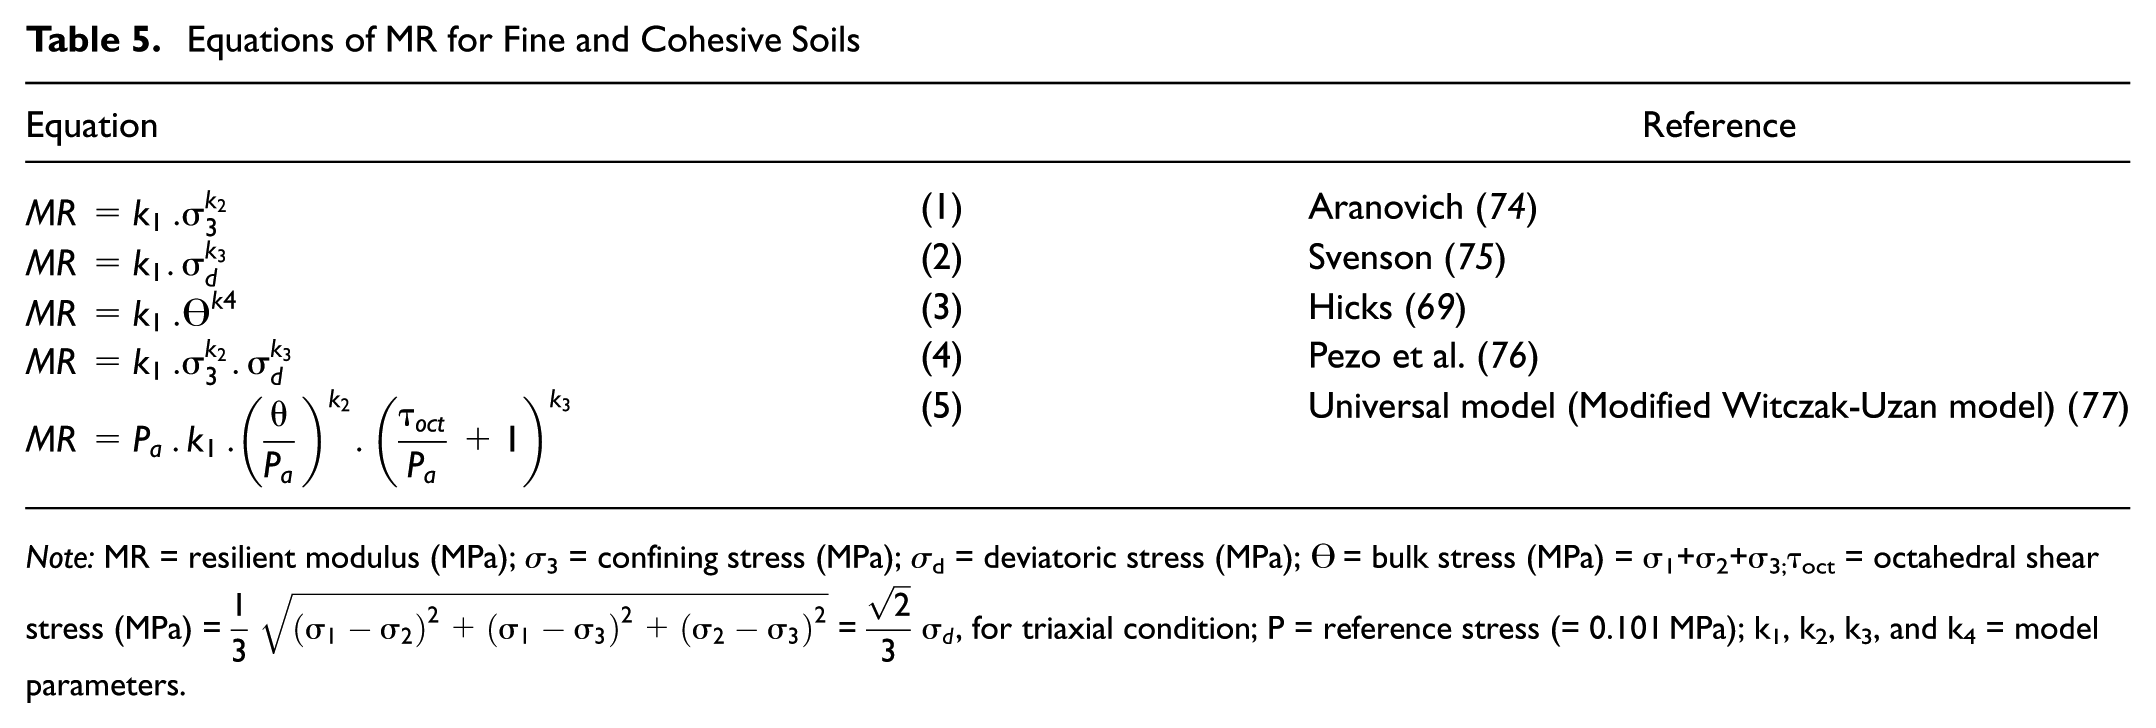
Note: MR = resilient modulus (MPa); σ3 = confining stress (MPa); σd = deviatoric stress (MPa);
Structure Pavement and Stress–Strain Analysis
A reference pavement structure was defined to evaluate the effects of soil stabilization with cement and glass powder residue in base and subbase layers. The pavement characterization followed a local standard ( 78 ) to simulate a typical local urban road with average traffic conditions. The parameters defined were the number of repetitions (Nproject) under a standard axle load of 8,200 kgf, which is equal to 5 × 10⁵ and 10 years of design life.
The thickness of each layer is presented in Figure 5. The pavement structure comprises a 2.5 cm thick surface coating layer using a double bituminous surface treatment. The subgrade material is the pure soil at standard effort compaction, commonly used in subgrade layers because of its low stress subjected. The subbase and base followed the data materials in this research.
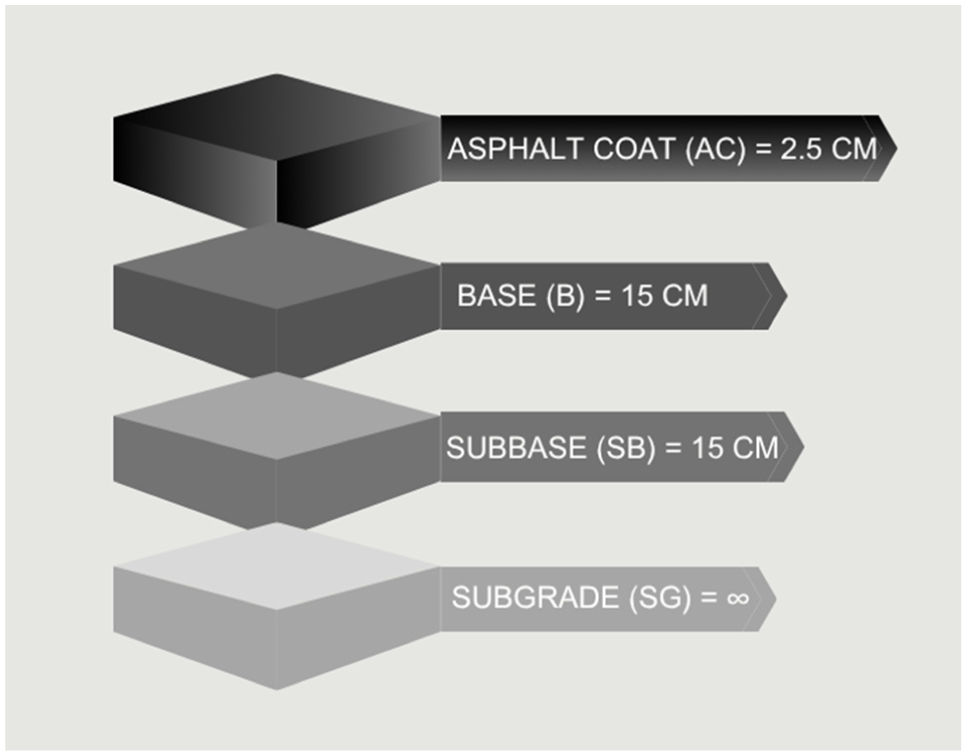
Side view of a pavement structure.
The AEMC software, version 2.4.6 ( 79 ), is an elastic analysis method developed to obtain results at any point in the structure, making it possible to verify adhesion conditions or not at the layer interface. The structural responses calculated from the elastic Equations include vertical, radial, tangential, and shear stresses in the vertical–radial plane and vertical and radial deflections ( 80 ). Pavement analysis using programs based on the multilayer elastic theory requires fewer resources and is a simple methodology ( 81 ). For this study, the following parameters were assumed in the AEMC software for the standard road axle: application of a tire pressure of 0.56 MPa, representing a standard axle wheel load of 8.2 tons, an operating radius of 10.8 cm, and an unbonded contact between the layers ( 82 , 83 ).
For the surface asphalt coat, the MR values of 1,500 MPa and Poisson’s ratio of 0.30 were established. These values were applied for all combinations evaluated. The coefficients (k 1 , k 2 , k 3 , and k 4 ) used in the subgrade, subbase, and base layers are all based on the results in this research. The subgrade material is the pure soil at standard effort compaction, commonly used in subgrade layers. A Poisson’s ratio of 0.35 was used in the mixtures of the subbase and base layers, while the subgrade received a Poisson’s ratio of 0.40.
The analysis was performed between and under axle wheels, specifically at points X, X′, Y, Y′, W, and W′ (Figure 6), to obtain values of top lining displacement (δ), horizontal tensile strain at the bottom of the coat (ε h ), and vertical strain at the top of the subgrade (ε v ).
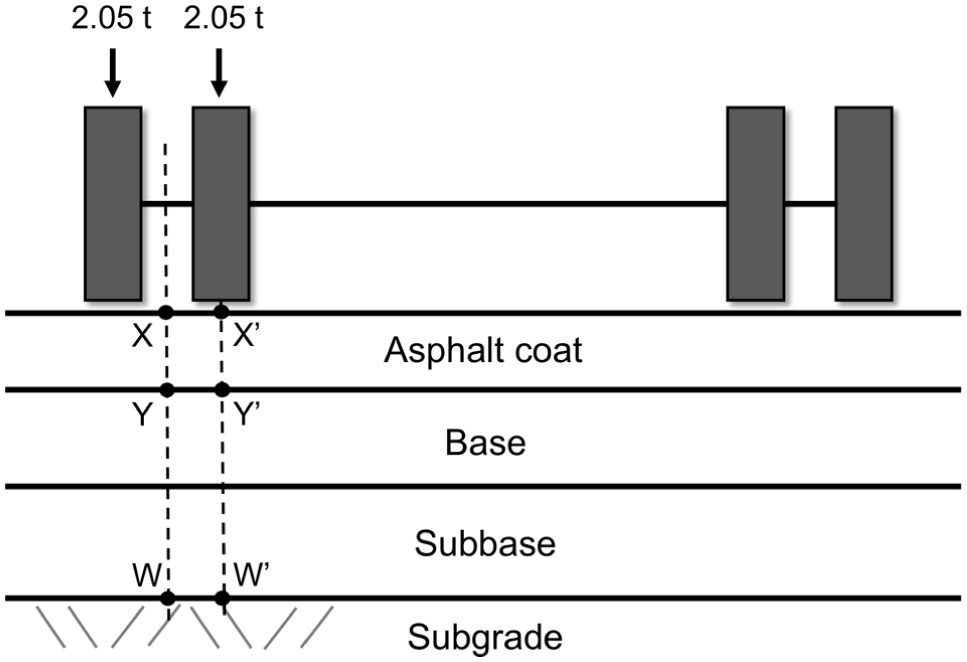
Load application positions for stress/strain evaluation.
The equivalent single-axle dual wheel weighing 8.2 tons was calculated to determine the cumulative critical value. Then, the design period (N project ) is defined as expected to support the critical value.
The number N was obtained along with Equations 6 to 8. Parameters k and n were obtained from fatigue tests of asphalt mixtures.
On the coat ( 85 ):

where
N tr : N predicted at the top of the asphalt coat until fatigue failure;
δ: Vertical displacement (mm) at the top of the asphalt coat;
k = 3.01 and n = 0.176: Coefficients obtained from fatigue tests of asphalt mixtures.
For the coat’s lowest fiber ( 86 ):

where
N ir : N predicted at the lowest fiber of the coat;
ε t = ε tr : horizontal tensile-specific deformation for the coat layer;
k = 1.092 × 10⁻⁶ e n = 3.512: coefficients obtained from fatigue tests of asphalt mixtures.
For the subgrade upper line ( 86 )

where
N sg : N predicted for the subgrade upper line;
ε v : specific vertical compressive strain at the top of the subgrade;
k = 6.069 × 10⁻¹⁰ e n = 4.762: coefficients derived using linear regressions, specific to each type of asphalt mix, and adapted to reflect field performance.
Cost Performance Analysis
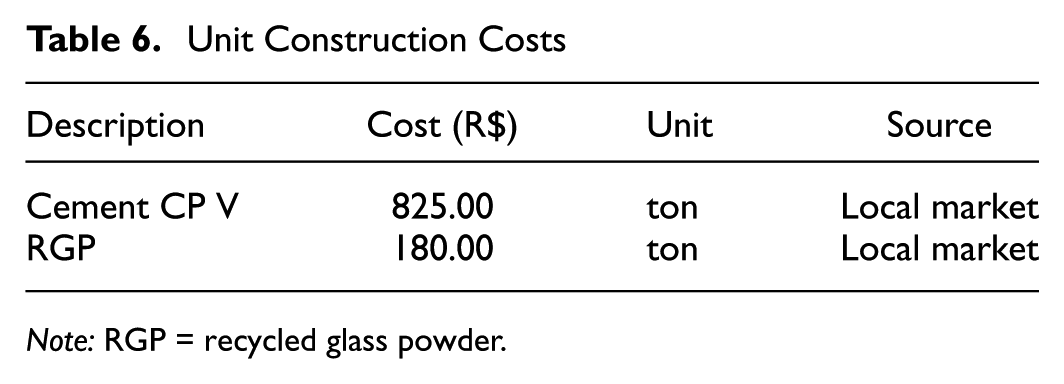
The cost analysis considered only the incremental cost associated with additive incorporation in the base layer. Unit costs of high early strength cement and RGP were obtained from the local construction market (Table 6). The mixtures were compared based on service life, additive cost per square meter, and cost efficiency index. The additive cost per square meter of pavement was calculated as

where
C material : unit cost per mass of additive;
t: layer thickness;
ρ dmax = mixture maximum dry density.
In addition to evaluate economic efficiency, a cost-performance indicator was defined as the ratio between additive cost per square meter and predicted service life.
Unit Construction Costs
Note: RGP = recycled glass powder.
Results and Discussions
Influence of Cement and RGP on MR Results
The stress dependency of MR results was reorganized in Figures 7 to 9, as average MR values plotted against confining pressure for fixed stress ratios (σ 1 /σ 3 ). Each point represents the mean value obtained from four replicate specimens (except undisturbed samples, three replicates), and the corresponding error bars indicate one standard deviation. The regression curves were fitted using a power-law function.
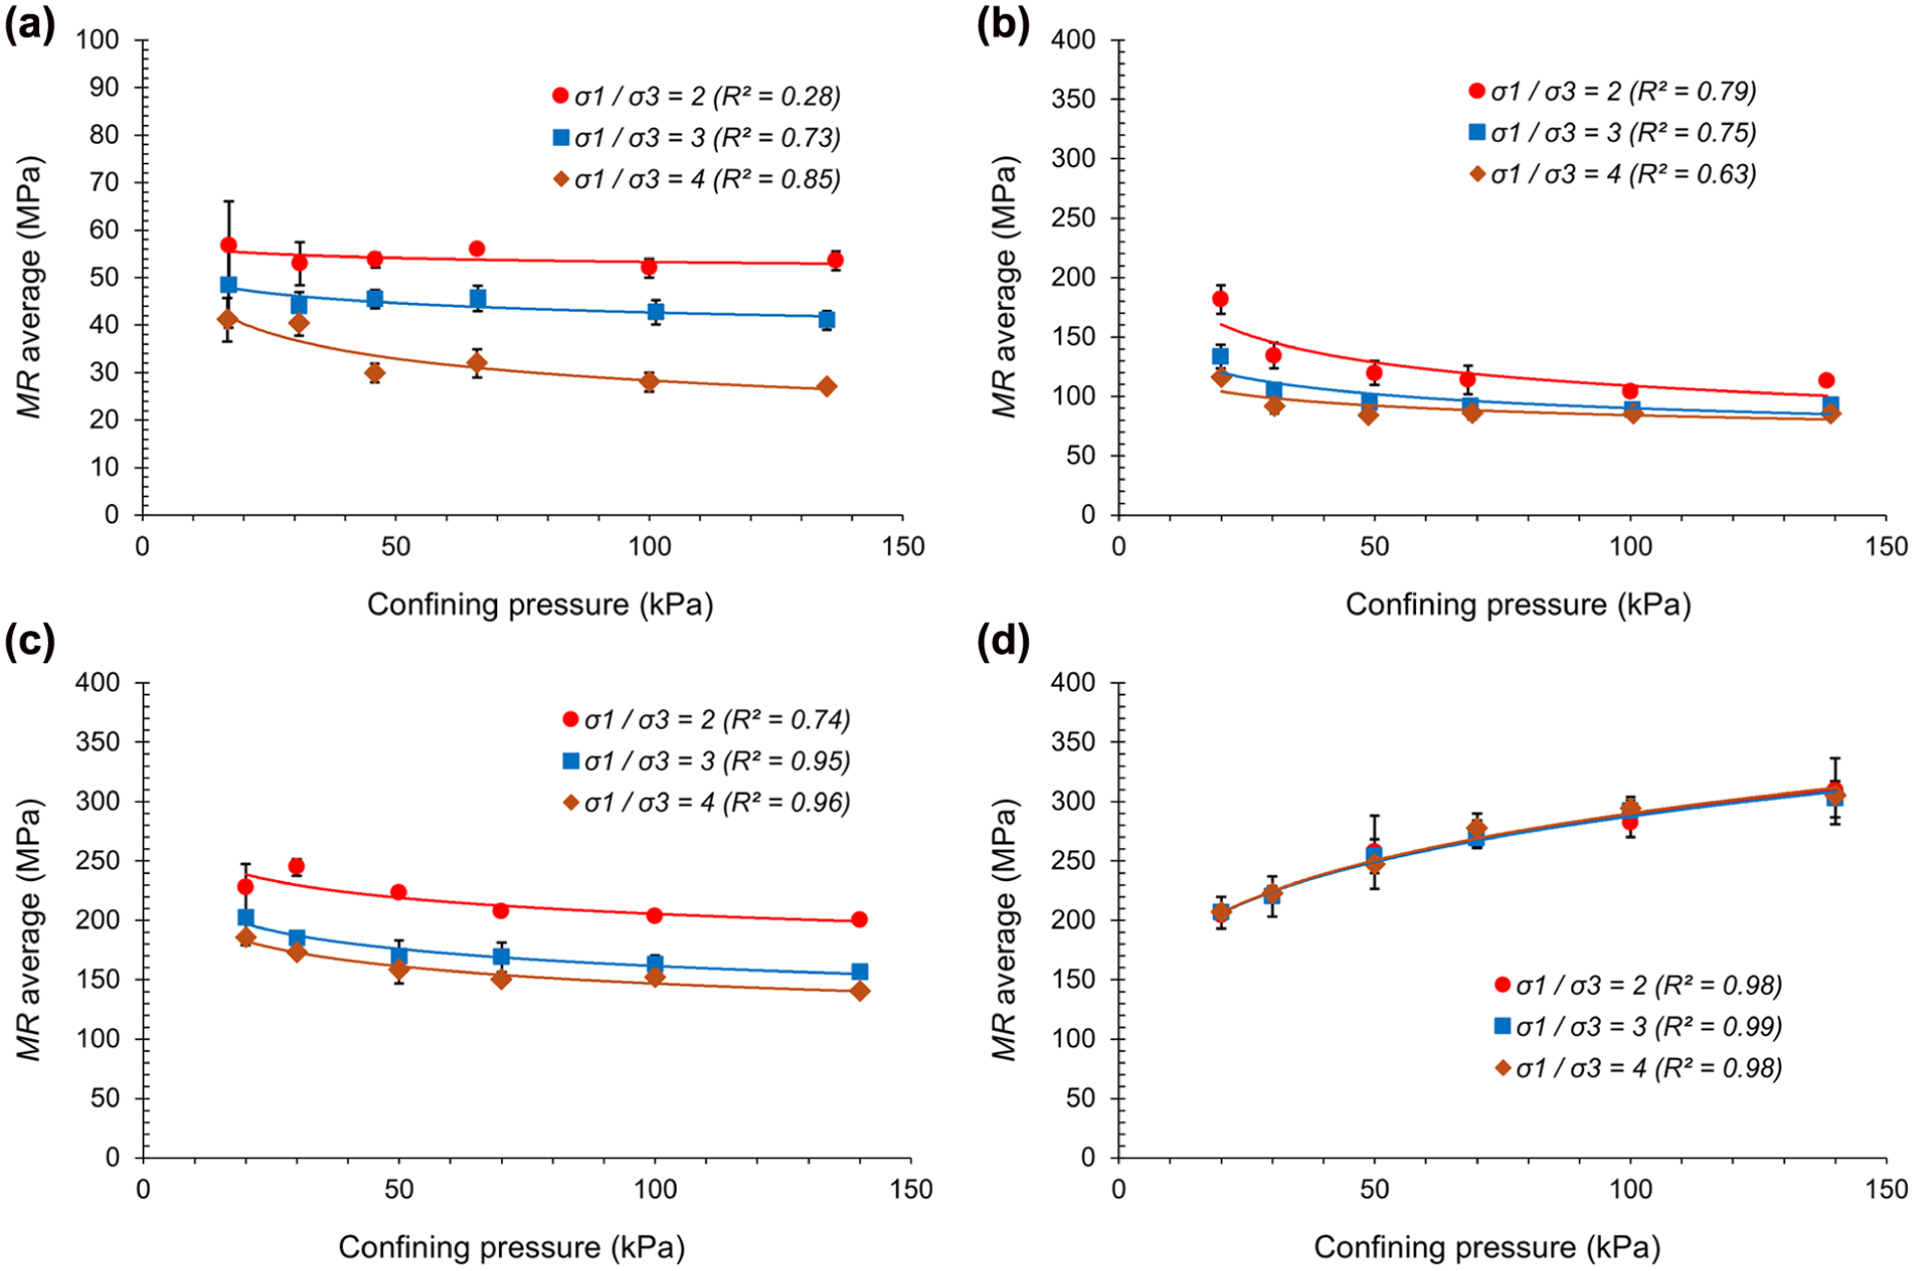
MR values versus confining pressure for fixed stress ratios (σ1/σ3) of pure soil: (a) undisturbed sample, at (b) standard effort, (c) intermediate effort, and (d) modified effort compaction.
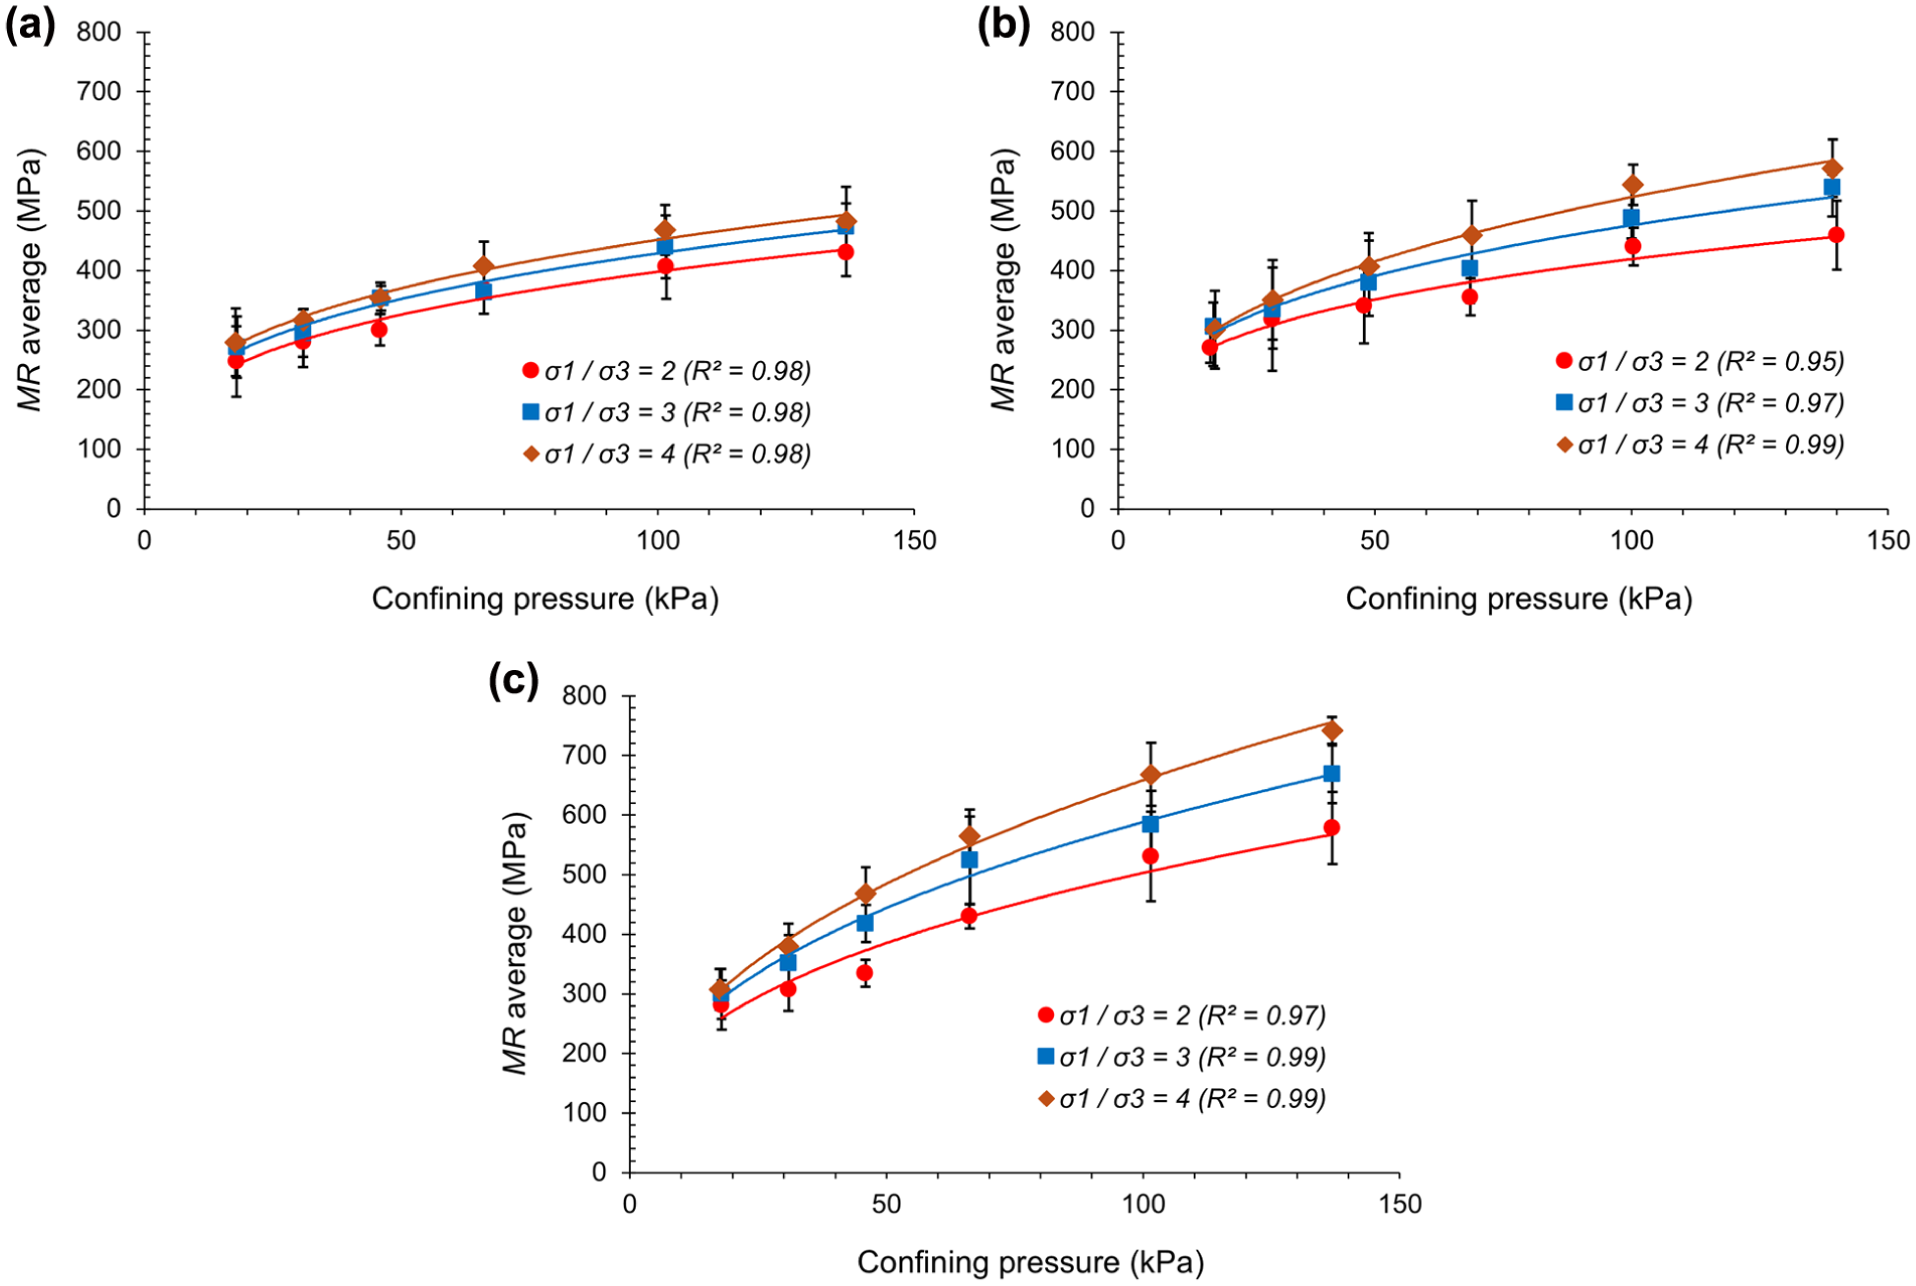
MR values versus confining pressure for fixed stress ratios (σ1/σ3) of cement-treated soil samples at contents of: (a) 3%, (b) 6%, and (c) 9%.
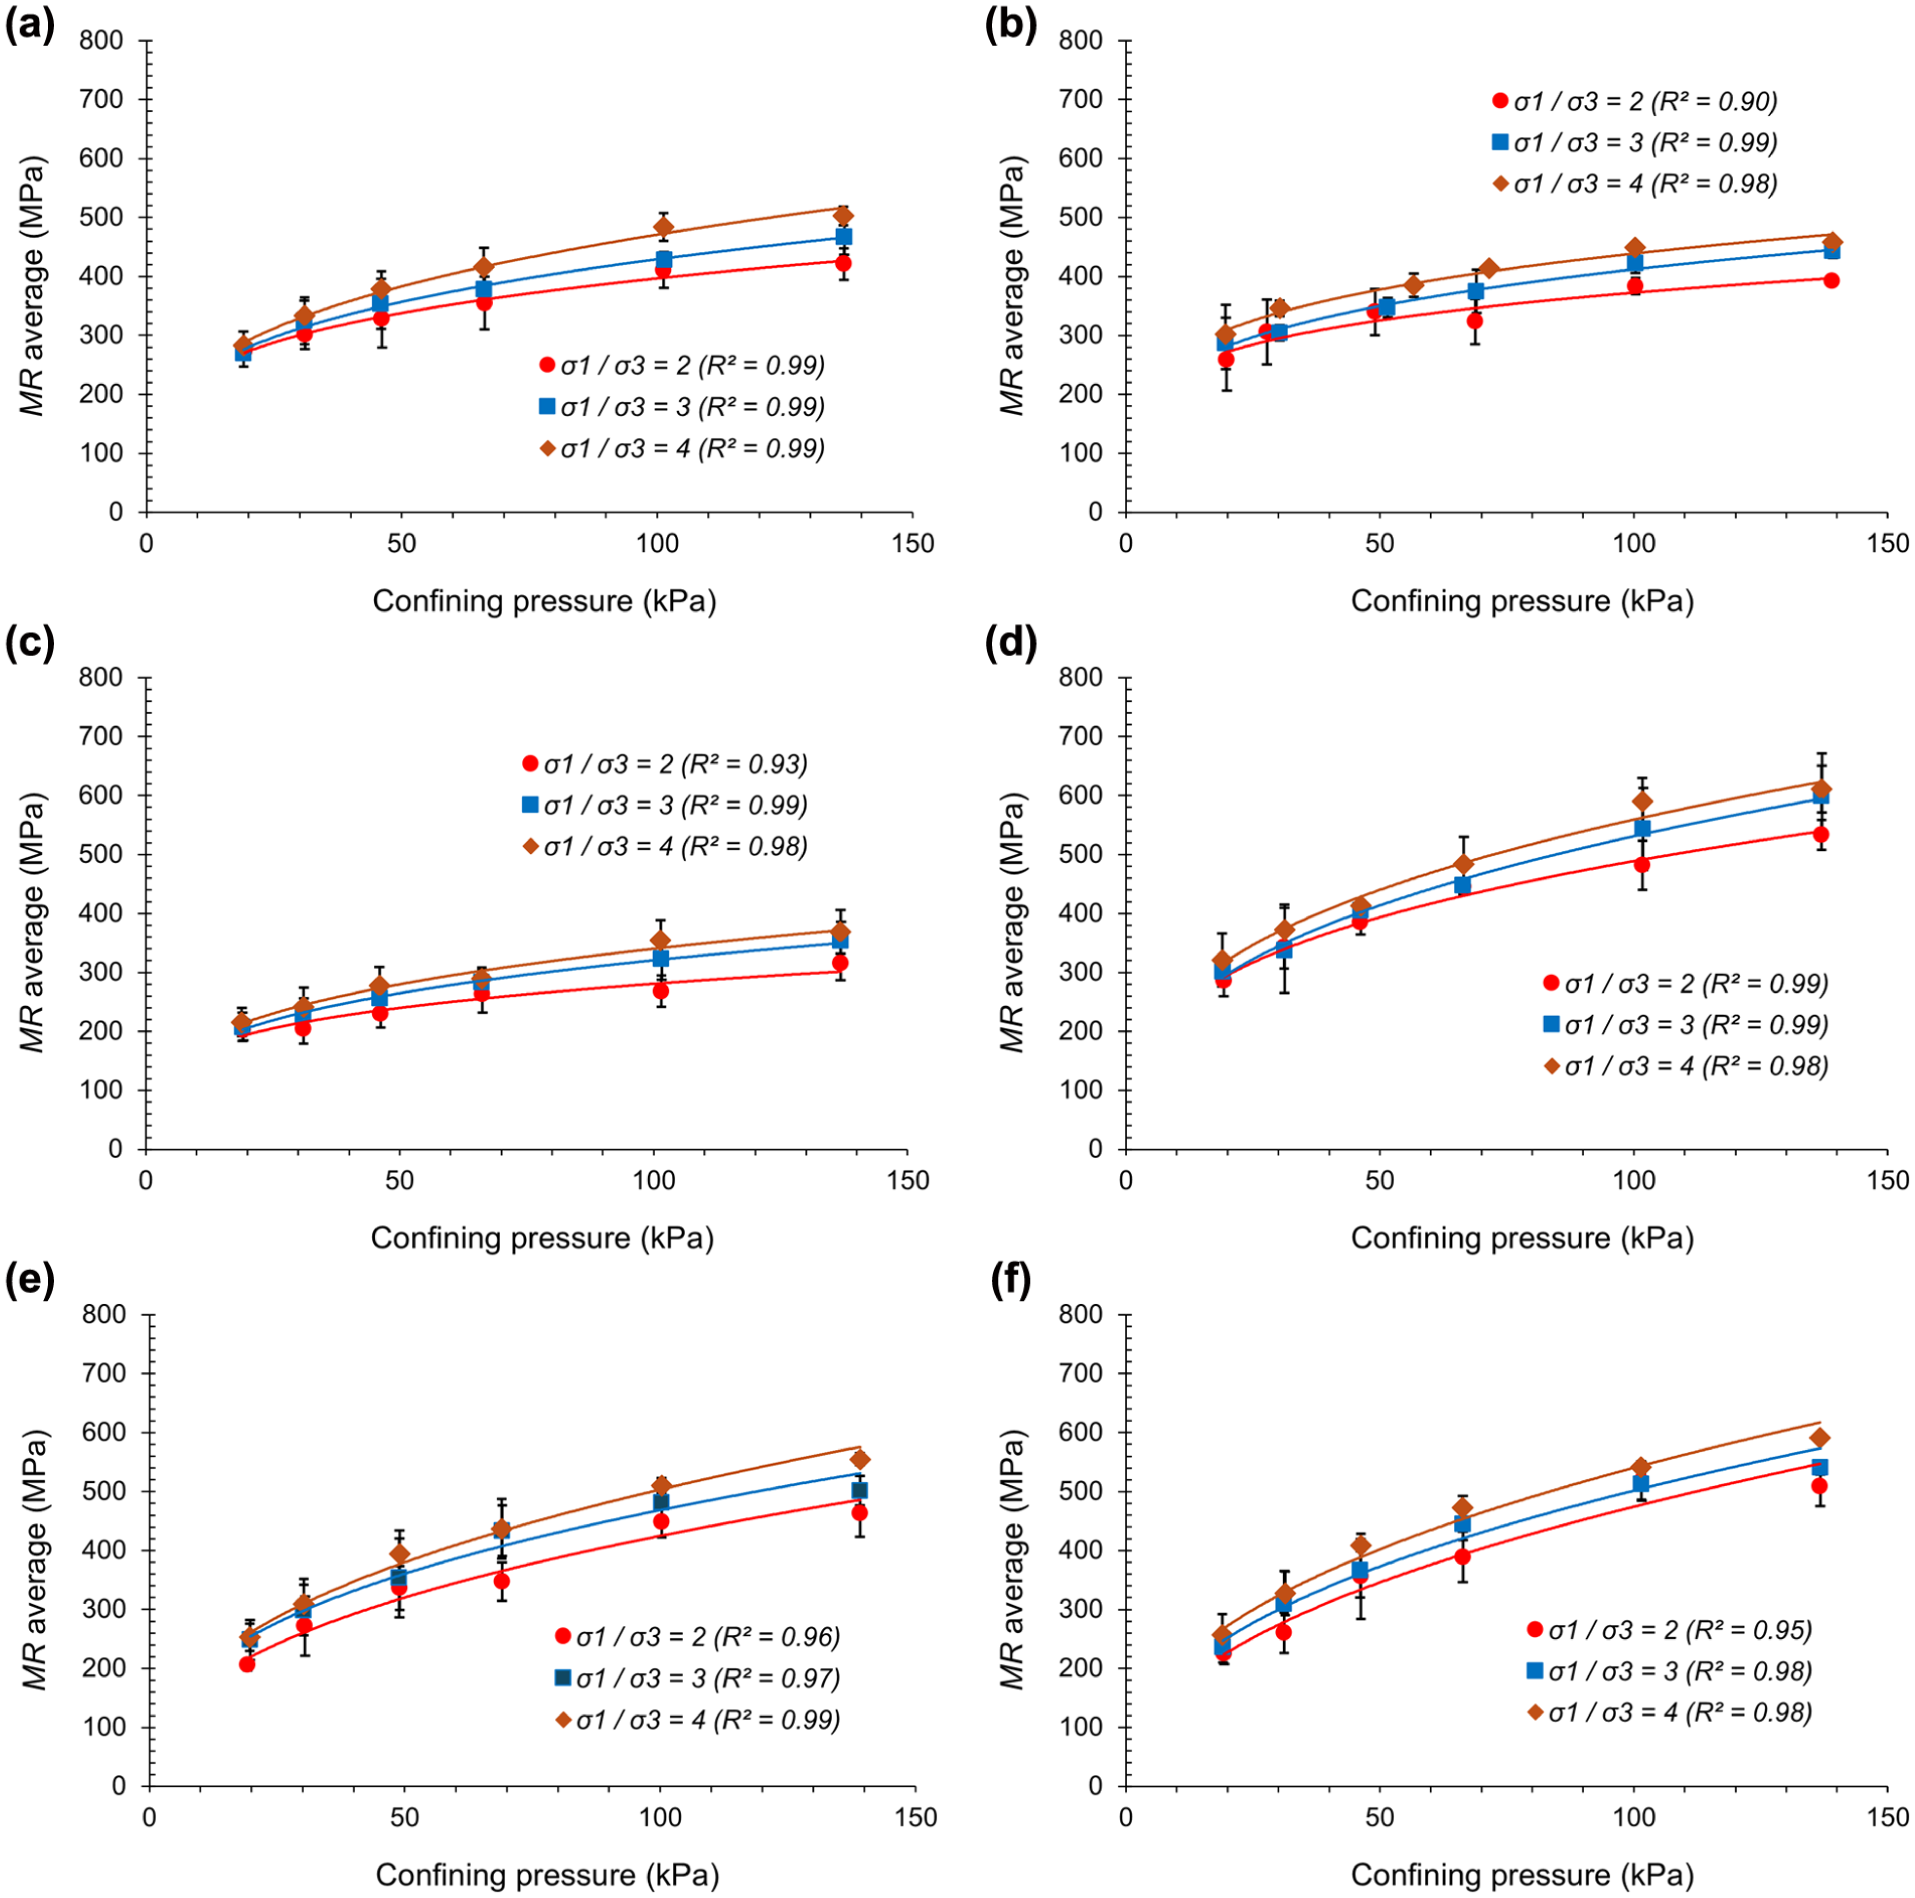
MR values versus confining pressure for fixed stress ratios (σ1/σ3) of cement-RGP-treated soil samples at contents of: (a) 3%–3%, (b) 3%–6%, (c) 3%–12%, (d) 6%–3%, (e) 6%–6%, and (f) 6%–12%.
The undisturbed specimens exhibited the lowest MR results and high sensitivity to stress ratio, reflecting the influence of their natural fabric and higher void ratio (Figure 7a). Progressive increases in compaction effort led to significant gains in MR and repeatability, suggesting particle interlocking. While the standard effort and intermediate effort compaction showed a decreasing trend of MR with increasing confinement pressure under constant stress ratios, the modified effort condition displayed MR modulus increasing as confining pressure increased (Figure 7d).
The cement-treated mixtures exhibited an increase in MR with increasing confining pressure, contrasting with the behavior observed for the untreated soil at undisturbed condition, standard effort, and intermediate effort compaction. As cement content increased from 3% to 9%, both the baseline MR and the confinement sensitivity increased substantially, reflecting progressive development of the cementitious matrix. Unlike untreated samples, in the cement-treated samples, higher stress ratios resulted in greater MR values, suggesting that the bonded structure effectively resists shear-induced degradation and transitions the material response from friction-dominated to matrix-controlled behavior. The high coefficients of determination (R2≈ 0.95–0.99) demonstrated the stability and predictability of the stress-dependent behavior of the cement-treated soils.
For the cement-RPG-treated compositions, MR increased with confinement, indicating stress-hardening behavior typical of partially bonded geomaterials. High stress ratios also consistently resulted in higher MR values. Increasing cement content from 3% to 6% produced an upward shift in MR values, reflecting progressive development of the cementitious matrix. Nevertheless, the results indicated that RGP acts primarily as a supplementary cementitious material, enhancing but not replacing the structural role of cement. The high coefficients of determination (R2≈ 0.95–0.99) confirmed the stability and predictability of the stress-dependent response of the treated mixtures.
Influence of Cement and RGP on MR Models
The parameters k 1 , k 2 , k 3 , and k 4 of the highest coefficient R 2 , and the mean of the undisturbed specimens are presented in Table 7. In every specimen tested, the composite model (Equation 4) resulted in the highest coefficient R 2 . The composite model confirms the nonlinear behavior with confining pressure and deviatoric stress. For the composite model, the undisturbed specimens obtained a parameter k 1 equal to 47.92, parameter k 2 equal to 0.25, and parameter k 3 equal to -0.3.
MR Parameters Obtained from Undisturbed Soil
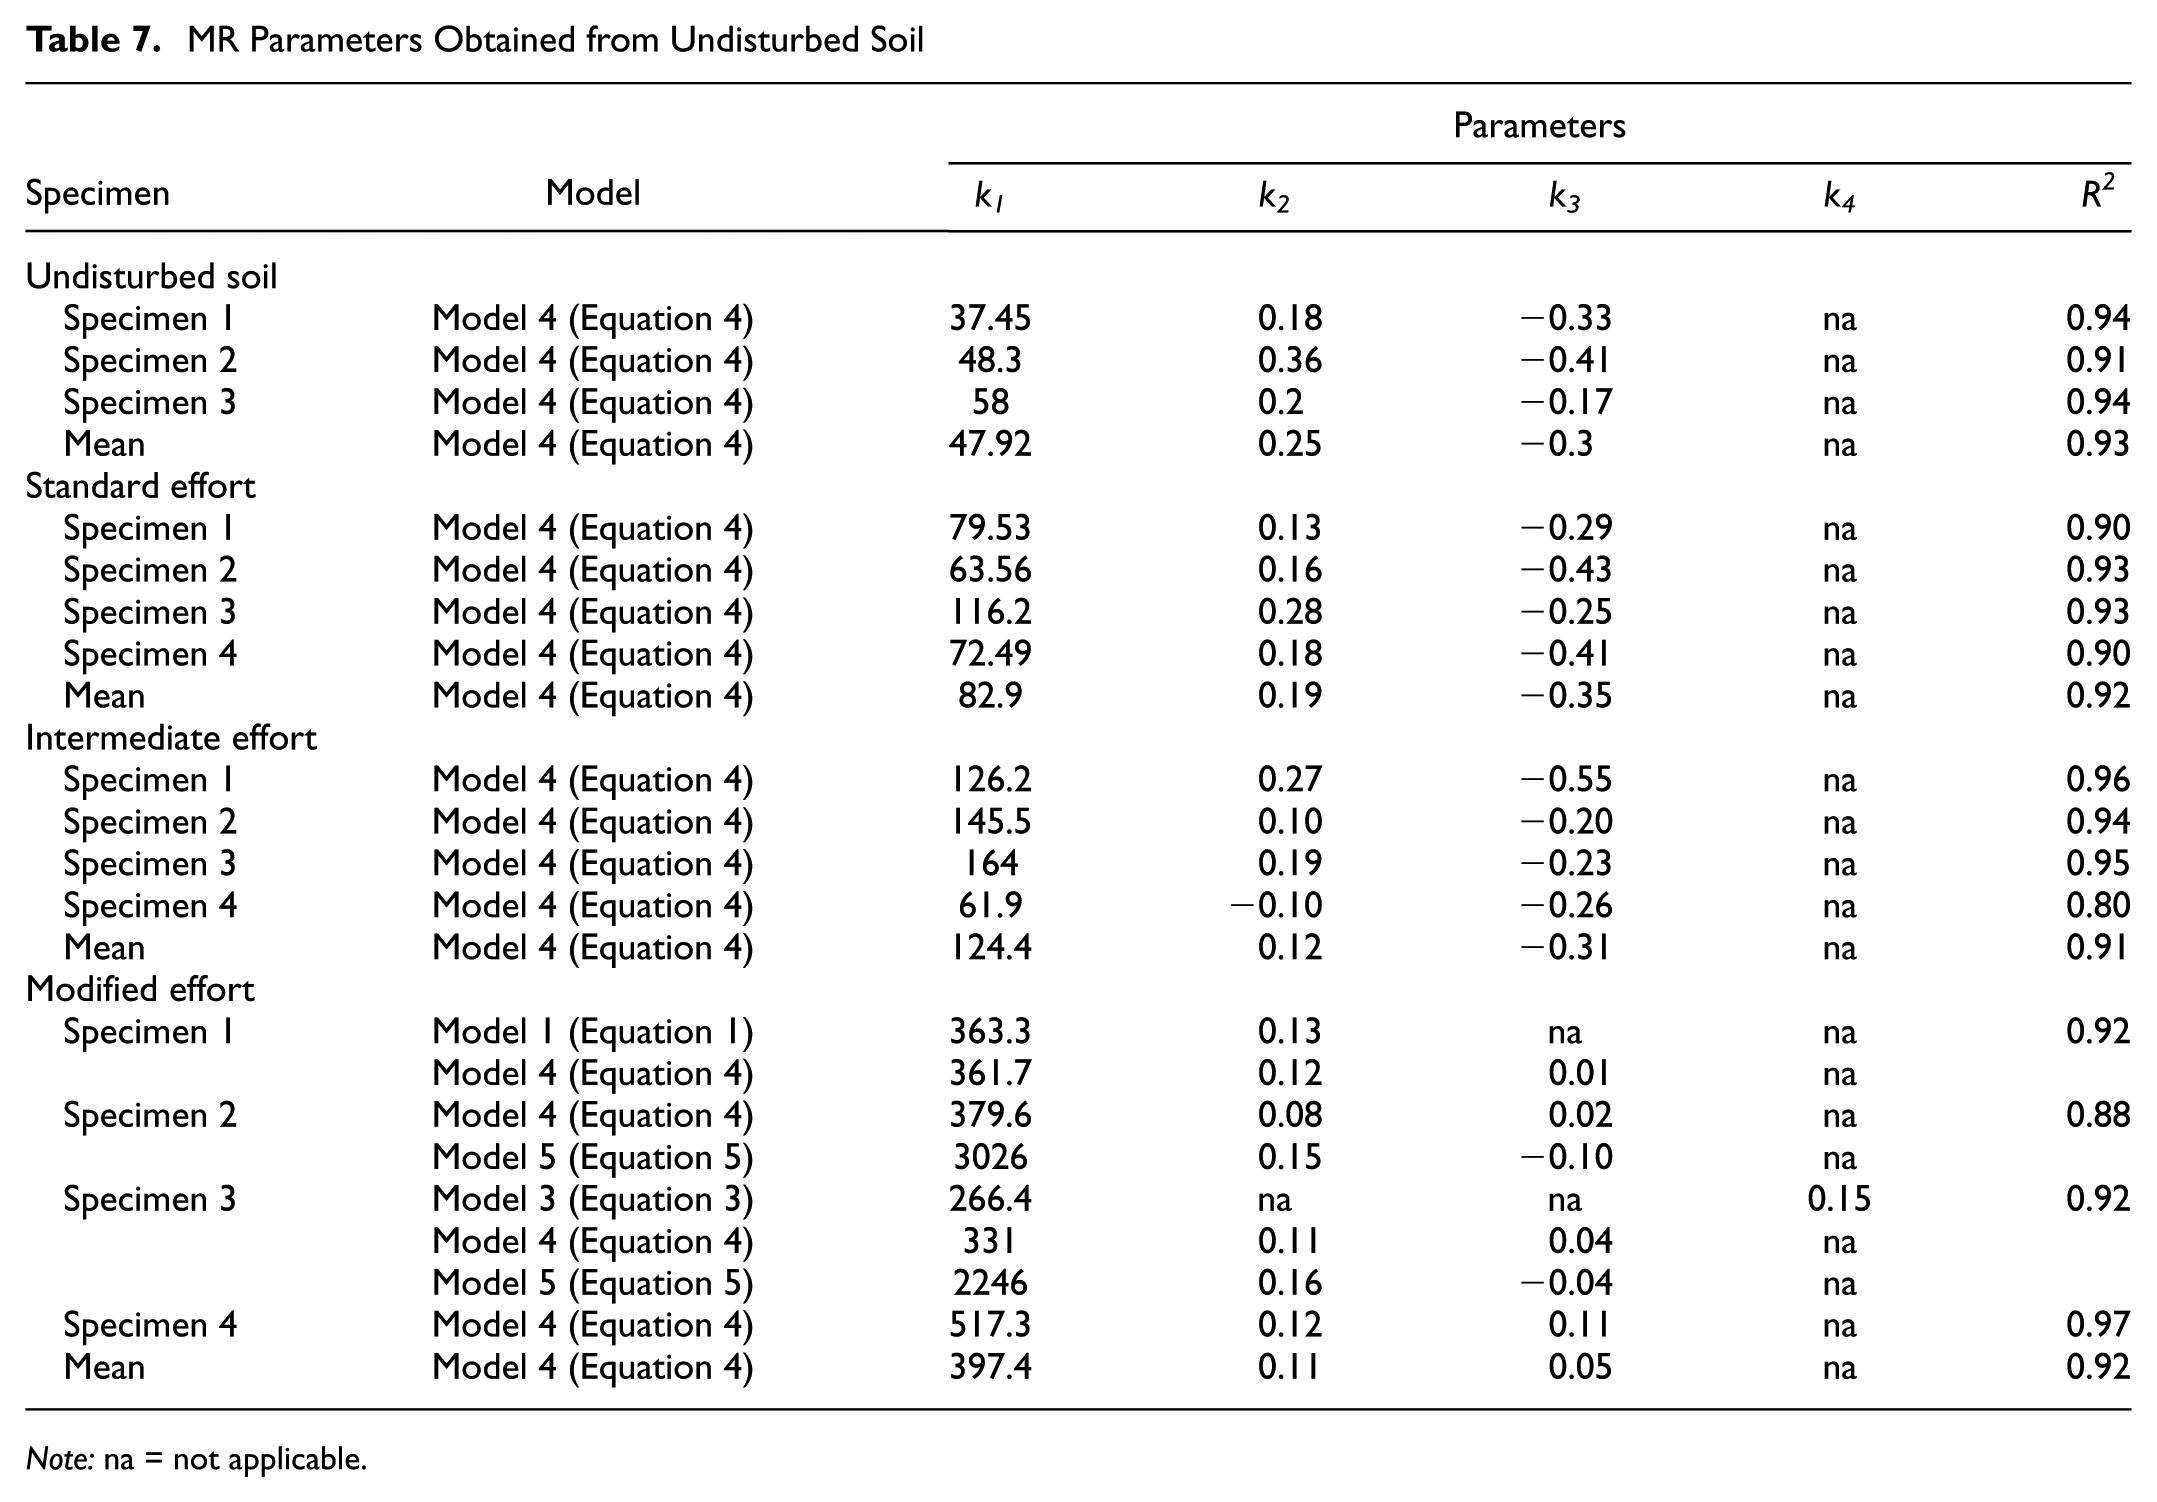
Note: na = not applicable.
Although the universal model is internationally adopted, several studies conducted in tropical regions have demonstrated that composite stress-based models often provide better statistical fitting for lateritic and cemented soils ( 58 , 87 ).
The parameters k 1 , k 2 , k 3 , and k 4 of the highest coefficient R 2 , and the mean of compacted specimens are also presented in Table 7 for the standard, intermediate, and modified efforts, respectively. For the standard and intermediate effort, the composite model (Equation 4) resulted in the highest coefficient R 2 . The composite model confirms the nonlinear behavior with confining pressure and deviatoric stress for the specimens compacted at standard and intermediate effort.
For the composite model, the standard effort specimens obtained a parameter k 1 equal to 82.9, a parameter k 2 equal to 0.19, and a parameter k 3 equal to -0.35. For the intermediate effort, the composite model brought a parameter k 1 equal to 124.4, a parameter k 2 equal to 0.12, and a parameter k 3 equal to -0.31. The specimens compacted at standard and intermediate efforts have a considerable influence on the confining pressure and deviatoric stress.
The MR tests of modified compacted specimens resulted in higher coefficients of R 2 for several models. For the first specimen, the first model and the fourth model resulted in the highest coefficient of R 2 ; the second specimen had the fourth and fifth models with the highest coefficient of R 2 ; the third specimen had the highest coefficient of R 2 on the third, fourth, and fifth models. Specimen number four resulted in the highest coefficient of R 2 for the fourth model (composite model). In other words, the MR results had less influence from deviatoric stress; for the first specimen, for instance, with the first model applied, only the confining pressure influenced the results, in a parameter k 2 equal to 0.13. The mean of all four specimens still resulted in a higher coefficient of R 2 for the composite model. For the composite model, the modified effort compacted specimens obtained a parameter k 1 equal to 397.4, a parameter k 2 equal to 0.11, and a parameter k 3 equal to 0.05.
The parameters k 1 , k 2 , k 3 , and k 4 of the highest coefficient R 2 , and the mean of cement-treated specimens are presented in Table 8 for the content of 3%, 6%, and 9%. For the specimens treated with cement with content at 3%, models four and five achieved a high coefficient of R 2 . The model number five, also called the universal model, is commonly applied to fine soils ( 28 ), and it is based on bulk stress and octahedral shear stress (Equation 5), which is also influenced by confining pressure and deviatoric stress.
MR Parameters Obtained from Modified Effort Compaction of Cement-Treated Samples at a Content of 3%, 6%, and 9% (C3, C6, C9)
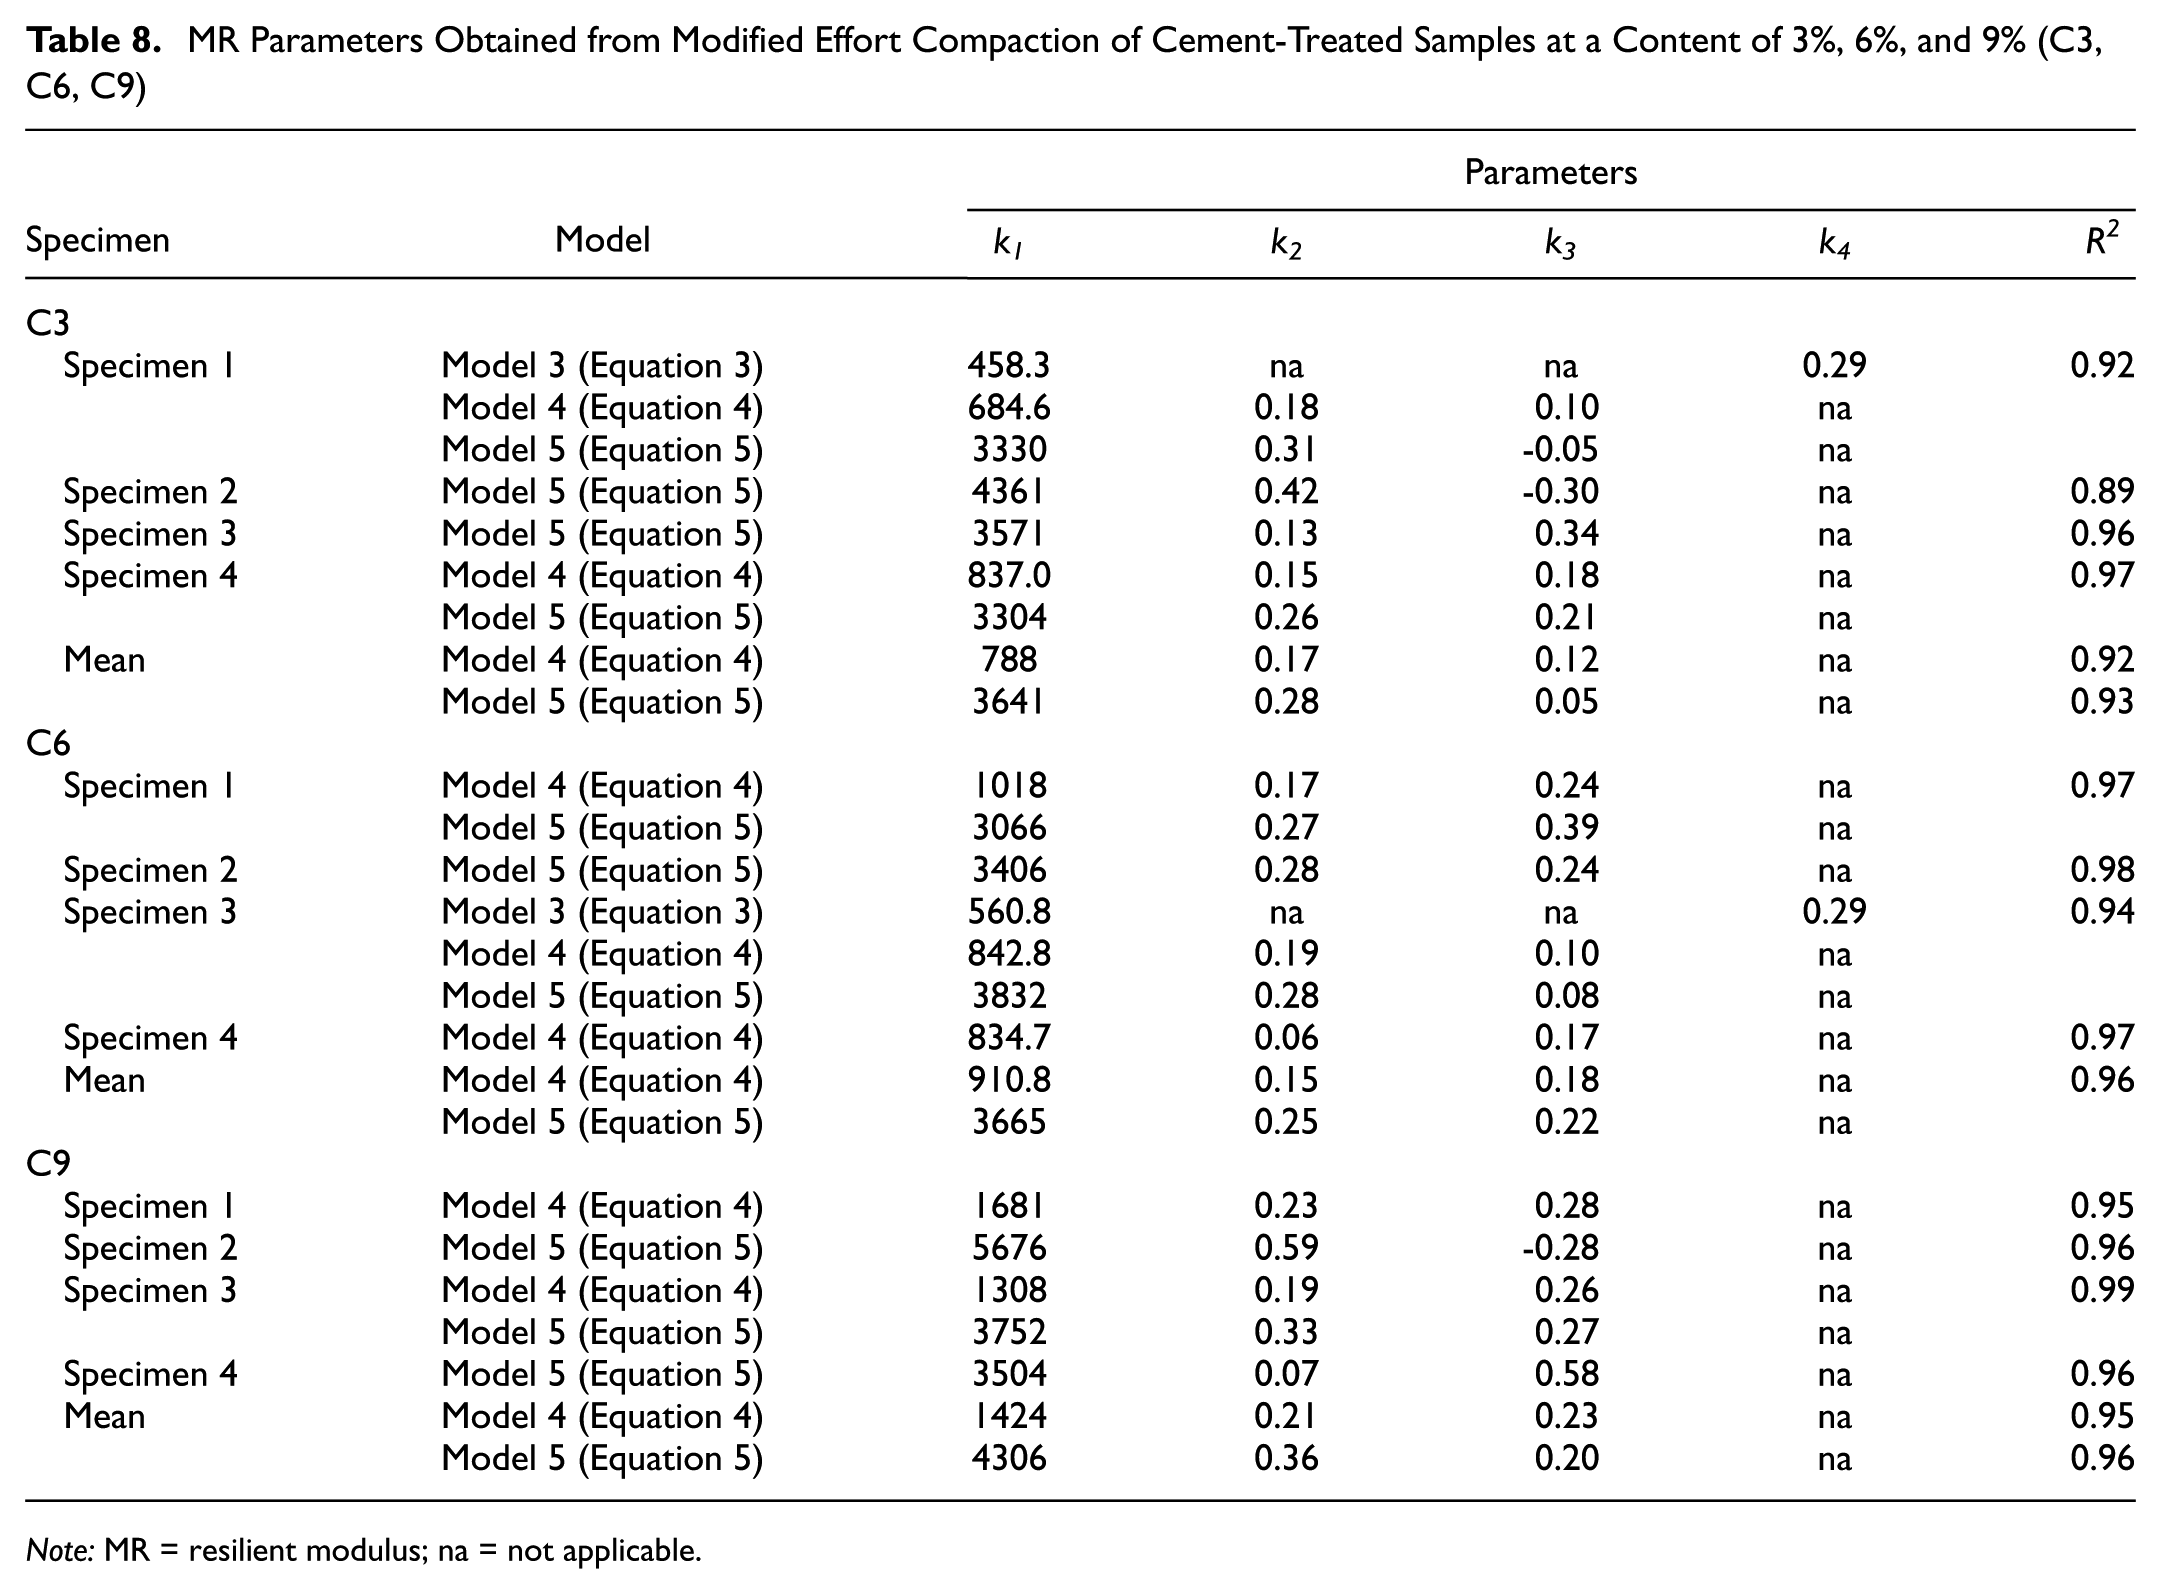
Note: MR = resilient modulus; na = not applicable.
The MR parameters of cement-treated specimens at a content of 3% resulted in the highest coefficient of R 2 with the universal model (Equation 5), in a value equal to 0.93. The composite model (Equation 4) resulted in a coefficient of R 2 equal to 0.92. The composite model was adopted as the reference framework for the further comparative analysis of parameters obtained, since it provided better statistical fitting for the pure soil results and is often chosen for lateritic soil ( 87 ). For the composite model, the cement-treated specimens at a content of 3% obtained a parameter k 1 equal to 788, a parameter k 2 equal to 0.17, and a parameter k 3 equal to 0.12.
For the specimens treated with cement with a content of 6%, again, the models number four and five also resulted in a high coefficient of R 2 , repeating the cement-treated samples of 3% content. The MR parameters of cement-treated specimens at a content of 6% resulted in an identically high coefficient of R 2 for the composite model (Equation 4) and the universal model (Equation 5), in a value equal to 0.96. The composite model was then elected. For the composite model, the cement-treated specimens at a content of 6% obtained a parameter k 1 equal to 910.8, a parameter k 2 equal to 0.15, and a parameter k 3 equal to 0.18. For the cement-treated specimens, the confining pressure and deviatoric stress have substantial influence on the MR results.
For the specimens treated with cement with a content of 9%, model number five has resulted in the highest coefficient of R 2 , but the composite model (model number 4) was elected to follow the previously selected MR models (also resulting in a satisfactory coefficient of R 2 , equal to 0.95).
For the composite model, the cement-treated specimens at a content of 9% obtained a parameter k 1 equal to 1424.8, a parameter k 2 equal to 0.21, and a parameter k 3 equal to 0.23. For the cement-treated specimens, the confining pressure and deviatoric stress also confirmed substantial influence on the MR results.
The parameters k 1 , k 2 , k 3 , and k 4 of the highest coefficient R 2 , and the mean of cement–RGP-treated specimens at contents of 3% cement and 3%, 6%, and 12% RGP are presented in Table 9. For the specimens treated with cement and RGP, the confining pressure and deviatoric stress had considerable influence on the MR results, as the composite model (Equation 4) and universal model (Equation 5) resulted in the highest coefficient of R 2 , equal to 0.94, for the contents of 3% cement and 3% RGP. The composite model was then elected for the cement–RGP-treated specimens.
MR Parameters Obtained from Modified Effort Compaction of Cement–RGP–Treated Soil Samples at Contents of 3% of Cement and 3%, 6%, and 12% of RGP (C3RGP3, C3RGP9, C3RGP12)
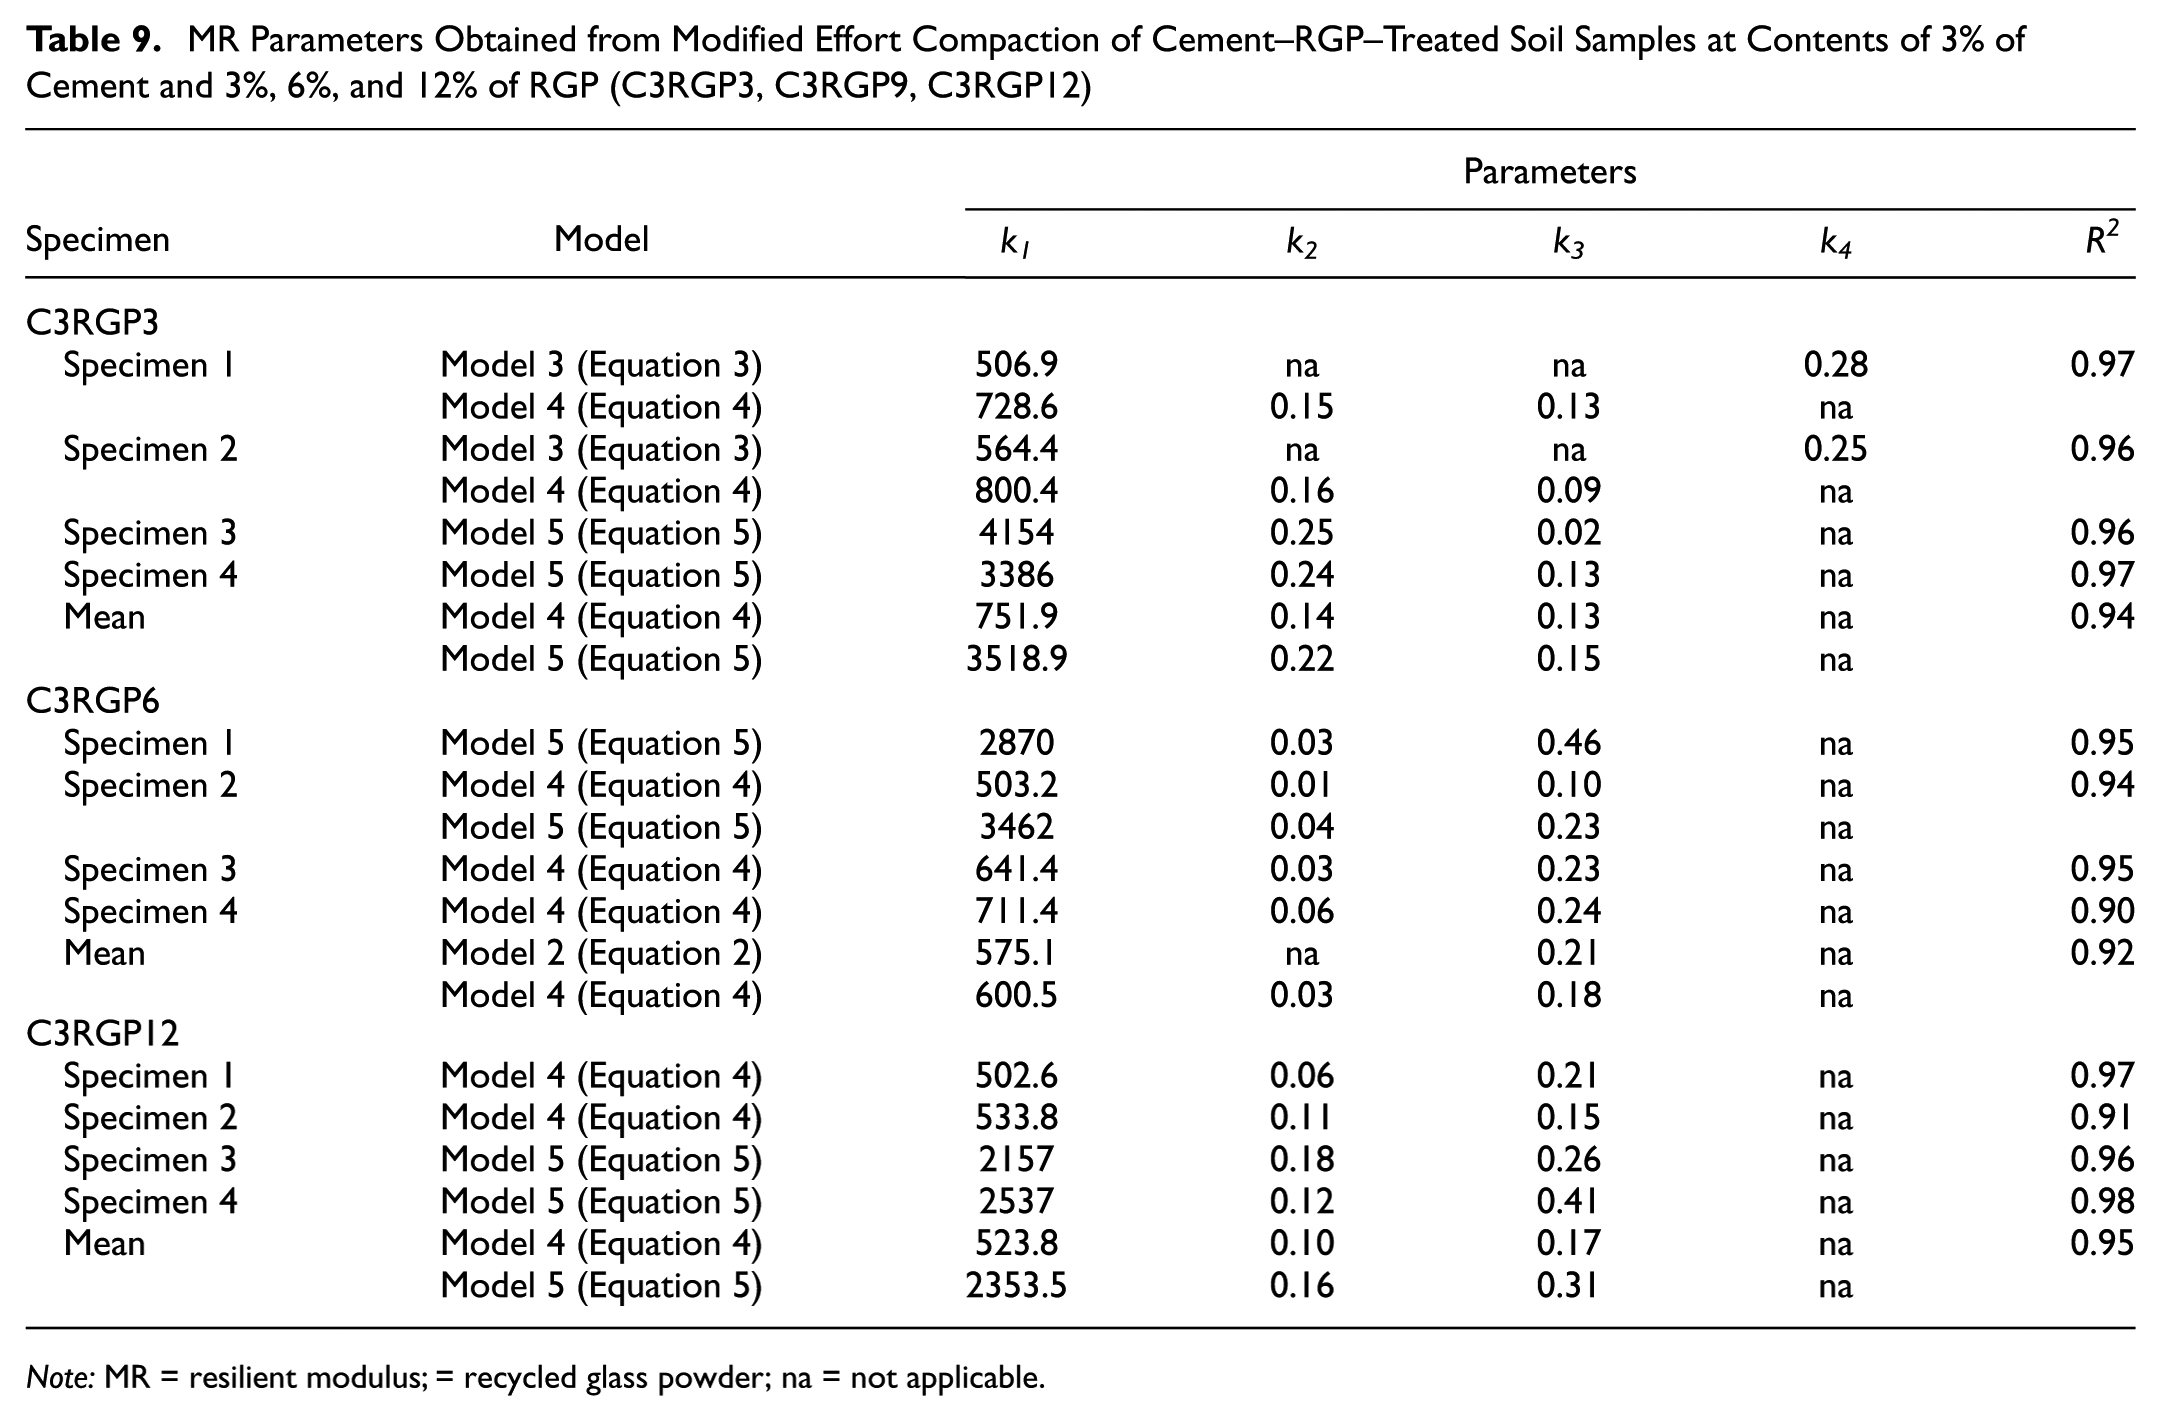
Note: MR = resilient modulus; = recycled glass powder; na = not applicable.
For the composite model, the cement–RGP-treated specimens at contents of 3% of cement and 3% of RGP obtained a parameter k 1 equal to 751.9, parameter k 2 equal to 0.14, and parameter k 3 equal to 0.13.
The MR tests of cement–RGP-treated specimens at contents of 3% cement and 6% RGP also resulted in high coefficients of R 2 , with a highlight for the Svenson model ( 75 ) (Equation 2) and composite model (Equation 4), as they had the highest value equal to 0.92. The Svenson model indicates an MR behavior only dependent on the deviatoric stress applied.
For the composite model, the cement–RGP-treated specimens at contents of 3% of cement and 6% of RGP obtained a parameter k 1 equal to 600.5, a parameter k 2 equal to 0.03, and a parameter k 3 equal to 0.18.
The MR tests of cement–RGP-treated specimens with contents of 3% cement and 12% RGP also resulted in high coefficients of R 2 ; the composite model (Equation 4) and the universal model (Equation 5) resulted in the highest value, equal to 0.95. The composite model and the universal model indicate an MR behavior with a nonlinear reliance on confining pressure and deviatoric stress.
For the composite model, the cement–RGP-treated specimens at contents of 3% of cement and 12% of RGP obtained a parameter k 1 equal to 523.8, a parameter k 2 equal to 0.10, and a parameter k 3 equal to 0.17.
The parameters k 1 , k 2 , k 3 , and k 4 , the coefficient R 2 , and the mean of cement–RGP-treated specimens at contents of 6% cement and 3%, 6%, and 12% RGP are presented in Table 10. The MR tests of cement–RGP-treated specimens with contents of 6% cement and 3% RGP also resulted in high coefficients of R 2 ; the composite model (Equation 4) and the universal model (Equation 5) resulted in the highest value, equal to 0.90. The composite model and the universal model indicate an MR behavior with a nonlinear reliance on confining pressure and deviatoric stress. The composite model was maintained.
MR Parameters Obtained from Modified Effort Compaction of Cement–RGP–Treated Soil Samples at Contents of 6% of Cement and 3%, 6%, and 12% of RGP (C6RGP3, C6RGP9, C6RGP12)
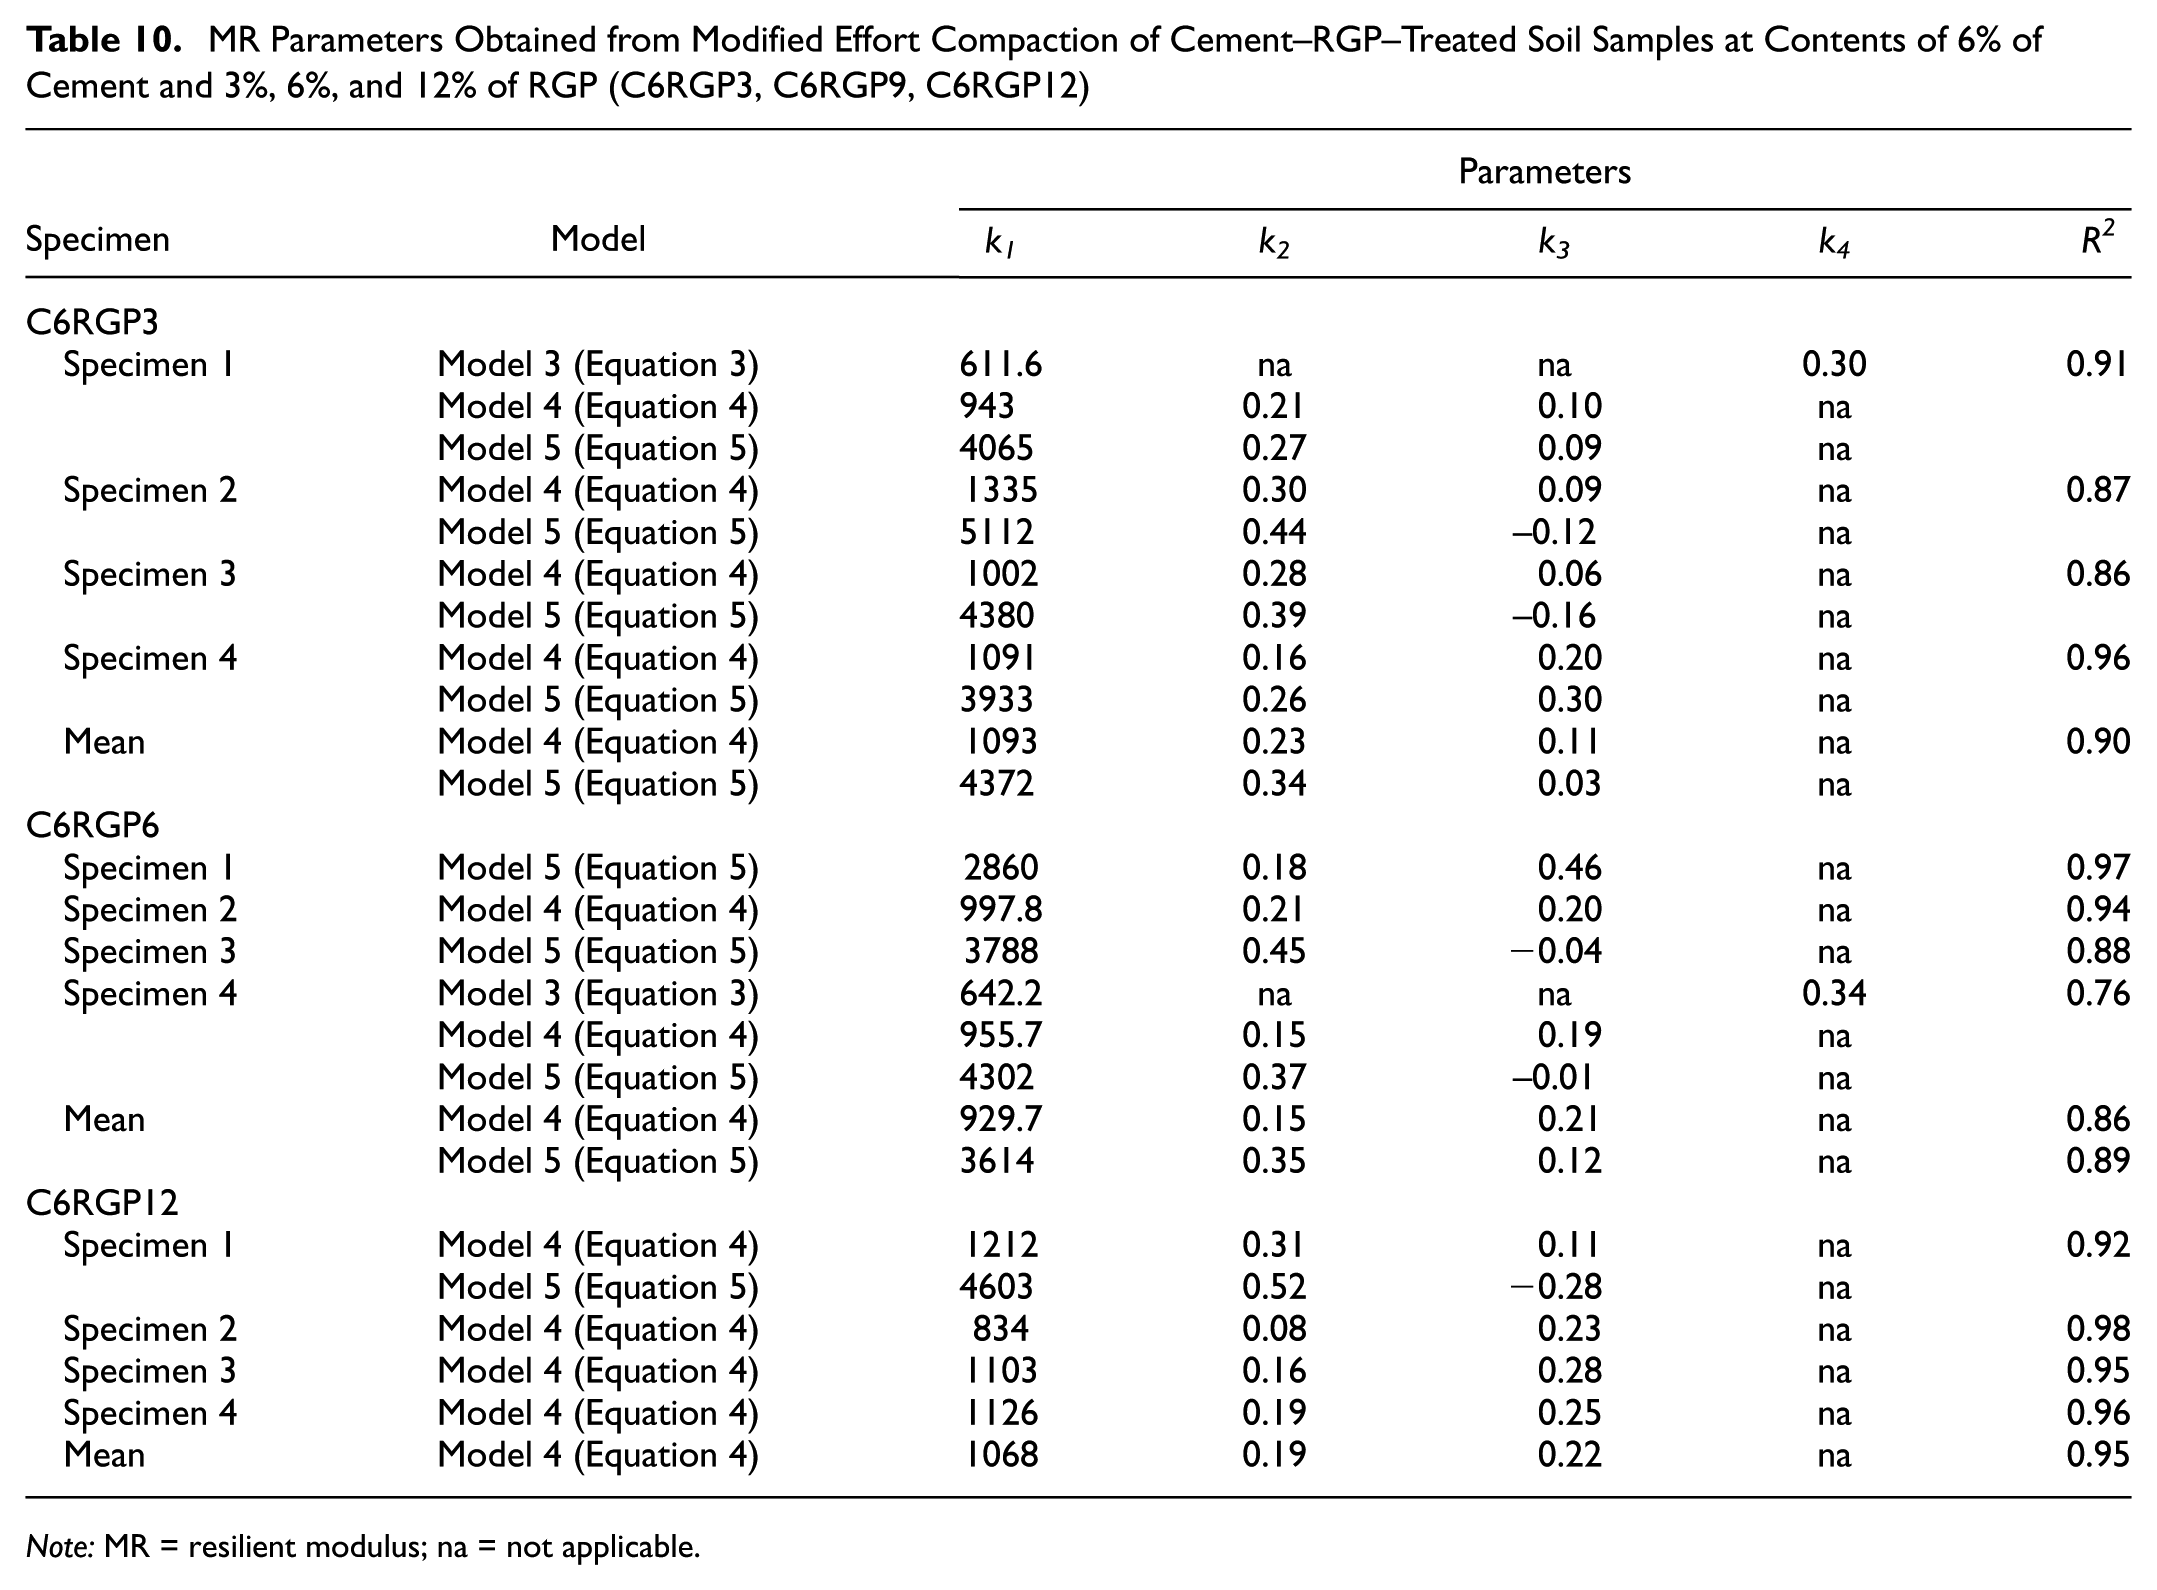
Note: MR = resilient modulus; na = not applicable.
For the composite model, the cement–RGP-treated specimens at contents of 6% of cement and 3% of RGP obtained a parameter k 1 equal to 1093, a parameter k 2 equal to 0.23, and a parameter k 3 equal to 0.11.
The MR tests of cement–RGP-treated specimens at contents of 6% cement and 6% RGP resulted in the highest coefficient of R 2 for the universal model (Equation 5), equal to 0.89. The second highest coefficient of R 2 is the model number 3 (Equation 3) with a coefficient of R 2 value equal to 0.87, and the composite model (Equation 4) resulted in a coefficient of R 2 value equal to 0.86. The composite model was maintained.
For the composite model, the cement–RGP-treated specimens at contents of 6% cement and 6% RGP obtained a parameter k 1 equal to 929.7, a parameter k 2 equal to 0.15, and a parameter k 3 equal to 0.21.
The MR tests of cement–RGP-treated specimens at contents of 6% cement and 12% RGP resulted in the highest coefficient of R 2 for the composite model (Equation 4), equal to 0.95.
For the composite model, the cement–RGP-treated specimens at contents of 6% of cement and 12% of RGP obtained a parameter k 1 equal to 1068, a parameter k 2 equal to 0.19, and a parameter k 3 equal to 0.22.
The mean of the parameters k 1 , k 2 , k 3 , k 4 , and the coefficient R 2 of all specimen groups are summarized in Table 11. With regard to undisturbed soil and pure soil at different compactions, it was observed that the parameter k 1 increased gradually, 729%, from undisturbed to modified effort compaction. The rise demonstrated that compaction energy considerably enhances the stiffness of the soil, improving particle interlocking conditions. The parameter k 1 directly affects the MR value, independent of confining pressure or deviatoric stress applied. Similar magnitudes and trends in the k 1 parameter have also been reported in Orioli et al. ( 72 ). The parameter k 2 decreased gradually, 56%, from the value of 0.25 to 0.11; the decrease implies a lesser dependency on confining pressure. The parameter k 3 is negative for undisturbed samples, standard effort compacted samples, and intermediate effort compacted samples, it becomes positive for modified effort compacted samples. This phenomenon was also observed in the literature ( 72 , 88 ). The parameter k 3 is linked to the nonlinear behavior of MR with deviatoric stress, and the opposite sign means the inversely proportional influence; therefore, the modified effort compaction resulted in a directly nonlinear proportional effect of deviatoric stress, in a value of 0.05.
Summary of Parameters and Coefficients of R2 for Nontreated, Cement-Treated, and Cement–RGP-Treated Samples
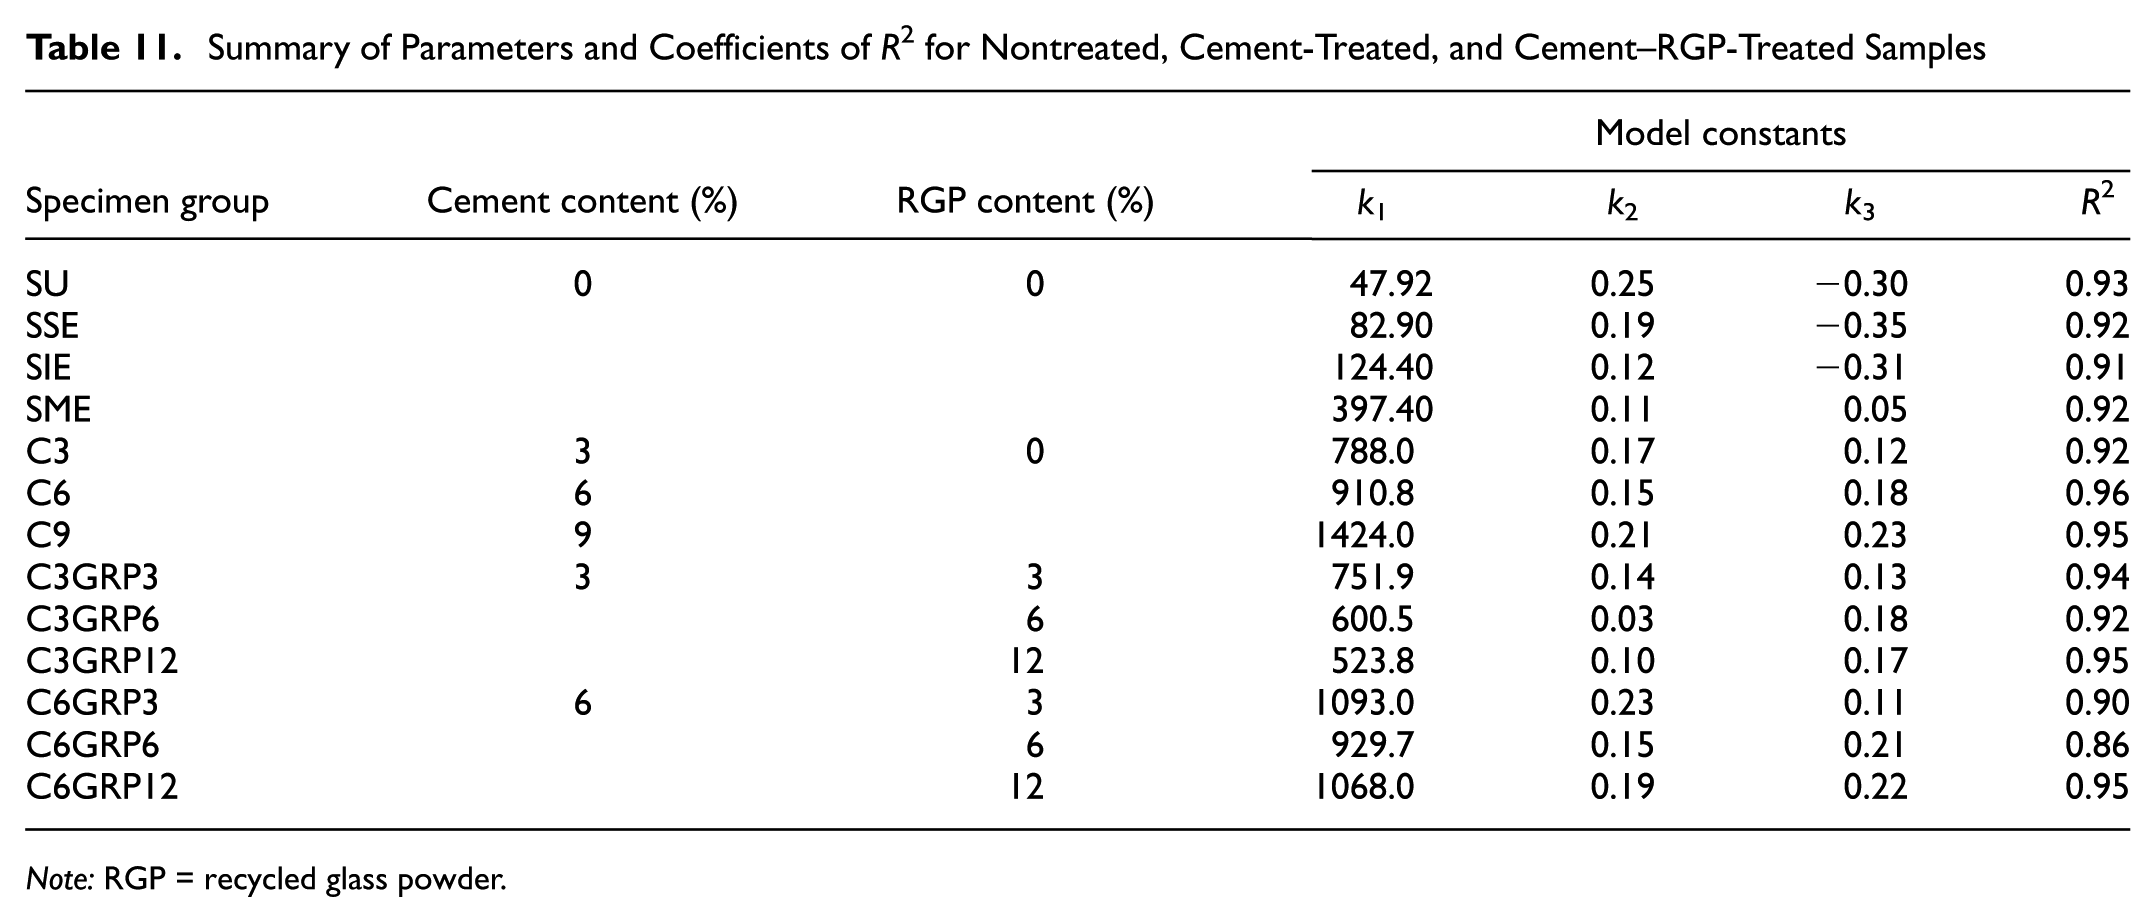
Note: RGP = recycled glass powder.
In relation to cement-treated samples, an increase in the parameter k 1 was also noted. The rise between cement-treated samples at contents of 3% and 6% was equal to 16%, from 788 to 910.8, and between cement-treated samples at contents of 6% and 9% was equal to 56%, from 910.8 to 1424. In comparison with the pure soil at modified compaction effort, the parameter k 1 of the cement-treated sample at 3% cement increased 98%, from 397.4 to 788. The cement treatment resulted in a direct improvement in MR values, according to the parameter k 1 . This behavior reflects the progressive development of cementitious bonds, from frictional particulate into a bonded geomaterial. The parameter k 2 decreased from 0.17 to 0.15 between cement-treated samples at 3% and 6% cement and increased from 0.15 to 0.21 between samples at 6% and 9% cement, respectively. The parameter k 3 increased from 0.12 to 0.18 between cement-treated samples at 3% and 6% cement and from 0.18 to 0.23 between cement-treated samples at 6% and 9% cement, respectively. The cement-treated samples have values of k 3 superior to pure soil at the modified effort condition; this signifies a higher dependency on deviatoric stress.
Concerning the cement–RGP treatment, the samples treated with a content of 3% cement and contents of 3%, 6%, and 12% RGP resulted in a decrease in the parameter k 1 while increasing the RGP content, from 751.9 (3% cement and 3% RGP) to 523.8 (3% cement and 12% RGP). In other words, the increase in RGP content decreased the parameter k 1 , and, consequently, the MR value. The parameter k 2 settled between 0.14 and 0.03, and the parameter k 3 between 0.13 and 0.18. In comparison with cement-treated samples, the cement–RGP-treated samples had lower values of k 1 than cement-treated samples in all contents.
The cement–RGP-treated samples with a content of 6% cement and contents of 3%, 6%, and 12% RGP resulted in a slightly decreased parameter k 1 while increasing the RGP from 1093 (6% cement and 3% RGP) to 929.7 (6% cement and 6% RGP) and 1068 (6% cement and 12% RGP). The parameter k 3 increased with the RGP content, from 0.11 to 0.22, showing a higher dependency on deviatoric stress. In comparison with cement-treated samples, the cement–RGP-treated samples had higher values of k 1 in all conditions, except the content of 6% cement and 12% RGP. The change in the k 1 progression, from raw compacted samples to cement–RGP-treated samples, suggests that the beneficial effects of pozzolanic reactions and pore refinement are counterbalanced by geopolimerization and particle packing, leading up to an ideal value of additive content. The coefficient of R 2 average for pure soil undisturbed and compacted, cement-treated soil, and cement–RGP-treated soil is 0.92, which provides a high level of reliability.
The evolution of the fitting results (k1, k2, and k3) as a function of compaction, cement, and RGP contents is presented graphically in Figure 10 to enhance clarity and interpretability. The corresponding error bars attribute one standard deviation.
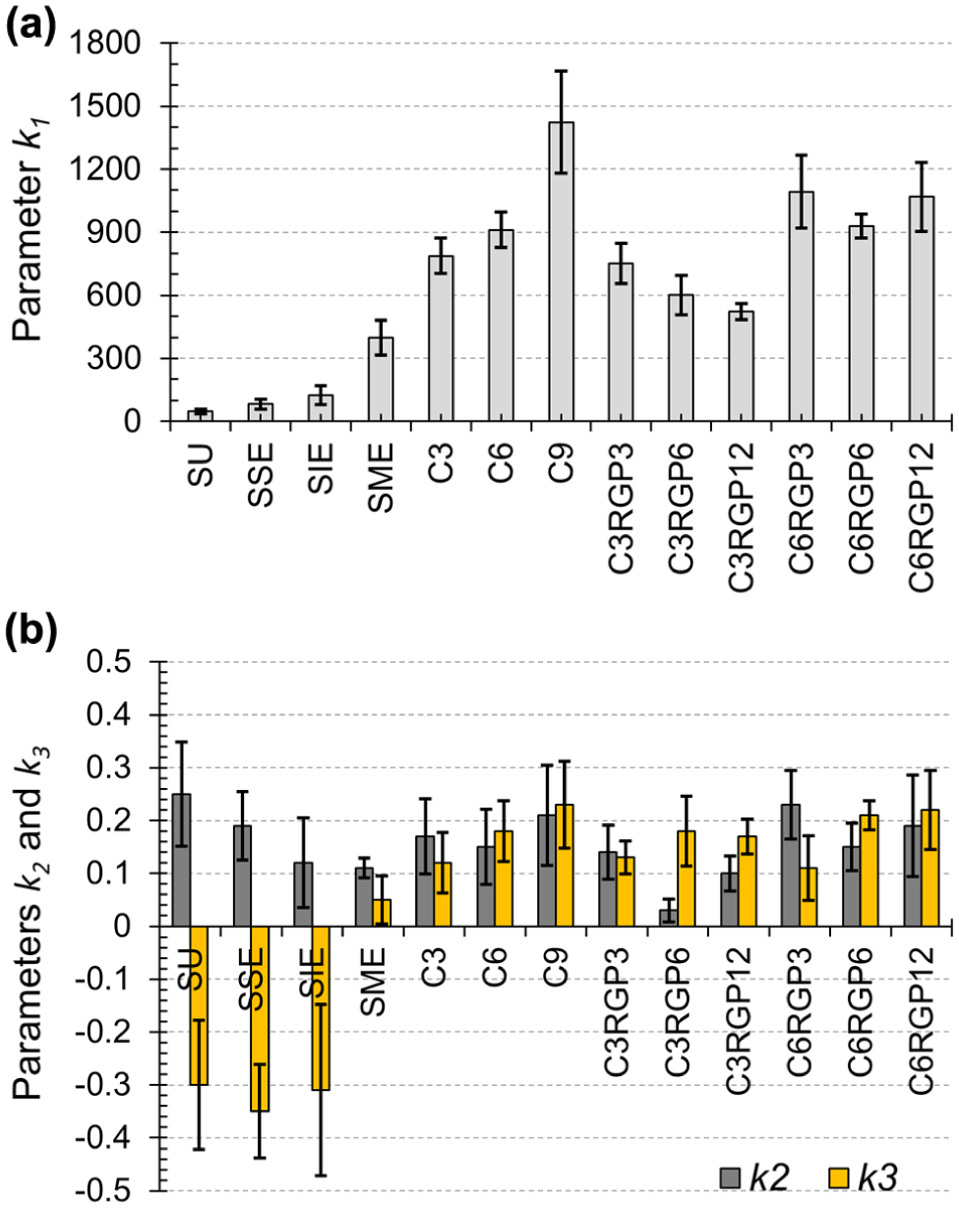
Variation of composite model parameters (a) k1, and (b) k2, k3 of undisturbed soil, compacted soil at standard, intermediate, and modified effort, cement-treated, and cement–RGP-treated soil.
The parameter k1 represents the stiffness magnitude coefficient, whereas k2 and k3 govern the sensitivity of the MR to confining pressure and deviatoric stresses, respectively. As shown in Figure 10a, the parameter k 1 increased with both compaction effort and cement content, while it decreased with an increase in RGP content in mixtures that contain 3% cement. In mixtures containing 6% cement, the increase in RGP slightly benefits the mixtures with 3% and 12% RGP content.
The parameter k 2 showed a decrease between undisturbed samples and modified effort compacted samples, which then maintained values between 0.1 and 0.23, except for the mixture C3RGP6 (Figure 10b). In regard to parameter k 3 , untreated soil exhibited negative values, indicating a reduction in MR while increasing deviatoric stress, a characteristic of frictional, stress-softening behavior. In contrast, modified effort compacted samples, cement-treated and cement–RGP-treated samples presented positive k3 values, implying enhanced resistance with deviatoric stress.
The MR regression models, according to the MR tests and parameters in Table 11, are represented in Figure 11. Concerning pure soil samples, undisturbed and compacted, the confining pressure had little or zero effect on the MR values. The zero effect of confining pressure can be observed in undisturbed samples, standard effort compaction, intermediate effort, and modified effort compaction samples. On the other hand, the deviatoric stress had a bigger influence on the MR values at low levels, mainly in standard effort compaction and intermediate compaction samples. The intermediate effort compaction samples even surpassed the modified effort compaction MR values at low deviator stress values. The modified effort compaction samples had little influence from the deviator stress; nonetheless, their MR values were mostly higher.
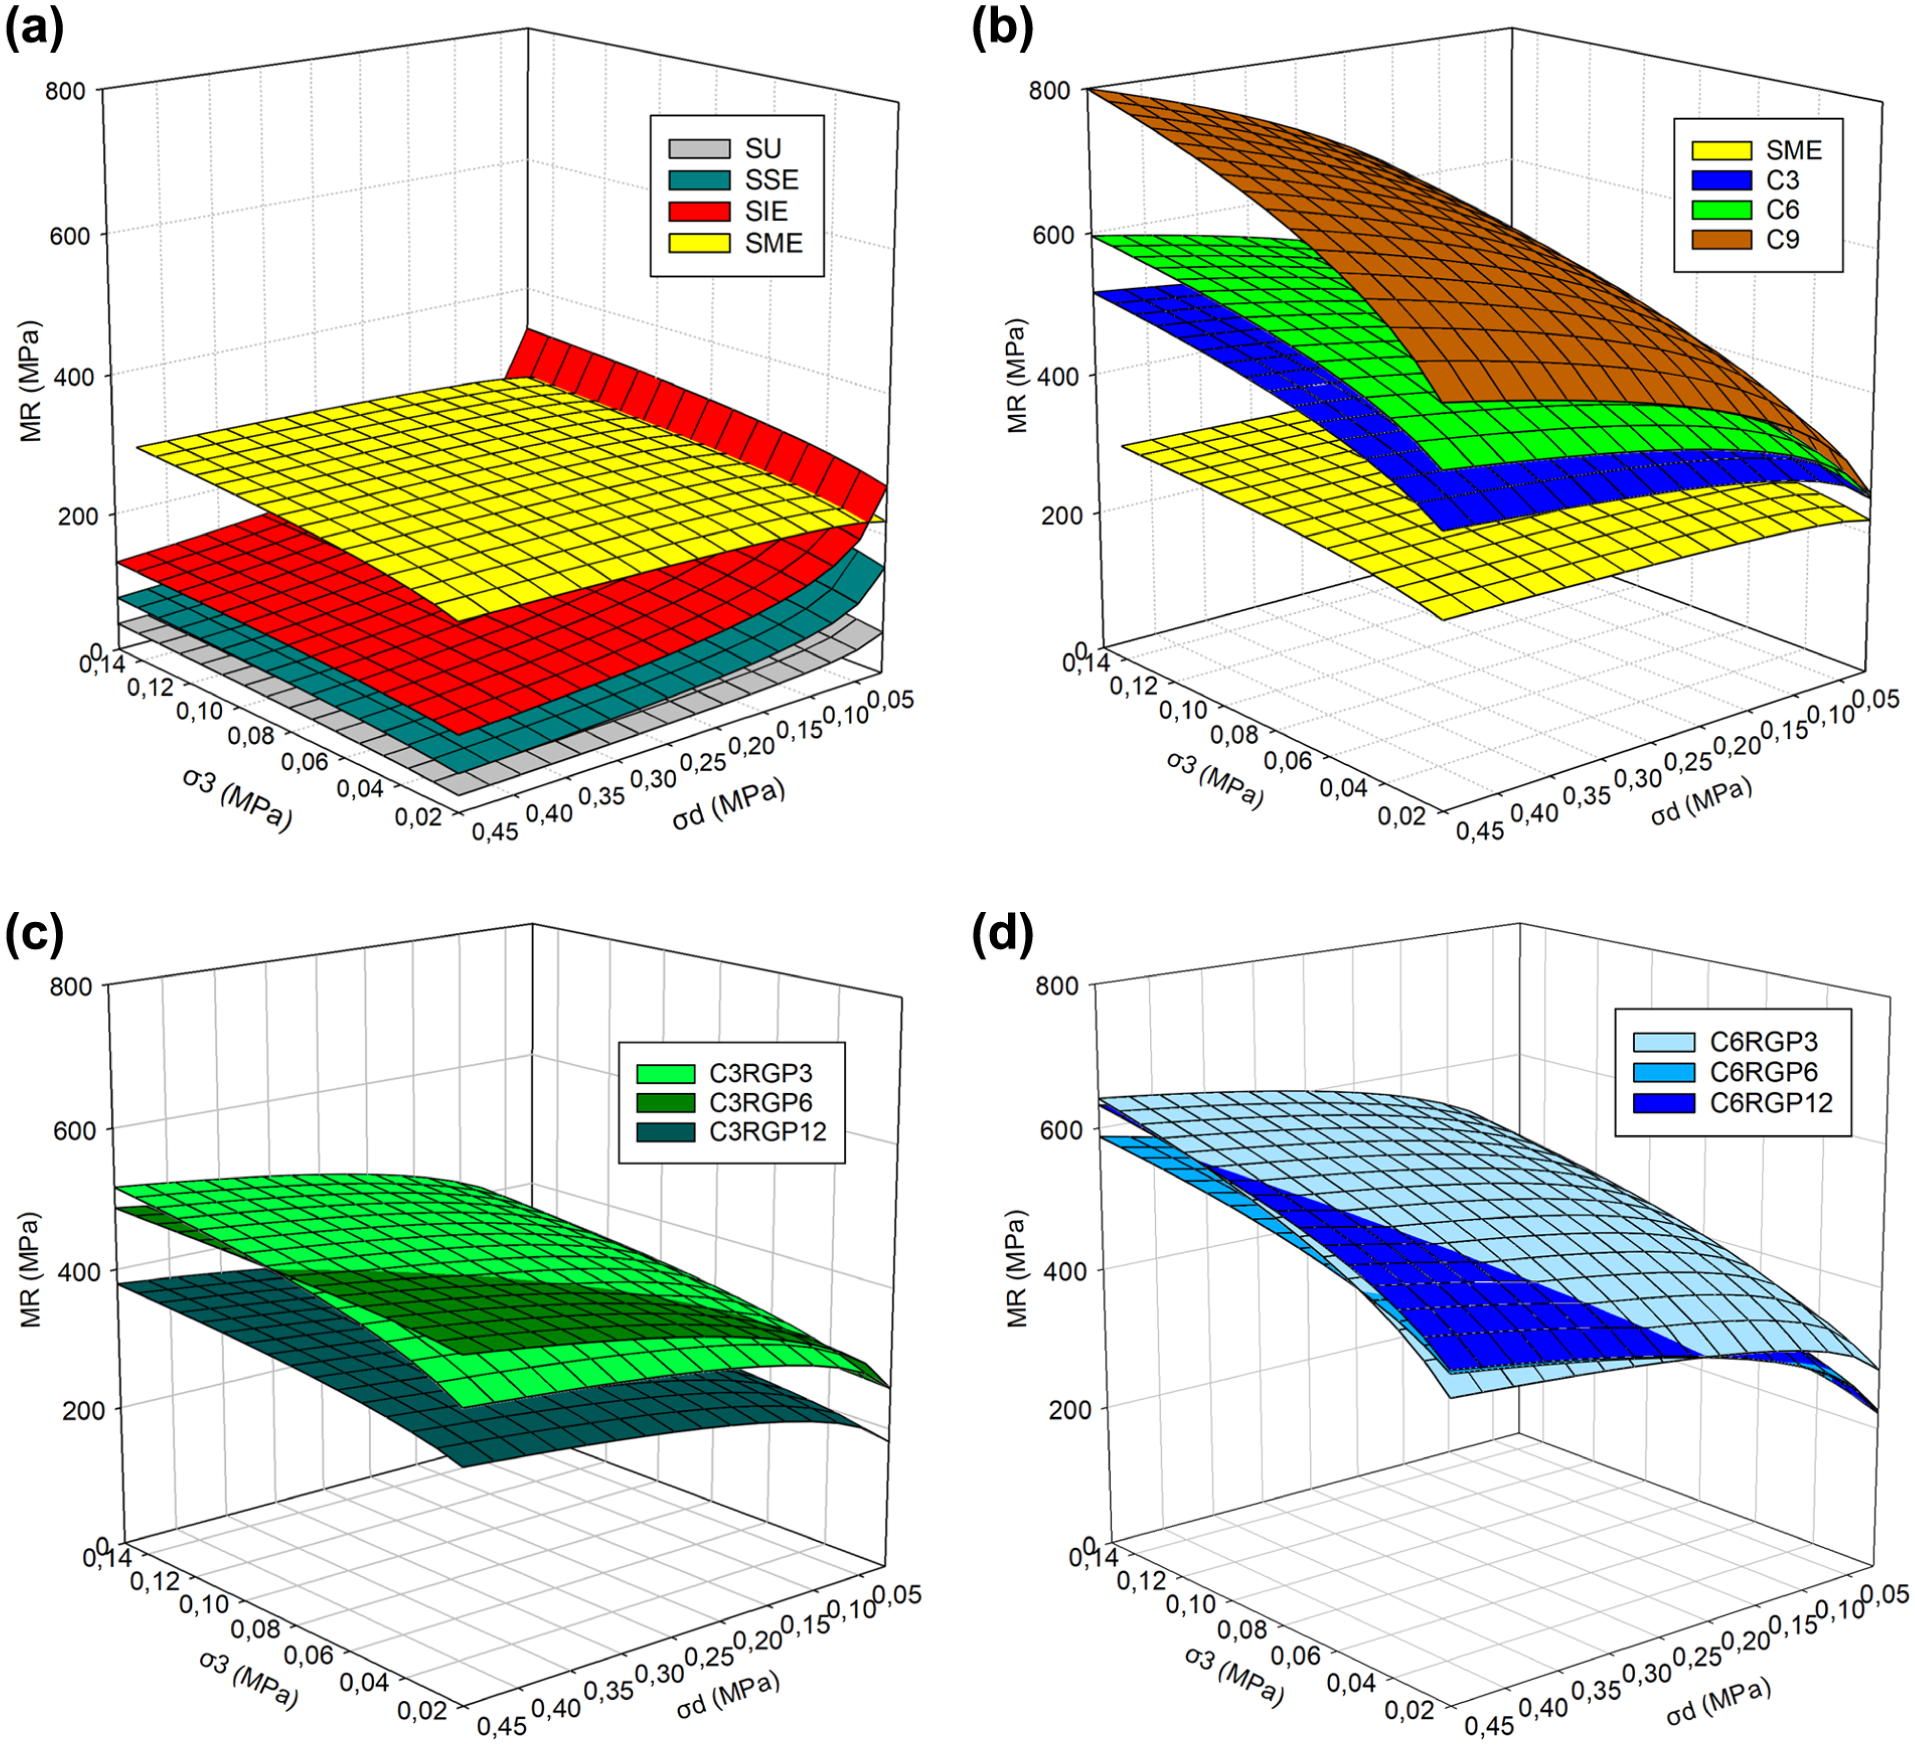
MR models of: (a) pure soil (undisturbed and at different compaction efforts), (b) cement-treated soil samples at contents of 3%, 6%, and 9%, (c) cement–RGP-treated soil samples at contents of 3%–3%, 6%, and 12%, and (d) 6%–3%, 6%, and 12%, respectively.
Concerning the cement-treated samples, both deviatoric stress and confining pressure had major influence on MR values. The MR values of cement-treated samples increased with deviatoric stress and confining pressure. Both contents of cement-treated samples (3% and 6%) surpassed the modified effort compaction samples after 28 days of curing period and at any condition of deviatoric stress and confining pressure. In the comparison between pure samples and cement-treated samples, the 6% cement content resulted in the highest MR values.
In relation to cement–RGP-treated samples, both deviatoric stress and confining pressure influenced MR values. The cement–RGP-treated samples at 3% cement content and 3% RGP content had the major influence of deviatoric stress and confining pressure, whereas the cement–RGP-treated samples at 6% content and 3%–12% RGP had been influenced by deviatoric stress and confining pressure independently of RGP content. It is worth emphasizing that among the cement–RGP-treated samples with 3% cement content, the samples containing 3% RGP exhibited the highest MR values, and similarly, among the samples with 6% cement content, those with 3% RGP also showed the highest MR values. Among the cement–RGP-treated samples, those with 6% cement content and 3% RGP content exhibited the highest MR values compared with the samples with 3% cement content. This increment may be related to properties such as the cohesion and friction of particles, in addition to the gain in stiffness resulting from the chemical stabilization of cement and RGP. A more substantial structure is formed by silicates derived from the geopolymerization process between the amorphous silica of the RGP and the soil minerals in the presence of cement, which acts simultaneously as an alkaline activator and binder ( 16 , 89 , 90 ).
Tabaroei and Bozorgvar ( 35 ) also observed that the replacement of RGP in clayey soil led to an enhancement in the stiffness of the RGP-treated samples, with the effect becoming more significant as the RGP content neared the optimal level and the curing was extended. For the clay (CL in the USCS classification) used in the study, the optimal RGP content was determined to be 15%. The incorporation of RGP showed enhanced particle interlocking, a notable increase in MR, and a reduction in the flexibility of the soil specimens. The MR values of the clay–RGP mixture exhibited a trend similar to the uniaxial compressive strength values.
Figure 12 presents the MR average values of pure soil under distinct conditions (undisturbed and compacted), cement-treated soil, and cement–RGP-treated soil, the error bars represent one standard deviation. Related to the pure soil, the compacted samples had an increase in MR average values in all cases. The MR average values of standard effort compaction increased 123%, intermediate effort compaction 279%, and modified effort compaction increased 479% when compared with undisturbed samples.
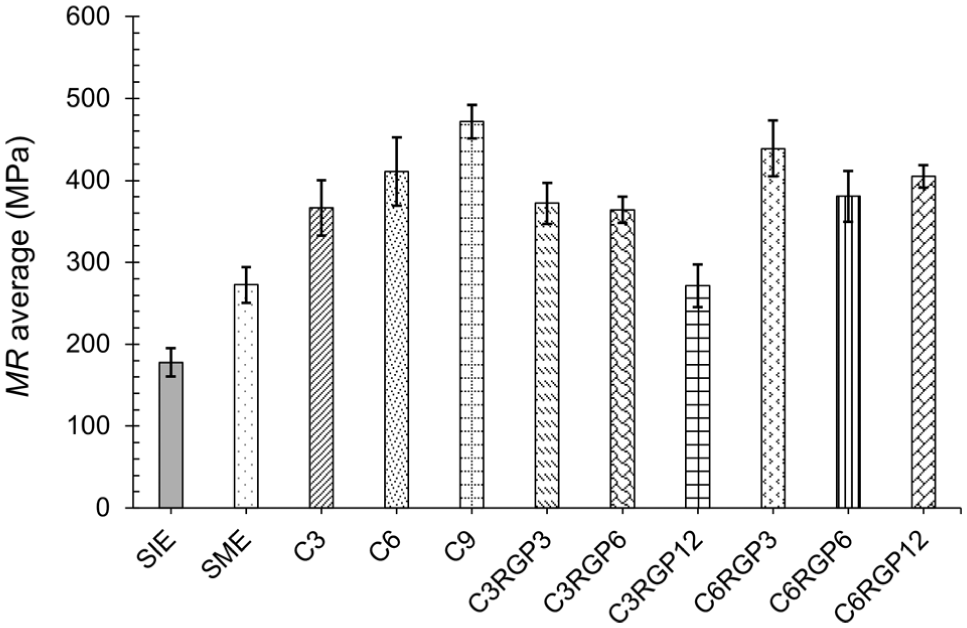
Average MR values of pure soil at distinct conditions (undisturbed and compacted), cement-treated soil, and cement–RGP-treated soil.
With regard to cement-treated soil, the MR average values of cement-treated soil at a content of 3% raised 34.6% when compared with modified effort compaction soil. The cement-treated soil at a content of 6% increased 51.1%, and the cement-treated soil at a content of 9% rose 74% under the same comparison.
A slightly higher mean MR value was observed in the cement–RGP-treated samples at a content of 3% cement and 3% RGP, equal to 1.6%, when compared with cement-treated samples at a content of 3%. The cement–RGP-treated samples at contents of 3% cement and 6%–12% RGP decreased 0.5% and 26%, respectively, when compared with cement-treated samples at a content of 3%.
A similar behavior was observed in the cement–RGP-treated samples at a content of 6% cement. A slightly higher mean MR value was observed in the cement–RGP-treated samples at a content of 6% cement and 3% RGP, equal to 6.8%, when compared with cement-treated samples at a content of 6%. The cement–RGP-treated samples at contents of 6% cement and 6%–12% RGP decreased 7% and 1.5%, respectively, when compared with cement-treated samples at a content of 6%.
MR values are influenced by the compaction effort and the amount of stabilizing agent added. As the compaction effort and the content of cement increase, the stiffness also rises. However, the maximum MR values occurred at contents of 3% RGP, both in mixtures with 3% and 6% cement; the increment of RGP slightly improved MR values after 28 days of curing and room temperature condition. The lack of improvement in the contents of 6% and 12% RGP, in mixtures with 3% and 6% cement, is related to the slow rate of pozzolanic reaction. In detail, the C–S–H particles are influenced by the degree of supersaturation of calcium and silica ions, conforming to the reactants’ concentration ( 91 ). According to Hou et al. ( 92 ), the diffusion coefficient of silicate ions is slower than that of calcium ions. The concentrations of Ca2+ and SiO44− are comparatively low during the initial phases of curing; the nucleation process may be sluggish during this phase, and as the reaction progresses, more C–S–H develops, guaranteeing a noticeable strength increase in the following curing phase ( 91 ).
The analysis of soil–cement and soil–cement–RGP mixtures demonstrated that glass powder benefits soil stabilization at certain conditions in relation to content, curing period, and temperature. As Orioli et al. ( 29 ) stated, the stresses applied in pavement structure should be evaluated individually. The stress levels are lower in the layers beneath the base layer, which explains the differing stiffness of the material in the base layer compared with that in the subbase ( 93 ).
The waste glass powder has shown an important economical consideration for the pavement design, as MR values, on average, resulted in peak values at contents of 3% RGP, in mixtures with both 3% and 6% cement. Contents of 6% and 12% RGP do not benefit the mixture after 28 days in room temperature curing.
Analysis of Pavement Structure Using AEMC Software
The estimated stress value for the lower section of the asphalt coating layer defines the admissible equivalent number (N ir ) of service life in all mixtures (Table 12).
Estimated (N) Traffic Resisted the Pavement
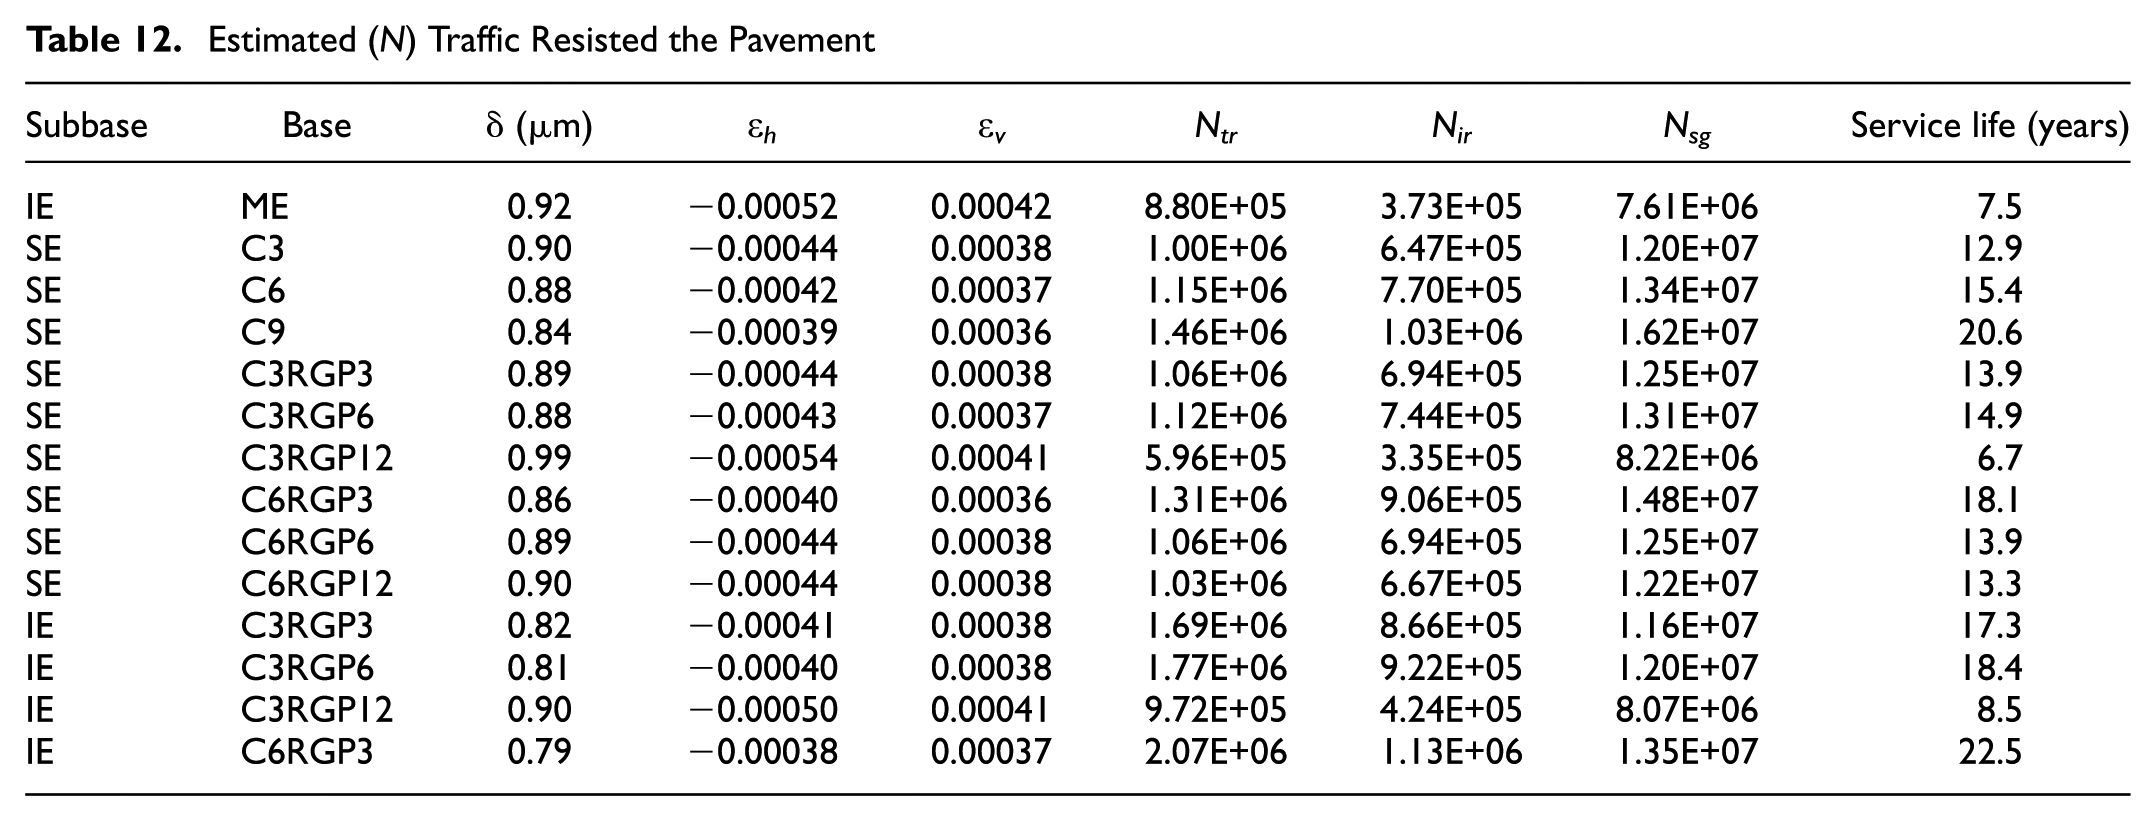
The pavement structure used as a reference in this study was composed of pure soil. The subgrade was compacted using standard Proctor energy, while the subbase and base were compacted at intermediate effort and modified effort, respectively, resulting in an equivalent number of single-axle dual-wheel operations of 3.73 × 10⁵. The fatigue properties of the coat material provide a service life of 7.46 years, which is unsuitable for average traffic on local and collector roads ( 78 ).
When the soil subgrade is set for standard effort compaction, and the subbase material is switched to standard effort while the base is changed to C3 (3% cement content), the N value increased to 6.47 × 10⁵, and the service life extended to approximately 12.9 years. When the base is set to C6, the N value increased to 7.70 × 10⁵, and the service life extended to 15.4 years; when it is set to C9, the N value further increased to 1.30 × 10⁶, and the service life extended to 20.6 years. It is noted that the service life increased with the cement content (3%–9%) in the base.
In relation to cement–RGP-treated samples, the mixture of cement at 3% and RGP at 3%, 6%, and 12% (all set in the base of the pavement) experienced an increase in service life between 13.9 and 14.9 years, followed by a decrease from 14.9 to 6.7 years, considering the subbase set as pure soil under standard effort compaction. When the mixture of cement at 6% and RGP at 3%, 6%, and 9% is set in the base of the pavement, the structure experienced a continuous decrease in service life between 18.1 and 13.9 years and 13.9 and 13.3 years, also considering the subbase a pure soil under standard effort compaction.
When the soil subbase is set for intermediate effort compaction and base to cement–RGP-treated samples at 3% of cement content and RGP at 3%, 6%, and 12%, the structure resulted in an increase in service life between 17.3 and 18.4 years, followed by a decrease between 18.4 and 8.5 years. When the base is set to a cement–RGP-treated sample containing 6% cement and 3% RGP, the service life increases to 22.5 years, which is a 24% improvement compared with the same base with a subbase compacted at standard effort. This value also exceeded the service life of the base with 9% cement content and its subbase compacted at standard effort by 9%. Increasing the compaction energy from standard to intermediate levels in the subbase, along with the addition of glass powder, resulted in a longer service life for the pavement and a reduction in cement consumption.
It is important to mention that the cement–RGP-treated samples with 3% cement content and RGP at both 3% and 6% significantly outperformed the cement-treated samples with 3% cement, extending their design life from 12.9 years to 13.9 years and from 12.9 years to 14.9 years, respectively. Finally, if considering a subbase of pure soil compacted at intermediate effort, the cement–RGP-treated samples at 3% of cement content and RGP at 3% and 6% exceeded by 12% and 19% the cement-treated samples at 6% of cement content, with a subbase of pure soil compacted at standard effort, denoting a reduction in cement consumption with the RGP addition.
The estimated additional cost per square meter for each stabilization mixture is presented in Table 13. The cost values represent the material additive contribution (R$/m2) and a cost–benefit indicator, allowing a direct comparison between investment and structural performance gain.
Cost Analysis Results
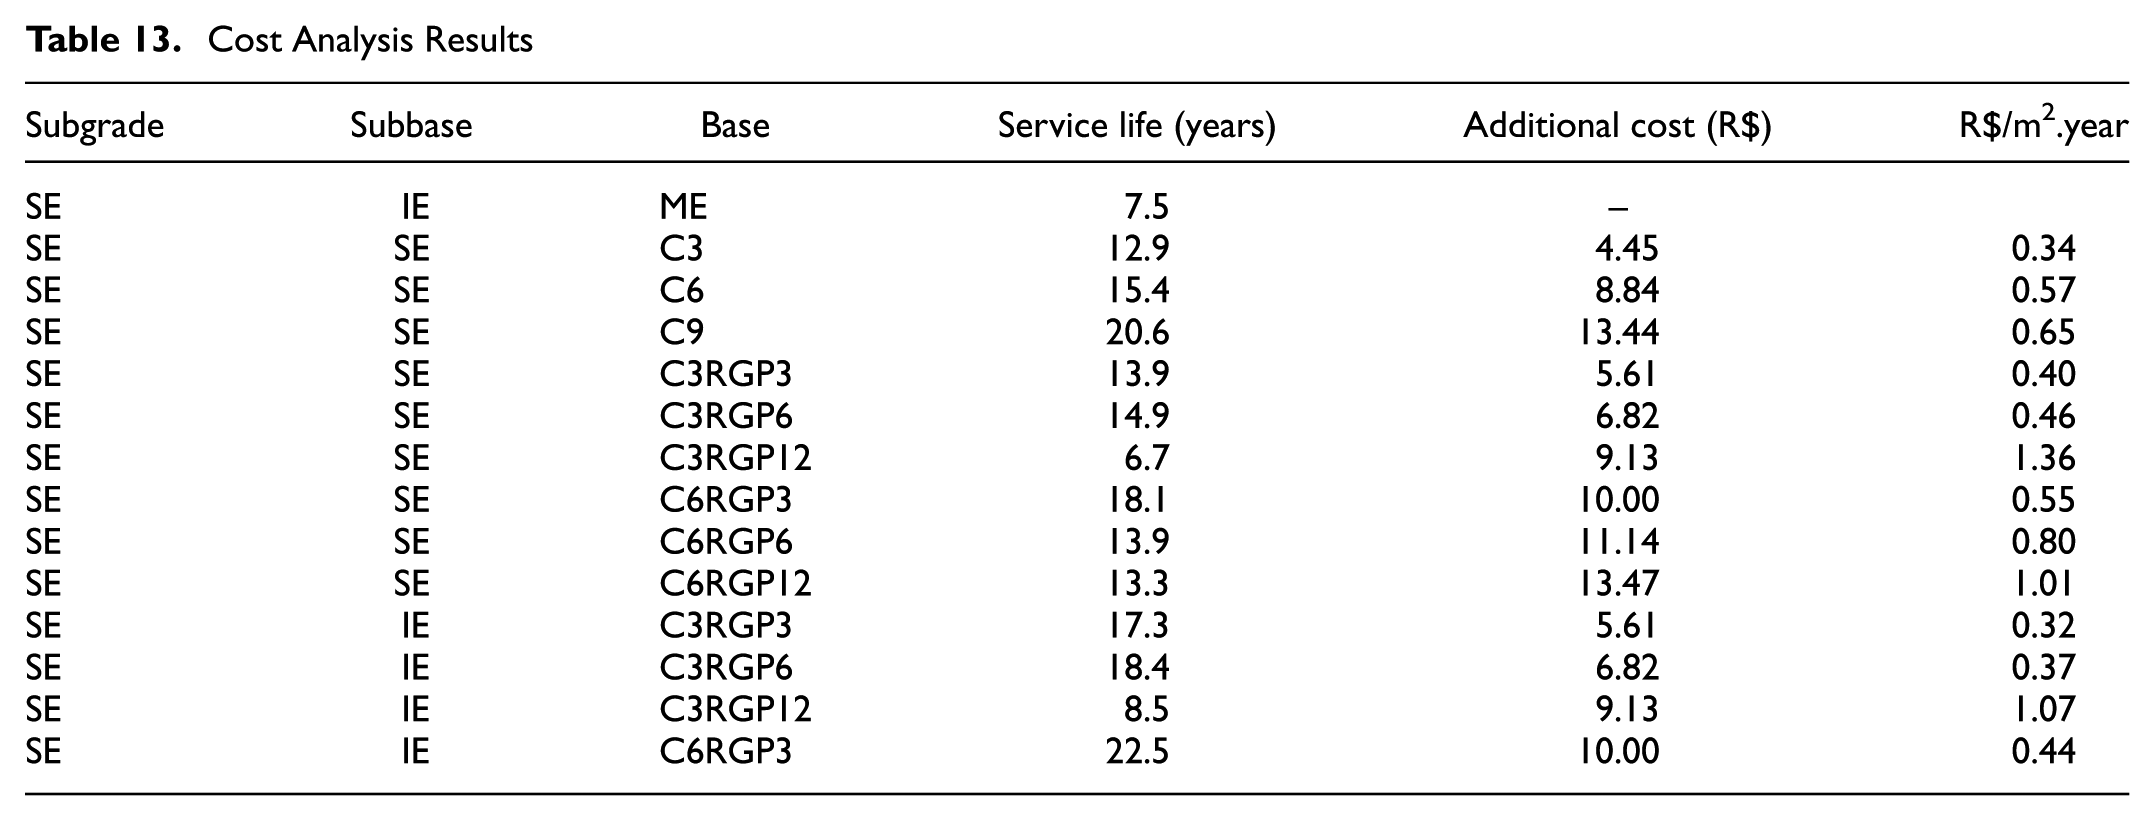
The lowest value in the cost–efficiency index (R$/m2.year) reveals the best economic efficiency. Among all evaluated alternatives, the mixture combining IE in the subbase C3RGP3 demonstrated the best economic performance. Among the SE subbase’s range, the lowest cost value in the cost-efficiency index is the cement-treated sample with 3% content, even though the cement–RGP-treated sample also demonstrated a favorable balance between cost and service life, with an 8% longer service life than the C3 mixture. It is important to note that the highest cost-efficiency indexes were the mixtures C3RGP12 with SE subbase and the mixture C3RGP12 with IE subbase.
Conclusions
The research aimed to investigate the impact of cement and RGP on the resilient behavior of clayey soil under optimal compaction conditions, with a focus on applications in urban pavement construction. From the experimental tests carried out, the following conclusions were drawn:
The three-parameter compost model (Model 4) provided an excellent fit for all analyzed mixtures. Furthermore, it is the model recommended for clayey soils, which have similar characteristics to the present soil.
The MR tests on undisturbed pure soil, under standard, intermediate, and modified compaction conditions, showed a decrease in the confining pressure dependency, and all specimens had an opposite influence on the deviator stress, except for the soil under modified compaction. The modified compacted sample also demonstrated a smaller dependence on deviator stress.
All the cement-treated and cement–RGP-treated specimens showed a substantial behavioral influence on confining pressure and deviator stress, except the cement–RGP-treated samples at 3% of cement content and 6% of RGP content, which showed the smallest confining pressure dependence.
The MR results increase significantly with the compaction of the soil and the increment of cement in the mixture, in the following order: standard effort, intermediate effort, modified effort, and cement-treated samples at 3%, 6%, and 9% of cement content. The cement mixed with soil and water, then compacted and under curing conditions, increased the material’s stiffness by creating bonds among particles.
An increase in MR results was also observed with the addition of 3% RGP in the cement mixtures (3% and 6% cement content). The RGP treatment at 3% content denoted an increase in the formation of cementitious products, therefore, an improvement in soil stiffness. Contents of 6% and 12% RGP do not benefit the mixture after 28 days in room temperature curing.
In all situations of pavement design, the admissible equivalent number was limited by the stress estimated for the lower section of the asphalt coating. Therefore, the fatigue properties of the coat material significantly influence the design of the pavement.
Concerning the pavement design, the cement-treated soil applied in the base layer increased the service life gradually in all mixtures. The cement–RGP-treated samples in the base layer increased the service life at 3% of cement content, 3% of RGP content, and 6% of RGP content when the subbase is pure soil compacted at standard effort. The same was observed when the subbase is pure soil compacted at intermediate effort. The cement–RGP-treated content of 6% cement and 3% RGP also improved the service life, but above this RGP content, no improvement was observed.
The longest service life was observed under a subbase with pure soil at an intermediate effort condition and a base with a cement–RGP-treated sample at 6% cement content and 3% RGP content.
Concerning the cost analysis, the C3RGP3 with an IE subbase had the highest economic performance out of all the options. The cement–RGP-treated sample likewise showed a good balance between cost and service life, with an 8% longer service life than the C3 combination, however, the cement-treated sample with 3% content had the lowest cost value in the cost-efficiency index among the SE subbase’s range.
Thus, this research demonstrated the RGP contributions in MR and mechanistic–empirical pavement design. The experimental results indicated that it cannot fully substitute cement as the primary stabilizing agent in tropical clayey soils. Instead, RGP acted as a supplementary material that enhances the performance of cement-treated mixtures through combined physical and chemical mechanisms. Further studies are required for a thorough understanding of the cement–RGP treatment’s behavior for both short and extended curing durations and to evaluate the potential for shrinkage reduction through the addition of the RGP and the consequent decrease in cement content.
Footnotes
Authors’ Note
The authors used an AI-based tool for spelling checks during the preparation of this manuscript.
Author Contributions
The authors confirm contribution to the paper as follows: study conception and design: C. Baldin, R. Izzo; data collection: C. Baldin; analysis and interpretation of results: V. Baldin, W. Teixeira; draft manuscript preparation: C. Baldin. W. Teixeira. All authors reviewed the results and approved the final version of the manuscript.
Declaration of Conflicting Interests
The authors declared no potential conflicts of interest with respect to the research, authorship, and/or publication of this article.
Funding
The authors disclosed receipt of the following financial support for the research, authorship, and/or publication of this article: The authors are thankful to the Federal University of Technology Paraná, the financial support that Coordination provided for the Improvement of Higher Education Personnel (CAPES) and the National Council for Scientific and Technological Development-CNPq.

Data Accessibility Statement
Data and models supporting the findings of this study are available from the corresponding author on request.