






Abstract
Ningbo soft soil predominantly consists of silt, which is characterized by significant thickness, high natural moisture content, low strength, and slow consolidation. When this soft soil is disturbed, it leads to surface settlement. This study examines a subway deep foundation pit in Ningbo by simulating and analyzing the entire excavation process using the finite element software PLAXIS 3D. The study investigates the lateral displacement of the supporting structure and surface subsidence trends. In addition, it discusses the effects of the diaphragm wall and supporting stiffness on the surrounding ground settlement. The findings indicate that increasing the stiffness of the diaphragm wall or support structure effectively reduces ground settlement during subway excavation. Furthermore, the study confirms that the proposed method for determining the HSS model parameters is suitable and can offer valuable insights for similar projects in Ningbo and comparable regions.
Keywords
Introduction
With the advancement of urbanization, urban transportation pressure is increasing, driving the expansion of urban spaces ( 1 ), alongside the positive capitalization effect of rail transit on real-estate value ( 2 , 3 ). As a result, urban metro systems have developed rapidly. However, metro construction involves the excavation of various deep ( 4 ) and narrow ( 5 , 6 ) foundation pits, often adjacent to existing urban structures. Excavation of deep foundation pits may cause cracking or even damage to surrounding structures ( 7 – 9 ), thus affecting their normal operation. Therefore, predicting and controlling the deformation caused by foundation pit excavation is crucial to ensuring structural safety ( 10 ).
The stress path of the soil in deep foundation pit excavation engineering involves a complex process of loading and unloading (
11
). During excavation, the removal of material from the pit causes unloading, resulting in upward elastic deformation of the soil at the pit’s bottom. Ruan et al. (
12
) used FLAC 3D finite element software and the Mohr-Coulomb constitutive model to numerically simulate the excavation process of a foundation pit supported by diaphragm walls, and thereby derived three-dimensional stress paths considering the deflection of the principal stress axis. Subsequently, they used a hollow cylinder torsional shear apparatus to conduct a series of undrained stress path tests on remolded clay samples collected from Jinan, China, to investigate the deformation characteristics of soil during excavation. Their research results indicated that the direction of the principal stress axis of the soil within the foundation pit changed significantly, and the soil near the side walls of the foundation pit was approximately in a state of axial shear, meaning that excavation would inevitably cause soil displacement toward the foundation pit and impose loads on the surrounding foundation. This leads to surface settlement outside the pit, heaving of the soil within the pit, and lateral deformation of the foundation pit support structure. The stress path at the excavation face is presented in Figure 1 for clarity. The parameter
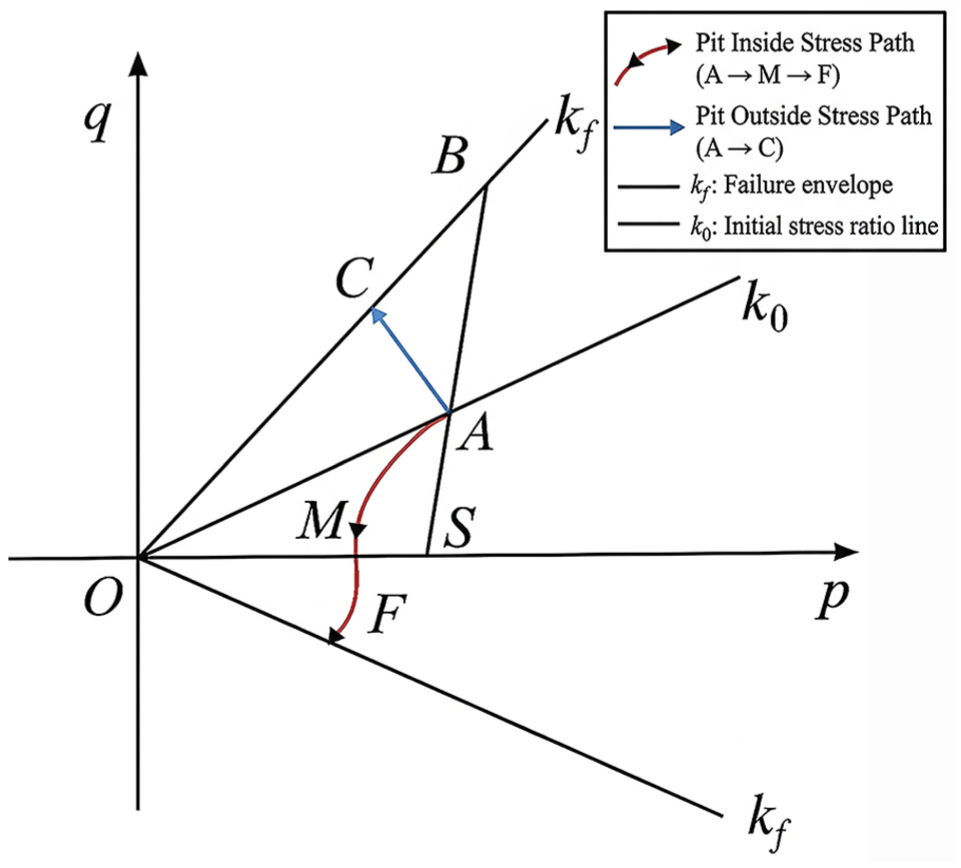
Stress path at excavation face during excavation process.
The true elastic strain range of soil is extremely limited, and as the strain amplitude increases, the soil stiffness exhibits nonlinear attenuation ( 13 ). Even at small strains, soils display highly nonlinear elastic stress–strain behavior ( 14 , 15 ). In deep foundation pit excavations, the soil typically remains in a small strain state, and its nonlinear elastic behavior is heavily influenced by factors such as stress level, stress history, void ratio, saturation, and overconsolidation ratio, which are critical soil state parameters. As the stress level increases, the soil stiffness significantly diminishes, typically following a power-law relationship ( 16 , 17 ). This nonlinear elasticity is characterized by distinct S-shaped stiffness reduction curves when soil stiffness is plotted against logarithmic strain ( 13 ). The void ratio, saturation, and over consolidation ratio all exhibit a nonlinear positive correlation with soil stiffness ( 18 ).
Compared with other types of soil, deep foundation pit excavation in high moisture content, fine-grained soil areas are typically more complex because of the higher compressibility, lower shear strength, and sensitivity, along with the moisture retention properties that characterize “soft soil.” Excavation in soft soil regions tends to cause larger surface deformations and displacements in supporting structures ( 19 – 21 ). Furthermore, soft clay, in particular, exhibits creep behavior ( 22 , 23 ), leading to ongoing displacements and deformations even after excavation is completed. Previous studies have also demonstrated that the deformation of retaining structures in deep foundation pit excavations is sensitive to the timing and method of support installation ( 24 , 25 ). This indicates that proper support conditions, construction methods, and regional engineering experience are necessary to control deformation and ensure structural safety.
Finite element analysis allows for detailed modeling of soil–structure interaction, providing a comprehensive three-dimensional view to capture the actual deformation patterns of retaining walls, the ground surface, and adjacent structures throughout all construction stages. However, standard models such as the Mohr-Coulomb model ( 26 ) or the hardening soil model ( 27 ) are insufficient to describe the abovementioned complex engineering conditions. The hardening soil small strain (HSS) model has been developed ( 17 , 28 ), which incorporates strength-related parameters, stiffness-related parameters, and small strain parameters to capture this nonlinear elasticity behavior ( 29 ). Multiple studies have consistently shown through field measurements that the use of the HSS model in finite element analysis better aligns with actual monitoring data of wall displacements and surface settlement ( 30 , 31 ).
This paper takes the Huishi Road Station project of Ningbo Metro Line 6 as a case study, establishing a three-dimensional finite element model using the HSS model in the PLAXIS 3D software. It numerically simulates the excavation of the metro deep foundation pit and the displacement changes of the underground continuous wall, analyzing the lateral deformation of the pit’s supporting structure and the surface settlement outside the pit. The simulated results are compared with the field monitoring data. This study provides a comprehensive set of HSS model parameters for the soil, offering a valuable reference for determining numerical analysis parameters for deep foundation pit engineering in soft soil areas of Ningbo. This work determined HSS model parameters applicable to a typical engineering case in the Ningbo soft soil area based on data from routine geotechnical investigation reports, identified the computational accuracy and economy of different modeling schemes in three-dimensional modeling of long-deep foundation pits through mesh convergence analysis, and conducted a correlative quantitative evaluation of the control effects of pit bottom reinforcement on wall deflection, surface settlement, and pit bottom heave.
Project Overview
The Huishi Road Station of Ningbo Metro Line 6 employs the open-cut method for construction. The total length of the foundation pit is 408 m, with a standard section width of 37.7 m and a shield section width of 28.9 m. The excavation depth varies with the geological conditions, ranging from 15.42 m to 18.66 m. Given the unfavorable factors, such as the considerable thickness of the soft soil layer and the high groundwater level, the project utilizes a combined underground continuous wall and internal bracing support system. The underground continuous wall is constructed using C35 concrete, with a thickness of 0.8 m and a depth of 41 m. The layout of the retaining structure is illustrated in Figure 2.
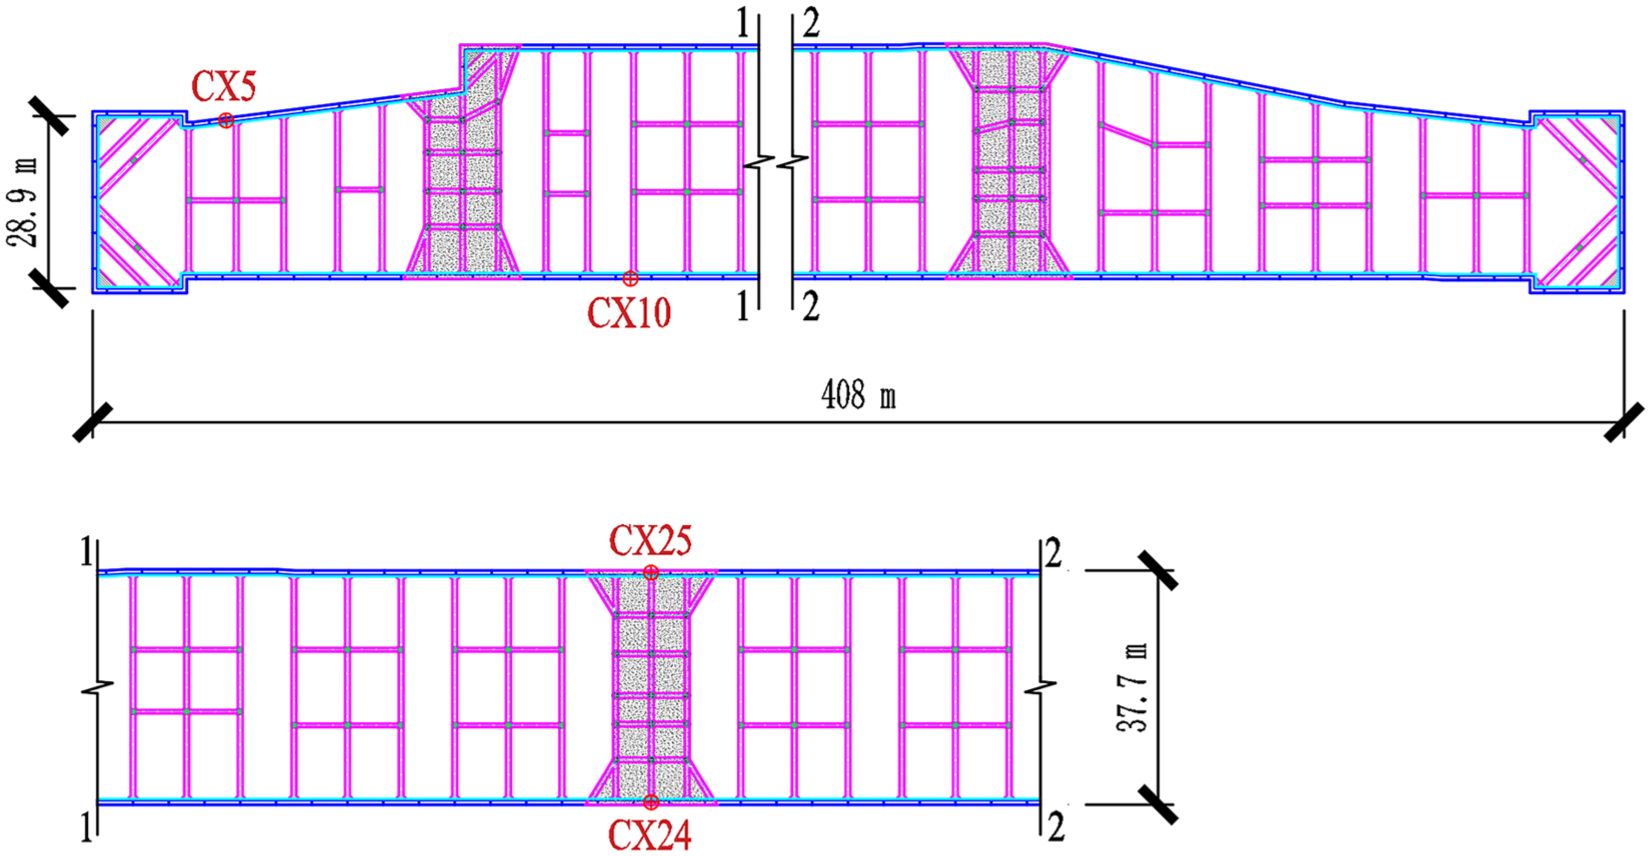
Layout plan of Huishi Road Station.
The internal bracing system of the foundation pit consists of four C30 reinforced concrete braces, with diagonal bracing at the pit’s end. As illustrated in Figure 3, the first brace uses a rectangular cross-section of 0.8 m × 1.0 m, forming an integrated force system with a 1.0 m × 1.0 m crown beam. To enhance node stiffness, a 0.5 m × 0.5 m additional reinforcement is provided at the junction between the brace and crown beam. In addition, for construction purposes, a 0.4 m thick plank bridge and a 0.3 m concrete slab brace are installed within the plane of the first brace.
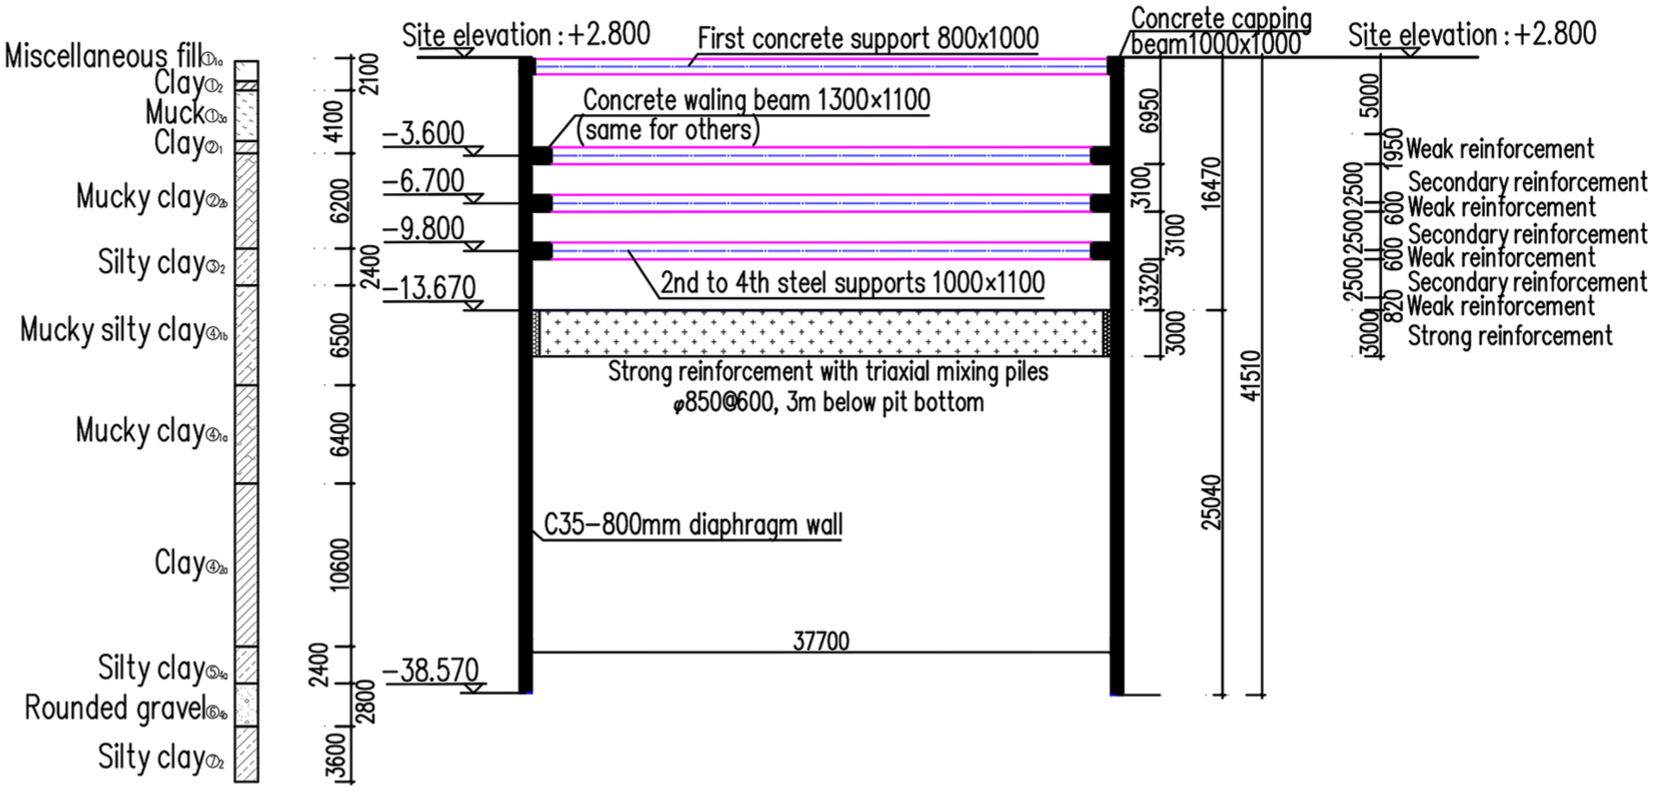
Standard section soil layer distribution and excavation pit reinforcement profile.
The second to fourth braces have a uniform cross-sectional size of 1.0 m × 1.1 m, with a waist beam cross-section of 1.3 m × 1.1 m. The standard section of the brace is 1.2 m × 0.6 m, while in areas of significant stress concentration, it is increased to 2.0 m × 1.0 m. The pit end, similarly, using diagonal braces, controls deformation at the foundation’s end.
Engineering Geological Conditions
As shown in Figure 3, the excavation depth of the foundation pit is 16.47 m. The geological conditions of the construction site are complex. The surface layer consists of Quaternary marine sedimentary soft soil, and the site soil layers can be divided into nine main engineering geological units from top to bottom. The properties of the silty clay and silty clay in the excavation range significantly influence the pit’s deformation. The physical and mechanical parameters of the primary soil layers, as summarized in Table 1, are determined based on the geotechnical investigation report provided by the survey institution for this project. In Table 1, Es1-2 denotes the compression modulus corresponding to a vertical stress range of 100–200 kPa obtained from standard one-dimensional consolidation tests, and Ko denotes the initial static lateral earth pressure coefficient. The groundwater level is 1.0 m below the ground surface, and the local confined water level fluctuates periodically with seasonal changes. Considering that dewatering during excavation could induce ground settlement around the pit, two depressurization wells and four groundwater observation wells are set outside the pit for water level monitoring and dewatering purposes. The dewatering wells are designed with complete pressure wells with depths ranging from 44 to 46 m. Dewatering will not be carried out unless absolutely necessary during the excavation phase.
Recommended Values of Physical and Mechanical Properties of Soil Layers at Huishi Road Station
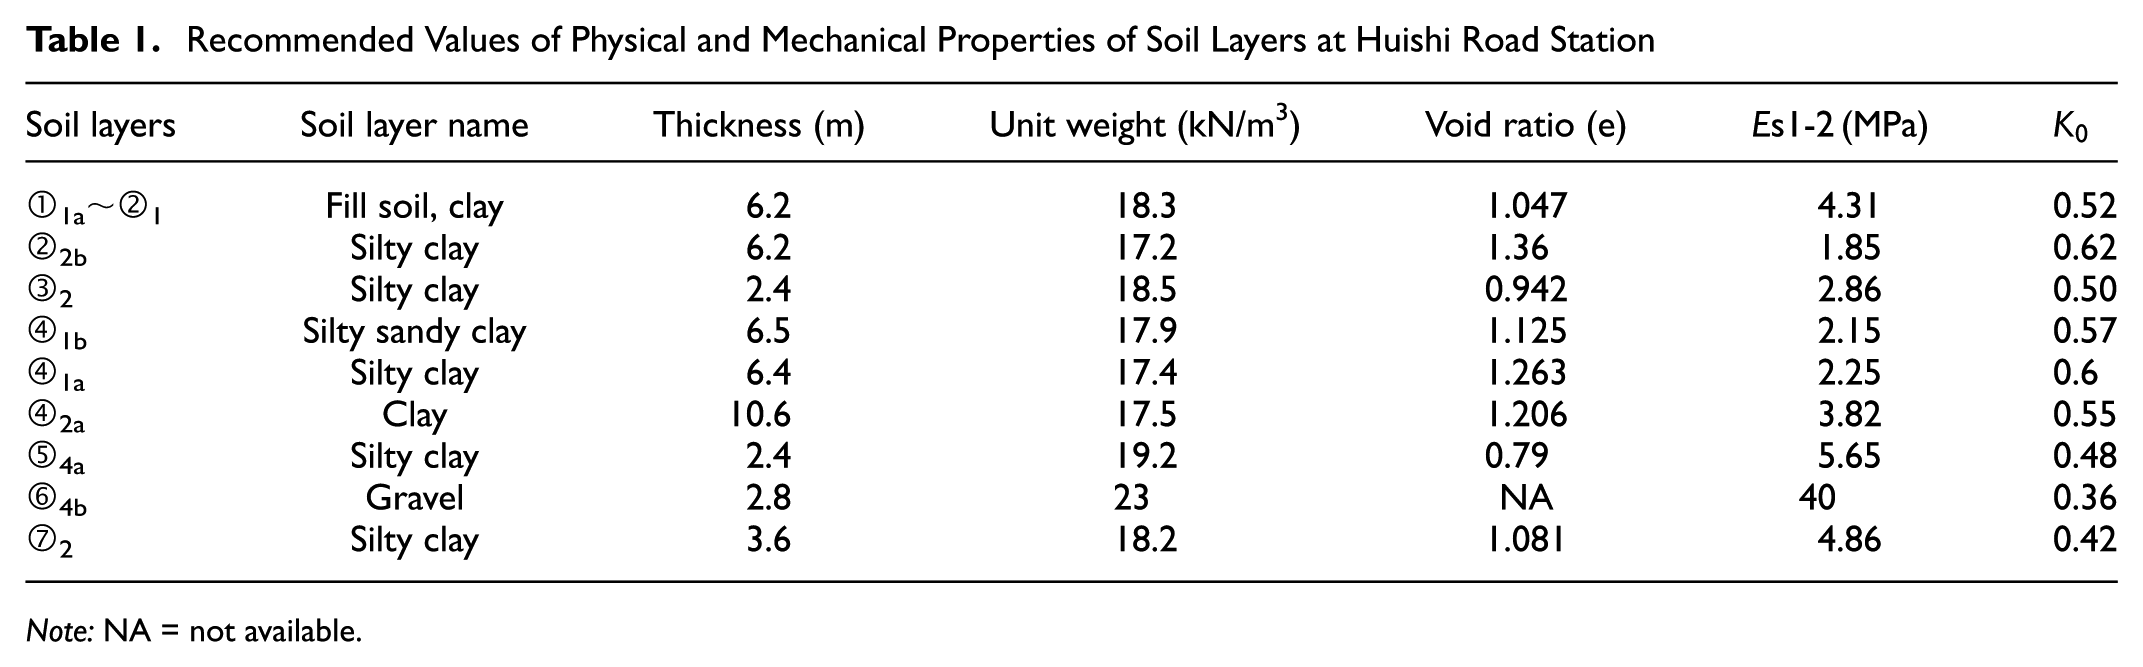
Note: NA = not available.
Overview of Foundation Pit Reinforcement
Given the presence of thick soft soil layers within the excavation area, the project employs three-axis mixing piles to reinforce the soil. The reinforcement scheme adopts a combination of “strip reinforcement + skirt edge,” where the strip reinforcement width is 3 m, with a spacing of 6 m, and the skirt edge reinforcement is arranged along the perimeter of the foundation pit with a width of 7 m.
The reinforcement range for the standard section is designed along the depth of the soil layers, as illustrated in Figure 4. To balance economic feasibility and structural stability, a zoned and graded reinforcement design is applied. Within the range from the ground surface to the bottom of the second support, a weak reinforcement with 8% cement content is used, primarily to improve the construction conditions of shallow soil layers. For the range extending 2.5 m downward from the bottom of the second to fourth supports, a moderate reinforcement with 14% cement content is applied to the skirt edge, while the strip reinforcement continues with 8% cement content, forming a combination of strong and weak reinforcement systems. The critical reinforcement zone is located 3 m below the pit bottom, where both the skirt edge and strip reinforcement use a strong reinforcement with 20% cement content, ensuring that the unconfined compressive strength of the reinforced soil reaches 1.0 MPa. This reinforcement is carried out before excavation using three-axis mixing piles. After excavation reaches the pit bottom, this reinforced zone serves as the passive zone below the excavation surface, which provides passive earth pressure resistance against the inward movement of the diaphragm wall, thereby enhancing the stability of the retaining structure.

Pit bottom reinforcement.
Finite Element Model
This study employs the PLAXIS 3D geotechnical finite element software to simulate the entire excavation process of the foundation pit. The software supports the simulation of complex engineering structures and construction conditions using various constitutive models, including the HSS model. Previous case studies have shown that the numerical results obtained from PLAXIS 3D generally align well with field measurements and empirical data ( 32 , 33 ). The software is capable of handling complex geometries and loading conditions, and effectively simulating nonlinear behavior and deformations under complex geological conditions, such as soft or hard soils ( 33 – 35 ).
Finite Element Model Overview
To account for boundary effects, the horizontal boundaries of the model are placed at a distance of five times the excavation depth from the edge of the foundation pit, while the vertical boundaries are set at three times the excavation depth. The final model dimensions are determined to be 600 m (length) × 300 m (width) × 66 m (depth), as presented in Figure 5.
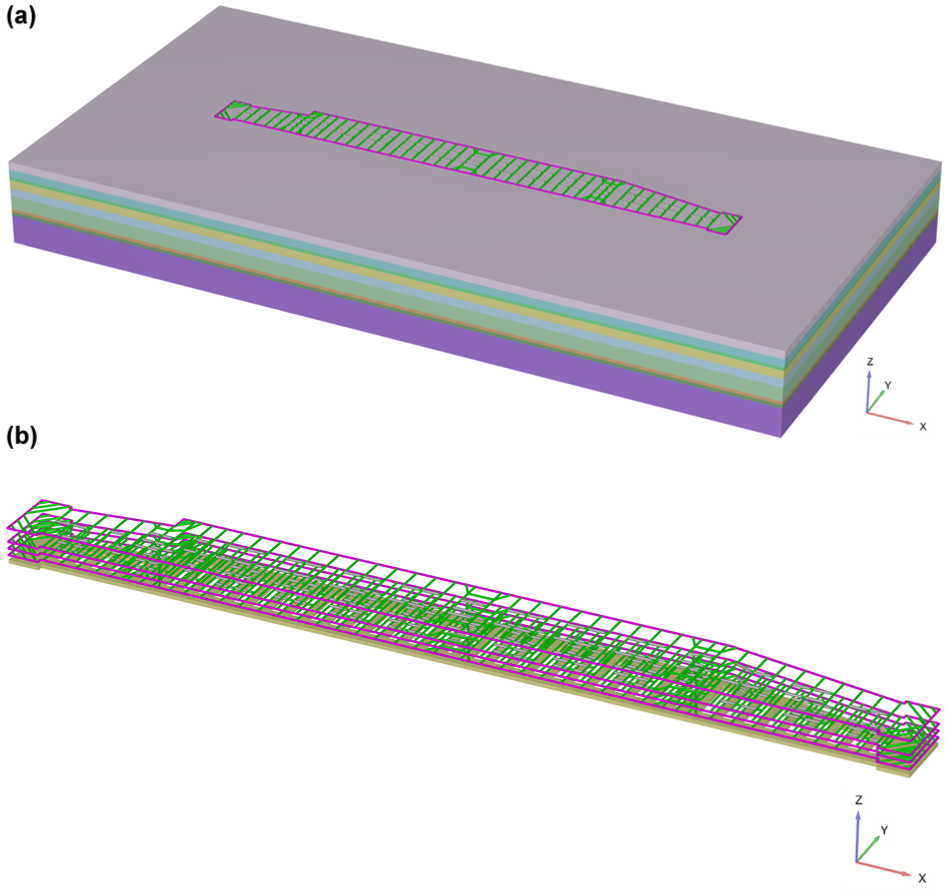
Excavation pit model: (a) excavation model, and (b) support structure and enhanced reinforcement at pit bottom.
In the established model, 10-node tetrahedral elements are used to simulate the soil, 6-node triangular plate elements are used for the underground continuous walls, and 3-node beam elements are used for the concrete supports. To improve computational accuracy and control the scale of the model, a gradually varying mesh refinement strategy is adopted. This involves densifying the mesh near the diaphragm wall, with the mesh size gradually increasing as the distance from the foundation pit increases. The vertical support function of the frame columns is implemented by applying vertical displacement constraints. Interface elements are placed between the soil and diaphragm wall to simulate their interaction.
Model Parameter Selection
Considering the soft soil geological conditions of the project, which exhibit distinct small strain characteristics during foundation pit excavation, the HSS model is chosen as the constitutive model for the soil. This model introduces new parameters and algorithms that constrain the secondary elastic stiffness within the elastic range of the basic elastic–plastic hardening soil model ( 13 , 36 ), taking into account the rapid decay of the soil’s shear modulus with increasing strain within the small strain range ( 37 , 38 ). This makes it suitable for deformation analysis of foundation pits in sensitive environments.
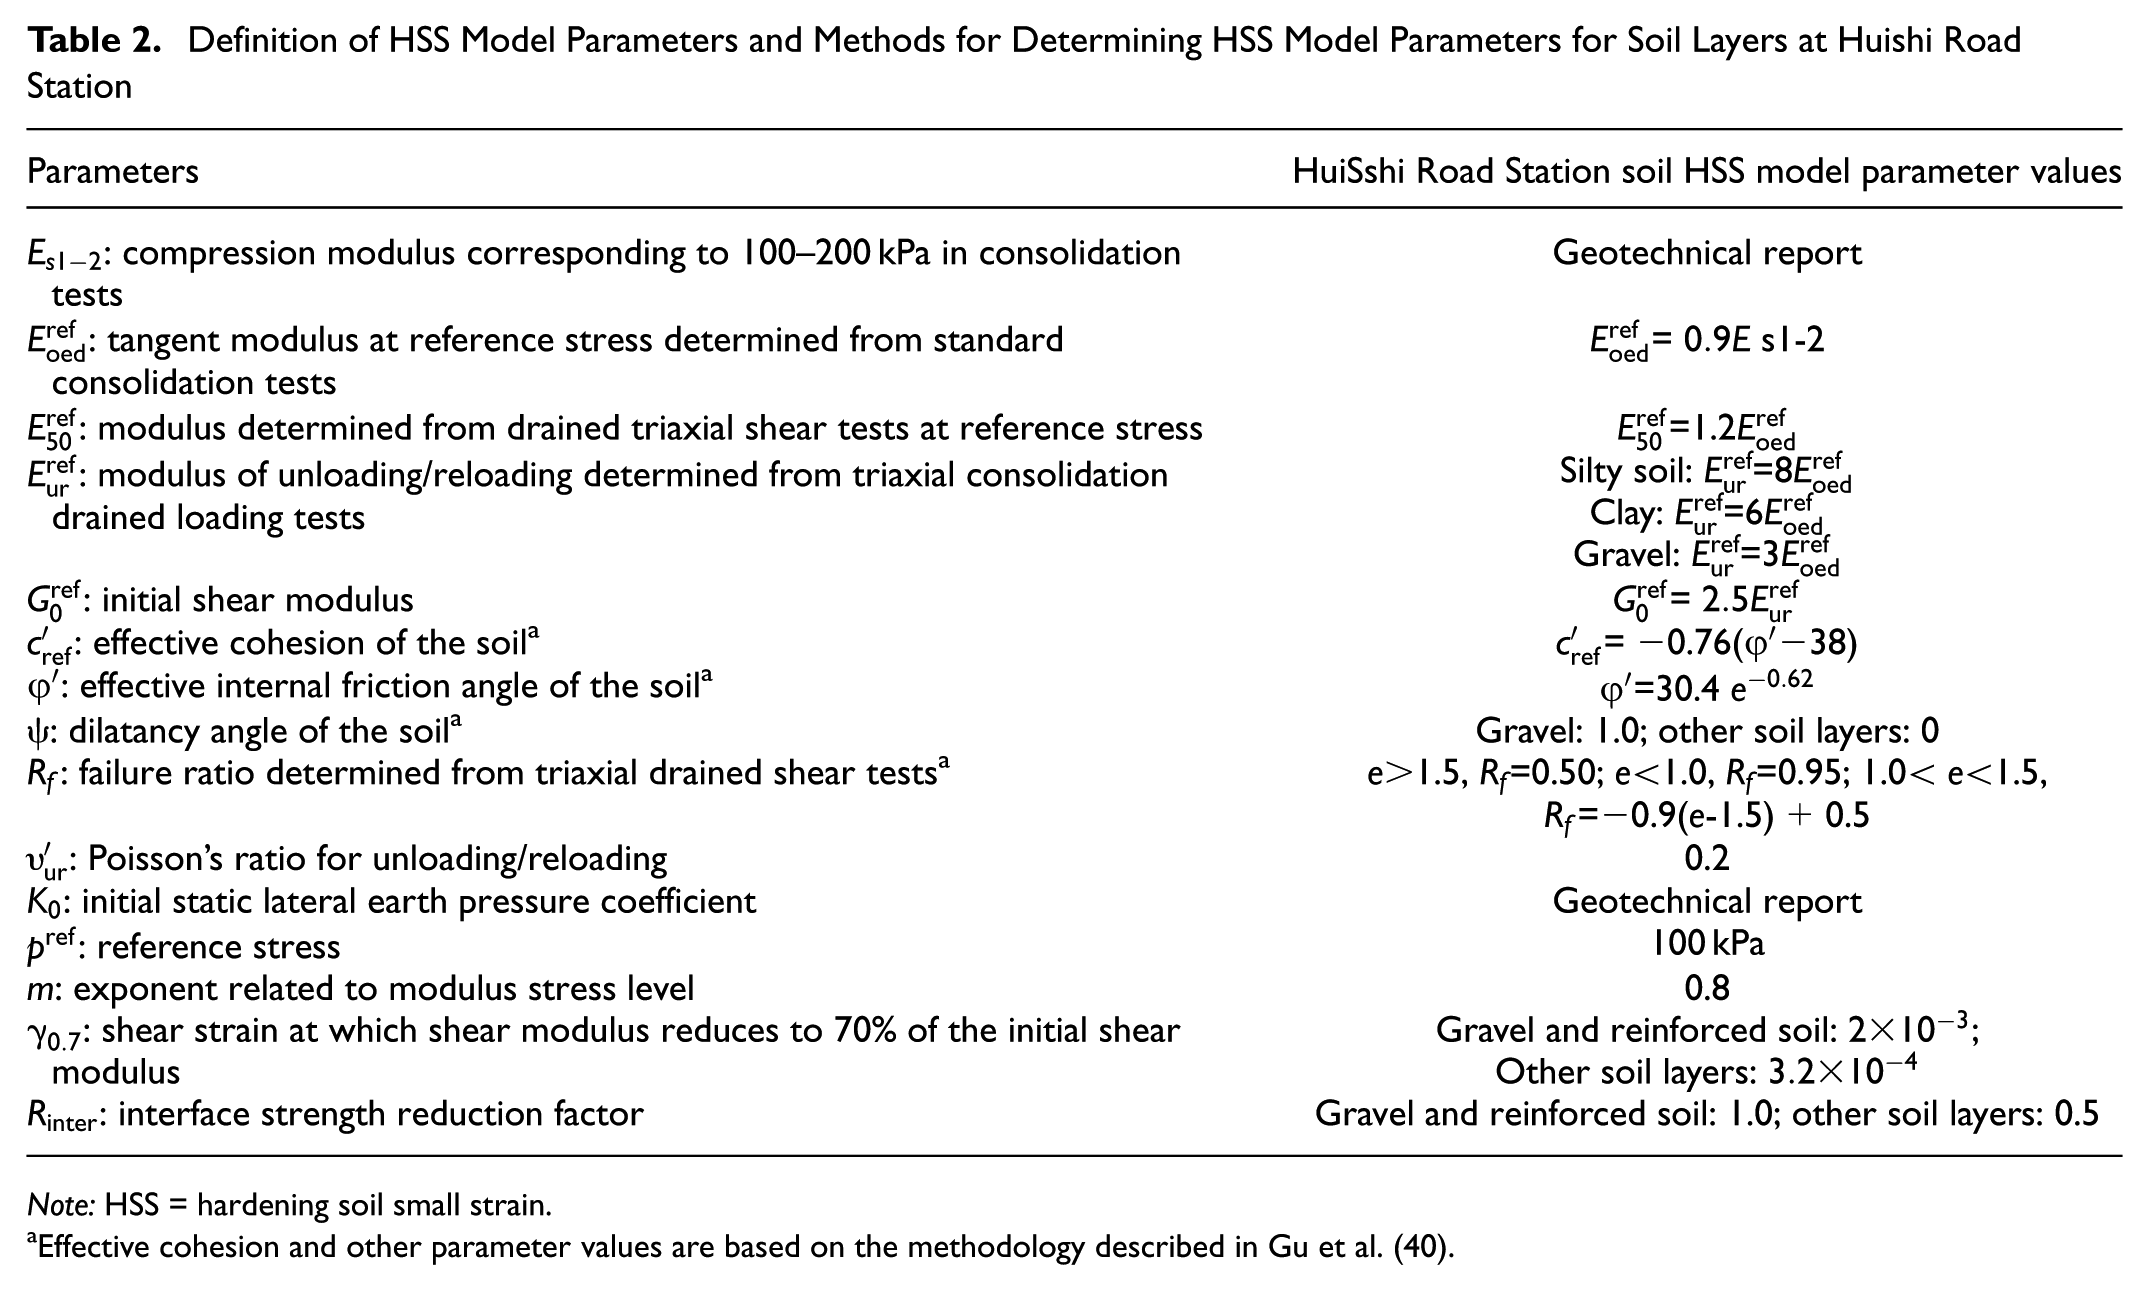
The HSS model for the soil includes numerous parameters related to modulus (as provided in Table 2). In actual engineering, determining each parameter through experiments presents significant challenges. Currently, most studies attempt to establish relationships between the parameters and the compression modulus
Definition of HSS Model Parameters and Methods for Determining HSS Model Parameters for Soil Layers at Huishi Road Station
Note: HSS = hardening soil small strain.
Effective cohesion and other parameter values are based on the methodology described in Gu et al. (40).
For the basic parameters of the HSS model in PLAXIS 3D, the values in this study are determined by combining the geotechnical investigation report of the foundation pit project and relevant engineering experience from Ningbo. This study primarily focuses on the impact of the foundation pit excavation process on the surrounding environment, with an emphasis on short-term effects. Therefore, the soil in the model is assumed to exhibit undrained behavior, and the soil layer parameters are selected as presented in Table 3.
HSS Model Parameters of Soil
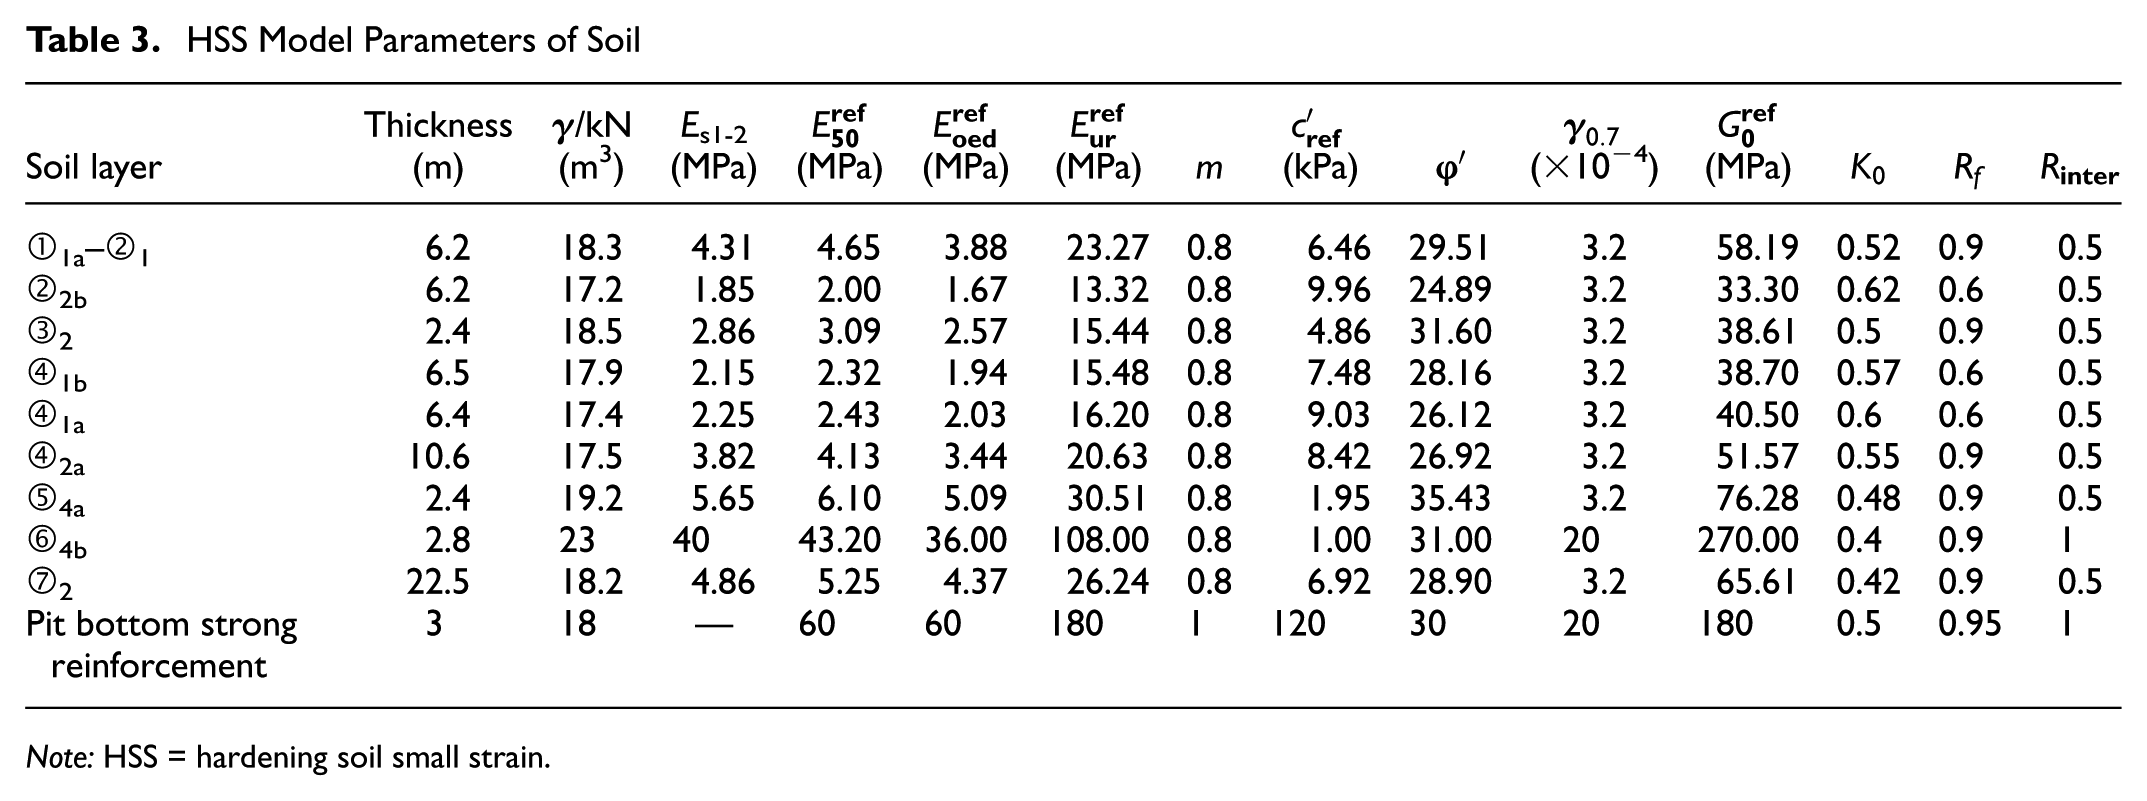
Note: HSS = hardening soil small strain.
The parameters for the reinforced soil in the passive zone below the pit bottom (the 3 m-thick zone reinforced before excavation, as described in the section “Engineering Geological Conditions”) are derived from the results of onsite static cone penetration tests, combined with conversion values from some empirical formulas (
41
,
42
). According to empirical relationships, the
In this analysis model, the thickness of the continuous wall is 0.8 m, and the continuous wall is modeled using a linear elastic model. As the excavation depth increases, the bending moment exerted on the continuous wall also increases. When the concrete on the tensile side exceeds its tensile strength, cracking occurs, leading to a reduction in the stiffness of the continuous wall. According to Hsieh’s study (
44
), for foundation pits with excavation depths between 10 and 20 m, the elastic modulus of the concrete can be reduced to 75% to 80% of its original value for analysis. Therefore, in this study, the elastic modulus of the continuous wall is taken as 75% of the C35 concrete (with an elastic modulus of 3.15×10⁷ kN/m2), that is,
According to Duan’s research (
45
), for horizontal supports, considering adverse factors such as concrete shrinkage, creep, and cracking, the elastic modulus of the supports can be reduced to 80% of its original value. Thus, in this study, the elastic modulus of the support is taken as 80% of the C30 concrete (with an elastic modulus
Construction Process Simulation
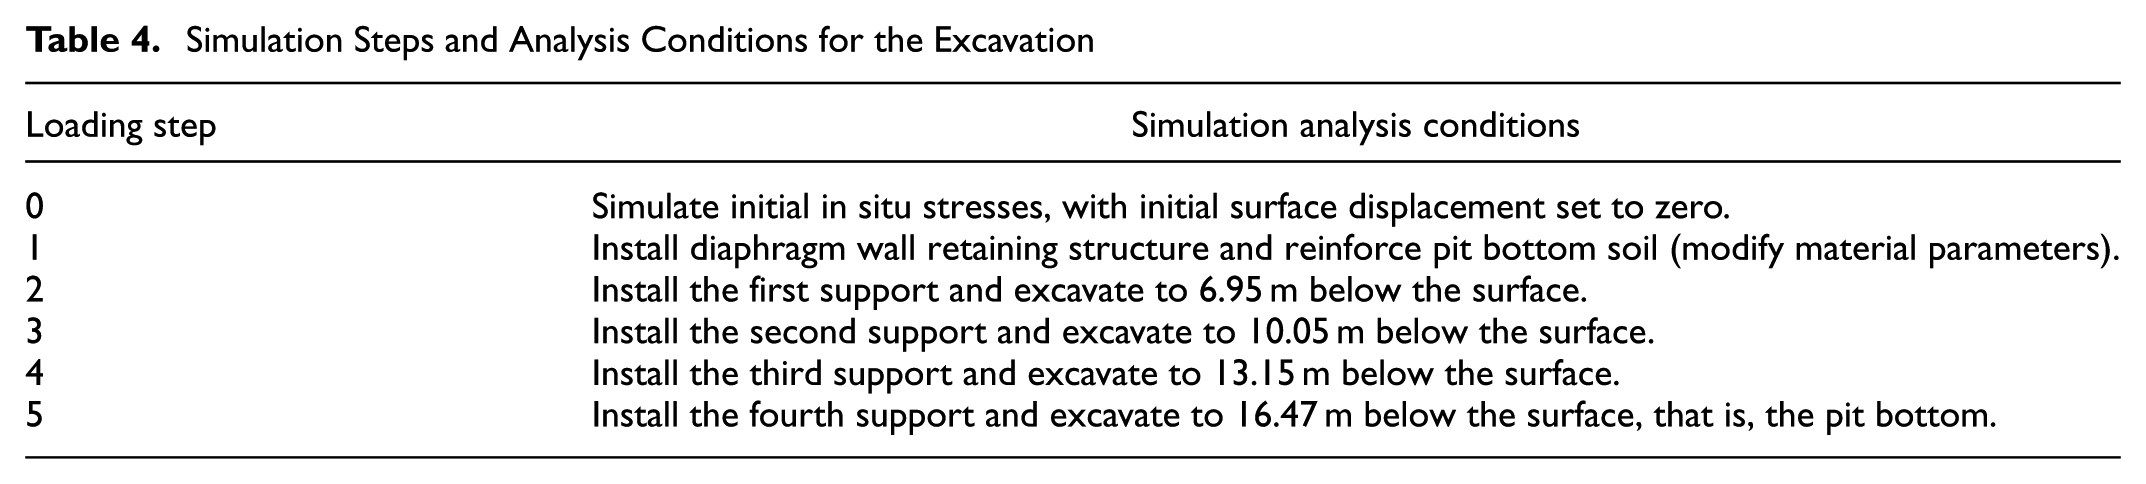
To accurately reflect the stress and displacement changes during the excavation of deep foundation pits, it is essential to consider the sequential, path-dependent, and nonlinear nature of the excavation process. The finite element simulation method divides the excavation process into multiple steps, with each step representing the removal of a stress-bearing material layer from the structure, thereby considering the spatial and temporal effects of excavation. For simplicity, the disturbance to the soil and the segmented excavation during the construction process are not considered; instead, the soil layers are removed all at once during each excavation step. Throughout the excavation, the groundwater level outside the pit remains unchanged, while the groundwater level inside the pit is lowered to the excavation face. Following the “first support, then excavation” method used in open-cut construction, the excavation is simulated in six steps, as listed in Table 4.
Simulation Steps and Analysis Conditions for the Excavation
Mesh Convergence Analysis
During mesh generation in the PLAXIS 3D CE V20 Update Input software, four meshing schemes were used to conduct a sensitivity analysis of mesh convergence parameters, to evaluate the influence of mesh density and parameter differences on the numerical results, and to determine a mesh scheme that achieves a balance between computational accuracy and efficiency in engineering applications. A total of four schemes preset in the PLAXIS 3D CE V20 Update Input software were considered, namely, coarse, medium, fine, and very fine. The parameters corresponding to each scheme and the resulting numbers of generated elements and nodes are presented in Table 5.
Mesh Configuration Parameters for Convergence Analysis
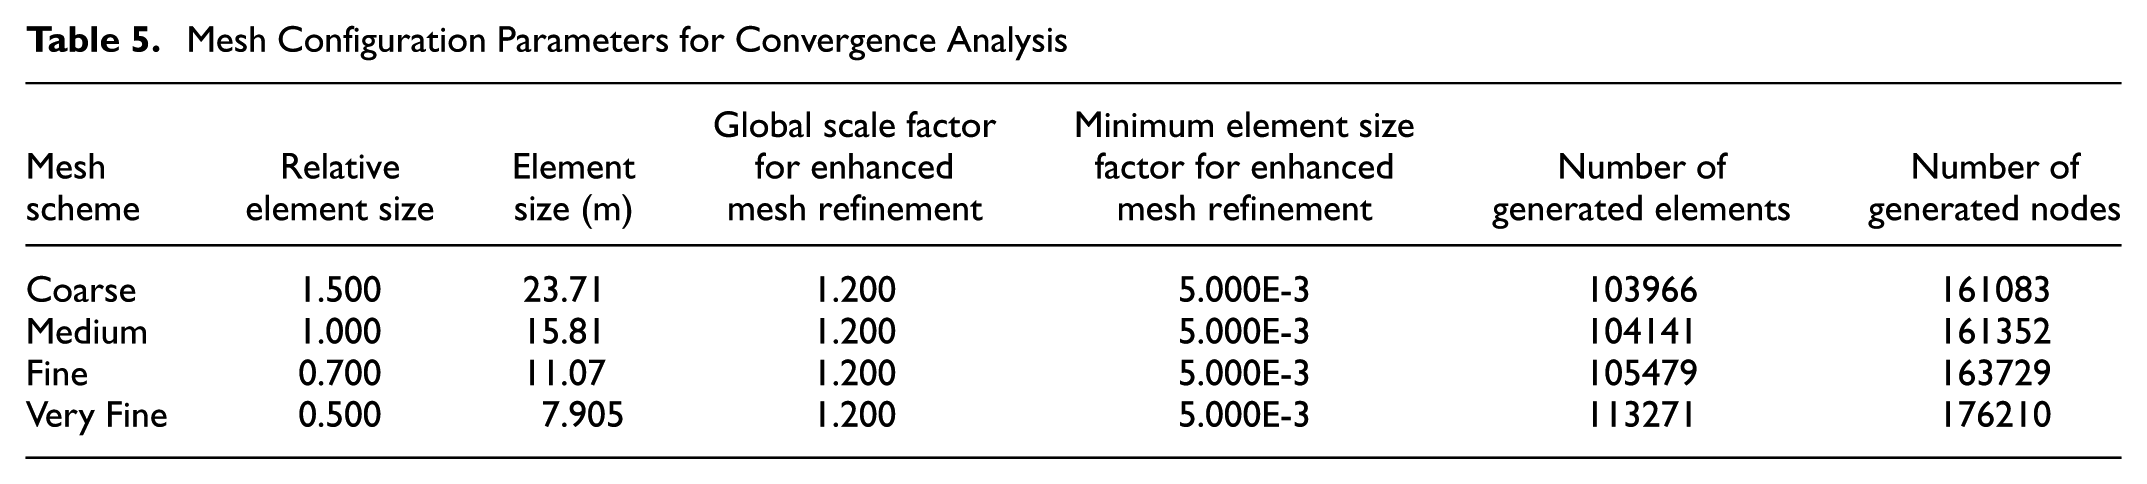
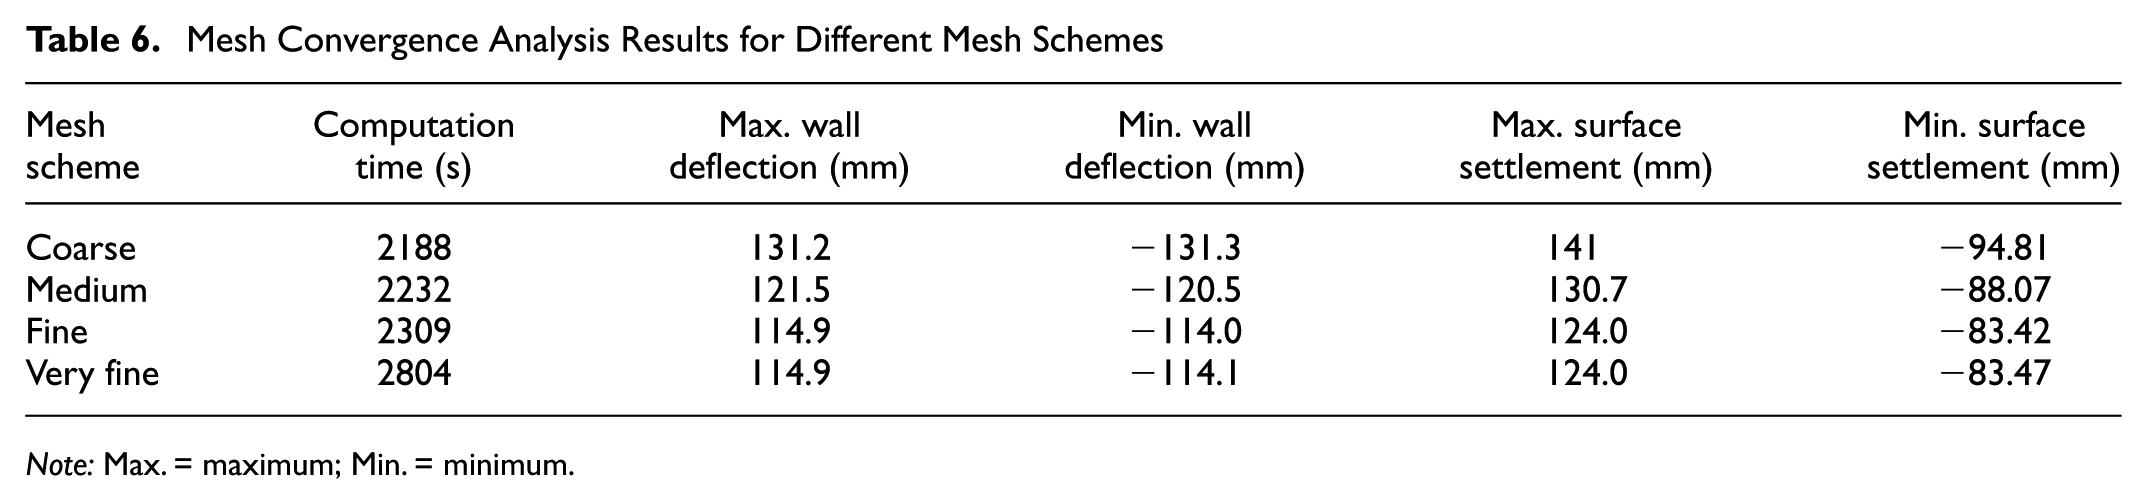
All mesh schemes were applied to the complete excavation sequence described in the section “Construction Process Simulation.” The results were extracted at the final excavation stage (Stage 5), with the maximum wall deflection and maximum surface settlement taken as the objects of the parameter sensitivity analysis. The software computation results obtained on a personal laptop with an 11th Gen Intel Core i7-11800H platform are provided in Table 6.
Mesh Convergence Analysis Results for Different Mesh Schemes
Note: Max. = maximum; Min. = minimum.
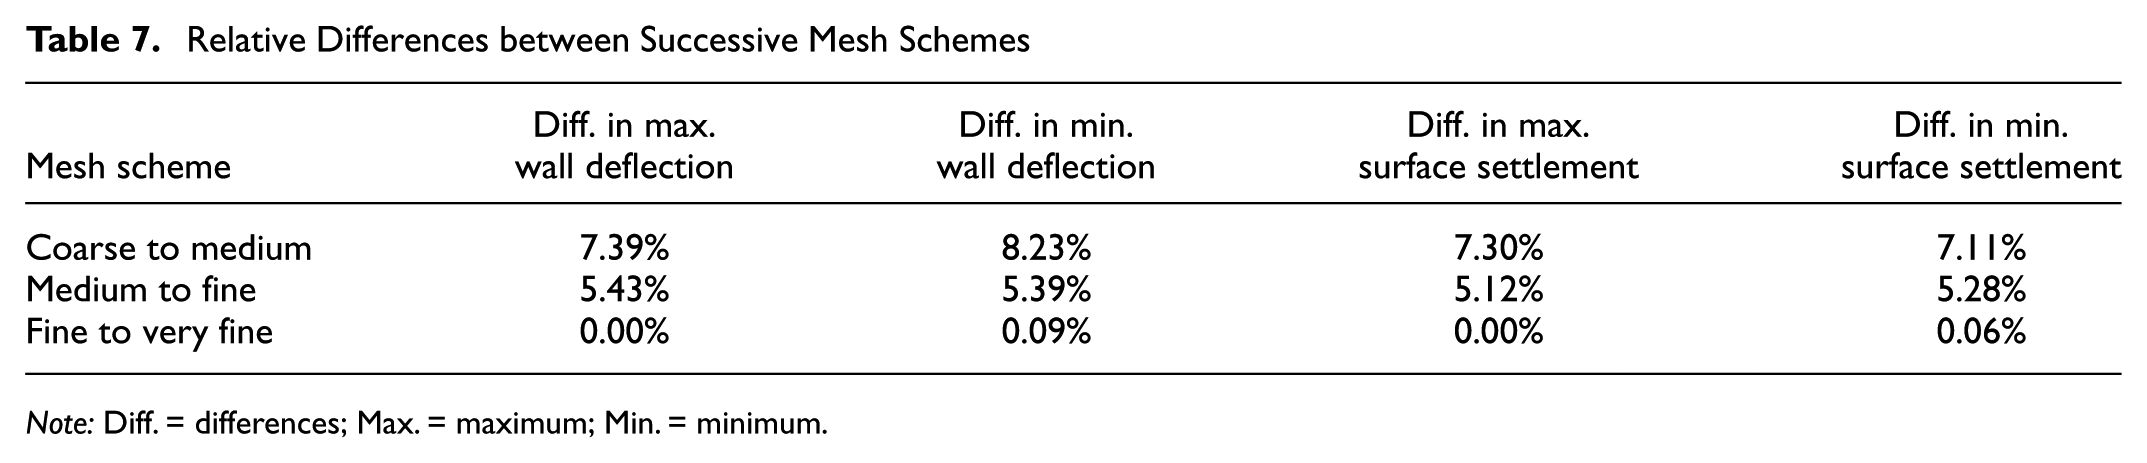
The relative differences between the results of different mesh schemes in Table 6 were calculated using

where
Relative Differences between Successive Mesh Schemes
Note: Diff. = differences; Max. = maximum; Min. = minimum.
As shown in Tables 6 and 7, the numerical results exhibit a trend of converging toward the same values as the mesh density increases, while the required computation time also increases. The relative differences between the coarse mesh scheme and the medium mesh scheme range from 7.11% to 8.23%. The relative differences between the medium mesh scheme and the fine mesh scheme range from 5.12% to 5.43%. From the fine to the very fine scheme, the relative differences of all evaluated parameters are less than 0.1%.
It can be observed that in all results across all three comparisons, the differences in wall deformation results are slightly larger than those in surface deformation results. This indicates that in this work, changes in the Relative Element size and Element size parameters of the mesh settings have a slightly greater influence on the numerical simulation results of wall deformation than on those of surface deformation. In addition, it is worth noting that the computation time increased from 2,309 s for the Fine scheme to 2,804 s for the Very Fine scheme, an increase of approximately 21.4%, yet the results can be said to have virtually no change. This means that blindly selecting the finest mesh scheme in such work is uneconomical in relation to computational resource cost.
The subsequent analyses in this paper adopt the numerical computation results of the coarse mesh scheme, which is often the most economical in relation to computational resource cost in practical engineering applications. Moreover, in this work, the coarse mesh scheme yields larger wall deflection and surface settlement magnitudes compared with the finer mesh schemes, meaning the numerical simulation results are more inclined toward conservative estimation.
Numerical Simulation Results and Comparison with Measured Results
Field Monitoring Scheme
To validate the numerical simulation results, field monitoring data were collected throughout the entire foundation pit excavation process. The monitoring system was designed and implemented before excavation in accordance with the relevant Chinese technical standards for the monitoring of building foundation pit engineering, as listed in supplementary material Appendix A. The monitored items relevant to this work include the lateral displacement of the diaphragm wall, the ground surface settlement outside the pit, and the settlement at the pit bottom.
The monitoring points for horizontal displacement and settlement of the retaining wall were shared, with a spacing of approximately 20 to 25 m, and were located on the same cross-sections as the inclinometer boreholes. The points were arranged on the top of the diaphragm wall around the entire foundation pit, with their positions corresponding to the inclinometer boreholes. The monitoring points for horizontal displacement of the retaining wall were marked by inclinometer boreholes installed within the retaining structure at a longitudinal spacing of approximately 20 to 25 m along the foundation pit, ensuring that each excavation segment contained an inclinometer borehole. For ground surface settlement, one measurement section was established for each excavation segment, with at least one set of measurement sections on each side or per excavation segment, at a spacing of approximately 20 to 25 m. For settlement monitoring, a leveling instrument with a round-trip mean square error of less than 1 mm/km was used. For deep horizontal displacement of the retaining wall, inclinometers and automated inclinometer equipment were employed, with an overall accuracy better than 0.25 mm/m.
During the excavation phase, the monitoring frequency during earthwork excavation was once per day, and the frequency was increased to three times per day within 24 h from the completion of earthwork excavation to the completion of the cushion layer. The initial readings for all instruments were taken after the installation of the diaphragm wall and before the commencement of excavation, and all subsequent measurements represent the cumulative deformation relative to these initial readings.
Comparison of Lateral Displacement of the Retaining Structure
By simulating the excavation steps, the calculated lateral displacement values at monitoring points CX5, CX10, CX24, and CX25 (Figure 2) are extracted and compared with the measured values.
Figure 6 shows the comparison of the horizontal displacement of the diaphragm wall at monitoring points CX5, CX10, CX24, and CX25 as the excavation progresses to different depths. The wall bulges inward toward the foundation pit, forming a parabolic shape, which is consistent with previous research findings ( 46 – 48 ). From the comparison between the measured and simulated values, it can be seen that the maximum lateral displacement of the retaining structure at different excavation stages is generally consistent. However, the simulated results exhibit a deviation pattern of overestimation in the early stages and underestimation in the later stages relative to the measured results. During the shallow excavation stages, the HSS model may underestimate the soil stiffness at the small strain stage, or the effect of strut pre-loading in actual construction may be better than the simulation assumptions, resulting in simulated displacements slightly larger than the measured values. During the deep excavation stages, the measured displacements are significantly larger than the simulated values, which may be caused by the soil progressively entering the large strain stage as the excavation depth increases, and the yield surface of the HSS model may insufficiently capture the soil softening behavior in this range.
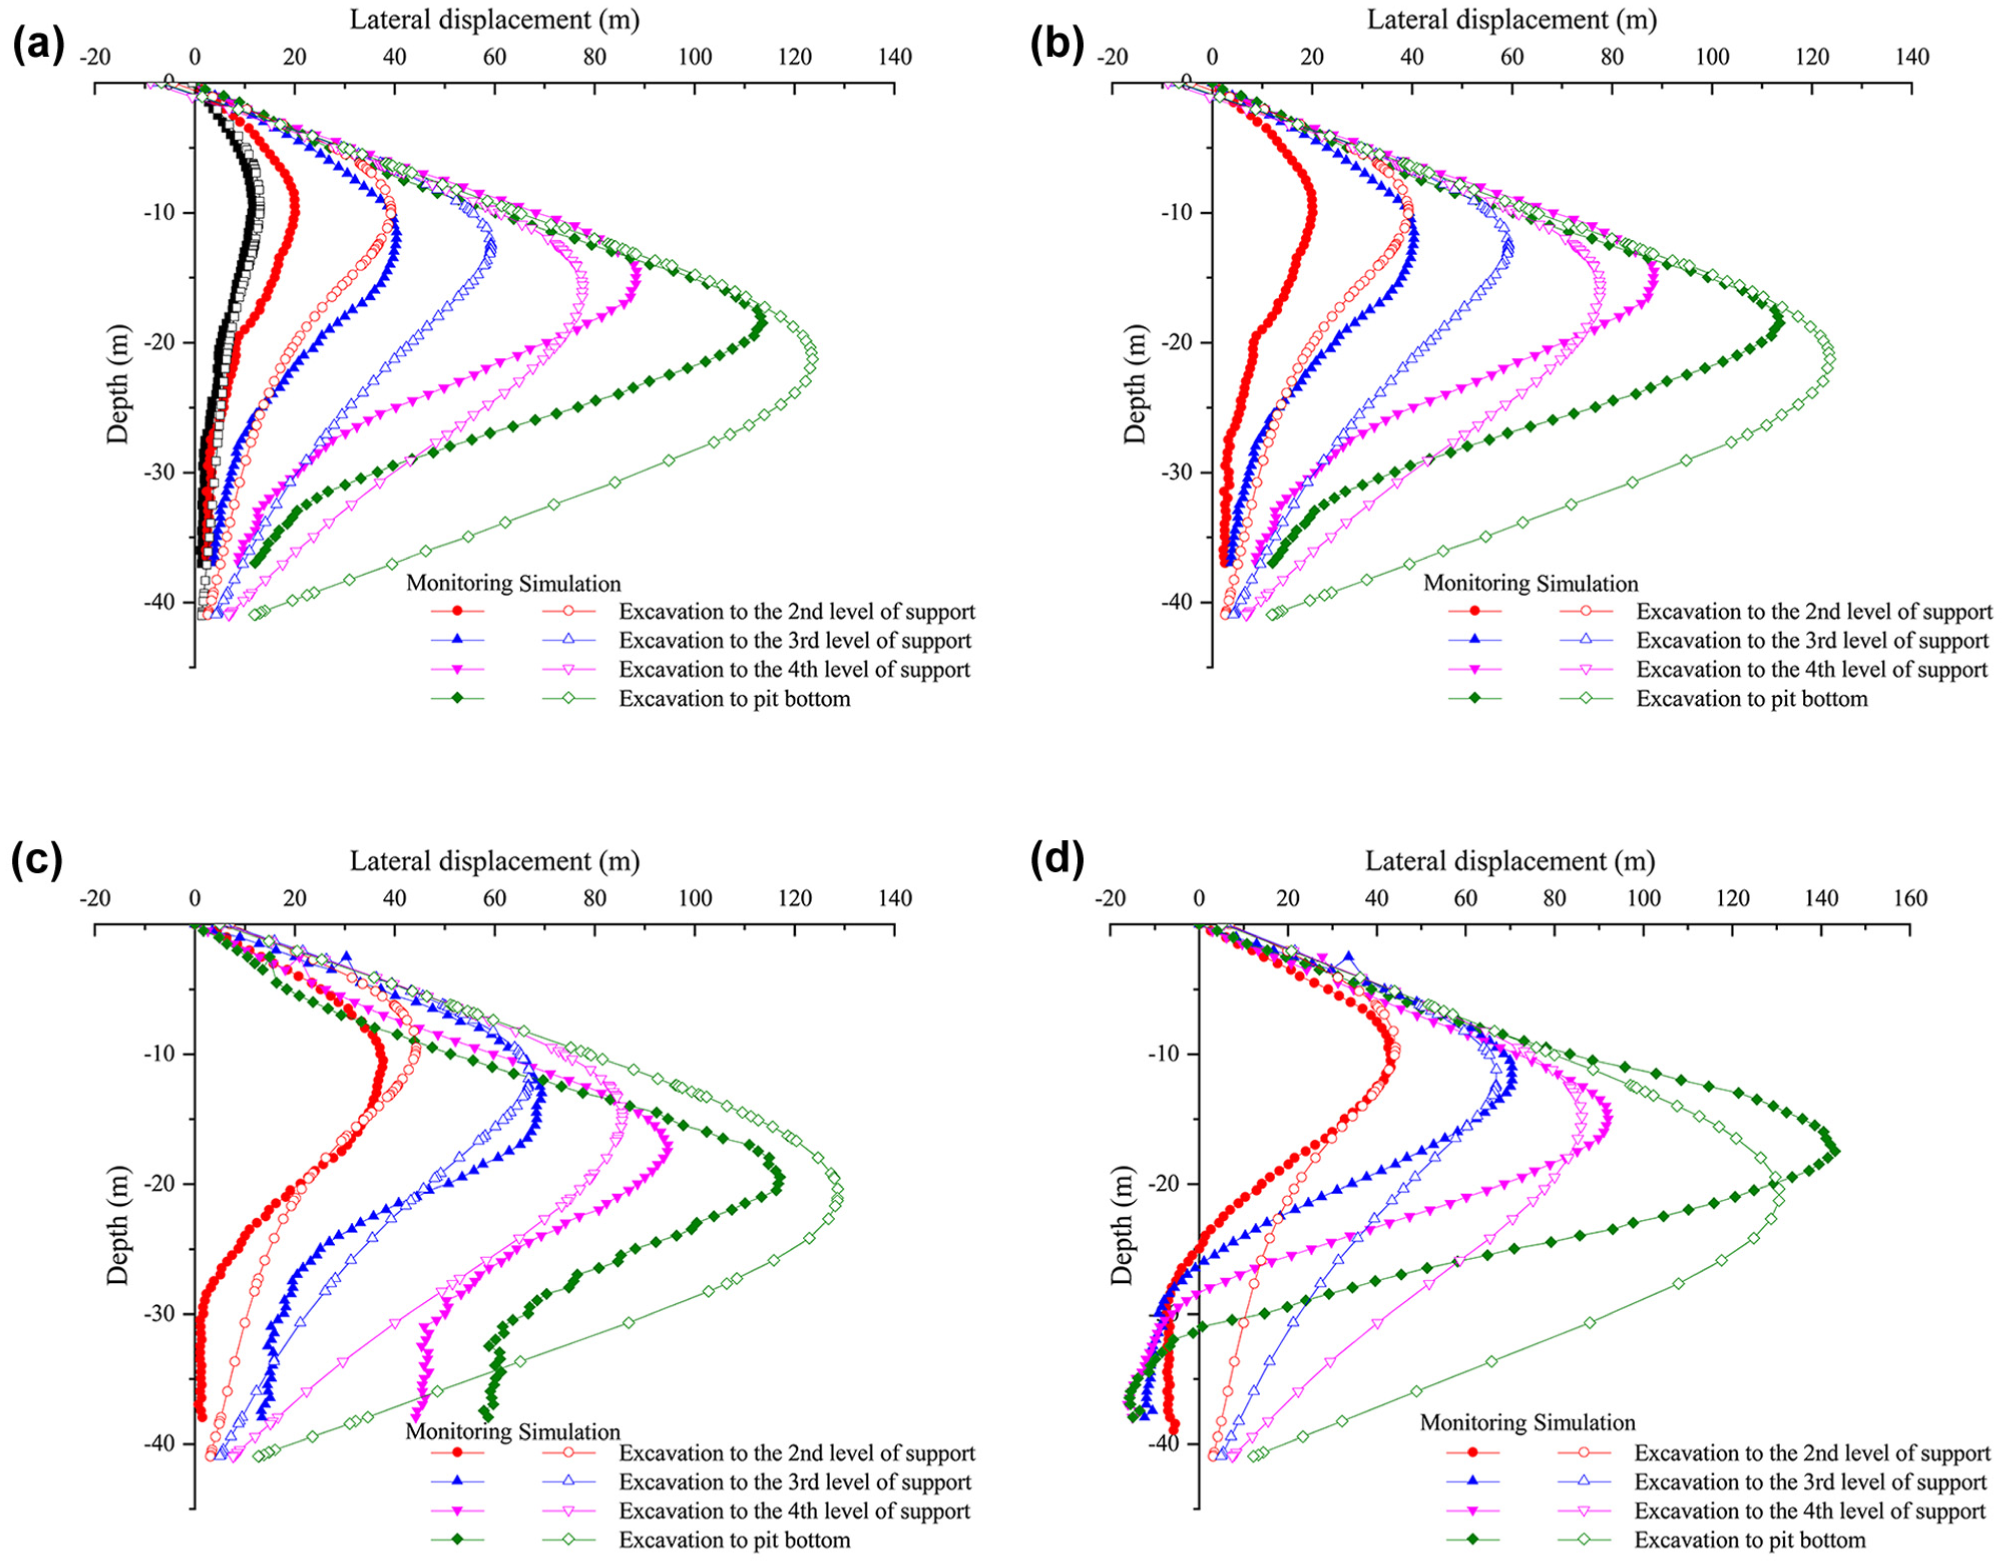
Lateral displacement curves of diaphragm wall: (a) lateral displacement of diaphragm wall at measuring point CX5, (b) lateral displacement of diaphragm wall at measuring point CX10, (c) lateral displacement of diaphragm wall at measuring point CX24, and (d) lateral displacement of diaphragm wall at measuring point CX25.
During the excavation process, the measured maximum lateral displacement of the diaphragm wall at monitoring point CX5, which is close to the end, was 92.97 mm, occurring at a corresponding depth of −18.5 m, while the maximum lateral displacement in the simulation results was 72.22 mm, occurring at a corresponding depth of −21.3 m. The deviation of the simulated maximum lateral displacement relative to the actual monitored maximum lateral displacement value was 22.3%. At the depth of −18.5 m where the measured maximum lateral displacement occurred, the simulated lateral displacement of the diaphragm wall at this location obtained through linear interpolation of the simulation results was approximately 70.26 mm, and the deviation of this value relative to the measured value was 24.4%.
The measured maximum lateral displacement of the diaphragm wall at monitoring point CX10 was 113.72 mm, occurring at a corresponding depth of −18.5 m, while the maximum lateral displacement in the simulation results was 123.78 mm, occurring at a corresponding depth of −21.3 m. The deviation of the simulated maximum lateral displacement relative to the actual monitored maximum lateral displacement value was 8.8%. At the depth of −18.5 m where the measured maximum lateral displacement occurred, the simulated lateral displacement of the diaphragm wall at this location obtained through linear interpolation of the simulation results was approximately 118.93 mm, and the deviation of this value relative to the measured value was 4.6%.
Monitoring points CX24 and CX25 are located on the two sides of the middle part of the foundation pit, respectively. It can be found that from the end of the foundation pit to the middle of the foundation pit, both the measured maximum lateral displacement and the simulated maximum lateral displacement of the diaphragm wall increase, with the maximum lateral displacement of the diaphragm wall being the smallest at the monitoring points at the end. Among them, the middle monitoring point CX25 has the largest measured lateral displacement of the diaphragm wall of 143.29 mm (occurring at a depth of −17.5 m) and the largest simulated value of 130.72 mm (occurring at a depth of −20.4 m). The deviation of the simulated maximum lateral displacement relative to the actual monitored maximum lateral displacement value was 8.8%. At the depth of −17.5 m where the measured maximum lateral displacement occurred, the simulated lateral displacement of the diaphragm wall at this location obtained through linear interpolation of the simulation results was approximately 124.71 mm, and the deviation of this value relative to the measured value was 13.0%. The measured maximum lateral displacement of the diaphragm wall at monitoring point CX24 was 117.21 mm, occurring at a corresponding depth of −19.5 m, while the maximum lateral displacement in the simulation results was 128.78 mm, occurring at a corresponding depth of −20.4 m. The deviation of the simulated maximum lateral displacement relative to the actual monitored maximum lateral displacement value was 9.9%. At the depth of −19.5 m where the measured maximum lateral displacement occurred, the simulated lateral displacement of the diaphragm wall corresponding to this depth was 128.00 mm, and the deviation of this value relative to the measured value was 9.2%. By observing the deviations between the measured values and simulated values at the four monitoring points, it can be found that the simulation accuracy of the model for the maximum lateral displacement of the diaphragm wall in the middle region of the foundation pit is better than that in the end region.
Comparison of Ground Surface Settlement Displacement
Figure 7 shows the comparison between the simulated ground surface settlement values during the excavation process and the corresponding measured values at specific monitoring points. The largest value of surface settlement outside the pit among all monitoring points was 26.42 mm, located at monitoring point CX5 at a distance of 12 m from the pit edge, slightly larger than 25.56 mm at monitoring point CX10 at a distance of 42 m from the pit edge, 25.43 mm at monitoring point CX25 at a distance of 32 m from the pit edge, and 25.28 mm at monitoring point CX24 at a distance of 7 m from the pit edge. The measured maximum settlement values at the four monitoring points are very close to each other.
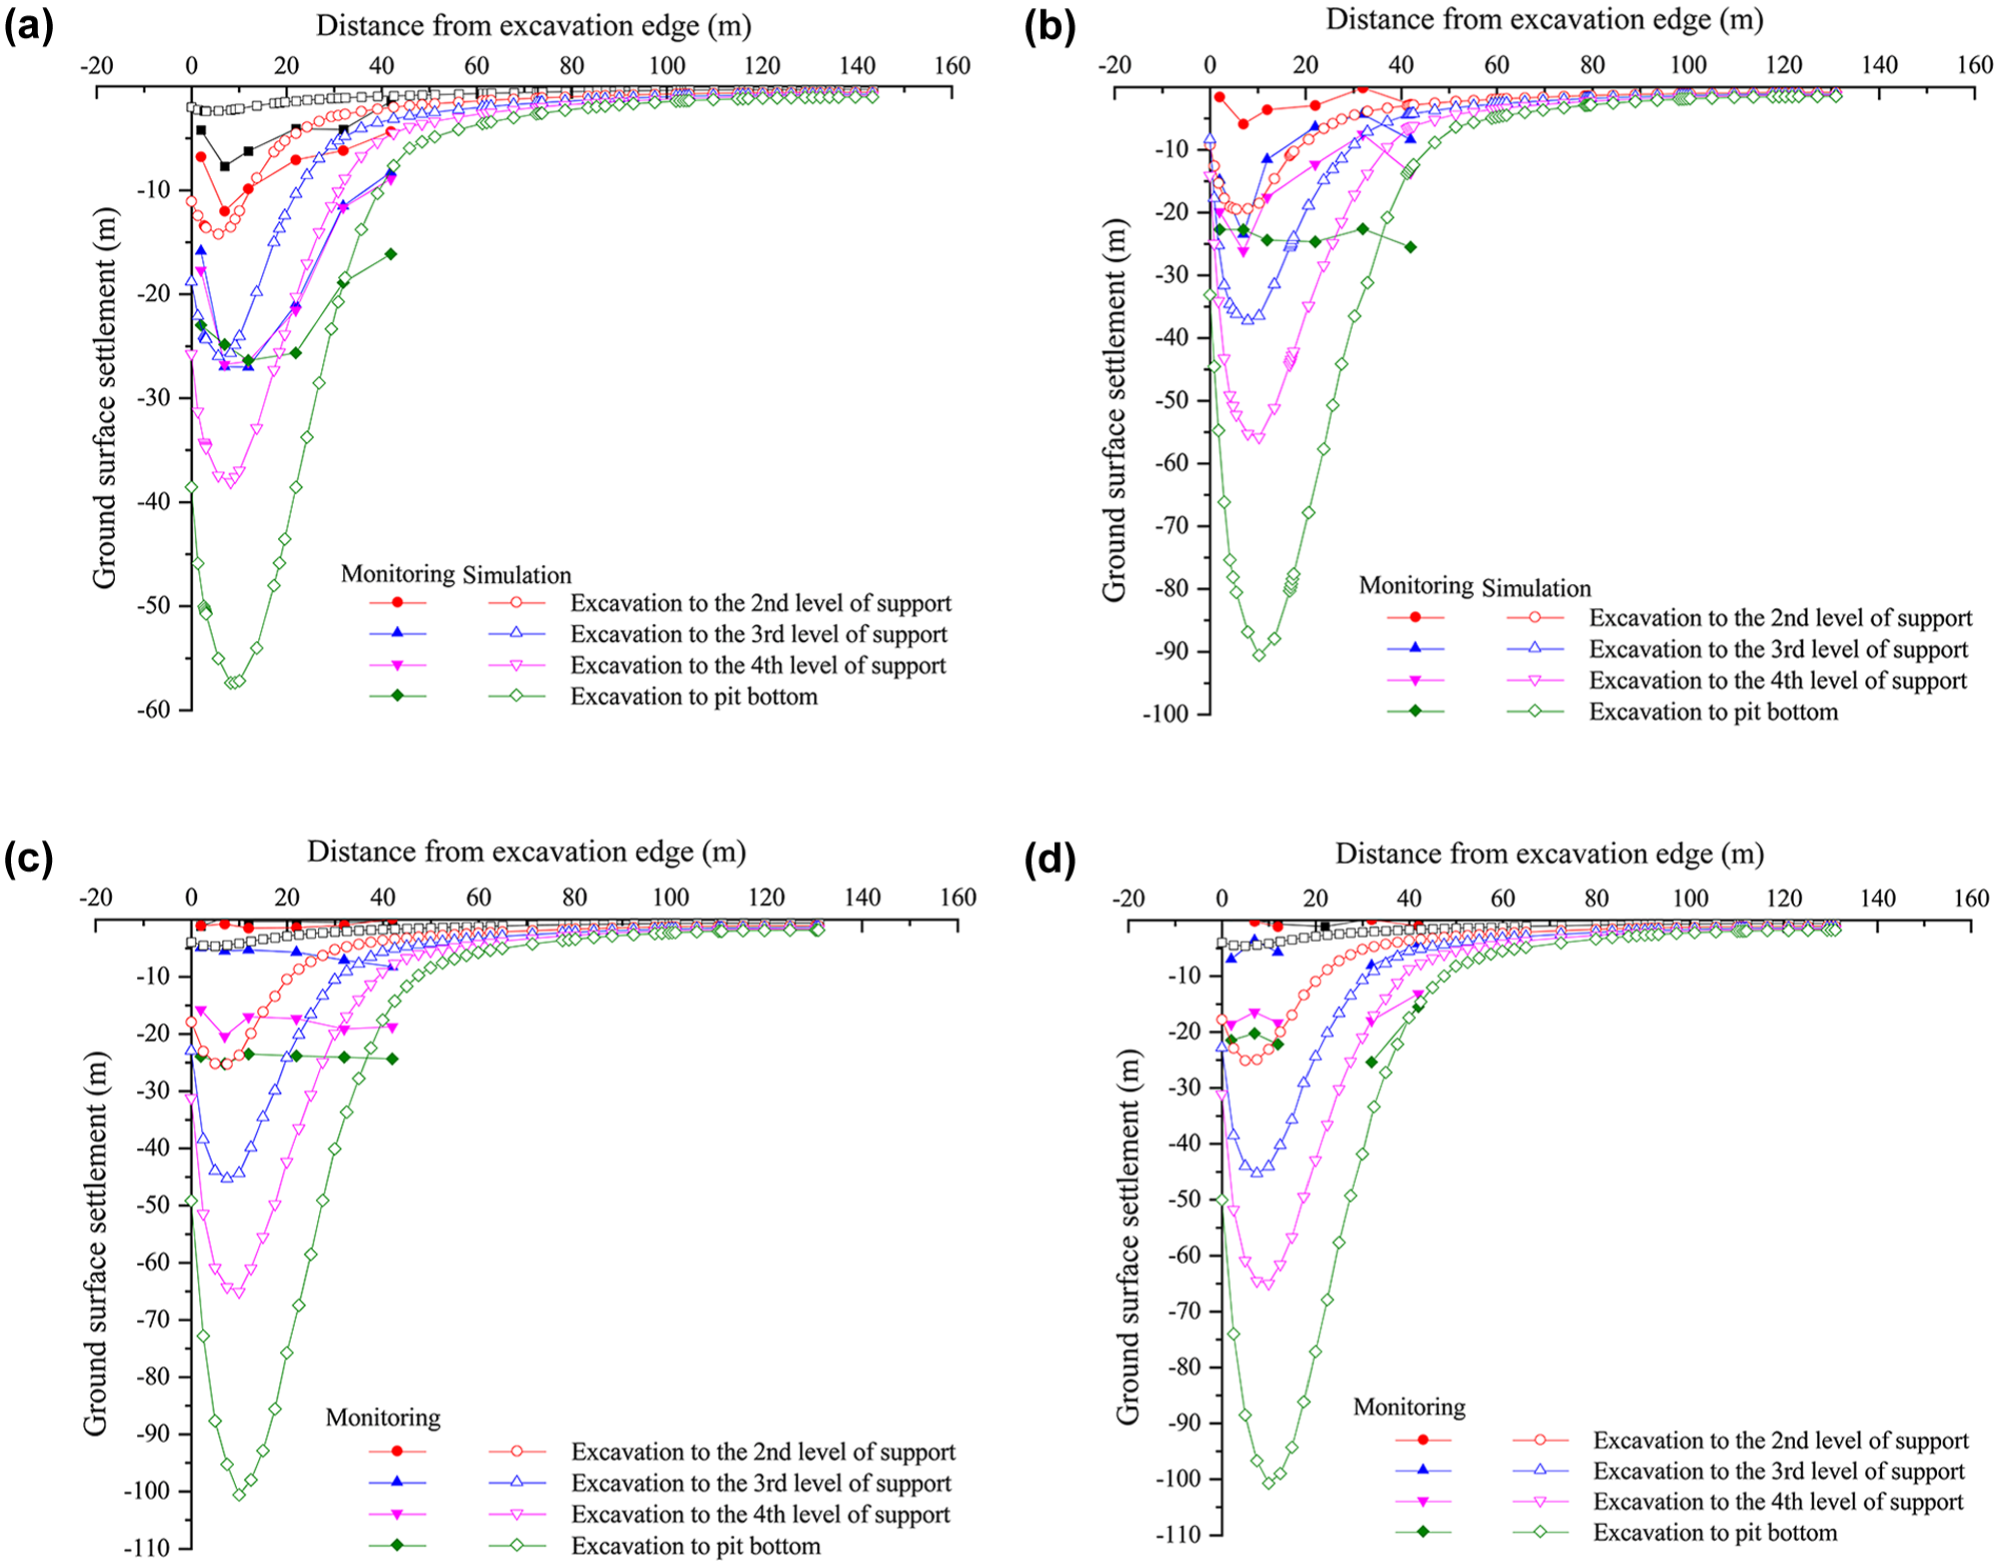
Ground surface settlement curves: (a) ground surface settlement curve outside the foundation pit at measuring point CX5, (b) ground surface settlement curve outside the foundation pit at measuring point CX10, (c) ground surface settlement curve outside the foundation pit at measuring point CX24, and (d) ground surface settlement curve outside the foundation pit at measuring point CX25.
The finite element analysis shows that as the excavation depth increases, the main influence range of surface settlement expands, ultimately stabilizing within approximately 60 m of the retaining wall (about 3.5 times the excavation depth). Within the range of 3.5 to 6 times excavation depth, surface settlement decays from 7 mm to 3 mm. It is recommended that metro deep foundation pit projects in soft soil areas of Ningbo should focus on investigating the environmental information of key protected objects such as buildings, structures, and pipelines within the range of 3.5 times the excavation depth before construction. During construction, surface settlement of these key protected objects should be closely monitored within this range to prevent tilting, cracking, or even damage to adjacent buildings and damage to underground pipelines.
However, compared with the measured results, the surface settlement outside the pit obtained from numerical simulation shows obvious deviations in both magnitude and spatial distribution. In the simulation results, the maximum settlements at monitoring points CX25 and CX24 are 100.86 mm and 100.73 mm, respectively, both occurring at a distance of 10 m from the pit edge. The measured maximum surface settlement values at monitoring points CX5 and CX24 appear at locations relatively close to the foundation pit edge. The simulated maximum settlement at monitoring point CX10 is 90.68 mm, located at a distance of 10.3 m from the pit edge. The simulated maximum settlement at monitoring point CX5, which is located at the end of the foundation pit, is 57.46 mm, occurring at a distance of approximately 8.3 m from the pit edge. Through linear interpolation of adjacent simulated nodes at the location 12 m from the pit edge at monitoring point CX5, the corresponding simulated settlement at that location is approximately 55.65 mm, which is 2.11 times the measured value. The simulated settlement obtained by interpolation at the location of the measured maximum settlement at monitoring point CX24 is approximately 93.90 mm, which is 3.71 times the measured value.
The measured maximum settlements at monitoring points CX10 and CX25 appear at locations relatively far from the pit edge. The corresponding simulated settlement obtained by interpolation at the location of the measured maximum settlement at monitoring point CX10 is 13.02 mm, which is 0.51 times the measured value, meaning the simulated value actually underestimated the measured settlement. The simulated settlement obtained by interpolation at the location of the measured maximum settlement at monitoring point CX25 is approximately 35.13 mm, and the deviation between the two is relatively small.
Based on the comprehensive comparison results of the preceding four monitoring points, it can be found that the deviation and magnitude of the numerical simulation may be related to the location where the measured maximum settlement occurs. When the measured maximum settlement appears at a location relatively close to the pit edge, this location is near the peak region of the simulated settlement trough, and the simulated settlement is much larger than the measured value. When the measured maximum settlement appears at a location relatively far from the pit edge, the simulated settlement has already attenuated significantly at that distance range, and the deviation ratio is smaller. The reason for this pattern difference may be that the numerical simulation idealizes the area surrounding the foundation pit, thus presenting a typical settlement trough distribution pattern, whereas the measured settlement distribution along the distance direction is relatively uniform, and the far-field settlement does not attenuate as significantly as predicted by the model.
Impact of Pit Bottom Reinforcement on Foundation Pit Deformation
Taking the central cross-section at monitoring points CX24 and CX25 as an example, Figure 8 shows the effect of pit bottom reinforcement on the deformation of the retaining structure when the excavation reaches the pit bottom. After reinforcement at the pit bottom, the simulated values are closer to the measured values, and the deformation of the retaining structure is effectively controlled after reinforcement.
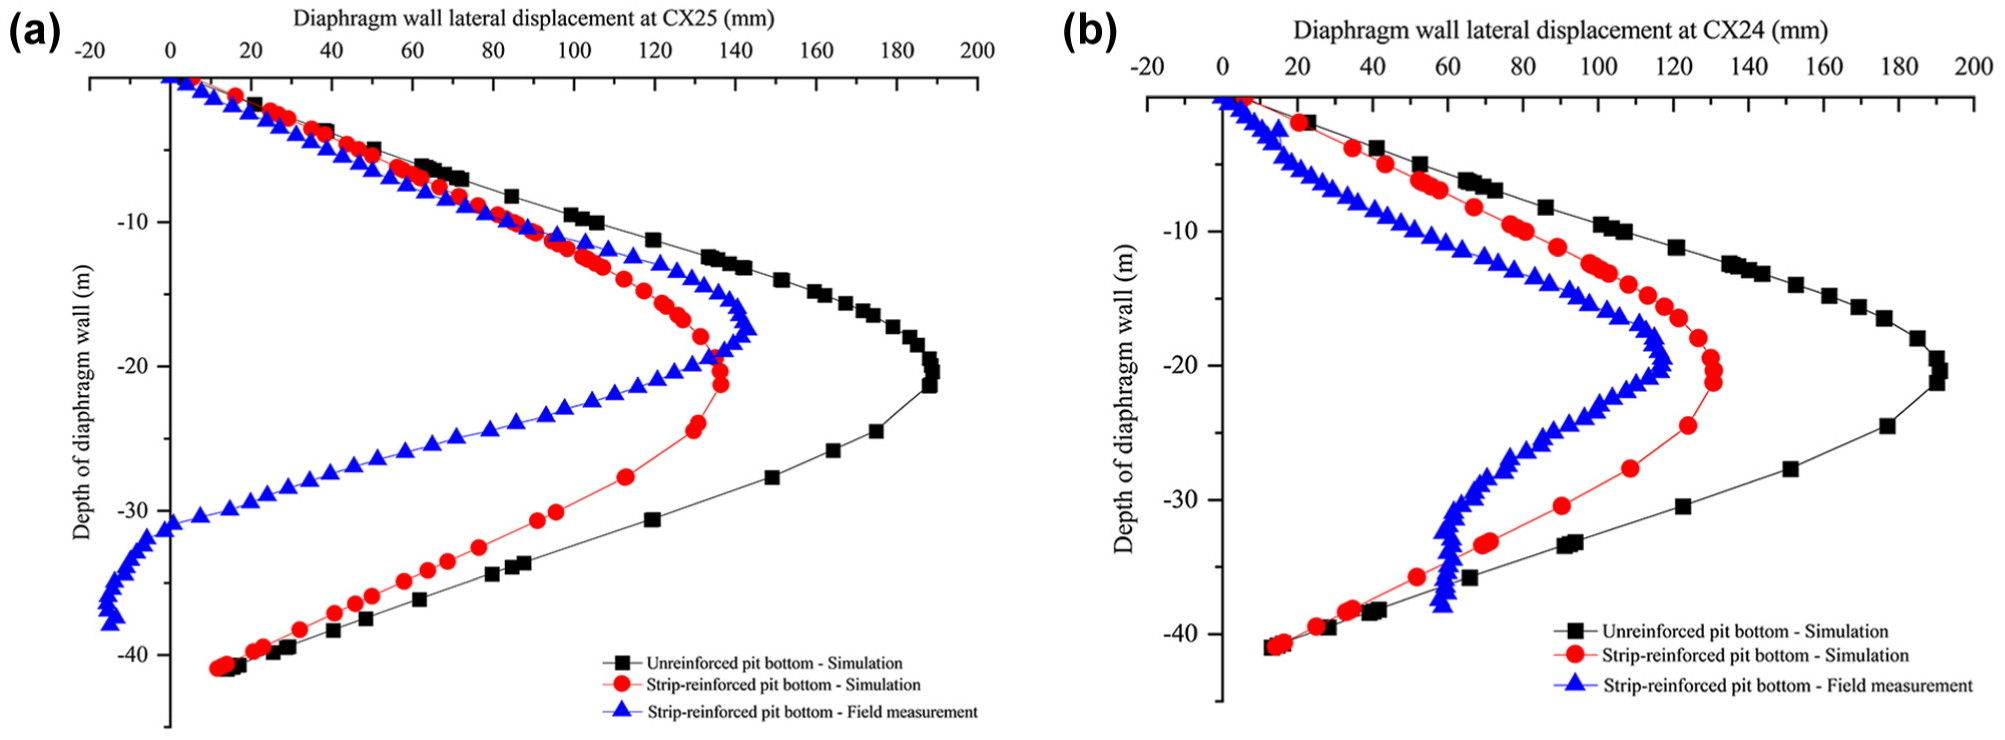
Lateral displacement of retaining structure before and after foundation pit reinforcement: (a) lateral displacement of diaphragm wall at measuring point CX24 before and after pit bottom reinforcement, and (b) lateral displacement of diaphragm wall at measuring point CX25 before and after pit bottom reinforcement.
Under the simulation condition without pit bottom reinforcement at monitoring point CX25, the maximum lateral displacement of the diaphragm wall was 190.91 mm, occurring at a wall depth of approximately −20.39 m, exhibiting a typical characteristic of deformation first increasing and then decreasing with depth. After introducing pit bottom reinforcement, the simulated maximum lateral displacement at this monitoring point decreased to 130.92 mm, a reduction of 59.99 mm, representing a relative decrease of 31.4%. Before reinforcement, the simulated value was 1.63 times the measured result, with a difference of 73.70 mm, while after reinforcement, the simulated value was 1.12 times the measured value, and the deviation narrowed to 13.71 mm. Monitoring point CX24 exhibited a similar pattern. Before reinforcement, the simulated maximum lateral displacement at this monitoring point was 188.85 mm, occurring at a depth of approximately −20.39 m. After reinforcement, it decreased to 136.59 mm, occurring at a depth of approximately −21.3 m, a reduction of 52.26 mm, representing a relative decrease of 27.7%. Before reinforcement, the simulated value overestimated the measured value by 31.8%, with a deviation of 45.56 mm, while after reinforcement, the simulated value was lower than the measured value by −6.70 mm, with a deviation of −4.7%, and the simulation results nearly coincided with the measured data.
At a depth of −16.47 m, the simulation shows that the restraining effect of pit bottom reinforcement on the deformation of the retaining structure is also evident. The simulated lateral displacement at monitoring point CX25 at this depth decreased from 176.12 mm before reinforcement to 121.58 mm after reinforcement, a reduction of 31.0%, and the gap between the simulated and measured values at this location narrowed from 70.31 mm to 15.77 mm. The simulated lateral displacement at monitoring point CX24 at this depth decreased from 174.17 mm before reinforcement to 125.87 mm after reinforcement, a reduction of 27.7%, while the measured value at this location was approximately 141.28 mm. After reinforcement, the simulated value was slightly lower than the measured value, with a deviation of −10.9%.
Figure 9 presents the spatial distribution characteristics of pit bottom heave and surface settlement outside the pit before and after pit bottom reinforcement when the excavation reaches the bottom. The surface settlement outside the pit both before and after reinforcement exhibits a typical “trough” distribution, that is, the settlement first increases and then decreases from the pit edge toward the far field, reaching a peak value at a certain distance from the pit edge, and then gradually attenuates. Before reinforcement, the maximum settlement on the CX25 side was 145.88 mm, and the maximum settlement on the CX24 side was 147.48 mm. The two sides were basically symmetrical, and the distance between the location of maximum settlement and the pit edge was approximately 1.75
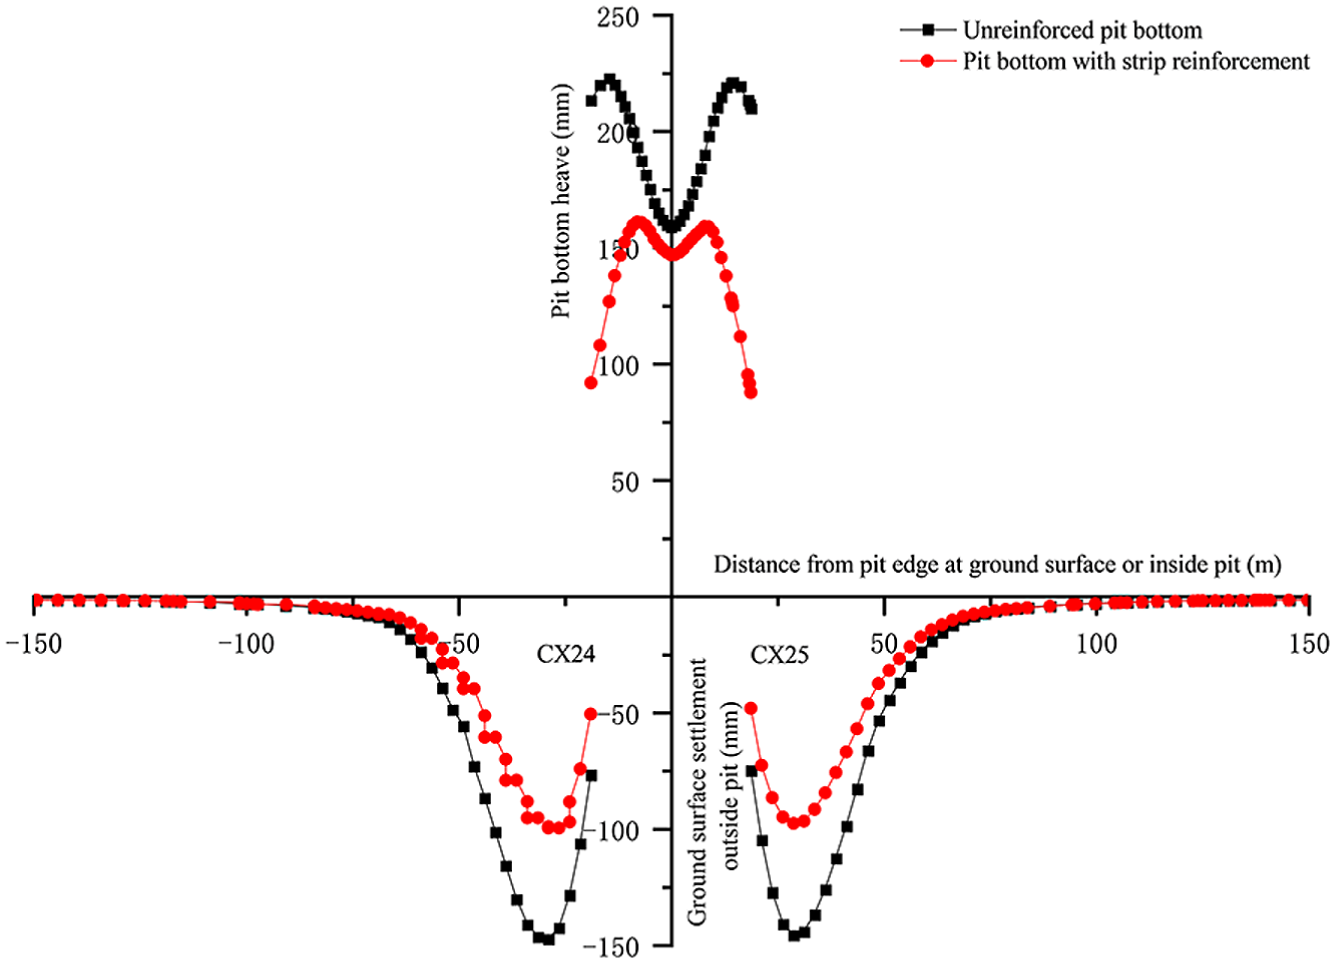
Pit bottom heave and ground surface settlement outside the pit before and after foundation pit reinforcement.
The pit bottom heave exhibits a typical “M”-shaped bimodal distribution along the transverse direction, with the heave peaks not appearing at the center of the foundation pit but concentrated at approximately ±14.5 m from the pit center. The peak value on the CX25 side was approximately 220.93 mm, and the peak value on the CX24 side was approximately 222.55 mm. The heave at the pit bottom center was 158.60 mm, which was approximately 63.95 mm (28.7%) lower than the peak value. After reinforcement, the “M”-shaped bimodal distribution of pit bottom heave became significantly flattened. The maximum heave on the CX25 side was 159.04 mm, appearing at approximately 7.94 m from the pit center. The maximum heave on the CX24 side was 161.11 mm, appearing at approximately 7.93 m from the pit center. The heave at the pit bottom center was 146.84 mm, with a difference of only 14.27 mm from the peak value. Pit bottom reinforcement effectively restricted the lateral displacement at the bottom of the retaining structure, thereby making the pit bottom heave distribution tend toward uniformity.
The control effect of pit bottom reinforcement exhibits a gradient distribution characteristic that decreases from the pit wall toward the pit center in space. In the vicinity of ±14.5 m from the pit center, the heave decreased from 222.55 mm before reinforcement to 126.68 mm after reinforcement, a reduction of 95.87 mm (43.1%), which was the most significant effect. At ±18.85 m from the pit center, the heave decreased from 209.59–213.19 mm before reinforcement to 87.54–91.75 mm after reinforcement, with reductions of 58.2%–57.0%. In the middle area at ±7.9 m from the pit center at the pit bottom, the heave decreased from 189.73–193.01 mm before reinforcement to 159.04–161.11 mm after reinforcement, with reductions of 30.67–31.90 mm (16.2%–16.5%). The heave at the pit bottom center decreased from only 158.60 mm to 146.84 mm, with a reduction of only 11.76 mm (7.4%). In relation to the overall control effect on the maximum pit bottom heave, the maximum value decreased from 222.55 mm before reinforcement to 161.11 mm after reinforcement, a reduction of 61.44 mm, representing a decrease of 27.6%. Normalized by the excavation depth, the ratio of maximum pit bottom heave to excavation depth
Combining the reinforcement effects on pit bottom heave and surface settlement outside the pit, it can be found that the maximum pit bottom heave decreased from 222.55 mm to 161.11 mm (a reduction of 27.6%), while the maximum settlement outside the pit decreased from 147.48 mm to 99.99 mm (a reduction of 32.2%), and the magnitudes of reduction of the two are comparable. The pit bottom heave deformation and the surface settlement outside the pit may be controlled by the same deformation mechanism.
Conclusion
Based on the actual engineering of the Huishi Road Station foundation pit for Ningbo Metro Line 6, this study introduces the method for determining HSS model parameters for Ningbo soils. The elastoplastic finite element method is used to establish the finite element model of a deep foundation pit in soft soil in Ningbo at different construction stages. The study analyzes the impact of construction processes such as open-cut construction and pit bottom reinforcement on the deformation of the retaining structure and pit bottom heave. The following conclusions are drawn:
The mesh convergence analysis shows that the relative differences of all evaluated indicators between the fine scheme and the very fine scheme are less than 0.1%, and excessively pursuing mesh density, element, and node numbers is uneconomical. The wall deflection and surface settlement values predicted by the coarse mesh scheme represent conservative estimates in engineering applications, while possessing optimal computational economy.
The simulated lateral displacement of the diaphragm wall exhibits a parabolic shape bulging inward toward the pit along the depth, which is consistent with the typical deformation characteristics of internally braced foundation pits in existing research. At the standard section monitoring points CX24 and CX25, the simulated maximum lateral displacements are 128.78 mm and 130.72 mm, respectively, which are in good agreement with the measured values (117.21 mm and 143.29 mm), with deviations of 9.9% and 8.8%, respectively. In comparison, the deviation at the end monitoring point CX5 is 22.3%, indicating that the prediction accuracy of the model for the middle region of the foundation pit is better than that for the end region. The lateral displacement at the middle of the long side is consistently larger than that at the end of the foundation pit, exhibiting a significant spatial corner effect, which demonstrates the necessity of adopting three-dimensional modeling for numerical simulation of elongated foundation pits.
Concerning the possible deviation pattern between the simulated results and the measured lateral displacement, during the shallow excavation stages, the simulated values tend to overestimate the displacement. During the deep excavation stages, the simulated values tend to underestimate the displacement. This may be because of the HSS model underestimating the soil stiffness in the very small strain range during the early stages, and insufficiently capturing the soil softening behavior in the large strain range during the later stages. In addition, the depths at which the simulated and measured maximum lateral displacements occur differ by 1 to 3 m, with the simulated maximum consistently appearing at a deeper position than the measured value.
For the surface settlement outside the pit, the maximum settlement in the simulation results of the finite element analysis appears at approximately 10 m from the pit edge. The main influence range extends to within approximately 3.5
Pit bottom reinforcement fundamentally changes the spatial distribution pattern of pit bottom heave. Before reinforcement, the pit bottom heave exhibits a significant “M”-shaped bimodal distribution, with a peak value of approximately 222.55 mm, concentrated at approximately ±14.5 m from the pit center, while the heave at the pit bottom center is only 158.60 mm. After reinforcement, the heave distribution tends toward significant uniformity, with the maximum heave decreasing to 161.11 mm. The reinforcement effect is most significant in relation to reduction at approximately ±14.5 m from the pit center, and gradually weakens toward the pit bottom center. The similarity in the magnitudes of reduction of pit bottom heave and surface settlement outside the pit indicates that the two may be controlled by the same deformation mechanism.
Supplemental Material
sj-docx-1-trr-10.1177_03611981261459435 – Supplemental material for Deformation Analysis of Long-Deep Foundation Pit Excavation in Ningbo Metro Based Using Hardening Soil Small Strain Model
Supplemental material, sj-docx-1-trr-10.1177_03611981261459435 for Deformation Analysis of Long-Deep Foundation Pit Excavation in Ningbo Metro Based Using Hardening Soil Small Strain Model by Songhao Piao and Shan Zhao in Transportation Research Record
Footnotes
Nomenclature
All symbols used in this article and their meanings are as follows.
Author Contributions
The authors confirm contribution to the paper as follows: Conceptualization: Songhao Piao and Shan Zhao; Data curation: Songhao Piao and Shan Zhao; Formal analysis: Songhao Piao and Shan Zhao; Investigation: Songhao Piao and Shan Zhao; Methodology: Shan Zhao; Project administration: Songhao Piao; Resources: Songhao Piao and Shan Zhao; Software: Shan Zhao; Supervision: Songhao Piao; Validation: Songhao Piao and Shan Zhao; Visualization: Shan Zhao; Writing – original draft: Songhao Piao and Shan Zhao; Writing – review & editing: Songhao Piao and Shan Zhao.
Declaration of Conflicting Interests
The authors declared no potential conflicts of interest with respect to the research, authorship, and/or publication of this article.
Funding
The authors received no financial support for the research, authorship, and/or publication of this article.
Data Accessibility Statement
The datasets used and analyzed during the current study available from the corresponding author on reasonable request.
Supplemental Material
Supplemental material for this article is available online.

References
Supplementary Material
Please find the following supplemental material available below.
For Open Access articles published under a Creative Commons License, all supplemental material carries the same license as the article it is associated with.
For non-Open Access articles published, all supplemental material carries a non-exclusive license, and permission requests for re-use of supplemental material or any part of supplemental material shall be sent directly to the copyright owner as specified in the copyright notice associated with the article.
