






Abstract
This study demonstrates the use of connected vehicle data to conduct high-resolution speeding behavior analyses across a statewide highway network. Using over 3.5TB of Wejo trajectory data, we extract the maximum observed speeds for individual vehicles on defined road segments and aggregate them hourly to analyze temporal patterns. To assess excessive speeding, vehicle speeds are compared with posted speed limits across 13 thresholds, ranging from 35 to 90 mph, and sample sizes within each threshold are calculated. Based on this data, the paper presents a speeding index for identifying segments with potentially unlawful or unsafe speeding behavior. The analysis covers more than 120,000 road segments and considers differences by road type, day of the week, season, and holiday. Results reveal spatial and temporal variations in speeding intensity, including elevated rates during off-peak hours and certain holiday periods. When the Wejo sample size is sufficiently large, there is a good agreement with INRIX speed data. A web-based tool has been developed that enables users to dynamically explore excessive speeding patterns and download customized data sets. Findings highlight the value of connected car data as a supplement to traditional traffic data sets and offer insights for transportation agencies seeking to enhance safety and performance monitoring using emerging data sources.
Introduction
As vehicle trajectory and event (VTE) data become widely available from connected vehicles, state DOTs are increasingly interested in capitalizing on such data to monitor transportation operations, safety assessments, planning, and environmental studies. This paper focuses on using Wejo data to analyze speeding behavior on highways in Virginia. The Virginia Department of Transportation (DOT) purchased a 24-week statewide VTE data sample from the vendor Wejo. The available data cover the entire state of Virginia for the period from August 2021 to July 2022. A total of 24 weeks of data were sampled in that period, averaging 2 weeks per month over that duration. Wejo data provide vehicle positions (latitude and longitude) as often as every 3 s and contains various types of events detected by sensors on vehicles or computed based on motion data (e.g., speed, heading, hard braking, ignition on/off, journey id, zip code where data point is collected). Although Wejo went out of business in 2023, the methods and lessons learned from this study can be generalized to similar data from other sources.
Various factors affect observed speeds on a highway, including posted speed limit, traffic demand/volume, roadway geometry, weather and traffic conditions, presence of access control or traffic signals, and speed limit monitoring by law enforcement officers or technologies. Monitoring speeding is an important component of highway safety programs since it is a significant contributing factor in fatal crashes, including pedestrian and cyclist fatalities. According to the National Highway Traffic Safety Administration, in 2021, speeding was a contributing factor in 29% of all traffic fatalities ( 1 ). Besides highway safety, monitoring speeds is also important for other applications, including performance monitoring, improving traffic conditions through deployment of intelligent transportation systems (e.g., speed harmonization systems), system operations, traffic signal timing, planning, and design. VTE data have the potential to enable state DOTs to collect high-resolution speed data at scale. Such data, when properly processed and methodically analyzed, could help DOTs take the necessary actions (e.g., change speed limits, deploy safety countermeasures, display warning messages) in a timely manner to improve safety and highway operations.
The main goal of this paper is to explore the VTE data for speed studies and create analytical capabilities and a tool for Virginia DOT to systematically evaluate speeding data across the Commonwealth based on VTE data. More specifically, the following are the main objectives:
Evaluate the quality of the Wejo speed data based on other available data sources and analyze the spatiotemporal distribution of the data.
Develop robust metrics (e.g., speeding index) to quantify excessive speeding behavior on road segments.
Create a prototype application to map speeding metrics for a statewide network.
The resulting interactive tool, accessible at https://odu-tri.shinyapps.io/wejospeeds/, allows users to explore speeding patterns by road type, location, time of day, and other criteria. While this paper is focused on data from Virginia, the methodology and data processing pipeline are applicable to other similar data. The current literature primarily focuses on small-scale speeding analyses or uses aggregated probe data that lack the granularity needed for comprehensive network-wide assessments. This study addresses this gap by developing a scalable methodological framework that uses over 3.5 TB of high-resolution VTE data to quantify speeding behavior across a statewide network of 120,000+ segments. The study introduces a “speeding index” which accounts for both the frequency and intensity of excessive speeding. In addition, the paper makes an empirical contribution by evaluating the sample size and representativeness of connected vehicle observations relative to AADT (annual average daily traffic) data to estimate sampling rates across different roadway classes. The paper also provides a technical blueprint for handling big data challenges—such as aligning disparate OpenStreetMap (OSM) and Linear Referencing System (LRS) networks. Furthermore, in contrast to the existing literature, the researchers provide a web-based application that allows users to query, visualize, and download data behind the speeding index. The following sections contain the literature review, data processing and integration efforts, analysis results, and the system architecture used to achieve these objectives.
Literature Review
There have been some recent studies on how Wejo data could be used to understand speeding behavior ( 2 , 3 ), to predict real-time crash potential on freeways ( 4 ), to extract performance measures for traffic congestion ( 5 ), to identify intersection approaches with high rear-end crash risks ( 6 ), to evaluate the effects of automated work zone speed enforcement ( 7 ), and to analyze national mobility trends ( 8 ). Additionally, other studies have demonstrated the value of VTE data from other sources, including research by Kaushik et al. ( 9 ) that used the National Performance Management Research Data Set (NPMRDS) to compute performance measures from commercial GPS probe data (e.g., INRIX, TomTom, and HERE), Sisiopiku and Rostami-Hosuri ( 10 ) who used NPMRDS vehicle probe-based travel time data for congestion quantification, and Ahsani et al. ( 11 ) who analyzed INRIX probe data characteristics for coverage assessment and congestion detection precision. These studies indicate that VTE/waypoint data have the potential to support various types of application and new analyses beyond those that are possible based on aggregated probe vehicle data (e.g., INRIX). Consequently, it is timely to investigate how VTE/waypoint data could benefit transportation operations and system management efforts.
Existing studies show that high-frequency trajectory from original equipment manufacturer (OEM)-connected vehicles could provide high accuracy, for example, in some cases achieving mean speed errors of less than 1 mph at 6.3% penetration rates ( 12 ). This study focuses on such CV probe data from OEMs that provide standard journey information, including geo-coordinates, timestamps, speed, and direction, along with driver event information (e.g., in-vehicle driving activities and equipment status). This precision has enabled researchers to develop various analytical frameworks using real-world data sets from programs such as the Safety Pilot Model Deployment to analyze vehicle speed patterns, classify driving behaviors based on speed thresholds, and implement safety measures for identifying high-risk locations and aggressive driving events ( 13 ).
Speeding Behavior Analysis and Detection: VTE data have emerged as a powerful source for analyzing speeding behavior through detailed characterization of speed distributions and their temporal changes in response to enforcement interventions, as demonstrated by studies of speed camera installations that show significant reductions in driving speeds both in the short term and long term following implementation ( 14 ). This capability has been enhanced by machine learning approaches that can predict speeding levels with 75.6% accuracy using trip-specific factors from CV trajectory data (3). Comprehensive data-driven driver behavior scoring systems have further demonstrated the effectiveness of machine learning algorithms in extracting patterns from speed, acceleration, and braking data to identify behavioral anomalies (e.g., harsh braking, speeding, and fuel efficiency issues) ( 15 ). Large-scale applications of these techniques are evidenced by systematic reviews of 45 papers examining in-vehicle telematics systems that monitor driving behaviors, with speed, acceleration, and braking being the most commonly analyzed variables ( 16 ). Real-world implementations analyzing vehicle telematics data from 4,500 vehicles in New York City were used to develop driver behavior indices that use speed and speed variation as surrogate safety measures for crash prediction ( 17 ).
Work Zone Speed Analysis: Connected vehicle data have been particularly valuable for work zone speed studies, where traditional data collection methods are often impractical because of safety and logistical constraints without introducing observer bias or creating safety risks for data collection personnel ( 7 ). This capability allows researchers to identify how speeds vary by time of day, traffic volume, and work activity level, providing insights previously difficult to obtain in these challenging environments ( 18 ). Building on these foundations, advanced methodologies have been developed for real-time monitoring of work zone safety and mobility performance through scalable analysis of hard-braking events and speed data from connected vehicles ( 19 ).
Real-Time Safety Applications: Connected vehicle data have also enabled sophisticated real-time safety applications, beginning with the successful application of VTE data to predict crash potential using speed-related variables and patterns that provide warning of dangerous conditions ( 4 ). These predictive capabilities have been scaled up through connected vehicle–based road safety information systems that can predict vehicle crash risks and evaluate road section risks through temporal and spatial aggregation of vehicle-level crash risks ( 20 ). The scope of these applications extends to comprehensive vehicle cooperation strategies, with multiple vehicle cooperation and collision avoidance (MVCCA) systems using V2V communication to deliver real-time traffic information that reduces congestion and increases passenger safety ( 21 ).
Data Quality and Validation Considerations: The reliability of CV speed data depends heavily on comprehensive validation frameworks, as demonstrated by multi-vendor validation studies that have established methods for validating connected vehicle speed data against reference measurements and identifying potential sources of bias or error ( 22 ). Despite the substantial volume of data generated, for example, reaching 60 GB per day (∼ 21 TB per year) in Florida’s CV that represented less than 10% of the state’s 19 million registered vehicles, analysis of CV data from both OEM vehicle telematics systems and U.S. DOT Joint Program Office (JPO) pilot project on-board units has revealed significant data quality issues in the data sets, emphasizing the critical need for robust data quality assessment frameworks ( 23 ). These challenges are compounded by fundamental sensor calibration issues that form the foundation of autonomous systems, including temporal calibration challenges, data fusion complexities, and validation concerns (e.g., measurement uncertainties and calibration errors) that can propagate through the entire data analysis pipeline ( 24 ).
Data Storage and Preprocessing
The Wejo data set contains two types of information: waypoint (or trajectory) data and event data. This paper uses only the waypoint data, which amounts to approximately 3.65 TB in total: 1.42 TB for 2021 and 2.23 TB for 2022. For data storage and processing, Old Dominion University (ODU)’s high-performance computing (HPC) infrastructure was used as its HPC services provided the required level of security and resources. The storage environment provides home and mass storage with a total capacity of 2.26 PB. The raw data used in conducting this paper include:
Wejo waypoint data in Parquet file format, which was organized by month and day of the year. The number of files per day varies anywhere from 1 to 986. The total number of files for both years is 47,428.
Speed limit data, which was downloaded from the Virginia DOT’s Pathways for Planning (P4P) portal.
AADT data, also downloaded from P4P.
INRIX speed data for a few selected corridors downloaded from the RITIS portal.
The overall methodology followed in processing the raw Wejo data is illustrated in Figure 1. The data processing blocks described in Figure 1 are designed to streamline the subsequent steps for visualizing the data for the entire Virginia network on a map, as discussed later. For brevity, other intermediate processes are not explicitly discussed here, such as converting the data from the UTC zone to New York/Eastern time. The code for data processing and analysis is written in R. The computationally heavy parts of the pipeline are the first three blocks in Figure 1, and the central processing unit (CPU) times for these processes are presented in Figure 2 for August 2021 files. The code was run on the HPC system with 40 Cores Intel(R) Xeon(R) Gold 6148 CPUs @ 2.40GHz. The secondary axis in Figure 2 shows the number of Parquet files for each day in August 2021. Overall, it takes approximately 10 min to preprocess the data for an average day with data.
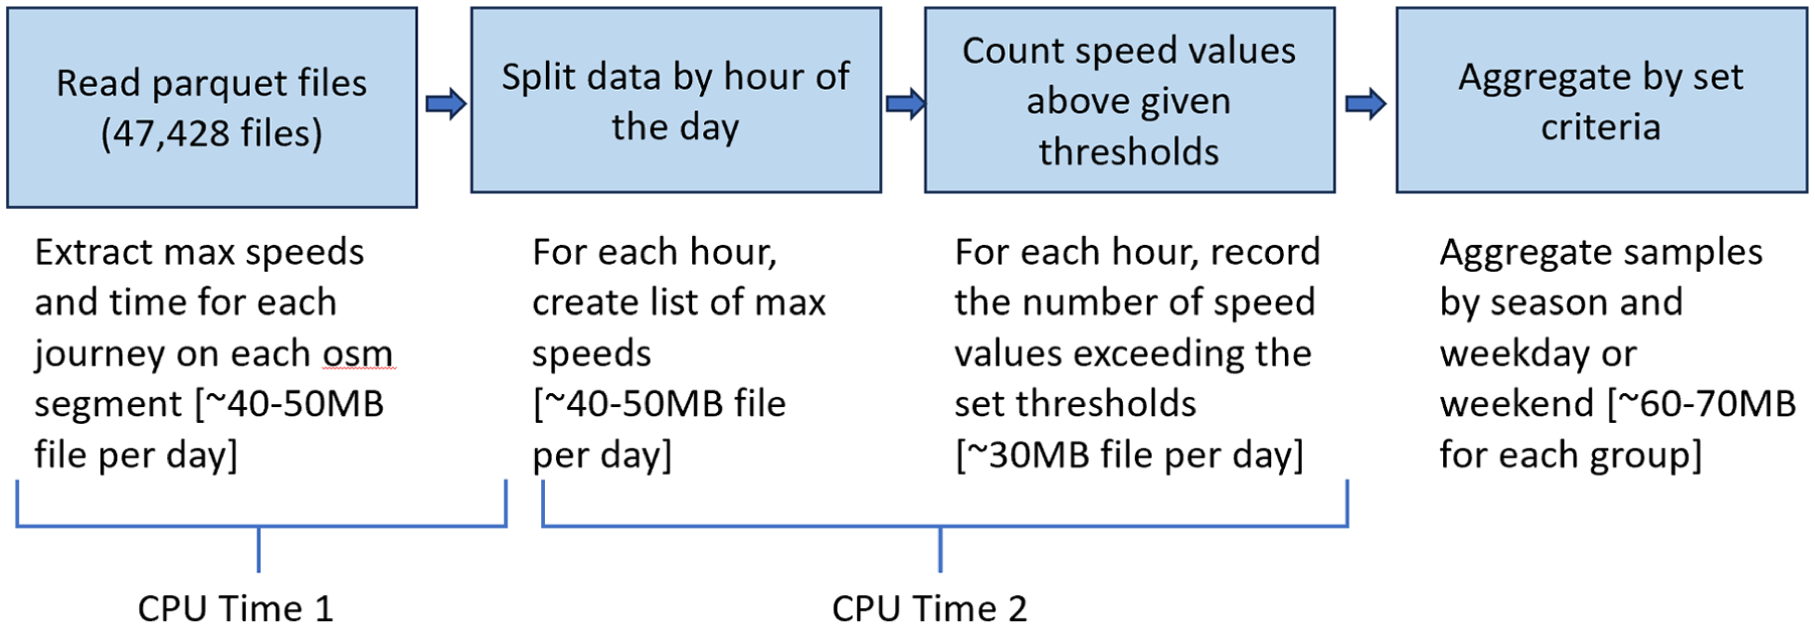
Data processing pipeline for extracting speed values from Wejo data and approximate file sizes.
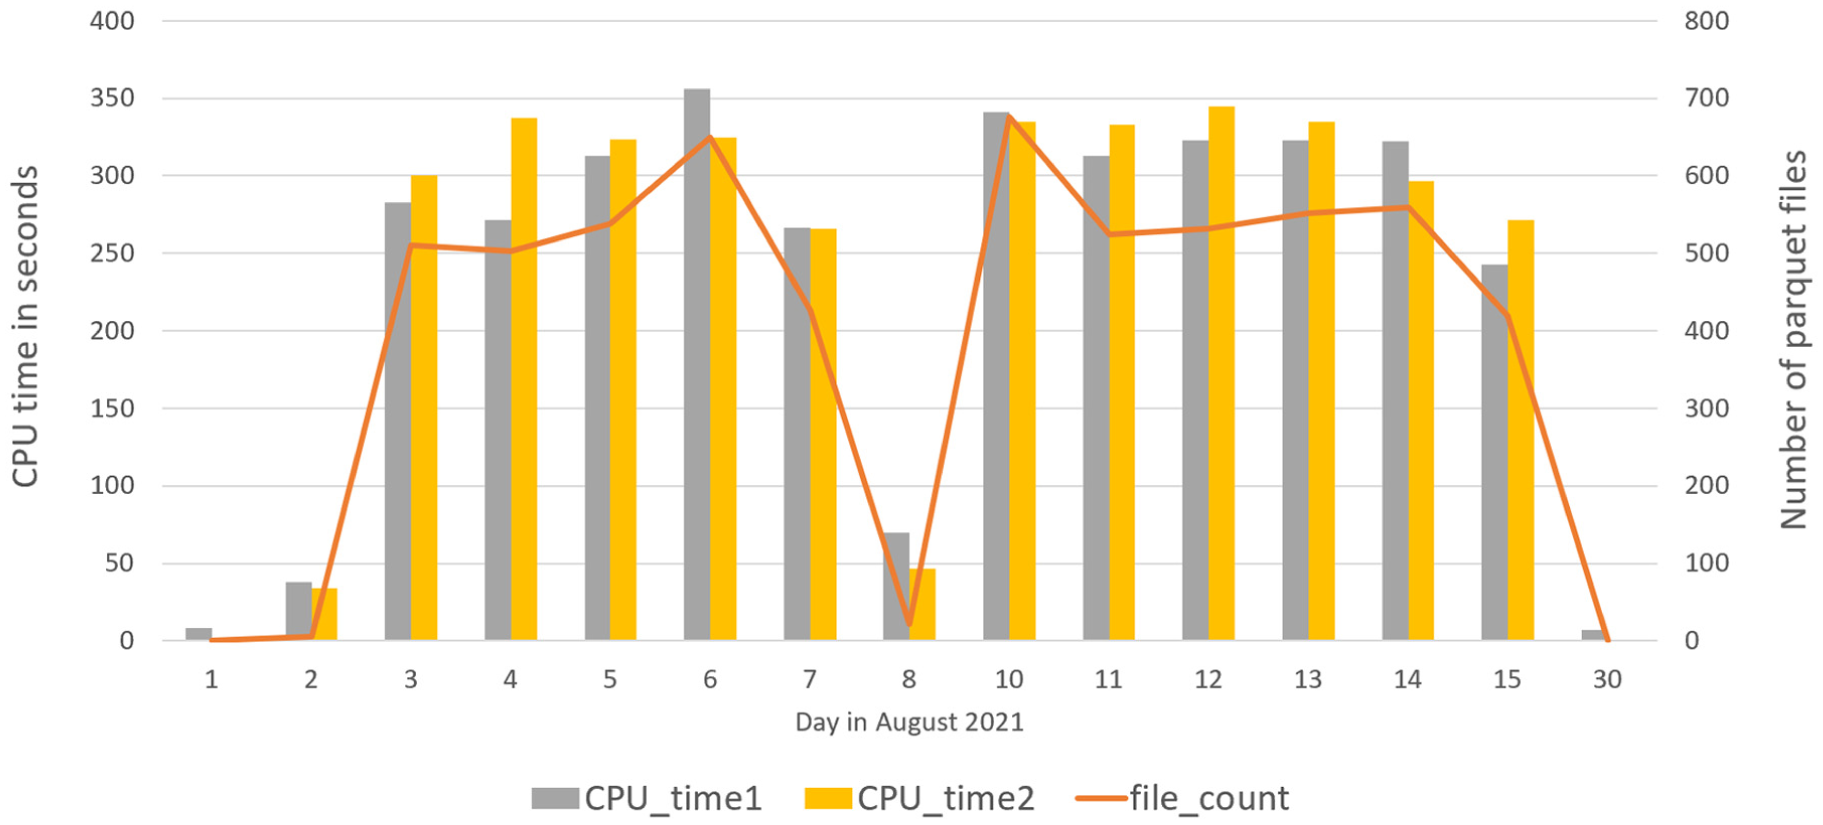
CPU times for running the processes shown on the diagram in Figure 1.
Since the primary objective of this paper is to examine excessive speeding behavior, the maximum speed for each vehicle on each link it traversed is extracted from the Wejo waypoint data stored in Parquet files. Specifically, for each OpenStreetMap (OSM) segment (defined by way_id) and for each vehicle traversing that segment (indicated by journeyId) the maximum observed speed as well as its timestamp are extracted. The rest of the analyses are primarily based on these individual vehicle speeds.
To capture temporal variation, the data are organized by hour of the day. For each hour, the total number of samples (i.e., vehicles) exceeding a set of predefined thresholds (e.g., 80 mph) is then computed. These thresholds include 0 mph and span from 35 mph to 90 mph in increments of 5 mph, totaling 13 different values. Since the highest speed limit in the Commonwealth is 70 mph, and traveling 20 mph or more above the speed limit is considered reckless driving under Virginia law, the highest threshold is set to 90 mph. Since these thresholds are needed for every hour of the day, 312 (13x24) columns are required to store the data.
At the end of the pipeline in Figure 1, large tables summarizing the number of samples exceeding these selected speed values are created. These counts serve as the basis for calculating the speeding indices for different predefined periods (e.g., holidays, weekends, weekdays) as discussed in the next subsections. From these sample sizes, it becomes possible to quickly determine what percentage of Wejo vehicles are traveling beyond the speed limit, including exceedance thresholds such as 10 mph or 15 mph over the posted limit. Linking these speeding patterns to the posted speed limits for OSM segments requires speed limit data, which is described next.
Preparing the Speed Limit Database
The raw Wejo data set was provided by Virginia DOT to the authors. The data were mapped to the OSM network by a team from the Virginia Tech Transportation Institute (VTTI). Because of that, Wejo’s speed measurements are referenced to the OSM segments, whereas Virginia DOT’s speed-limit data come from its LRS. VTTI also combined the OSM and LRS networks and provided the integrated network to the authors, enabling the matching of OSM segments to LRS segments.
In November 2024, we downloaded the available speed limit data set from Virginia DOT’s Pathways for Planning (P4P) portal. It included roughly 512,000 road segments with attributes such as car and truck speed limits (CAR_SPEED and TRUCK_SPEED) and unique segment IDs (MASTER_EDG). We then joined this table to the Virginia DOT LRS network, adding route types, categories, and LRS link IDs (EDGE_RTE_K). We then merged the resultant data with VTTI’s conflated network (which merged OSM and Virginia DOT LRS data), thereby appending each segment’s OSM way_id (or osm_id) alongside its EDGE_RTE_K identifier. This merged data set (with approximately 685,000 rows) had about 124,000 unique OSM way_ids and 257,000 unique MASTER_EDG identifiers. This implies that one OSM way_id is being matched to multiple P4P MASTER_EDG’s and vice versa.
Since speed limits in our data set are tied to MASTER_EDG identifiers but our traffic measurements from Wejo are referenced to OSM way_ids, we needed to ensure that each way_id could be assigned a single, unambiguous speed limit. We found that for 106,052 way_ids (≈85 %) all matched MASTER_EDG segments carried identical posted speeds, allowing us to directly use that value. For such segments, we selected the LRS segment with the greatest shape length as a match for a given way_id. For the remaining 18,084 way_ids with conflicting speed limits, we conservatively selected the link with the lowest speed limit, though we could alternatively have excluded these way_ids from further analysis. These 18,084 OSM links with conflicting speed limits are flagged in the web-based application using the unique_spd_limit attribute. The final network included 124,136 unique way_ids and 87,233 unique MASTER_EDG’s. This network is the basis for the majority of the subsequent analyses.
Evaluating the Quality of the Wejo Speed Data
To evaluate any systematic variation in Wejo data in relation to other data sources, we compared Wejo speeds to INRIX speeds for several road segments. In addition, to evaluate the variation in sample size, we compared the number of vehicles from the Wejo data to AADT values. The steps followed in performing these comparisons are discussed below.
Since INRIX extreme definition (XD) or traffic message channel (TMC) segment definitions generally do not align with the OSM segments, segment selection was primarily performed manually. The Hampton Roads region was reviewed to identify segments with reasonable alignment between INRIX and OSM networks. Based on this review, 10 freeway segments and six segments along signalized corridors were selected for analysis, which are shown in Figure 3. It should be noted that before Wejo went out of business, they were providing data to INRIX, so Wejo data were inherently part of the INRIX algorithm. For this reason, a high degree of alignment is expected between the two data sets.
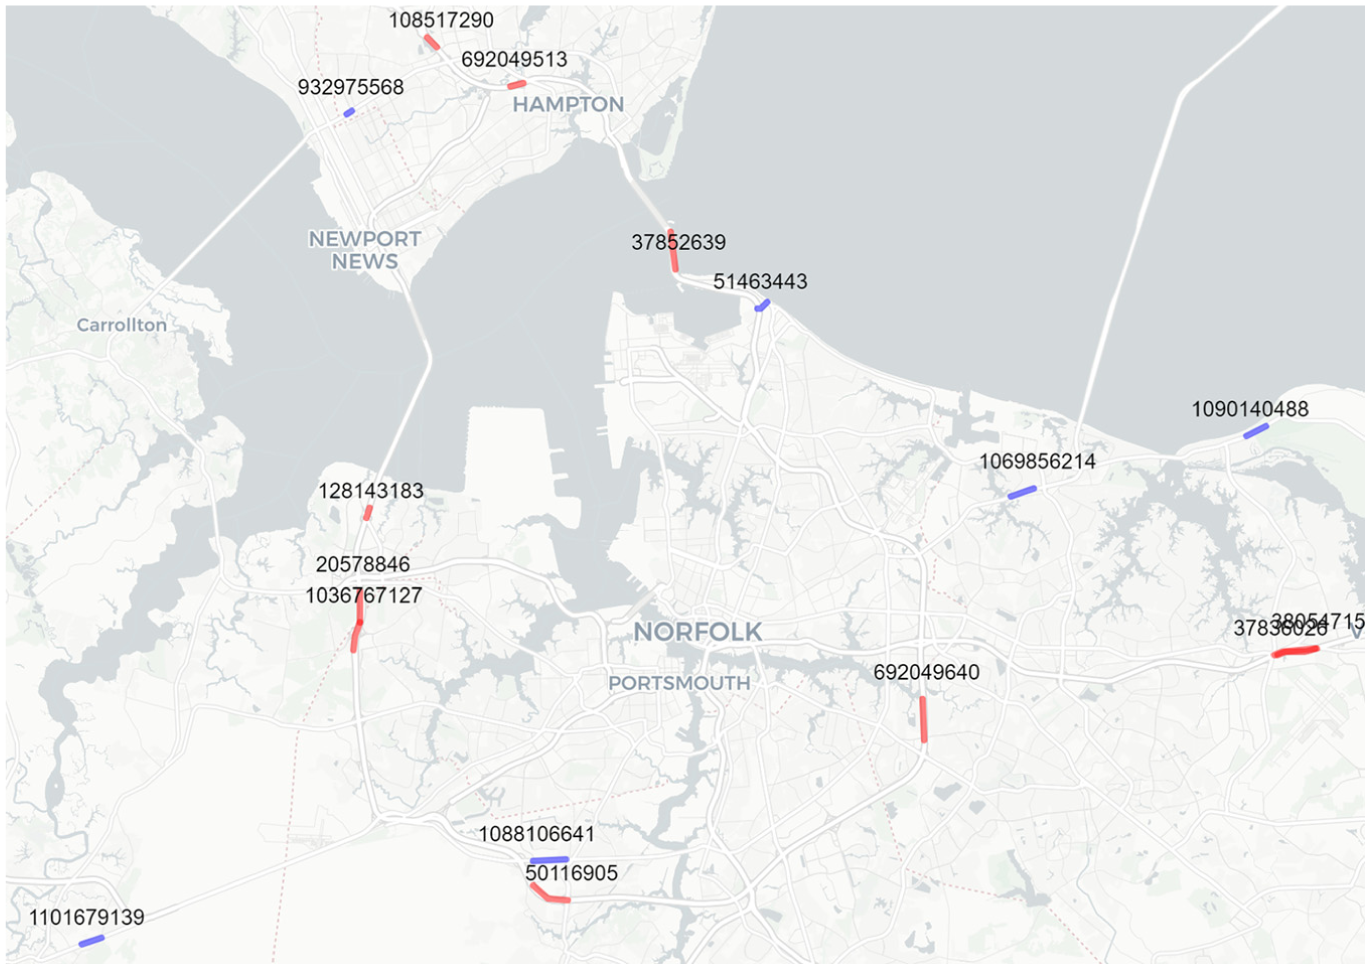
Selected OSM segments for speed comparison (red = Interstate; blue = U.S. Highway Primary).
To understand any potential bias in Wejo data and evaluate their variations relative to average INRIX speeds, we downloaded INRIX data aggregated at 5-min intervals for April 2022. For April 2022, Wejo data are available for 13 complete days, from April 11 to April 23. The Wejo data were preprocessed by filtering to the selected OSM segments and the target analysis days. Wejo speeds were converted from km/h to mph. Timestamps were floored to the nearest 5-min mark to match INRIX’s temporal resolution. To calculate the average speed per vehicle, Wejo data were first grouped by segment, 5-min interval, and vehicle ID. For each vehicle, the average speed within that time window was computed. These per-vehicle averages were then aggregated across all vehicles on the same segment and time interval to obtain the average speed. This approach ensures that each vehicle contributes equally, preventing bias from vehicles with more frequent data points. After that, the two data sets were joined on both segment ID and timestamp to enable point-by-point comparisons.
We then computed the speed difference (INRIX minus Wejo) and generated both time-series plots for selected segments and density plots stratified by road type. These visualizations and summary statistics help assess whether systematic speed differences exist and how they vary across facility types and time of day. For example, Figure 4 shows average speed plots for two freeway segments, one for the Hampton Roads Bridge Tunnel (HRBT) and the Monitor Merrimac Bridge Tunnel (MMBT). These are for the westbound (WB) segments right before the two tunnels shown on the map in Figure 3. As shown in Figure 4, overall, there is a good agreement between the two data sources for April 12. Additional details with regard to the comparison are provided below.
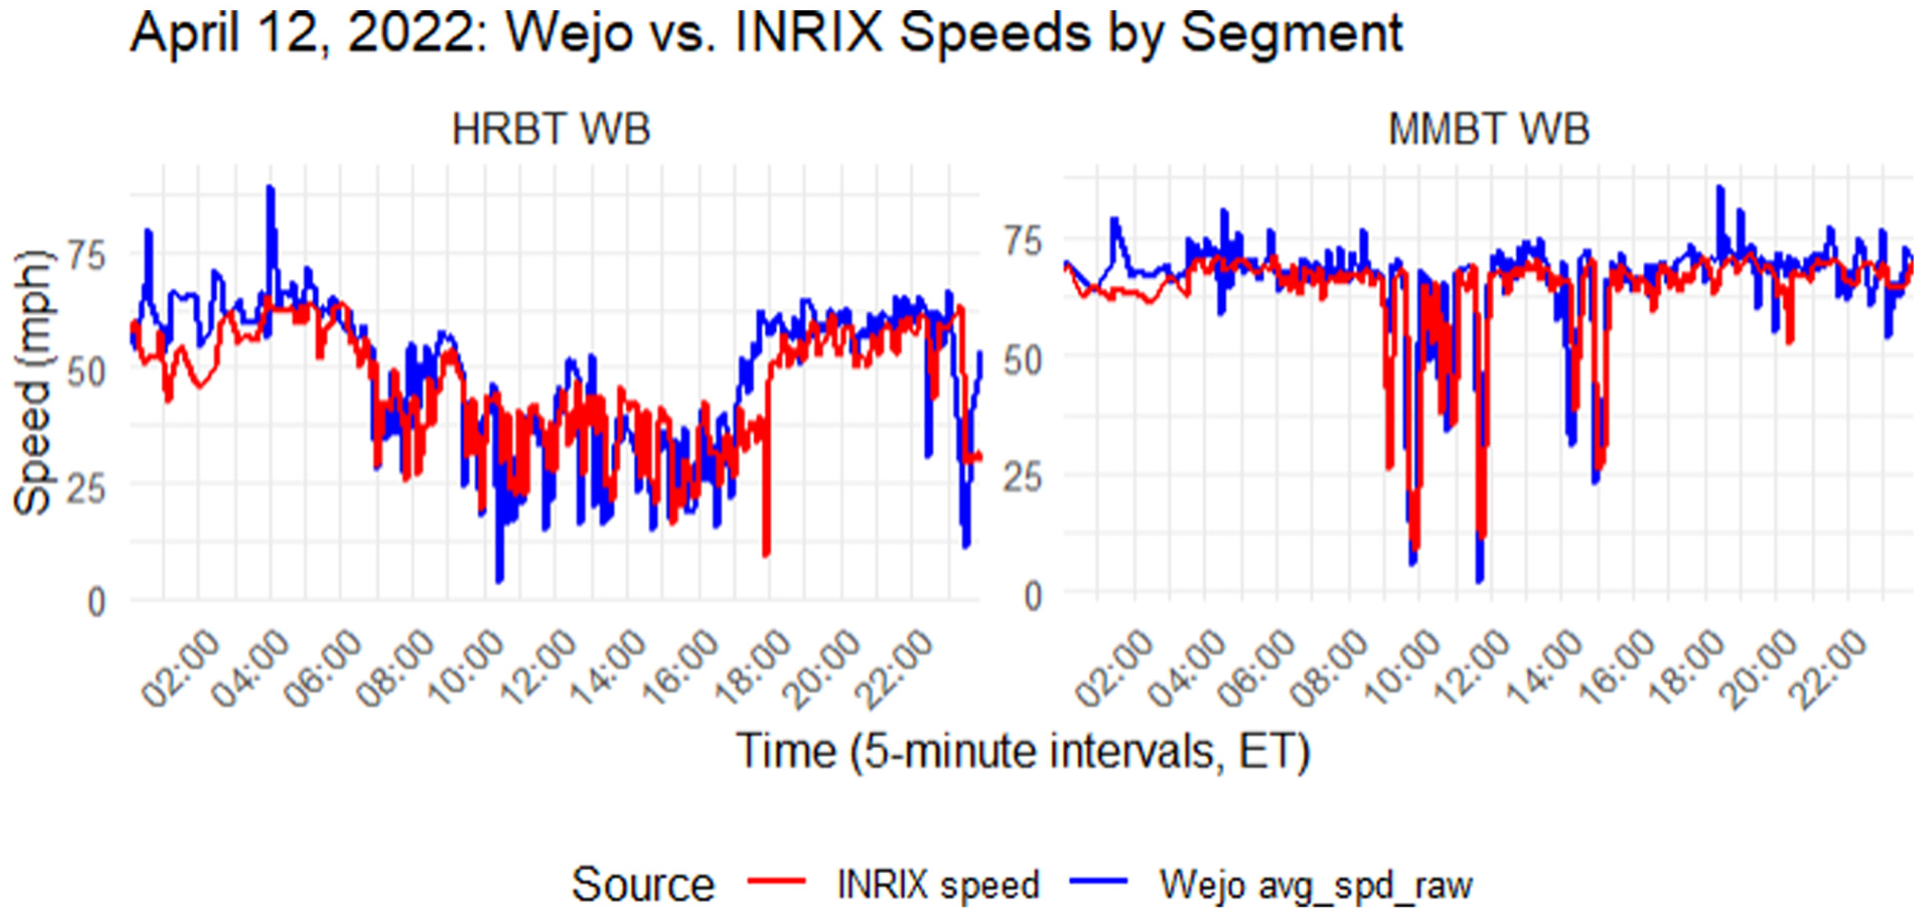
INRIX and Wejo speeds for April 12, 2022, for two freeway segments.
Table 1 presents the root mean square error (RMSE) statistics between the two data sources by selected XD segments (388800328 is for the HRBT and 1310297871 for the MMBT segments) across all 13 days. The average RMSE values are generally lower for the interstate segments when compared with the U.S. Highway segments, ranging from 2.8 to 10.0 for the former category and from 6.5 to 15.5 for the latter.
Root Mean Square Errors (RMSEs) when Comparing Wejo with INRIX Speeds (Unit: mph)
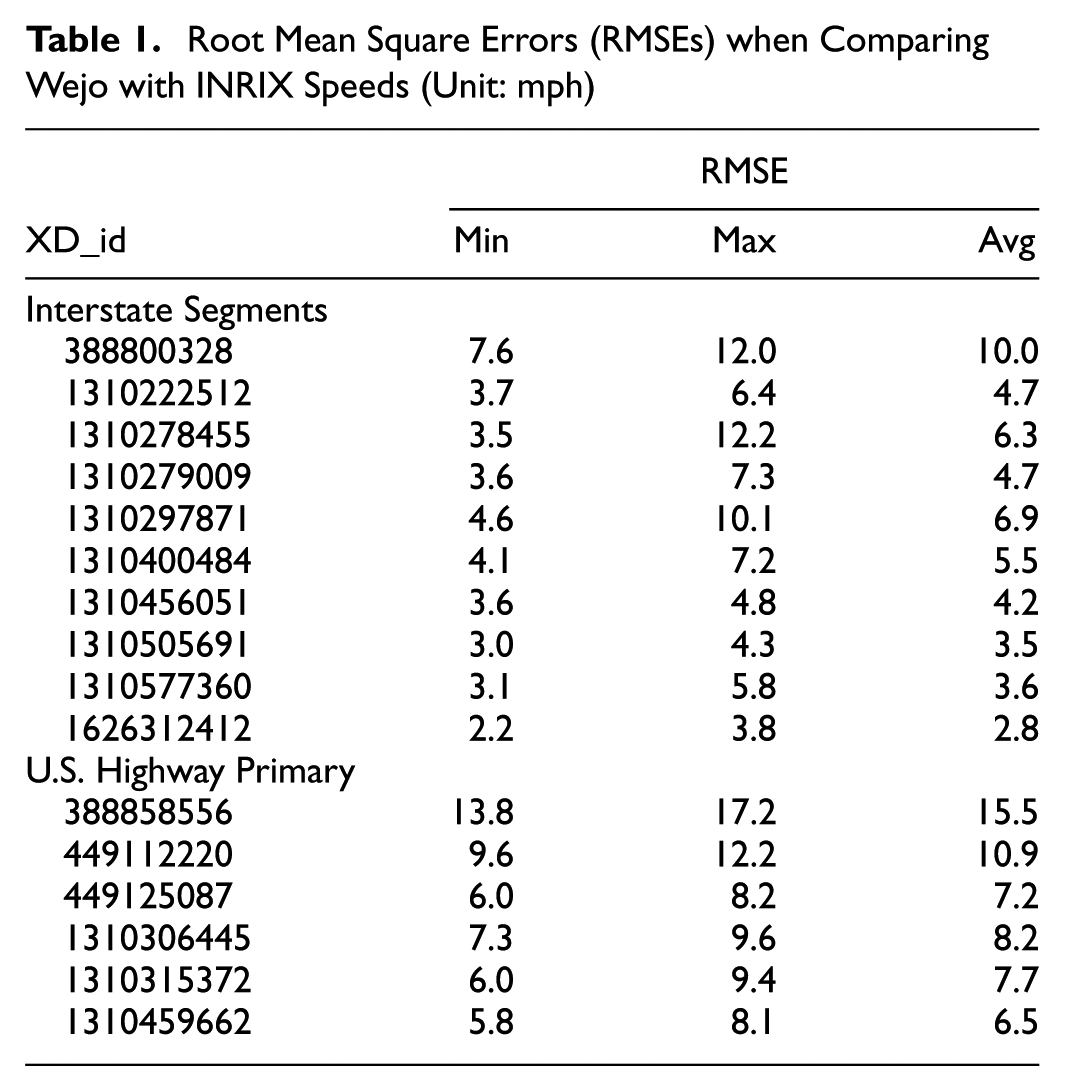
Figure 5a shows the density plots of speed differences using data from all segments for all 5-min intervals with data. The distribution for interstate segments is more tightly centered around zero, indicating closer agreement between the two data sources. The median speed difference for the interstate category is −0.1 mph, compared with −0.9 mph for U.S. Highway segments. It is important to note that the number of vehicle samples per 5-min interval varies considerably between the two road types—see Figure 6. Some intervals have no Wejo data: approximately 12% of the data are missing for interstate segments, while 39% are missing for U.S. Highway segments. The average vehicle counts for Wejo samples are 7.6 and 2.6 for the interstate and U.S. Highways, respectively. The density plot of speed differences is regenerated after eliminating intervals with fewer than five Wejo vehicles. As shown in Figure 5b, both distributions shift closer to the zero line. In this filtered case, the median speed difference for the interstate category is −0.03 mph, compared with −0.32 mph for U.S. Highway segments. This demonstrates that larger Wejo sample sizes improve consistency and agreement with INRIX-reported speeds.
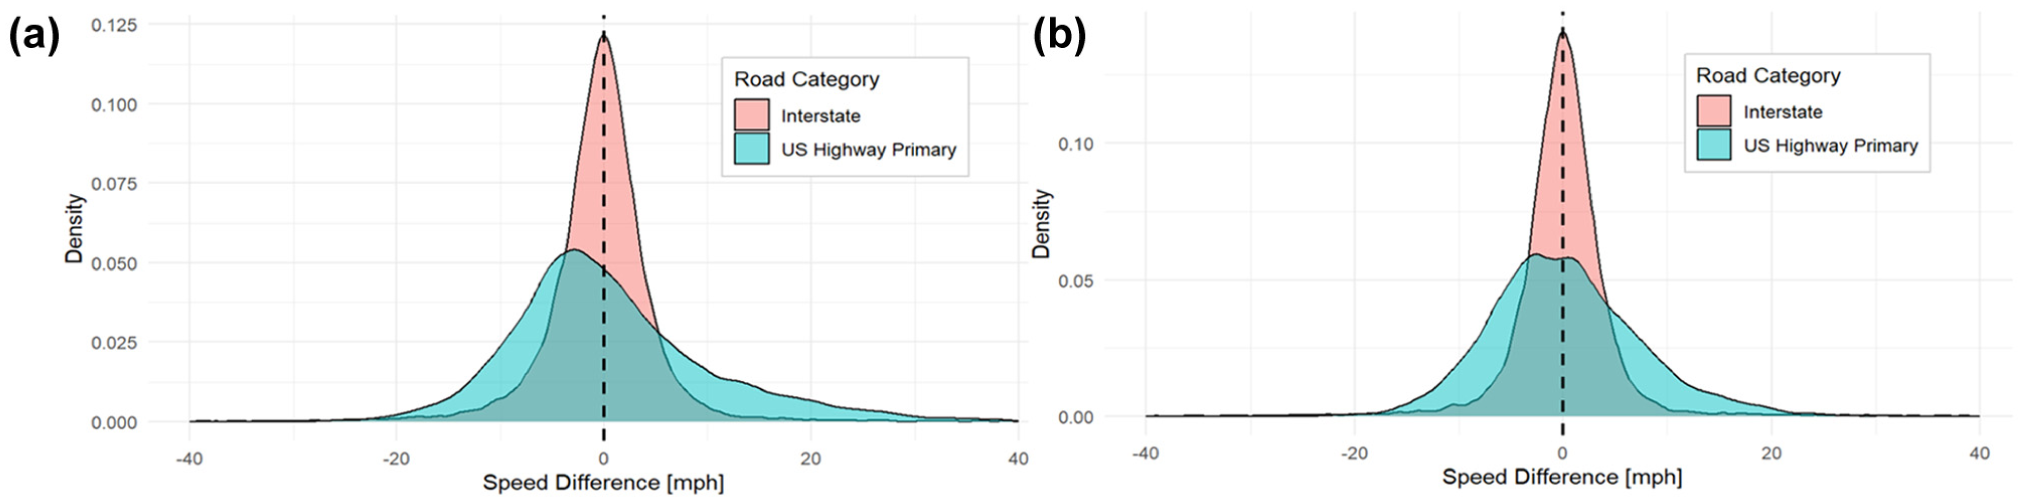
Density plots of speed difference (INRIX − Wejo) by road category using: (a) all samples versus; (b) those intervals with five or more Wejo vehicles.
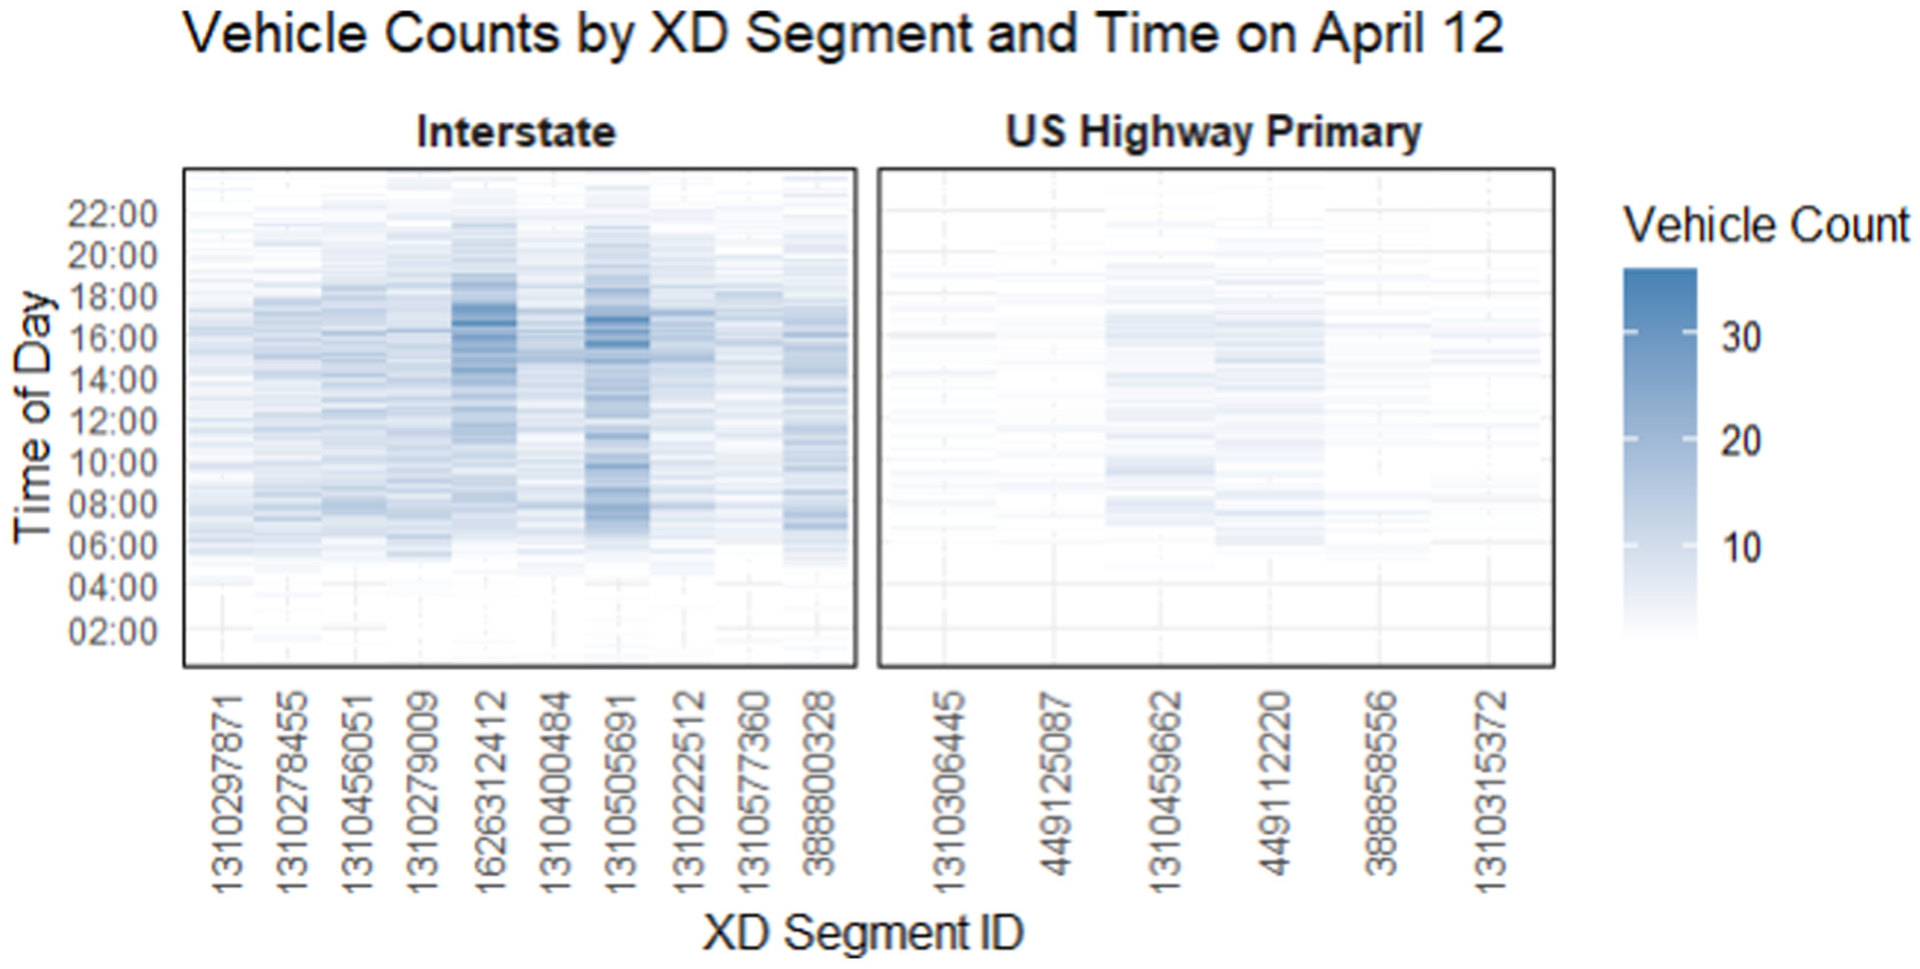
Vehicle counts by extreme definition (XD) segment and time on April 12, 2022.
Comparing the Wejo Sample Size to the AADT
To evaluate the representativeness of Wejo data relative to overall traffic volumes, we compared the number of Wejo vehicle records to average annual daily traffic (AADT) values on matched roadway segments. AADT data were obtained from Virginia DOT’s P4P portal and included annual average weekday traffic (AAWDT) volumes for 2023. These data were linked to Wejo segments through the MASTER_EDG field, which was previously associated with way_id values used in the Wejo data set.
Wejo vehicle counts were extracted from a set of files for April 11–17, 2022 for each day and segment for the entire state network. These counts were aggregated across weekdays and weekends to compute cumulative counts for each segment. To ensure accurate comparison with AADT, we focused on segments with a one-to-one mapping between Wejo way_id values and AADT EDGE_RTE_K identifiers. This avoided complications from segments that were split or merged differently across the two data sources. The analysis was further limited to major route types: Interstate, U.S. Highway Primary, State Highway Primary, and Secondary roads. For each segment, we calculated a Wejo sampling rate, defined as the ratio of Wejo vehicle counts over five weekdays to the corresponding 2023 AAWDT value, expressed as a percentage:

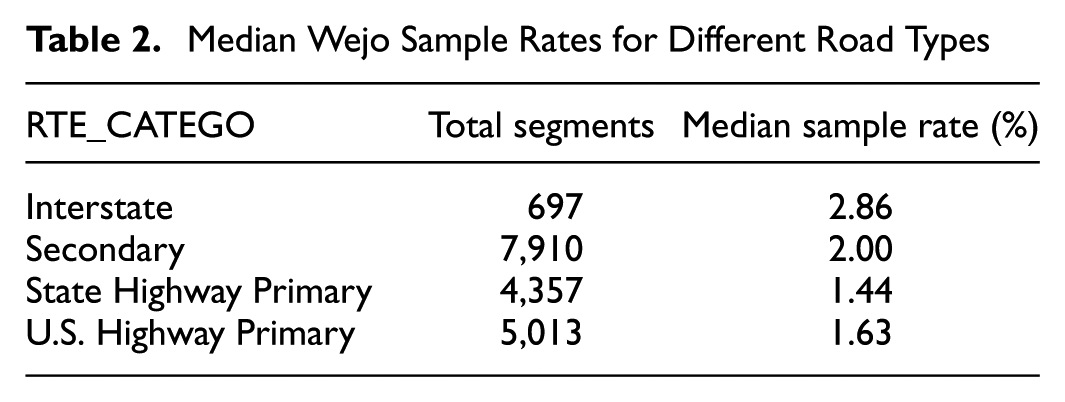
The median sampling rates are summarized by route type as shown in Table 2, while Figure 7 shows the histograms. Overall, for the great majority of road segments, Wejo vehicles constitute less than 5% of the total volume. In general, as the volume on the road increases, the total number of Wejo vehicles also increases, as shown in Figure 8 for the interstate segments. To visualize the distribution of the Wejo sample rate across the state, a map was generated and is shown in Figure 9. Based on visual inspection, the distribution of Wejo vehicles appears relatively uniform, with no region of the state showing a significantly higher concentration than others.
Median Wejo Sample Rates for Different Road Types
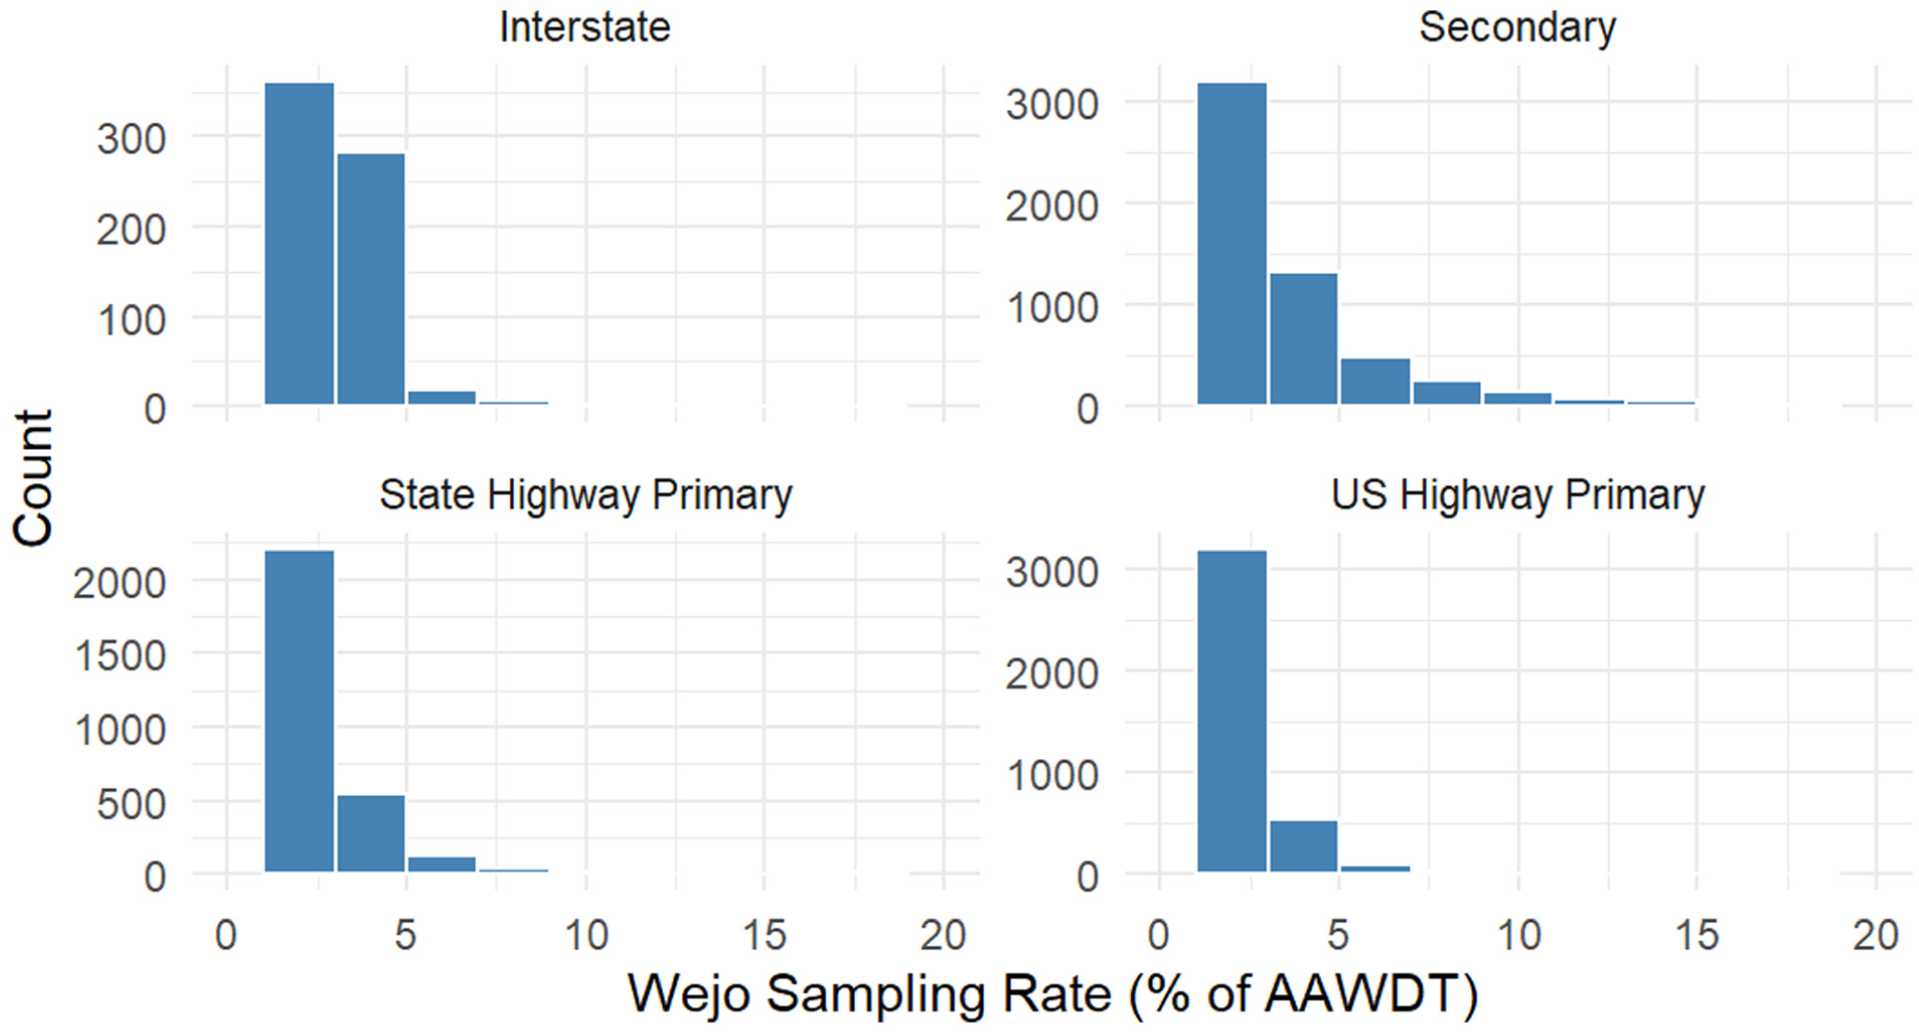
Histograms of Wejo sampling rates by road type.
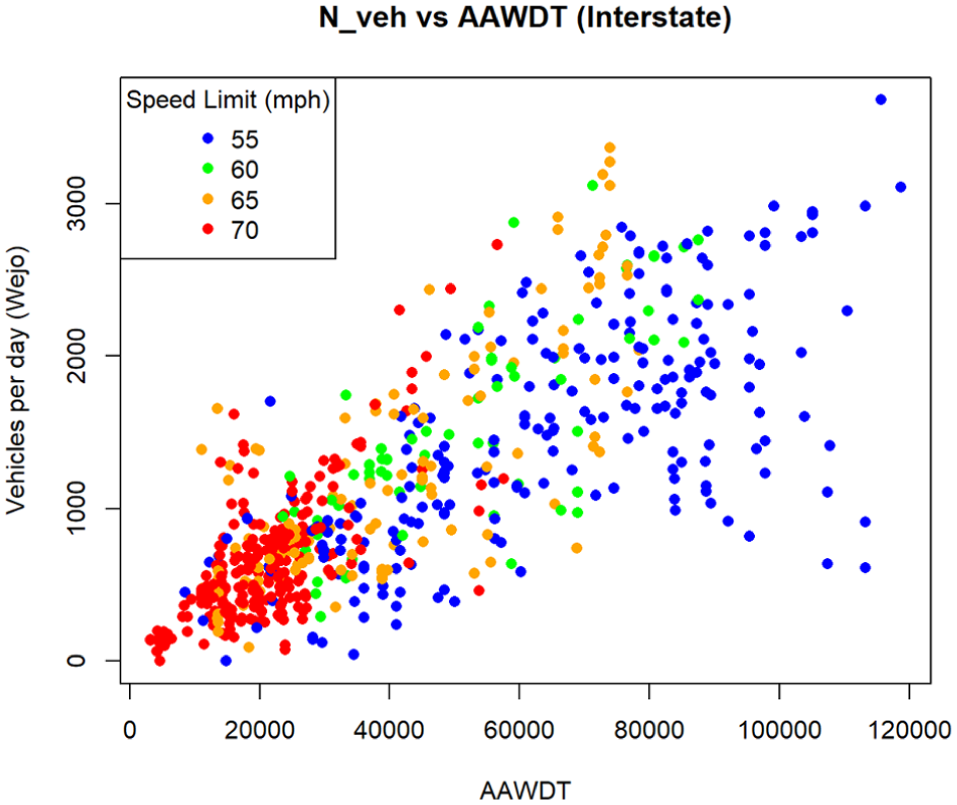
Variation in the number of Wejo vehicles by AAWDT for the Interstate segments.
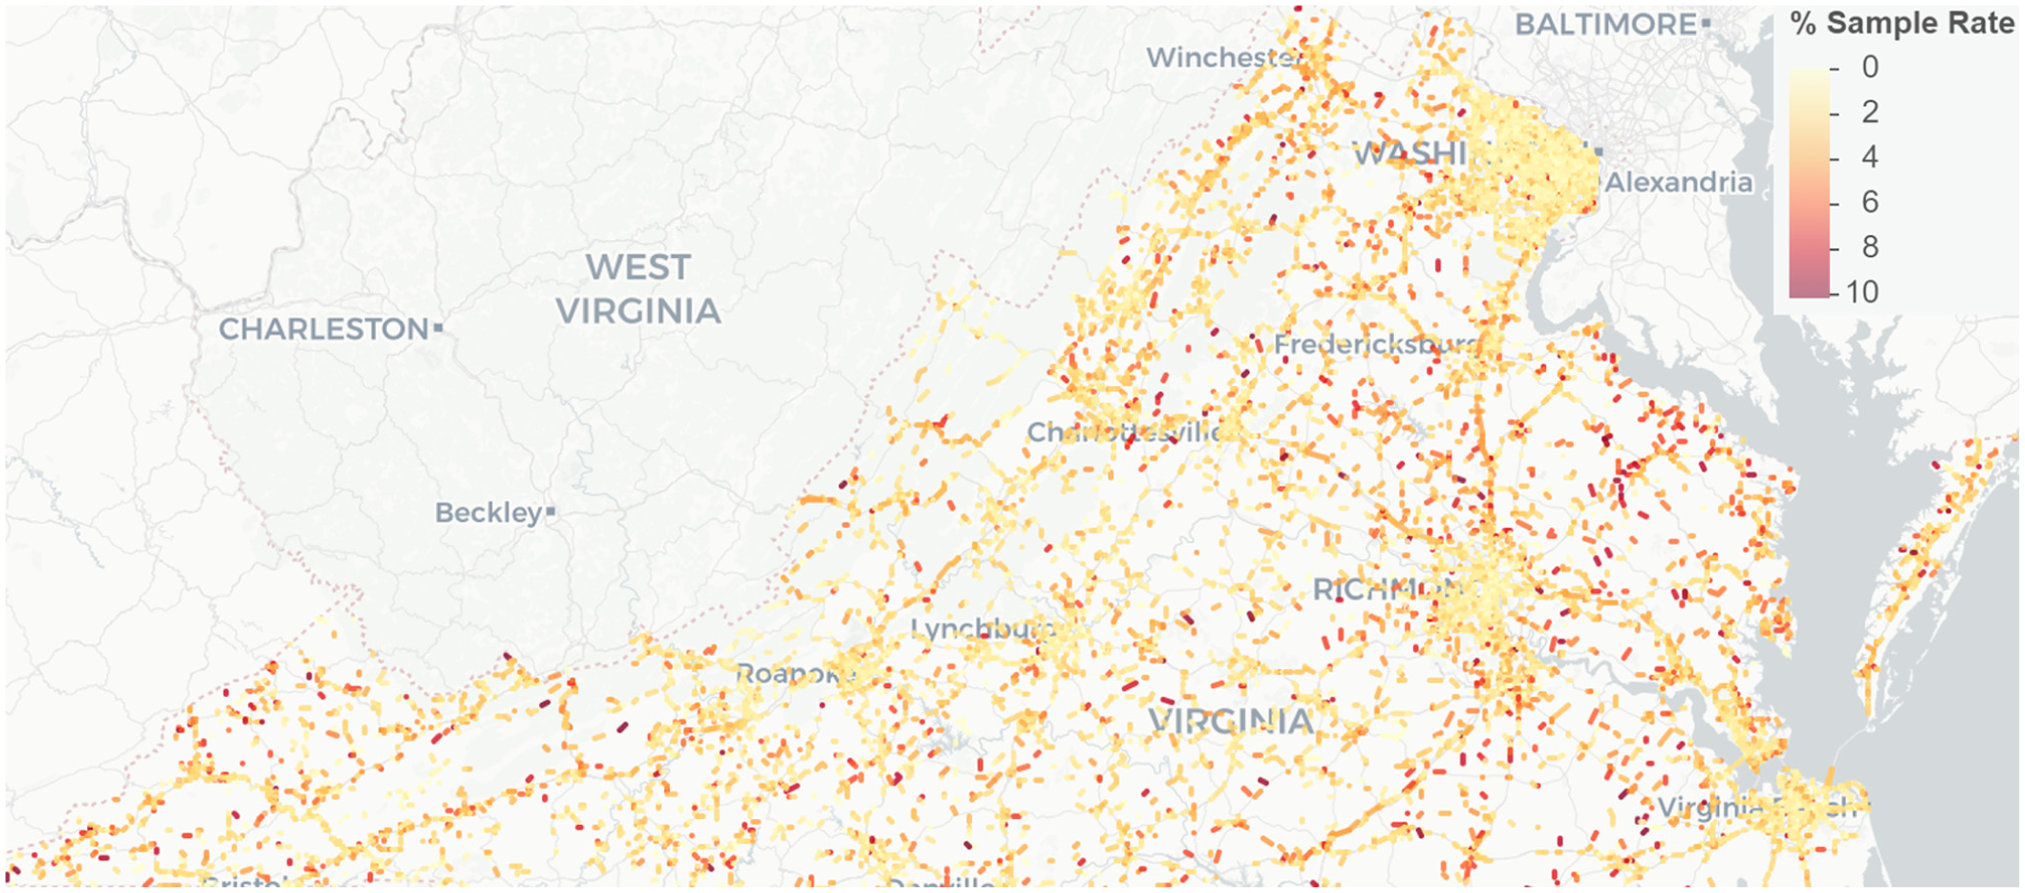
Map of sample rates from Equation 1 for the four major route types: Interstate, U.S. Highway Primary, State Highway Primary, and Secondary roads.
Quantifying Excessive Speeding and Developing an Interactive Application to Map Speeding Metric
One of the main objectives in this paper is to identify a metric to measure excessive speeding. Simply comparing the mean or some percentile of Wejo speed data to the speed limit may not provide a reliable metric for assessing excessive speeding at a network scale. Since not only is the relative difference of the observed speeds in relation to the speed limit important, one also needs to consider the sample size (frequency) in defining excessive speeding. After discussing alternative options with the practitioners at Virginia DOT, the researchers settled on a metric that is defined as follows:

where
In addition to the definition of N above, the researchers also discussed the possibility of using the number of observations above the speed limit for N to potentially eliminate Wejo samples collected under congested conditions—see a sample speed distribution for a segment with congestion in Figure 10. Since this alternative formulation would complicate the interpretation of the index, the definition presented in Equation 2 was adopted. However, as discussed in the following subsection, the analyst can apply temporal segmentation (e.g., by hour of day, weekday/weekend, and seasonal conditions) to reduce the effects of mixed traffic regimes arising from the coexistence of congested and free-flow conditions. This enables the speeding index to be evaluated under more homogeneous operating conditions, improving interpretability and reducing potential bias associated with congestion-dominated periods.
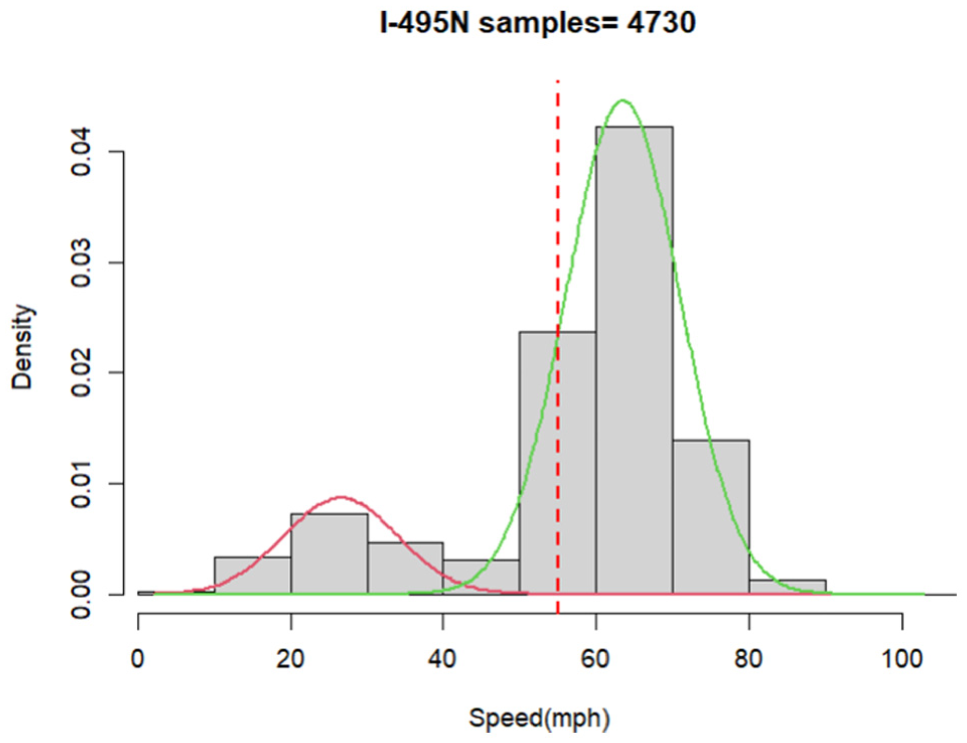
Sample speed distribution for a segment on I-495N with congestion.
It is important to note that the interpretation of the speeding index is inherently dependent on roadway functional classification. Different facility types (e.g., Interstate, U.S. Highway, State Highway, Secondary roads) provide fundamentally different operating environments, including variations in access control, traffic interruptions, geometric design, and congestion levels. For example, limited-access roads generally provide more opportunities for sustained high-speed travel, whereas signalized arterials and secondary roads are subject to frequent interruptions that may limit relatively higher speeds. To account for these differences, all analyses in this study are conducted and interpreted within roadway functional classes as shown below.
An Interactive Application to Map Speeding Metrics
To support analysis and decision making on excessive speeding patterns across Virginia’s road network, the authors developed an interactive web-based application for visualizing the speeding index, defined as the proportion of vehicles exceeding a threshold (e.g., speed limit + 10 mph) on a given segment and period. Given the large size of the Wejo data set, directly interacting with it to extract insight is computationally demanding. On the other hand, facilitating some level of interaction is beneficial to accommodate the varying needs and preferences of the users. Therefore, computationally demanding processes (see Figure 1) are run offline to generate a variety of potentially desired statistics. The user can then interactively define and select criteria (e.g., hour of the day) to be applied to these statistics.
Given the volume and granularity of Wejo probe data, real-time computation based on the raw data is not practical for an interactive experience. Instead, the application architecture was designed around precomputed summary tables. These tables aggregate per-segment speed data by hour and threshold levels for various conditions, such as day type (weekday/weekend) and season. As explained earlier, for each day, the total number of samples exceeding preset thresholds (i.e., 0, 35 to 90 mph) is calculated for each OSM segment and each hour of the day. Using these tables as the basis, the following summary tables are generated.
Weekday and weekend summaries for all four seasons (eight tables), where holidays are excluded.
Summary tables for specific days affected by holiday traffic (Memorial Day, July Fourth, Presidents Day, New Year, Christmas, Thanksgiving, Juneteenth).
Individual days of the holidays within the data set: New Year (12/31 and 1/1), Presidents Day (2/18 to 2/20), Memorial Day (05/27 to 5/30), Thanksgiving (11/22 to 11/27), and Christmas (12/27 to 12/30).
These summary tables contain data for every hour of the day and for each preset threshold mentioned above—see Table 3. These tables provide the necessary input to the interactive app for visualizing and analyzing the speeding index. The application was developed using the R Shiny framework. The application allows the user to select relevant filters (e.g., weekday/weekend, day of the week, season, time of day) and applicable thresholds (e.g., 10 mph above speed limit). More specifically, the application allows users to:
choose the type of day (holiday or regular);
select a season and day of the week type (weekday or weekend) for regular days, or a specific holiday;
define a threshold for excessive speeding (e.g., 10 mph above the limit);
select a time range and geographic scope (statewide or individual counties);
select road type (interstate, U.S. highway, secondaries, etc.);
view the speeding index on an interactive map, where darker shades of red indicate segments with higher levels of excessive speeding; and
download the selected data for offline use or further analysis.
Sample Data Showing the Counts of Speed Observations above Predefined Thresholds
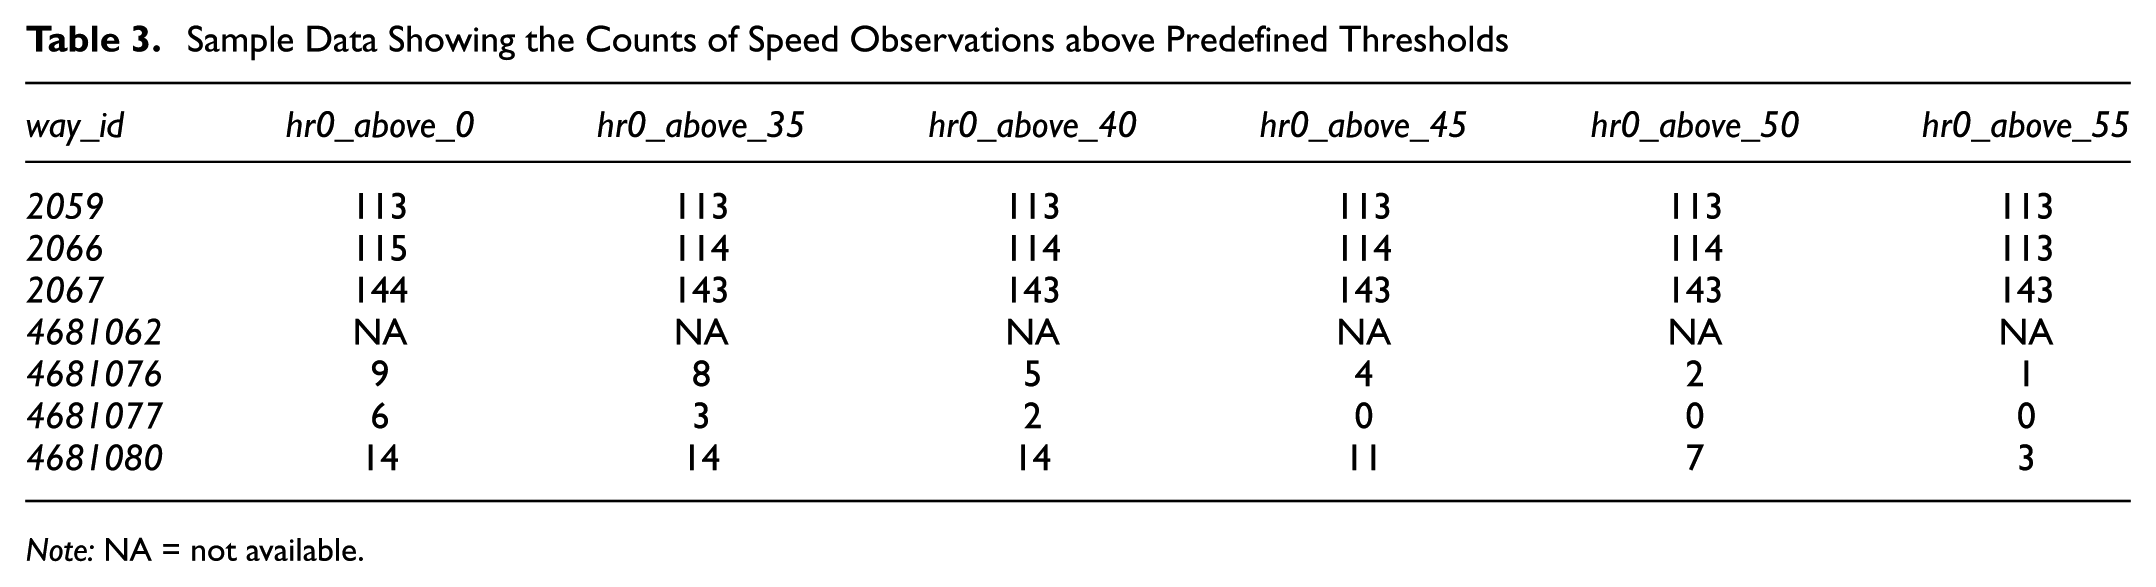
Note: NA = not available.
For the user-defined settings, the application dynamically generates a color-coded map to display the road segments with excessive speeding. The application is designed to run from an internet browser and is hosted on the Shiny Server cloud. According to the definition of the speeding index above, its range is from zero to 1, with larger values indicating more vehicles with excessive speeding. For example, if the index is 0.10, this will imply that 10% of vehicles exceed the set threshold. To visualize the speeding index on a map, the researchers developed a user interface (UI) in R Shiny—shown in Figure 11. This design enables the users to explore spatial and temporal patterns of speeding behavior in a user-friendly and efficient manner. By pre-computing statistics and leveraging modern web tools, the app provides fast response times and the flexibility to customize the queries. In addition, the UI allows a specific segment to be selected for examining the data elements. For example, Figure 12 shows the pop-up window with data for a segment on I-95S.
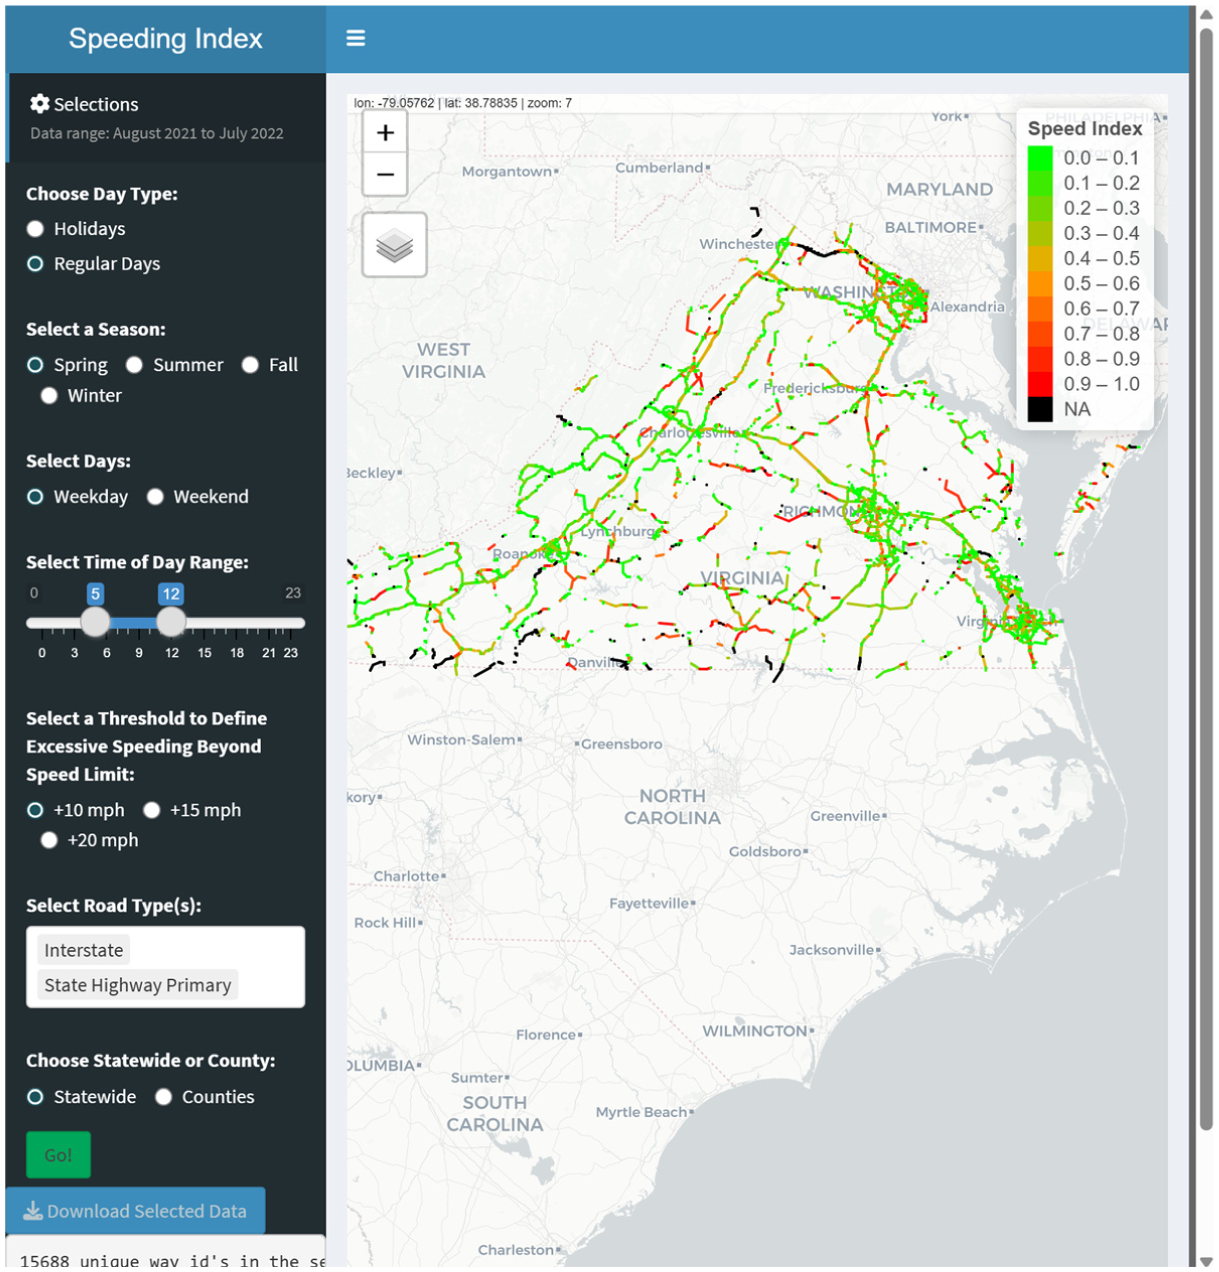
User interface for visualizing and downloading the speeding index.
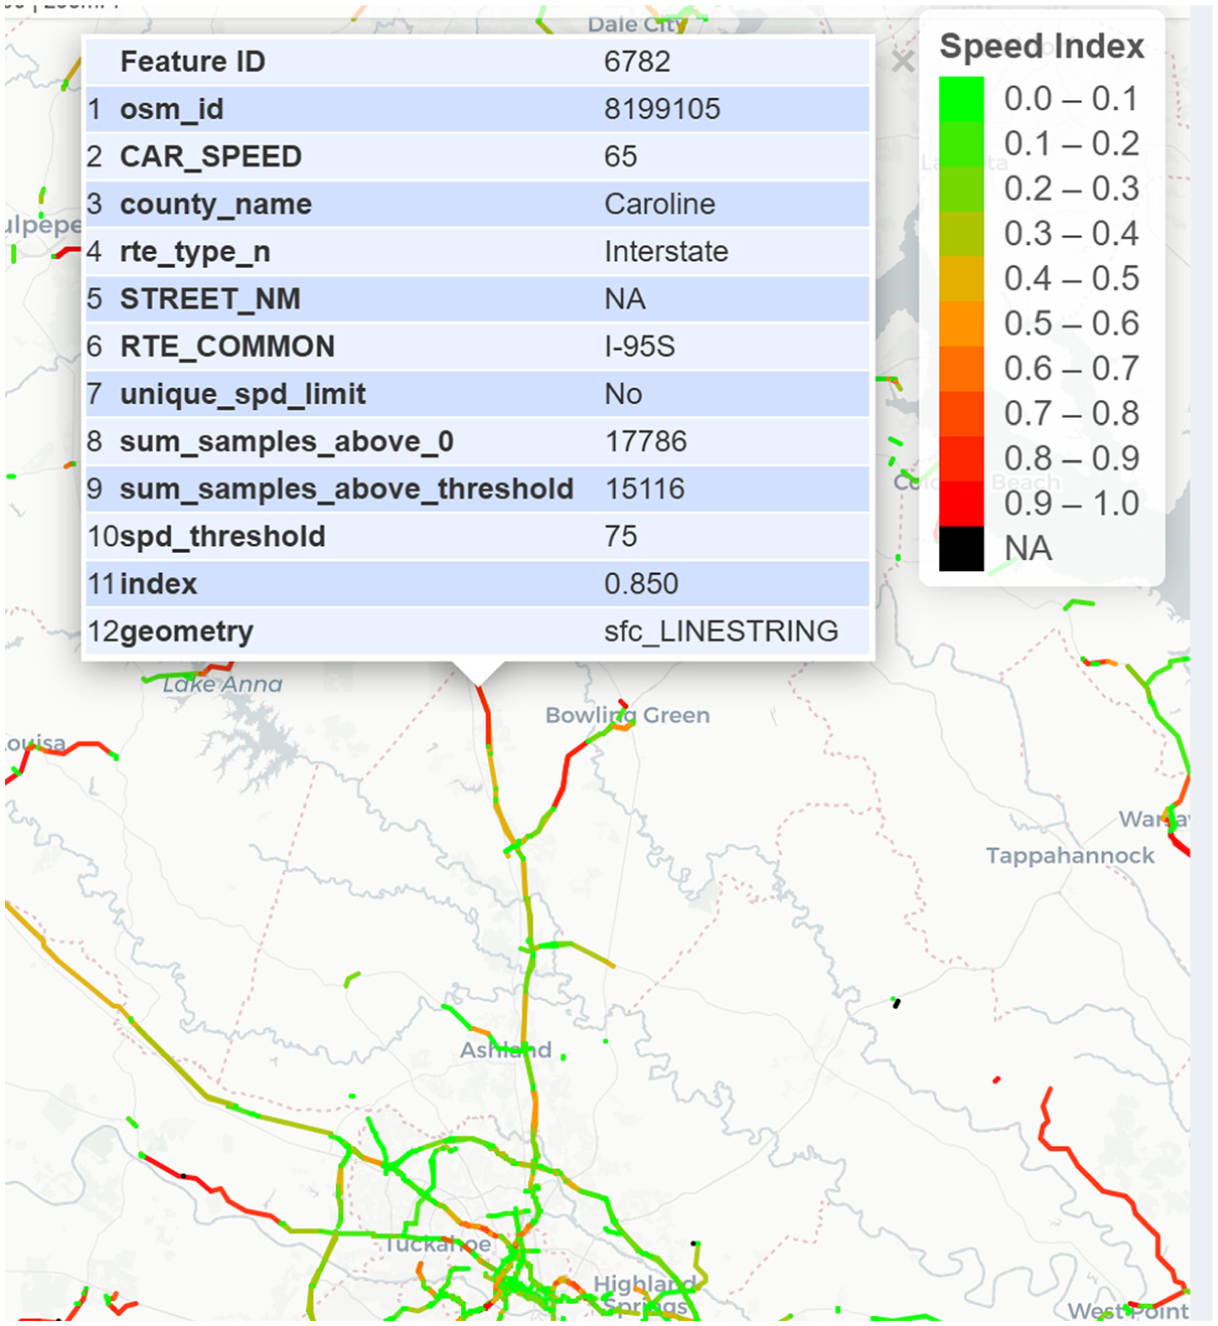
A pop-up window containing data elements for the selected segment.
Since the application allows users to download the filtered data, it is possible to run a specific query and conduct further post-processing to extract additional insights. For instance, we ran a statewide query for Fall weekdays, considering all 24 h and setting the threshold for the speeding index to 10 mph above the posted speed limit. The resulting data set was used to generate the boxplots shown in Figure 13, which compares speeding index distributions across four major road types. As shown in Figure 13, the distribution of the speeding index varies substantially across roadway classes and posted speed limits, supporting the need for stratified analysis. Each boxplot represents the distribution of the speeding index by posted speed limit (CAR_SPEED), with the number of segments shown above each box. For example, there are 1,393 interstate segments with a 55-mph speed limit that had valid data in the selected scenario. Segments with posted speed limits below 55 mph on the interstate system should be excluded from interpretation, as they are either unusual situations or are likely misclassified or contain erroneous speed limit values. From these plots, it is apparent that segments with a 55-mph speed limit have a higher speeding index. For the state highway segments, the ones with a 25-mph speed limit exhibit a large variation and tend to have a larger speeding index. For the U.S. highway segments, the roads with a 60-mph speed limit have the highest median speeding index, suggesting these roadways may experience more persistent speeding above the selected threshold.
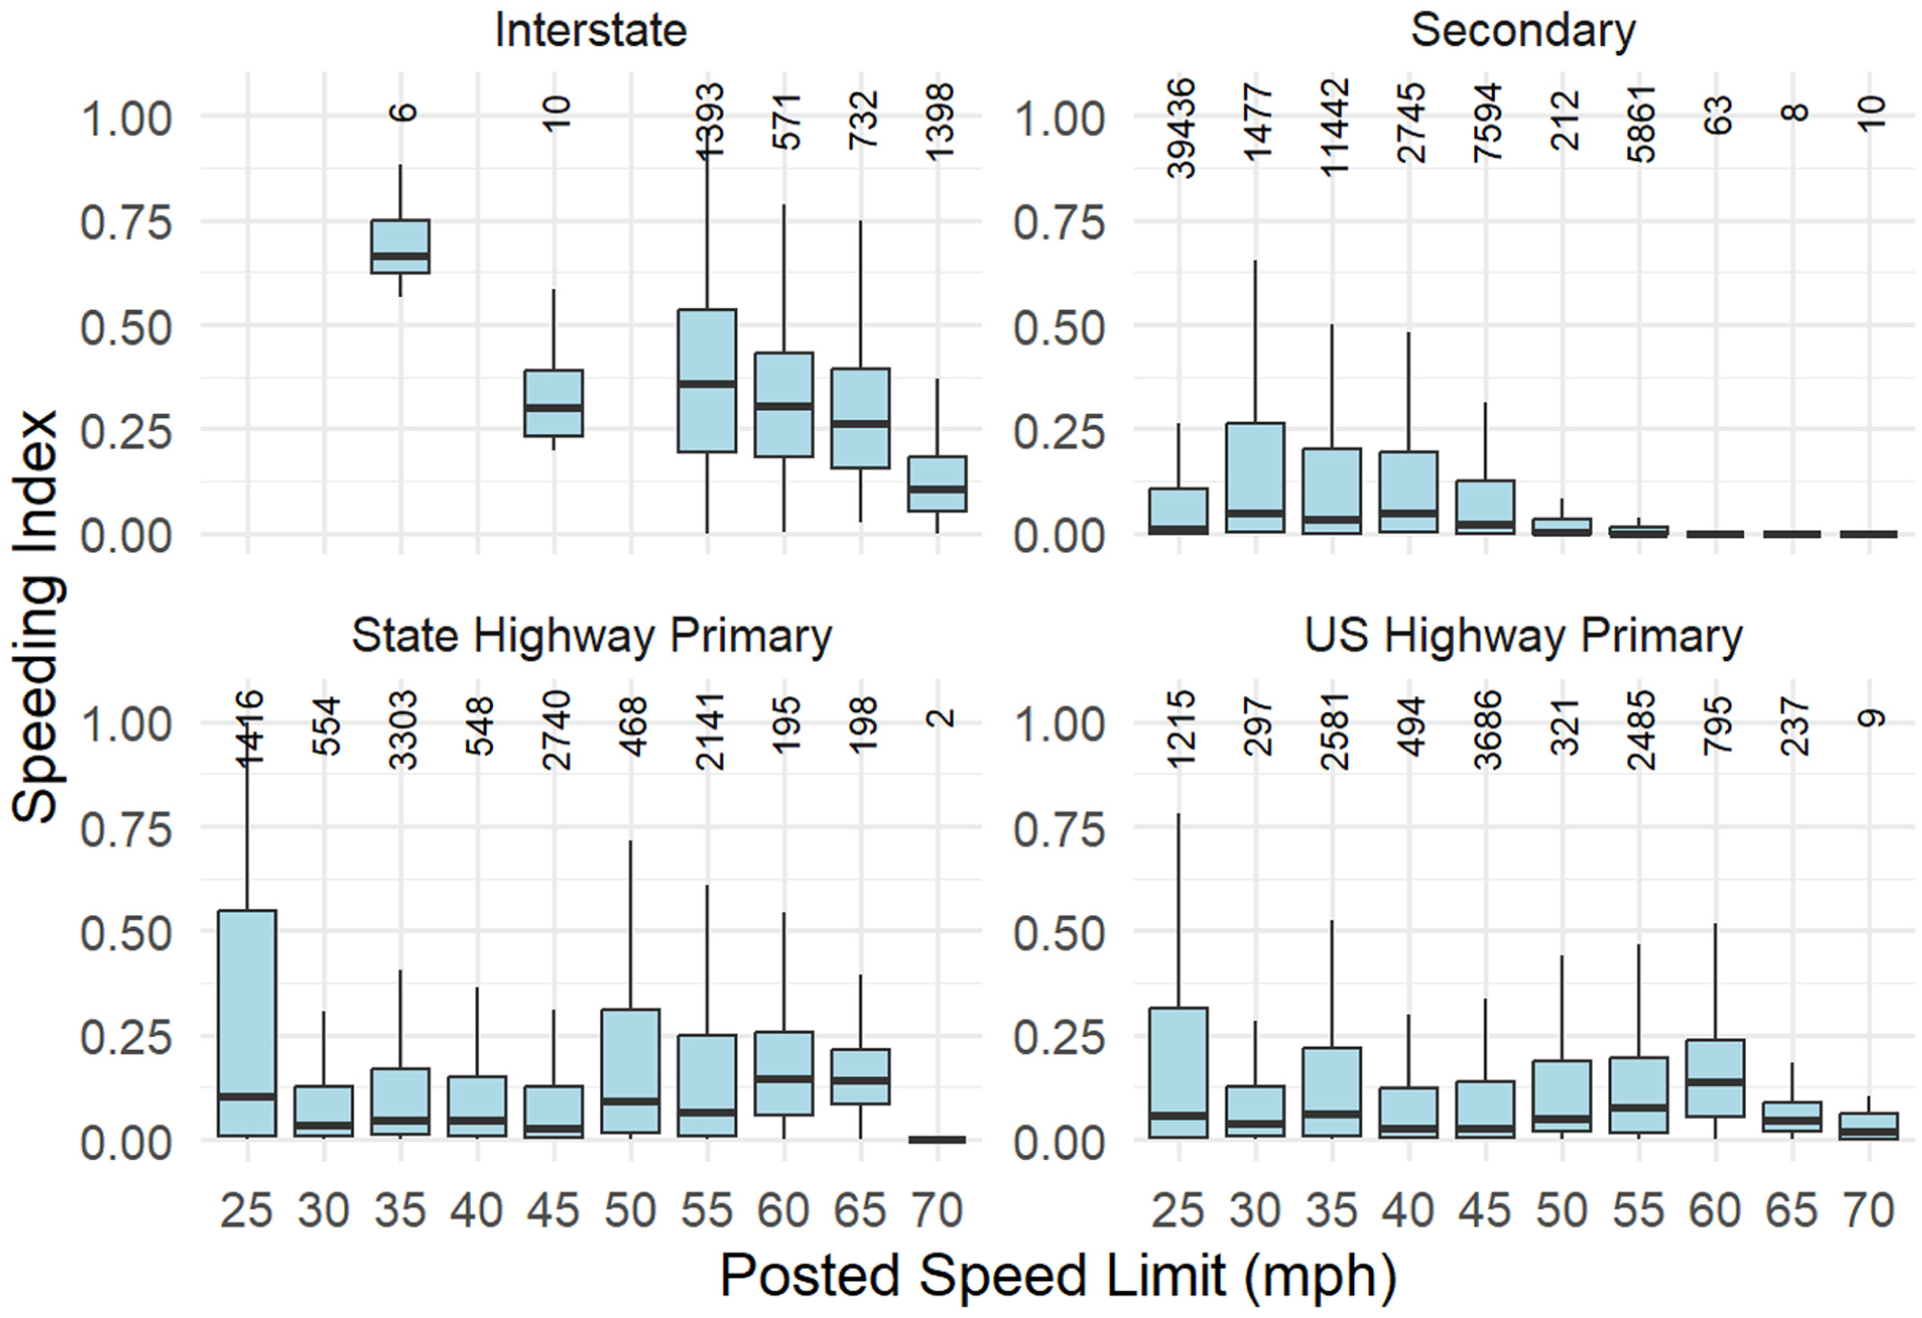
Speeding index by road type and posted speed limit (Fall weekdays using +10mph as the threshold).
As another example, Figure 14 illustrates the variation in the mean speeding index across (also using +10 mph above the posted speed limit as the threshold) various holidays included in the Wejo data set. For context, the figure also includes mean values for Fall weekdays and Fall weekends as reference benchmarks. The results indicate that, for Interstate, State Highway, and U.S. Highway segments, the speeding index on holidays tends to resemble that of weekends, with generally higher values compared with weekdays. The index for weekdays is lower, possibly reflecting the influence of recurring traffic congestion. These analyses show that temporal context (e.g., day type, holiday versus non-holiday) is important when evaluating excessive speeding patterns on the state network. These types of aggregate observations can help identify potentially dangerous or unlawful speeding behavior patterns across the state network and help agencies establish more effective targeted enforcement or design interventions for improving safety and compliance.
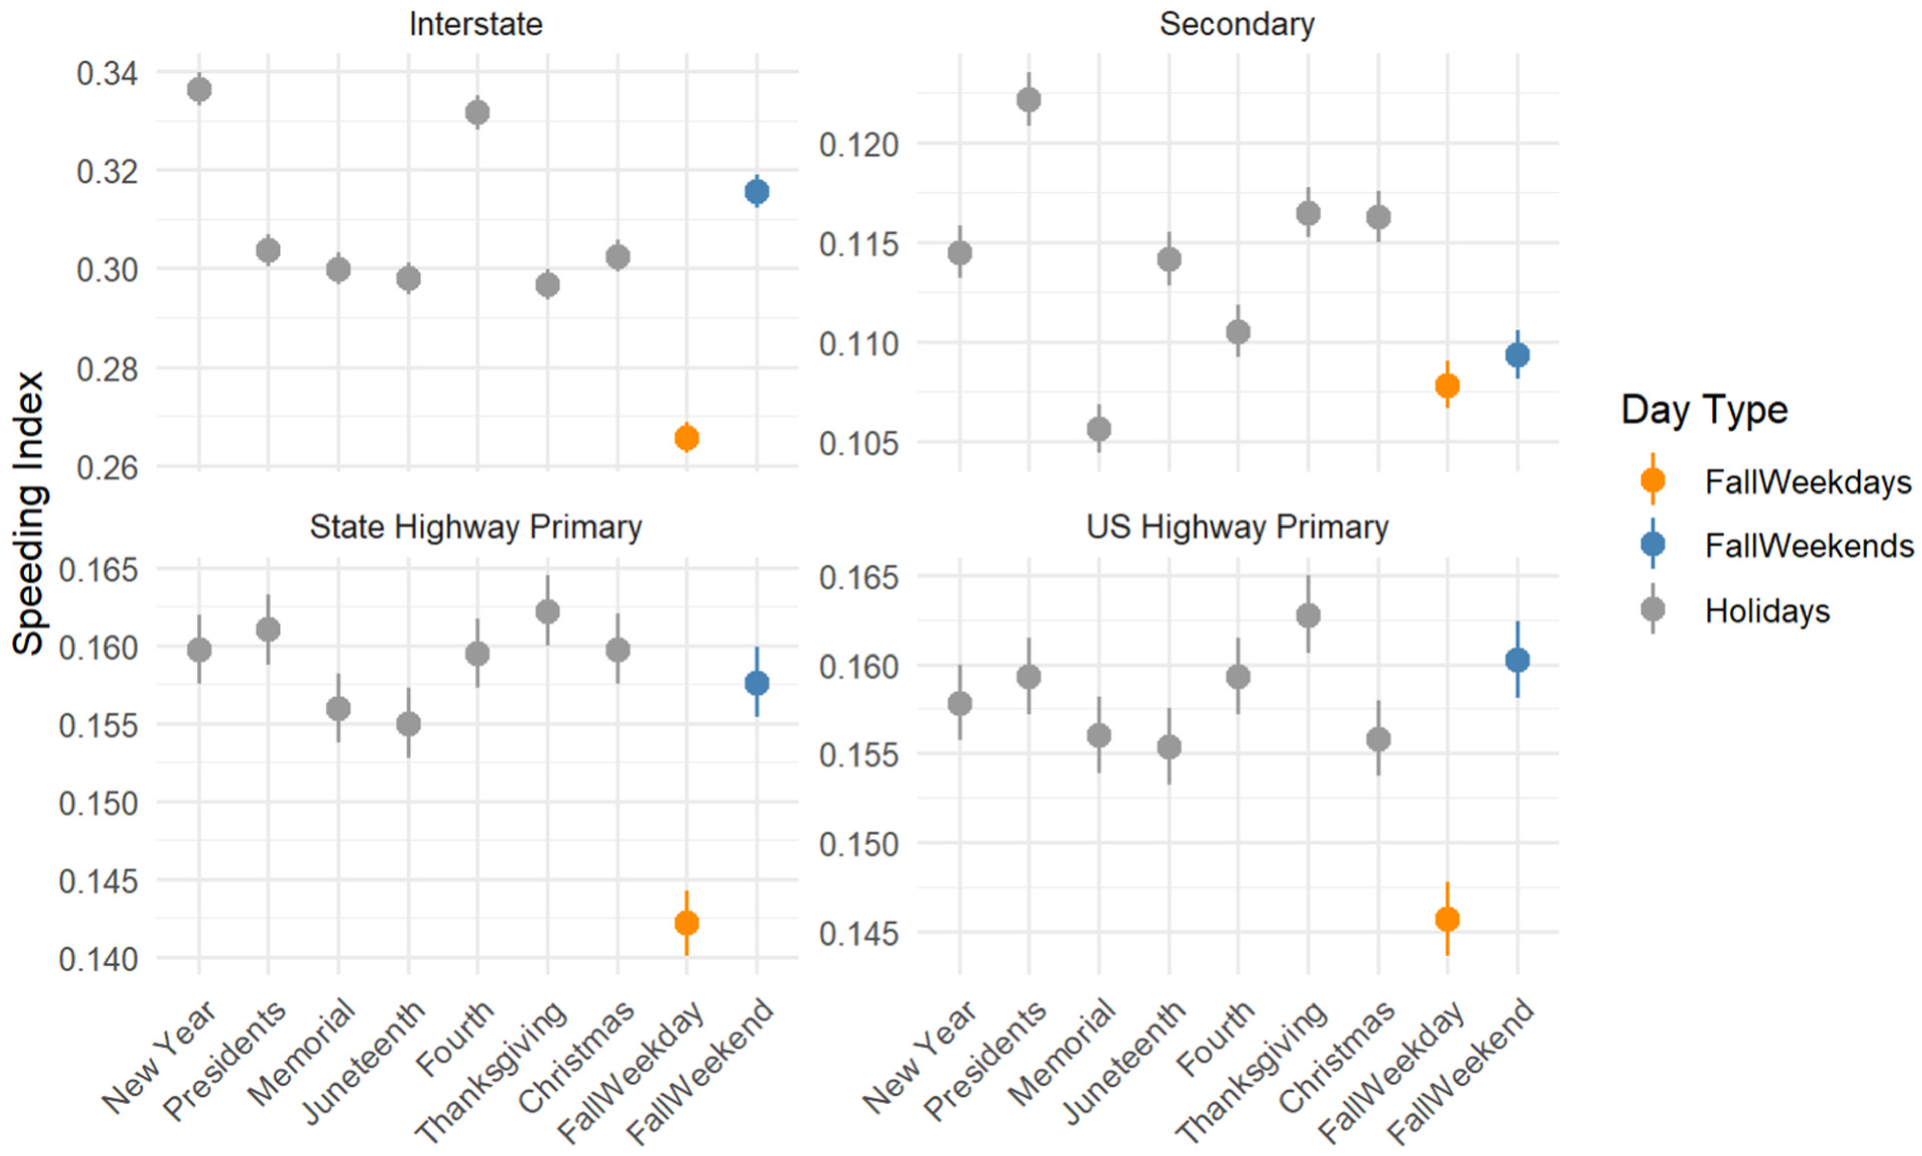
Mean speeding index ± standard error by road type, holidays, and weekdays/weekends in Fall.
As illustrated earlier in Figure 10, speed distributions on some segments exhibit a bimodal structure corresponding to congested and free-flow regimes. This characteristic is reflected in Figures 13 and4, where temporal differences in the speeding index align with changes in traffic conditions: weekday periods, which are more likely to include congestion, show lower index values, while weekends and holidays—characterized by more sustained free-flow conditions—exhibit higher levels of excessive speeding.
Summary of Lessons Learned and Challenges Encountered
This paper demonstrated the feasibility and challenges of using high-resolution connected vehicle data (Wejo) to analyze speeding behavior across Virginia’s highway network. While the connection of the safety/crash statistics with the speed index is not studied in this paper, from a safety and operations perspective, the speeding index provides a practical screening tool for identifying segments and time periods with elevated levels of excessive speeding. These insights can support targeted enforcement strategies, inform the deployment of engineering or operational countermeasures (e.g., speed management, signage, or geometric improvements), and enable agencies to monitor changes in speeding behavior over time. Several other limitations and challenges are described below.
Data Integration Complexity: Combining Wejo trajectory data (mapped to OSM segments) with Virginia DOT’s speed limit and AADT data (based on LRS) required complex network conflation and careful handling of inconsistent segment definitions. For example, some OSM segments are matched to multiple LRS segments with different speed limits. Such segments are flagged in the output files. In the future, directly mapping Wejo data to the Virginia LRS network should be considered to avoid multiple network conflation efforts. This will expedite the analyses since the most relevant data (e.g., speed limits, AADT) are referenced to the LRS network.
Metric Design: A new speeding index was developed to quantify excessive speeding, accounting for both speed and the number of vehicles exceeding a threshold. This provided a more meaningful measure than average or percentile speed alone. It should be noted that because the index is based on each vehicle’s maximum observed speed within a segment, longer segments inherently provide more opportunity for a transient speed spike to occur, thereby increasing the likelihood that a traversal is classified as an exceedance. To test this relationship, we computed the correlation coefficient between segment length and speed index for all interstate segments with 55 mph (1,393 of them), which turned out to be 0.39. This positive but moderate relationship suggests that segment length may contribute to the probability of exceedances, but it is not strong enough to indicate that the index is dominated by length effects alone. We acknowledge this limitation and note that future work could mitigate this bias through alternative formulations, such as distance-normalized exceedance measures, time-weighted metrics, or segmentation strategies that standardize link lengths.
Sampling Limitations: Wejo vehicles represented a small share of total traffic—typically less than 3%—making it critical to assess data representativeness when drawing conclusions. Given the low sample size, the users should avoid overgeneralizing results, especially on low-volume roads for time intervals with relatively few samples. It should also be noted that Wejo data are derived from OEM-connected vehicles, which are typically newer and equipped with advanced telematics, and therefore may not fully represent the typical vehicle fleet. This introduces potential socioeconomic and demographic biases (e.g., differences in income, vehicle ownership, and driving behavior). However, this limitation is not unique to Wejo and is widely recognized across connected vehicle and commercial probe data sets used in transportation research and practice. Accordingly, the speeding index should be interpreted as a measure derived from the observable connected vehicle subset rather than a fully representative estimate of all drivers.
Conclusions
This paper demonstrated the feasibility of using high-resolution connected vehicle data (Wejo) to analyze speeding behavior across Virginia’s highway network. The Wejo data set, totaling more than 3.5 TB across 47,000+ files, required high-performance computing (HPC) resources for efficient processing. Processing data of such scale is computationally intensive and poses significant storage and access management issues. Even with 40-core parallelization, preprocessing a single typical day of data took approximately 10 min.
The analysis of the data revealed that speeding is more prevalent on weekends and holidays, especially on roads with lower posted limits. Some segments (e.g., interstates with 55-mph limits) consistently showed higher speeding indices. It is important to note that vehicle sample size significantly affects data reliability, with low-sample intervals—particularly on lower-volume roads—introducing bias, while higher sample sizes resulted in closer agreement with INRIX data. The speeding index, defined as the proportion of vehicles exceeding a specified threshold above the posted speed limit, proved to be an effective and scalable metric for identifying segments with potentially unsafe speeding behavior. While Wejo data offer high-resolution insights, coverage was uneven, and penetration rates were typically below 3% of the daily traffic. A web-based application was developed that leverages precomputed metrics to deliver a responsive interface for exploring speeding trends by geographic location, road type, and temporal context, with customizable data export features. The app’s interactive color-coded maps, data download features, and scenario-based summaries (e.g., by day type, road class, and speed limit) provide actionable insights for speed enforcement and planning.
It is well known that speeding and speed dispersion (e.g., vehicles going much faster than other traffic) increases the risk of crashes and the severity of injury when a crash occurs ( 25 ). Future research will focus on integrating speeding metrics with crash and enforcement data to explore safety implications. Additional efforts will include fusing connected vehicle data with contextual variables such as weather, geometry, and vehicle classification data, and exploring machine learning and statistical modeling approaches to identify and predict high-risk speeding segments under varying conditions.
Footnotes
Acknowledgements
This paper was developed from a project supported by Virginia DOT’s Virginia Transportation Research Council (VTRC). The authors gratefully acknowledge the project technical review panel members—Simona Babiceanu, Chien-Lun Lan, and Mena Lockwood—for their guidance and feedback. The authors also thank Mike Fontaine, who served as project manager, for coordinating panel meetings, facilitating access to the Wejo data, and providing valuable comments throughout the study. The authors further acknowledge Jungwook “JJ” Jun for providing access to the P4P portal for speed limit and AADT data; Zizheng Yan for assistance with the literature review; Olcay Sahin for assistance with the interactive Shiny application; and Gibran Ali from VTTI for providing the conflated OSM and LRS networks. ChatGPT was used to assist with text compilation and grammar checking.
Author Contributions
The authors confirm contribution to the paper as follows: study conception and design: Cetin, Xie, and Yang; data processing and analyses: Cetin; interpretation of results: Cetin, Xie, and Yang; draft manuscript preparation: Cetin. All authors reviewed the results and approved the final version of the manuscript.
Declaration of Conflicting Interests
The authors declared the following potential conflicts of interest with respect to the research, authorship, and/or publication of this article: Kun Xie and Hong Yang are on the Transportation Research Record’s Editorial Board.
Funding
The authors disclosed receipt of the following financial support for the research, authorship, and/or publication of this article: This research was supported by Virginia Transportation Research Council (grant no. VTRC RC00164 /UPC121564). The raw Wejo data used in this paper is not publicly available because of data-use restrictions and proprietary licensing agreements.
