






Abstract
Asphalt pavements, subjected to continuous traffic loads and environmental stressors, undergo deterioration processes that gradually compromise their structural and functional integrity. Pavement management systems (PMS) have been implemented to forecast deterioration and plan maintenance, but empirical models commonly used in PMS encounter limitations in data-scarce environments. To address this, a probabilistic-deterministic approach is proposed to evaluate the functional condition of in-service asphalt pavements. The international roughness index (IRI) was selected as a functional condition indicator. IRI measurement data were used for two modeling approaches: (i) a Markov chain-based probabilistic model for short-term IRI condition states and (ii) a deterministic model for long-term IRI prediction and remaining service life estimation. The probabilistic model categorizes the IRI into five condition states, while the deterministic model uses exponential regression with estimated pavement age as input. Results show that the Markov chain model effectively represents functional deterioration and provides short-term predictions without historical data. Analysis revealed a gradual decline in pavement condition with a corresponding rise in lower condition states across all functional classes. State roads exhibited an accelerated transition to lower states, highlighting the need for early interventions. A faster degradation rate was also observed once pavements declined to “fair” or “poor.” Validation confirmed that the short-term predictions were consistent with field observations, with absolute state proportion differences ranging from 0.0002 to 0.1116. The deterministic model demonstrated accurate IRI predictions, with R2 ranging from 0.84 to 0.86. Consequently, integrating both models enables reliable condition evaluation and maintenance planning, regardless of historical data availability.
Keywords
Introduction
Background
Asphalt pavements gradually deteriorate over time, owing to traffic loads and environmental effects, making regular evaluation and timely maintenance necessary. Without systematic monitoring and timely maintenance, such degradation can accumulate over time and lead to significant performance failures. In response to these challenges, transportation agencies have adopted pavement management systems (PMS) to assess pavement conditions, forecast deterioration, and plan proactive maintenance interventions ( 1 – 3 ). PMS support both short-term maintenance actions and long-term rehabilitation strategies for decision-making frameworks ( 4 – 9 ). Proper pavement performance modeling approaches play a critical role in this context, as they support efficient maintenance planning and optimal budget allocation. To that end, various performance modeling approaches have been developed to support PMS, ranging from deterministic formulations to more stochastic frameworks.
Pavement deterioration models have been developed using empirical, mechanistic-empirical, and probabilistic approaches. Mechanistic models, grounded in structural mechanics, evaluate pavement responses to traffic and environment-induced stresses and strains, while mechanistic-empirical models combine mechanistic response parameters with field data to simulate deterioration in more realistic conditions ( 10 , 11 ). Furthermore, both mechanistic and mechanistic-empirical methods are mainly used for pavement structural evaluation. In contrast, empirical models, which remain the most commonly applied approach in PMS, because of their relative simplicity and reliance on routinely collected monitoring data, predict future performance based on statistically derived relationships from historical observations ( 12 ). Empirical approaches are further divided into regression models, artificial neural network models, and probabilistic models ( 13 ). Justo-Silva et al. ( 14 ) introduced a broader classification framework, categorizing models based on formulation type (deterministic vs. probabilistic), application level (project vs. network), dependent variable type (global vs. parametric), and independent variable type (absolute vs. relative). Although empirical models are straightforward to implement, their effectiveness depends on the availability of historical data; this presents significant challenges in data-scarce environments.
In recent years, probabilistic approaches have received substantial attention as an alternative when data availability is limited, because empirical models require sufficient historical data to ensure high accuracy ( 15 , 16 ). In PMS, the Markov chain model, one of the probabilistic approaches, represents pavement deterioration as a discrete-time stochastic process, wherein transitions between predefined condition states depend solely on the current state, reflecting the memoryless property of the model ( 17 ). This framework aligns with the common practice of categorizing pavement conditions into discrete levels during standard inspection processes ( 14 , 18 , 19 ). Consequently, despite such limitations as the lack of standardized data, particularly for local networks, which limits broader applicability, Markov chains remain widely adopted for their adaptability and interpretability ( 20 ). Deterioration models utilized in PMS are broadly categorized as stochastic (Markov) approaches, which estimate state transition probabilities, and deterministic (empirical regression) approaches, which fit fixed functional relationships ( 21 ). The probabilistic-deterministic hybrid framework was consequently selected to leverage the Markov chain’s ability to model short-term stochastic dynamics under data sparsity while simultaneously utilizing the empirical model to provide long-term continuous prediction of remaining service life (RSL) ( 22 ).
While advanced variants, such as inhomogeneous, semi-Markov, and hidden Markov models have been introduced to address limitations related to time-dependence, variable state holding times, and latent deterioration mechanisms, their implementation typically requires long-term detailed datasets that are often unavailable in practice ( 17 , 20 , 23 , 24 ). To address such data constraints, Li et al. ( 25 ) showed that deterministic pavement performance models can be systematically converted into time-related Markov processes to simulate deterioration. This approach enables the efficient development of transition probability matrices (TPMs) without relying on extensive long-term observational data. Similarly, a study by Rose et al. ( 26 ) highlighted the influence of construction quality and pavement age on deterioration rates. El-Khawaga et al. ( 21 ) reported a 65% coincidence ratio between predictions generated by a master sigmoidal curve and a Markov chain model, suggesting that both methodologies can be combined to enhance modeling accuracy. Additionally, Arambula et al. ( 27 ) demonstrated the practical benefits of integrating statistical and data-driven techniques. Collectively, these findings underscore the value of combining deterministic and probabilistic approaches, particularly where model accuracy, data availability, and decision-making reliability are critical.
Objective and Scope
The primary objective of this study is to develop an enhanced approach to evaluate the functional condition of asphalt pavements with limited pavement condition data. The international roughness index (IRI), widely used in PMS, was employed as a functional condition indicator. The IRI can represent overall pavement surface conditions by reflecting various pavement surface distresses, such as cracking, rutting, and moisture damage. Historical IRI data were collected from the Indiana Department of Transportation (INDOT) database. Since the prediction of future pavement conditions is important for PMS to determine an appropriate maintenance strategy, in this study, two approaches were identified to predict future functional conditions: (i) a probabilistic approach and (ii) a deterministic approach. A Markov chain model was developed as the probabilistic approach to predict overall future IRI states for a target pavement section, because it is particularly beneficial when predicting future states with limited data. It should be noted that five states were defined and used for the probabilistic approach to represent the overall functional condition of the pavement section. For the deterministic approach, an IRI prediction model developed in a previous study ( 28 ), using the same IRI database applied here, was adopted. This deterministic IRI prediction model allows for the prediction of future IRI values, which can be used to estimate the pavement RSL for better maintenance decision-making. Finally, both probabilistic and deterministic approaches were integrated to enhance functional condition evaluation in PMS, regardless of limitations in available pavement condition data.
Data Description for Pavement Condition Modeling
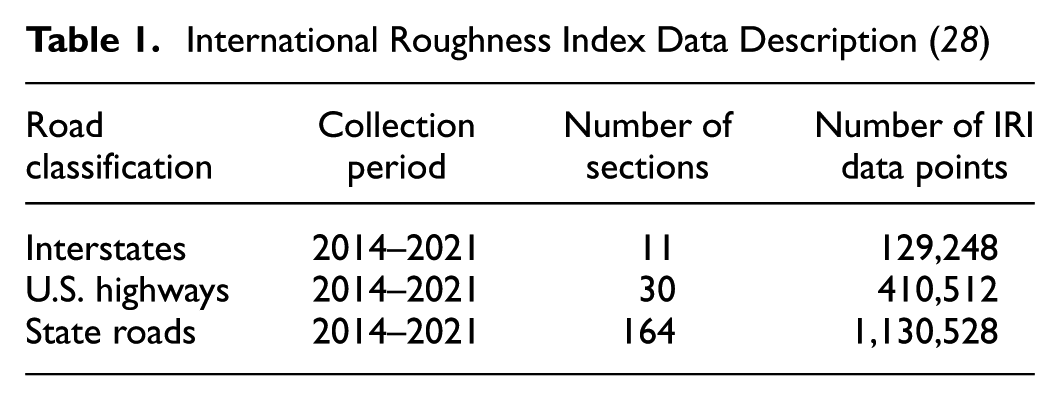
The historical IRI data collected by INDOT for the state’s flexible pavement network were used to develop both probabilistic and deterministic approaches to predict future IRI trends. As summarized in Table 1, the dataset includes annual IRI measurements from 2014 to 2021, collected at approximately 160-m intervals at consistent geographic locations. The sample covers 11 interstates, 30 U.S. highways, and 164 state roads for different roadway classifications in Indiana. These roadway classifications serve as proxies for design standards, structural capacity, and expected traffic loads, as each category is engineered to accommodate different levels of demand. The resulting dataset includes 129,248 IRI data points for interstates, 410,512 for U.S. highways, and 1,130,528 for state roads. It is important to note that the same dataset employed in a prior study for the development of the deterministic IRI prediction model was used in this research ( 28 ).
International Roughness Index Data Description ( 28 )
Owing to the absence of detailed construction records, maintenance logs, and pavement age data, the year of observation was used as a surrogate for time in both approaches. To enhance data quality, the time series were filtered to eliminate apparent measurement errors or signs of undocumented maintenance. Specifically, any decrease in IRI between consecutive years, under the assumption of no maintenance, was considered an anomaly and removed. For example, if the 2017 IRI measurement was smaller than the 2016 IRI measurement, only the IRI data from 2014 to 2016 were used for analysis, while the data collected from 2017 to 2021 were excluded. This assumption rests on the principle that pavement roughness typically increases monotonically in the absence of intervention.
Although both approaches were based on the same underlying dataset, they differ in spatial aggregation and data utilization. The deterministic model treats individual test locations (i.e., 160-m segments) as an independent observation of roughness progression over time. However, since the data collection year does not necessarily reflect pavement age, and given the varied construction timelines across segments, an additional preprocessing step was performed to estimate pavement age to improve alignment of temporal indices with actual deterioration behavior at the network level.
However, the probabilistic (Markov chain) model uses condition state transitions derived from section-level average IRI values for each year. This approach does not require detailed historical tracking, making it suitable and beneficial for data-limited environments, such as those lacking performance indicators, pavement structure information, or maintenance history. It is important to note that the same dataset was employed for both probabilistic and deterministic approaches to demonstrate their potential for reliable condition forecasting in the absence of complete historical records. Details of the data processing steps for each approach are provided in the following sections.
Probabilistic Approach to Predict IRI States
Markov chain modeling is one of the most widely used approaches for forecasting pavement deterioration and effectively presenting the performance of pavement infrastructure across different road types. Markov chain theory offers a probabilistic framework for constructing models that predict pavement deterioration over time. At their core, Markov chain models work well for pavement deterioration because they focus on two main principles: the analysis of pavement conditions at discrete time intervals (e.g., annually or biennially) and the categorization of pavement conditions into a finite set of distinct states or condition bands. These principles align closely with standard practices for monitoring road conditions, which include periodic evaluations to categorize pavement quality into defined groups. One of the fundamental assumptions of Markov chain theory, critical for modeling pavement deterioration, is the Markov property, indicating that the future condition of a pavement segment depends solely on its current state ( 13 , 19 , 23 , 24 , 29 , 30 ). In addition, the homogeneous Markov chain used in this study assumes stationary transition probabilities over time, although pavement deterioration in practice may accelerate as pavements age. It is important to note that the homogeneous Markov chain, along with this assumption, was adopted for this study to account for the limited data availability.
Data Preparation
Defining the Number of States and State Vectors
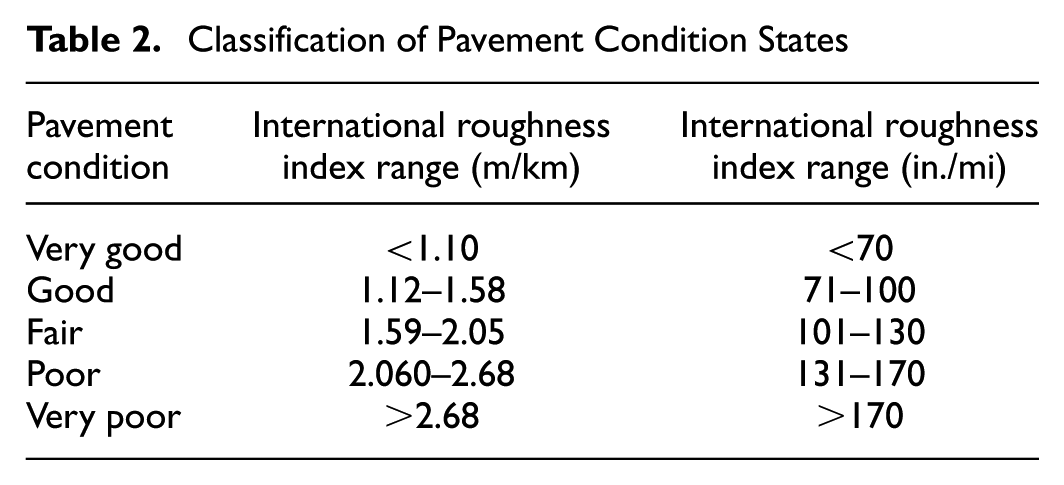
The model categorizes pavement conditions into five states based on IRI measurements, as summarized in Table 2. This classification enables a finite state for modeling, which is in agreement with Markov chain theory principles and facilitates the detailed analysis of pavement performance across varying condition levels ( 23 ). Figure 1 shows the percentage of sections in each defined condition level from 2014 to 2021, as derived from the available IRI datasets.
Classification of Pavement Condition States
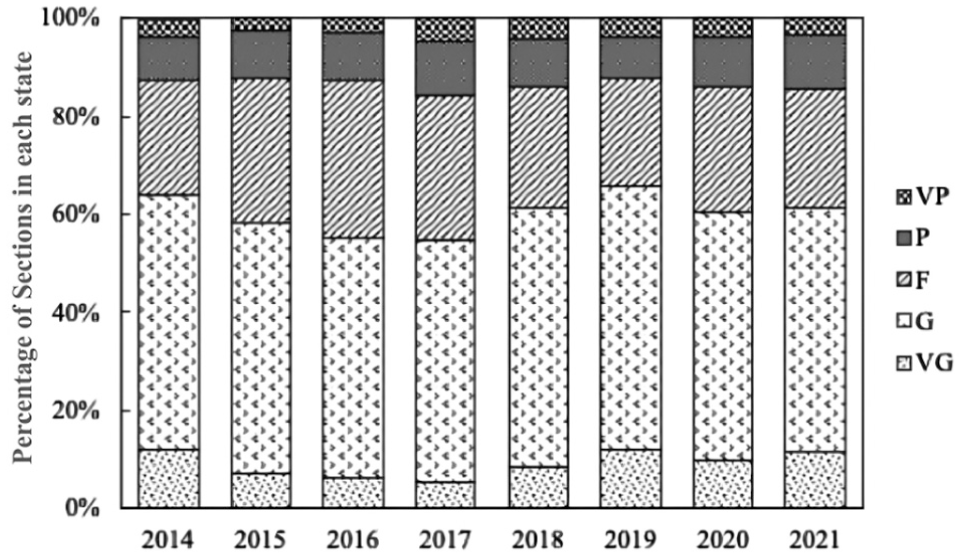
Temporal progression of roadway conditions from 2014 to 2021.
In the context of Markov chain modeling, two essential vectors are utilized: (i) the initial state vector and (ii) the start condition vector. The initial state vector represents the hypothetical distribution of pavement section conditions immediately following construction. Specifically, at the inception point, or time zero, it is assumed that all pavement sections are categorized under the “very good” condition. This assumption is mathematically represented by the initial state vector X(0) = [1, 0, 0, 0, 0], indicating a 100% probability of being in the “very good” state at the start ( 23 , 31 – 33 ). Conversely, the start condition vector is derived from actual data reflecting the current condition in a specific year, here taken as 2021. This vector captures the current distribution of pavement conditions across the network by assessing each pavement section’s IRI value, assigning it to one of five condition states, and calculating the proportion of the network’s total length that each state encompasses ( 13 , 20 , 23 ).
Duty Cycle Adaptation
Given that observable transitions in pavement condition are not consistently detected on an annual basis, in this study a 2-year duty cycle was adopted, aligning with INDOT’s standard measurement cycle. A 2-year interval provides a more adequate temporal window to capture meaningful changes in pavement condition. This approach enhances the estimation of transition probabilities by reflecting underlying deterioration trends rather than short-term fluctuations or noise typically present in annual assessments.
Markov Chain Modeling: TPM
Central to the methodology is the TPM utilized in Markov chain modeling to predict future pavement conditions ( 34 ). This matrix models the life of a pavement segment from its inception in near-perfect conditions, as indicated by current state vectors, through successive duty cycles to capture its deterioration. Each element within the TPM, denoted P ij , represents the probability of a pavement transitioning from its current state i to a future state j within one duty cycle ( 30 ). A standard 5 × 5 TPM is presented as
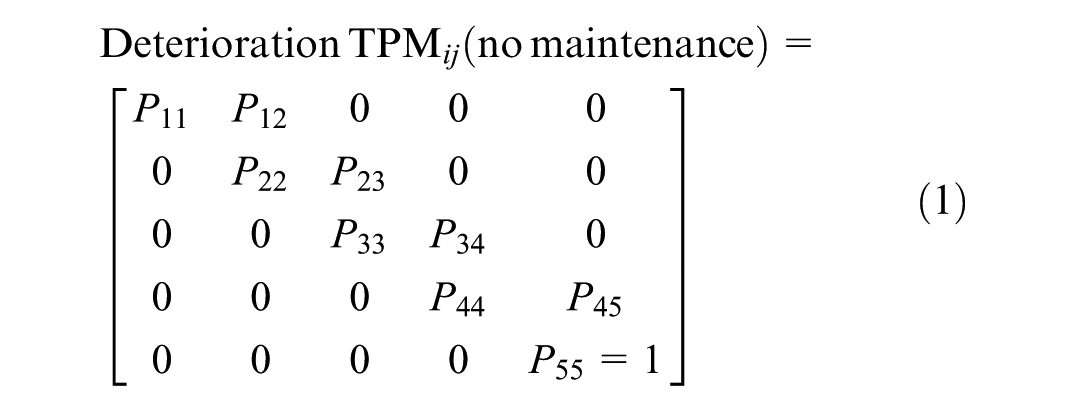
where the pavement condition states are numbered as 1 = very good, 2 = good, 3 = fair, 4 = poor, and 5 = very poor, to maintain consistency with the earlier condition classifications. The matrix uses specific probabilities, such as P12, P23, and so on, to show how likely it is to move from one state to another. It also uses probabilities like P11, P22, and so on, to represent how likely it is for a condition to stay the same. To address limitations arising from sparse or uneven transition data, the initial TPMs were adjusted based on prior estimates supported by relevant literature on probabilistic pavement modeling in Markov chain principles. They were subsequently reviewed by experienced INDOT pavement engineers to ensure their practical applicability and contextual relevance ( 13 , 23 , 24 ). For instance, two key modeling constraints were imposed in the formulation of these assumptions, as proposed by Pérez-Acebo et al. ( 30 ):
Improvements in road conditions without intervention are considered impossible; therefore, P ij = 0 for i > j.
The final state (P nn = 1) acts as an absorbing state, indicating that the pavement has reached its worst condition and cannot deteriorate further without reconstruction.
Under the stationarity assumption, where transition probabilities remain constant over successive duty cycles, each TPM entry P ij is first estimated from observed transitions using the count-proportions method:

where n ij is the number (i.e., total length) of road sections transitioning from state i to state j within a duty cycle, and n i is the total number of sections in state i before the transition ( 30 ).
Deterministic Approach to Predict IRI Values
The empirical model developed by Park et al. ( 28 ) was adopted for this study to predict future IRI values based on the trend of long-term IRI deterioration. The form of the deterministic model, along with the coefficients used to represent the IRI deterioration trends for all road classifications, is

where n = pavement age (year), IRI n = IRI value at pavement age n (m/km), and a, b, and c are coefficients: for interstates, a = 0.8325, b = 0.07958, c = −0.3354; for U.S. highways, a = 0.5297, b = 0.1162, c = 0.02596; and for state roads, a = 0.525, b = 0.1082, c = 0.04531.
The deterministic IRI prediction model was developed using time-shifted IRI data; a time-series data shift was used to convert the time index from the data collection year to the pavement age. For each field section, the empirical IRI prediction model previously developed by Lee et al. ( 35 ) was employed to estimate the pavement age of the initial data point, corresponding to the IRI measurement in 2014. The model presented by Lee et al. ( 35 ) also uses an exponential form of the equation with two inputs, initial IRI and pavement age, to predict IRI. This allows the pavement age to be backcalculated using the given initial and current IRI values. For the time-series data shift, an initial IRI value of 0.54 m/km was used, based on the maximum IRI limit for asphalt pavement construction in the INDOT specification. It is important to note that the assumed initial IRI value might affect future IRI prediction. Since the IRI requirement after construction varies by state or country, it is recommended to calibrate Equation 3 using the initial IRI determined based on local IRI requirements and field data, following the procedure presented by Park et al. ( 36 ). Then, the pavement age in the year 2014 was estimated using the assumed initial IRI and the IRI measurement in 2014 for each section. Since the data were collected every year, the pavement ages for the remaining data points were determined by adding the number of years since 2014. Consequently, using this time-series data shift procedure, the time index is converted from the data collection year to pavement age, allowing for the representation of a long-term IRI deterioration trend. Thus, pavement age is used as the input for the deterministic model, as expressed in Equation 3. Furthermore, the time-series data shift procedure can be applied to calibrate the coefficients in Equation 3 to reflect local pavement conditions; more details of this procedure can be found elsewhere ( 28 ). This model does not account for structural condition, which might also affect functional performance trends.
Since the deterministic model dictates IRI deterioration with respect to pavement age, the RSL can be estimated using an IRI threshold (IRIthreshold). A procedure to estimate RSL using the deterministic model was presented in a previous study, as shown in Figure 2 ( 36 ). By solving Equation 3, the following equations can be derived by substituting the IRI threshold and the current IRI measurement, respectively, to calculate the design life and the current pavement age:
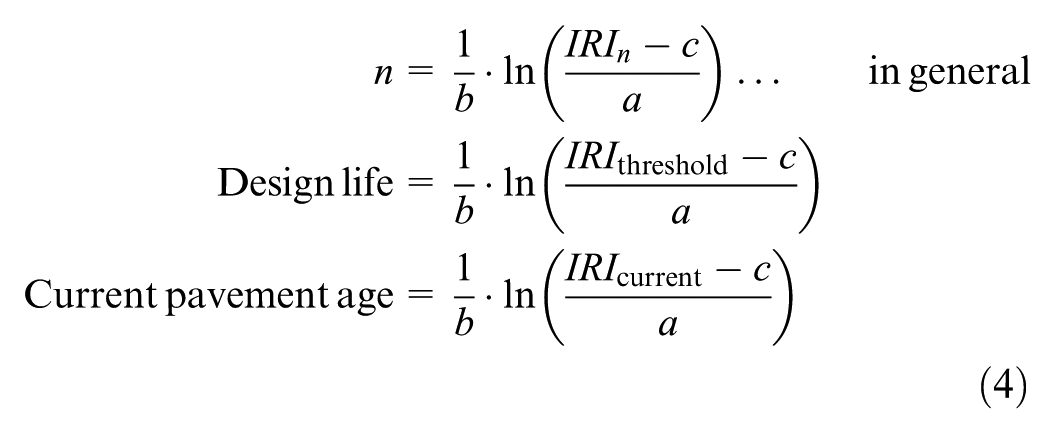
where IRIthreshold = threshold IRI (m/km) and IRIcurrent = current IRI measurement (m/km).
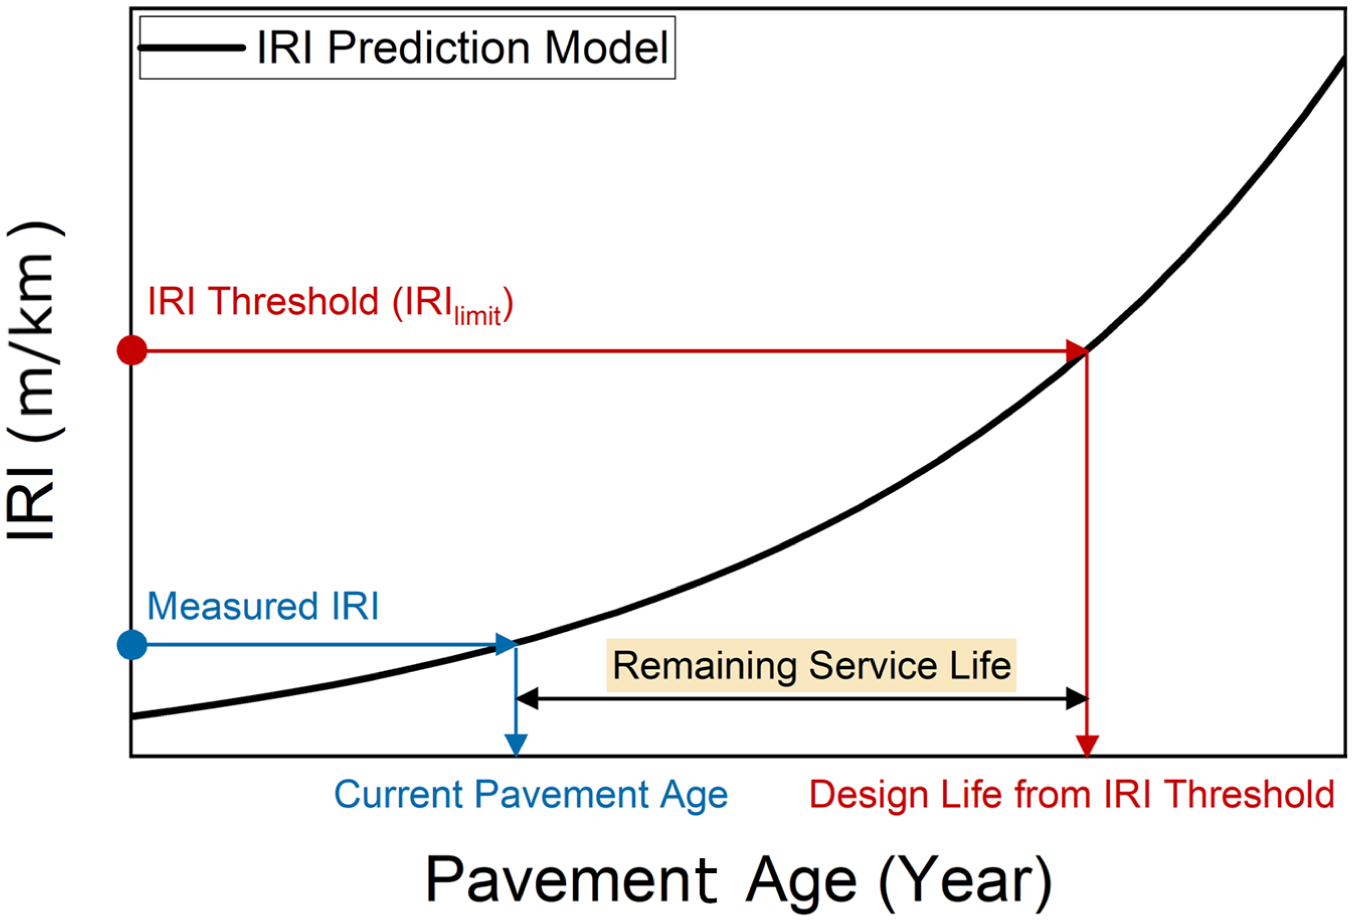
Determination of remaining service life based on international roughness index (IRI) measurements ( 36 ).
As shown in Figure 2, the RSL can be determined as the difference between the design life and the current pavement age. Consequently, the following equation can be derived from Equation 4 to estimate the RSL:
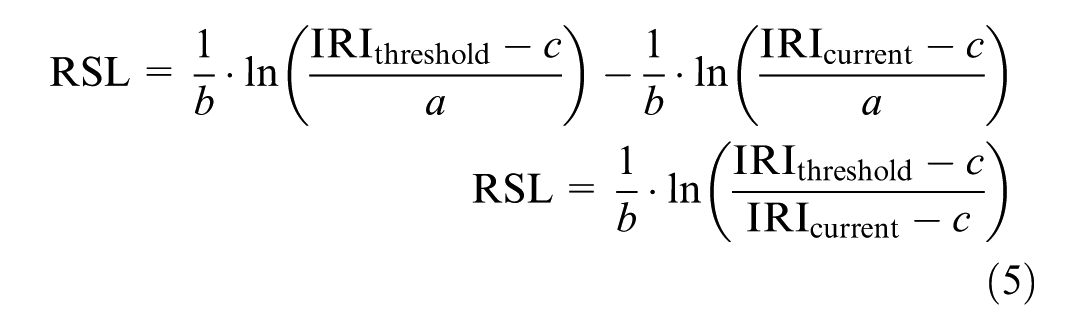
where RSL = RSL estimated from IRI.
It is important to note that the empirical model developed by Park et al. ( 28 ) was selected as a deterministic approach, because this model requires only pavement age as input, allowing practical prediction of RSL. Furthermore, the same data used for the probabilistic approach were used to develop this model, and it was found that the model can represent the typical IRI trend of Indiana pavements. Even though this model was developed and calibrated using Indiana’s historical data, it can be easily recalibrated for other local conditions, because it is a practical model with a single input.
Verification of Developed Models
Verification of Probabilistic Approach: Markov Chain
TPMs
Time-series IRI data were analyzed to construct TPMs for each of the three identified subnetworks. Each pavement section was evaluated to determine its condition state based on annual IRI values. Sections exhibiting changes of more than one condition state were removed, ensuring that the dataset focused on segments with relatively stable condition trajectories. After identifying eligible sections, transitions between condition states were quantified by aggregating the lengths of segments that deteriorated from a higher to a lower state (e.g., “very good” to “good”). TPMs were developed from observed 2-year transitions using the count-proportion method (Equation 2) and refined based on standard Markov chain principles. Only one-level deterioration transitions were considered; improvements without maintenance were set to zero; each row was normalized to sum to one, and the final state was defined as absorbing (P nn = 1). This element was assigned a value of 1 to signify an absorbing state, indicating that once a pavement section reaches the worst condition, it cannot deteriorate further ( 13 , 23 , 24 , 37 ). The proportion of these lengths relative to the total network length was designated Pij. Subtracting Pij from 1 yielded Pii, the proportion of sections remaining in the same condition state.
The development of 5 × 5 TPMs for interstates, U.S. highways, and state roads, as detailed in Table 3, provides a framework for analyzing road condition transitions over a 2-year duty cycle. These matrices quantify the probabilities of shifting between five condition states: “very good,”“good,”“fair,”“poor,” and “very poor.” For interstates, the TPM illustrates a 65% probability for roads in the “very good” condition to remain unchanged. Conversely, there exists a 35% chance for these roads to transition to the “good” condition, indicating the potential for slight deterioration. The matrix further reveals that roads in the “good” condition have a 98% likelihood of maintaining their status, with only a marginal 2% probability of declining to “fair.” Fair-condition roads exhibit a 70% probability of remaining stable while facing a 30% risk of worsening to “poor.”
Transition Probability Matrix across Five Condition States
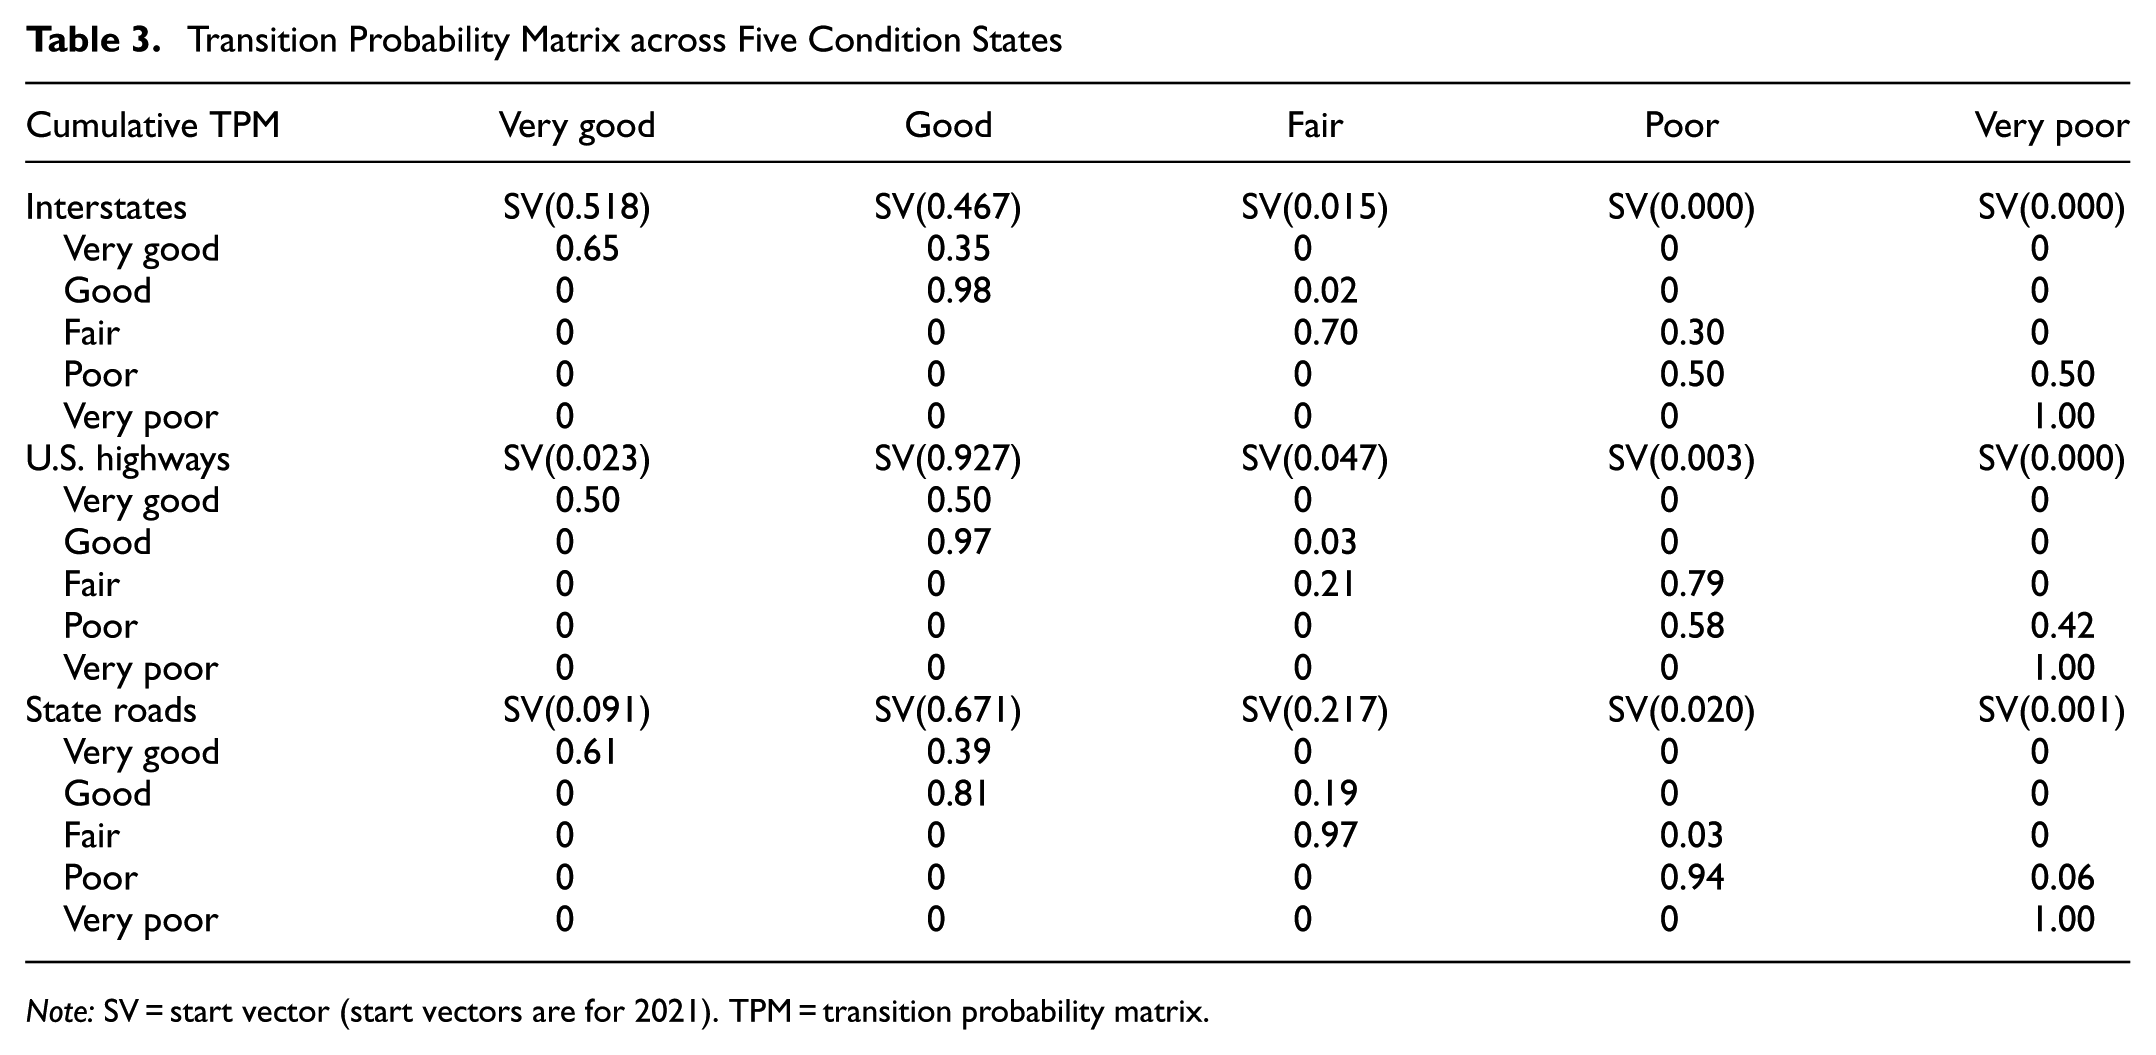
Note: SV = start vector (start vectors are for 2021). TPM = transition probability matrix.
For U.S. highways, the analysis reveals that roads in “good” condition are generally stable, with a 97% probability of maintaining their status and a small 3% chance of deteriorating to “fair.” However, “fair” condition roads are notably vulnerable, with a 79% probability of deteriorating to “poor.” This reflects a faster degradation rate for deteriorated pavement once pavements have declined to “fair” or “poor” conditions. Poor roads face a substantial likelihood (58%) of maintaining their condition, while 42% might degrade further to “very poor.” The state roads TPM presents a 61% probability of “very good” roads retaining their condition, with a 39% chance of downgrading to “good.” Good condition roads on state roads have an 81% probability of remaining so, while 19% might slip to “fair.” This represents a significantly higher transition probability, compared with interstates and U.S. highways, which exhibit only 2% and 3% transition rates to “fair,” respectively.
Markov Chain-Based Modeling of Functional Performance Deterioration
In the Markov chain models for the three subnetworks, the pavement deterioration process is modeled through iterative multiplication of the initial state vector with TPM. This iterative process is structured as follows.
The state vector for each subsequent stage is derived by multiplying the preceding stage’s state vector by the TPM. For instance, the state vector at Stage 1 is obtained from the initial state vector (Stage 0) multiplied by the TPM.
The state distribution for the deterioration process at any given time t is represented as X(t) = X(0) × TPM T , where X(0) is the initial condition distribution, and TPM T is the TPM elevated to the power of T, indicating the years elapsed.
The Markov chain analysis, as presented in Figure 3, systematically projects the evolution of pavement conditions across interstates, U.S. highways, and state roads over a 30-year period, accounting for a total of 15 stages based on a 2-year duty cycle. This projection is rooted in the initial condition vectors of 2021 and employs the TPMs presented in Table 3 to offer a forward-looking perspective on infrastructure degradation. For interstates, as shown in Figure 3a, the analysis anticipates a gradual decline in the proportion of pavements in “very good” condition, with a corresponding increase in “good,”“fair,”“poor,” and “very poor” conditions over time. By 2051, a notable reallocation of pavement conditions is expected. While the initial quality of U.S. highways might mitigate the onset of significant deterioration, the eventual progression into “fair,”“poor,” and “very poor” conditions becomes unavoidable in the absence of proactive management strategies (see Figure 3b).
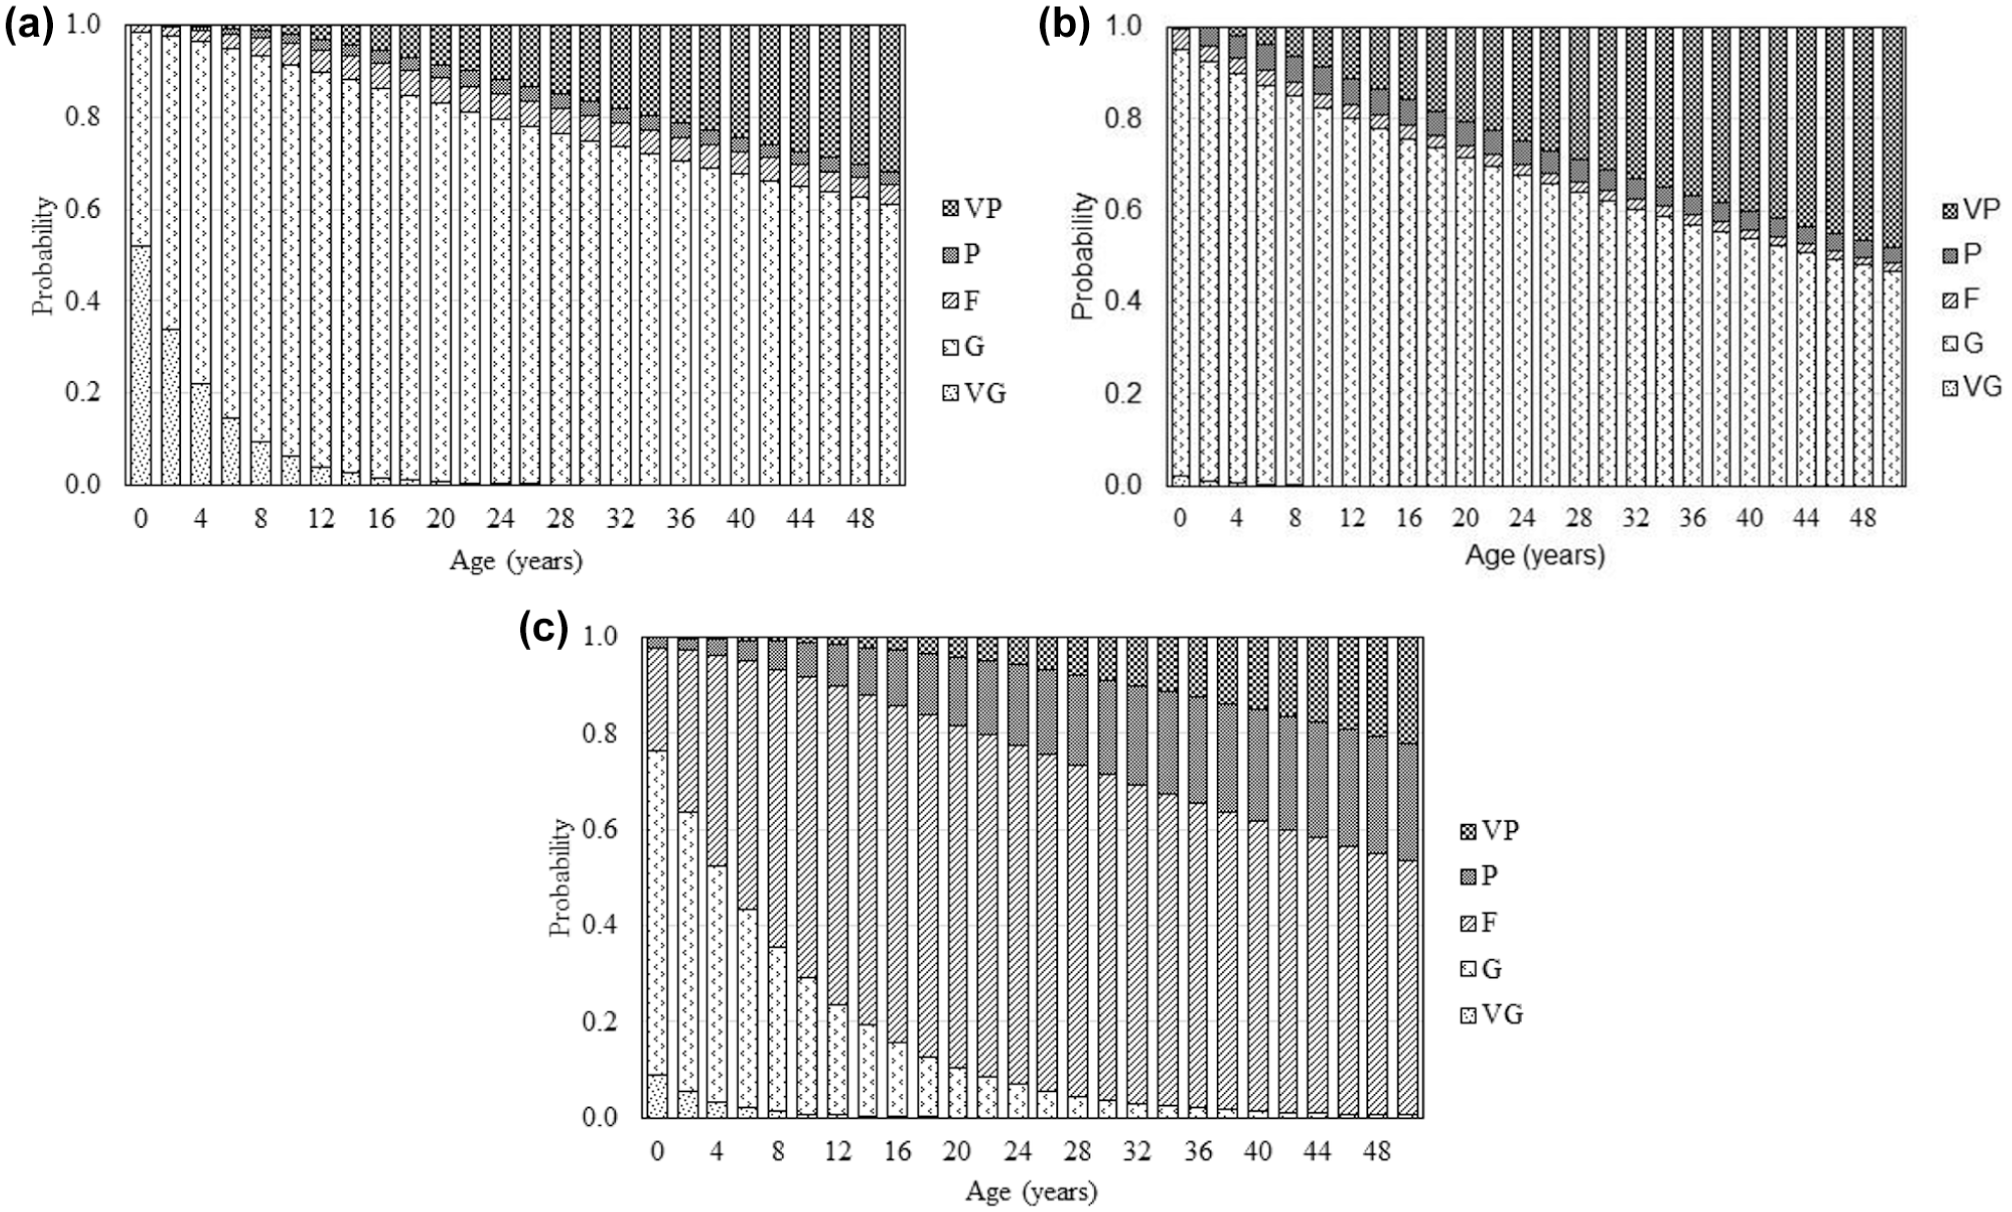
Markov chain model results across five condition states: (a) interstates; (b) U.S. highways; (c) state roads.
In contrast, as illustrated in Figure 3c, state roads exhibit a more pronounced and accelerated transition from higher to lower condition states, compared with interstates and U.S. highways. This pattern is characterized by a rapid decline in “very good” and “good” condition states, accompanied by a corresponding increase in “fair” and “poor” states. These trends emphasize the critical need for implementing a long-term maintenance strategy. Early interventions are critical in mitigating the accelerated degradation and ensuring sustainable pavement performance over time. These plots represent the probability distributions of condition states within each subnetwork as they evolve over time.
Comparison of Prediction and Measured IRI States
The predictive performance of the conventional Markov chain model was assessed by forecasting the 2016 pavement condition distribution from 2014 data. For each functional class, including interstates, U.S. highways, and state roads, a start vector was constructed from the 2014 IRI-based condition proportions. These vectors were then multiplied by TPMs (obtained by normalizing length-weighted transition counts across the five states) to produce predicted state probabilities for 2016. The forecast distributions were compared with the actual 2016 observations. Absolute differences between predicted and observed state proportions across all three subnetworks ranged from 0.0002 to 0.1116, indicating that the Markov chain model can provide fairly accurate insights, concerning the changes of IRI states. It should be noted that interstates exhibited the largest deviations; this can be attributed to limited data availability, sample size variability, and other uncertainty sources. Meanwhile, the observed and predicted 2016 distributions for each subnetwork are detailed in Table 4. These results indicate that the Markov chain model, as a probabilistic approach, may be used to predict short-term changes in IRI states and prioritize field sections based on maintenance needs.
Accuracy Assessment of Markov Chain Predictions across Functional Classes
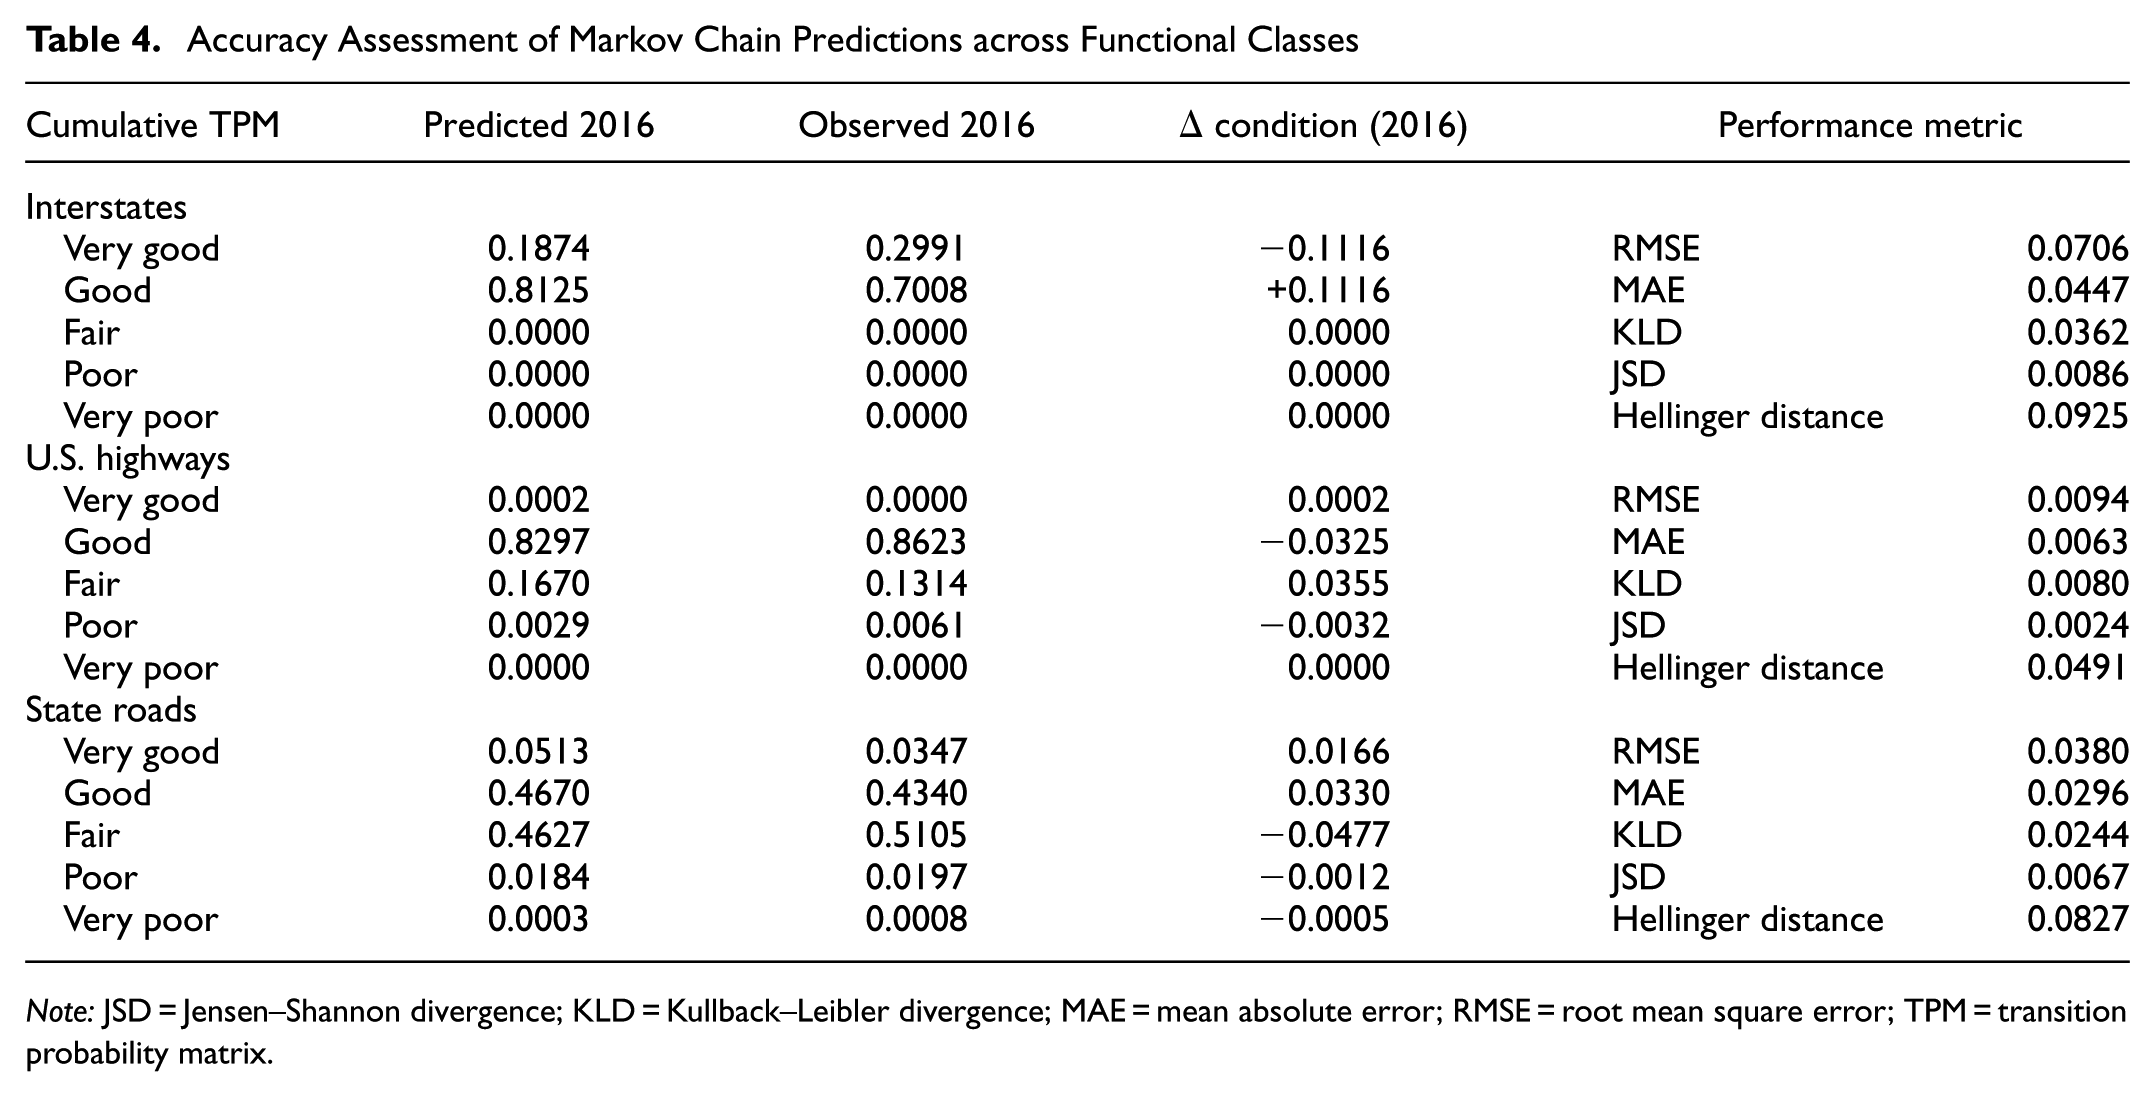
Note: JSD = Jensen–Shannon divergence; KLD = Kullback–Leibler divergence; MAE = mean absolute error; RMSE = root mean square error; TPM = transition probability matrix.
Verification of Deterministic Approach
The deterministic approach was verified using IRI data collected in 2014 and 2016, to be consistent with the verification of the probabilistic approach. The 2014 data were employed to predict the IRI values in 2016 using Equation 3. First, the pavement age in 2014 was calculated for each IRI data point using Equation 4 and the 2014 IRI values. The expected pavement age in 2016 was then determined by adding 2 years to the calculated pavement age in 2014. This determined pavement age in 2016 was subsequently plugged into Equation 3 to predict the 2016 IRI values. It is important to note that the process used to predict 2016 IRI values from the 2014 data can also be applied to predict future IRI values in practice.
Figure 4 shows a comparison of the measured and predicted 2016 IRI data, along with statistical parameters to assess the accuracy of IRI prediction, including the coefficient of determination (R2), the root mean square error (RMSE), and the mean absolute error (MAE). As shown in Figure 4, the deterministic approach provided fairly accurate IRI predictions, as indicated by high R2 and low RMSE and MAE, for all road classifications. Overall, R2 ranged from 0.84 to 0.86, with the greatest RMSE and MAE being 0.3 and 0.18, respectively.
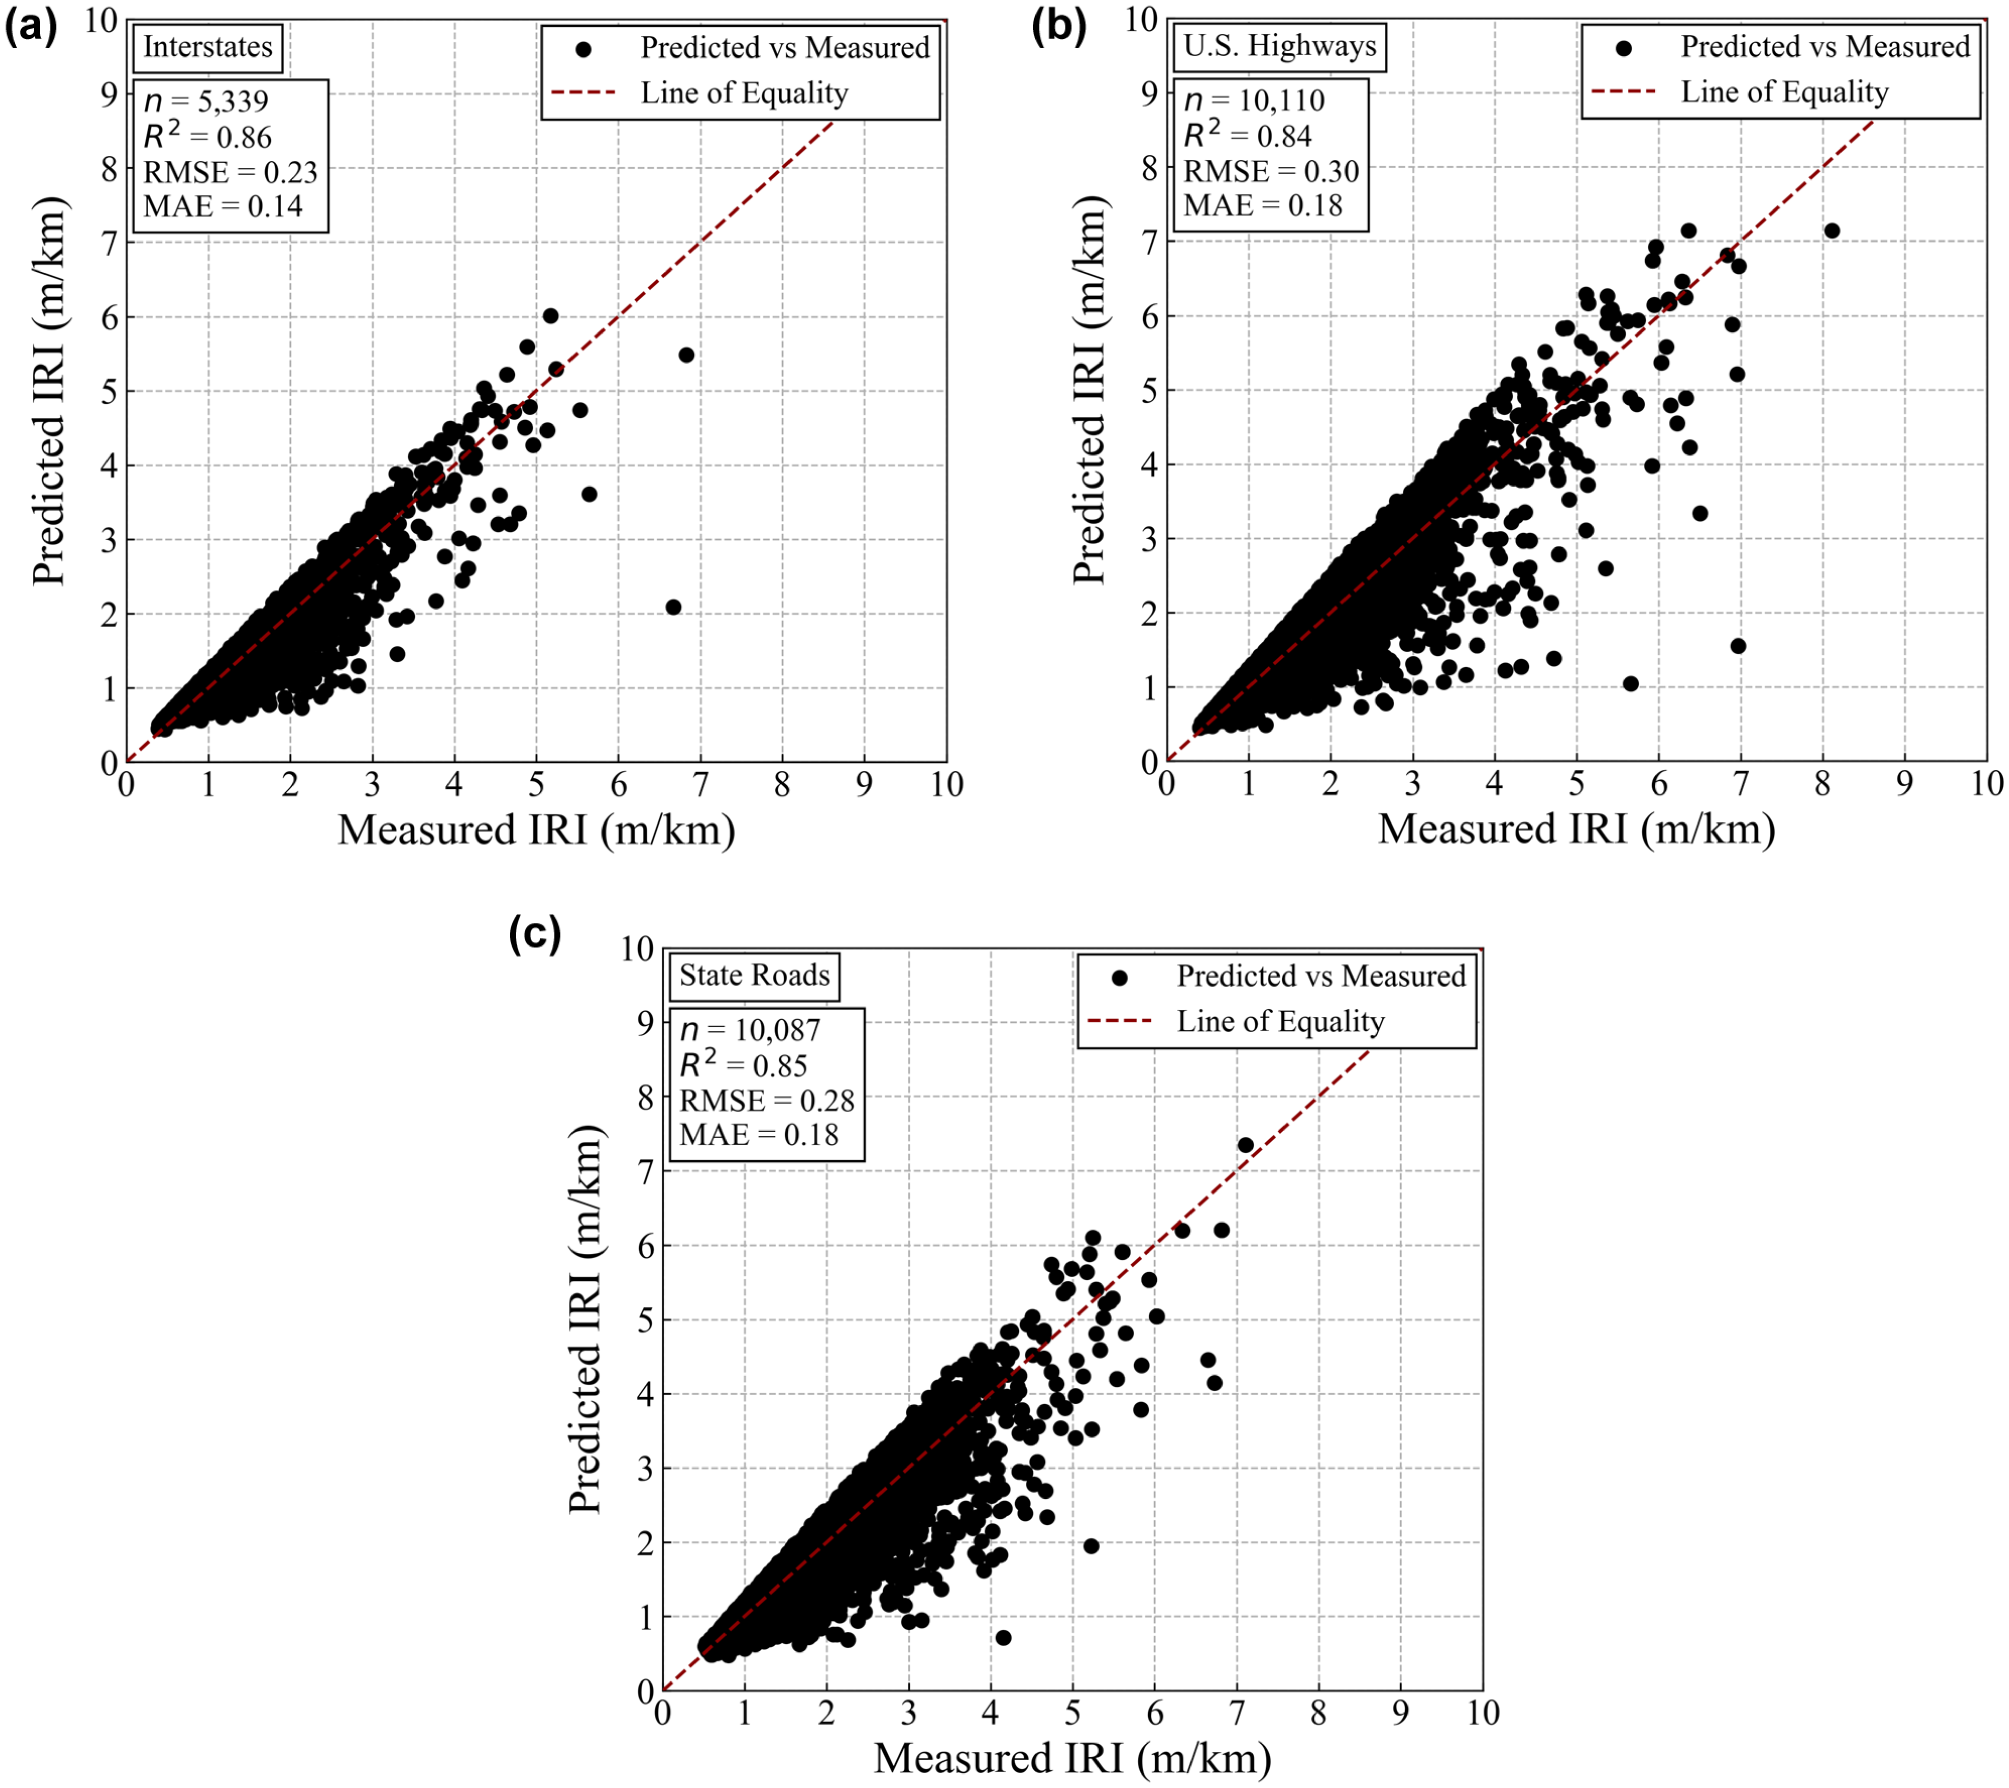
Comparison between measured and predicted international roughness index using the deterministic model for 2016 data: (a) interstates; (b) U.S. highways; (c) state roads.
Probabilistic-Deterministic Approach to Evaluate Pavement Functional Conditions
Figure 5 illustrates a probabilistic-deterministic approach to evaluate the functional condition of in-service pavements based on IRI data, integrating both probabilistic and deterministic approaches presented in this study. It should be noted that the proposed approach recommends either “preventive treatments” or “no action required” because only the functional condition is considered. As shown in Figure 5, depending on the availability of historical IRI data, the proposed approach includes two methods to determine the maintenance strategy. First, when sufficient historical data are available, the deterministic approach is primarily applied, and further calibration is recommended to adjust the coefficients of Equation 3 for better IRI prediction under local field conditions. Then the RSL is calculated using Equation 5 with adjusted coefficients, and can be used to determine whether the target pavement requires preventive maintenance. Consequently, “preventive treatments” are recommended when the estimated RSL is less than 70% of the design life. Otherwise, pavements with an RSL greater than 70% of the design life do not require any maintenance activities. It is important to note that, in this study, 70% of the design life was employed as the RSL threshold, but this value can be adjusted depending on local conditions and requirements.
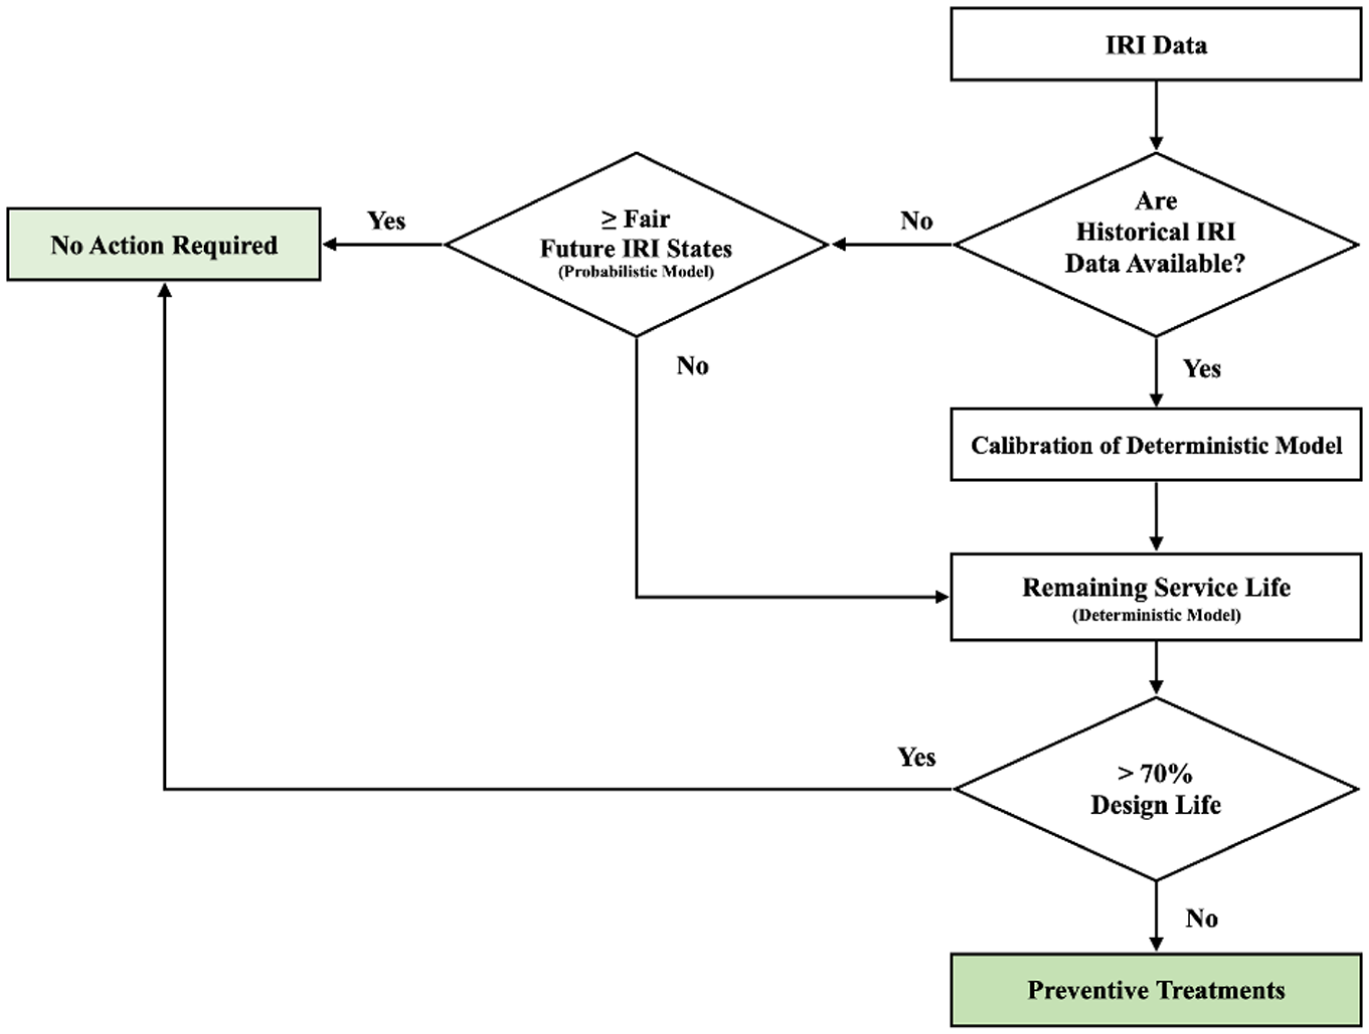
Probabilistic-deterministic approach to evaluate pavement functional conditions.
However, when limited IRI data are available, a probabilistic approach (Markov chain) is initially applied to assess overall future IRI states. If the projected IRI state is better than or equal to fair condition, “no action required” is recommended. Otherwise, it is recommended that the RSL be calculated using Equation 5. Then, the need for preventive maintenance is determined by comparing the RSL to 70% of the design life, following the same concept used in the previous case. It should be noted that Equation 5 is employed without local calibration to calculate RSL, owing to limited local historical data.
Even though the effect of maintenance was not considered during the development of the proposed framework, it may still be used for pavement sections after maintenance. When maintenance activities are performed, the pavement section can be treated as one with limited historical IRI data, and only the current IRI measurement may be used for further analysis following the framework.
Summary and Conclusions
In this study, a probabilistic-deterministic approach is proposed to enhance the functional condition evaluation of in-service asphalt pavements based on IRI measurements. A summary of findings is presented as follows.
A probabilistic approach based on a Markov chain model was developed to predict short-term future IRI condition states at the network level. The model effectively represents pavement deterioration through probability distributions, especially when historical data are limited.
The Markov chain results indicate a gradual decrease in pavements in “very good” condition and a corresponding increase in lower condition states across all functional classes. The results also show that deterioration accelerates once pavements reach “fair” or “poor” conditions.
The probabilistic model was validated using field data and showed good agreement for short-term prediction of IRI condition states across all road classifications.
A deterministic model was used to predict long-term IRI values and estimate RSL. The model was also validated with field data and showed good prediction accuracy.
The integration of probabilistic and deterministic approaches provides a practical framework for evaluating pavement conditions and supporting maintenance decision-making.
Based on these findings, it is concluded that the proposed approach can balance the strengths of the probabilistic and deterministic models and allows accurate evaluation of pavement functional conditions, regardless of the availability of historical data. When the available historical data are limited, the probabilistic approach (Markov chain model) is primarily employed, along with the presented deterministic IRI prediction models without calibration, to determine the need for maintenance. Otherwise, when sufficient historical data are available, the deterministic approach is recommended, involving local calibration of the IRI prediction models to assess maintenance needs. Overall, the proposed probabilistic-deterministic approach has the potential to significantly improve current PMS practices by providing a more robust and flexible methodology for evaluating pavement functional conditions and determining timely maintenance strategies.
Recommendation and Future Research
Even though, in this study, an enhanced approach is proposed to evaluate pavement functional conditions, the following future studies are recommended to further improve the approach.
Since, in this study, a Markov chain model was successfully developed to predict overall future IRI states, the approach can be extended to structural indicators, such as cracking and rutting.
It is recommended to integrate the proposed probabilistic-deterministic approach with structural parameters and economic factors for final implementation in a PMS.
It is recommended to demonstrate the application of the proposed approach using additional field data that were not included in the model development.
It is recommended to further verify the Markov chain using a 1-year duty cycle to assess the overall accuracy, although in this study, a 2-year duty cycle was employed to capture meaningful IRI transitions. Furthermore, since, in this study, the effect of maintenance activities was not considered, it is recommended to analyze and incorporate these effects in the proposed approach.
A future study is also recommended to investigate how the proposed approach can improve current PMS practice, concerning both pavement performance and economic efficiency. Specifically, additional field data can be collected to validate the effectiveness of the proposed approach by comparing the actual maintenance activities selected by the current PMS practice with those recommended by the proposed approach.
Footnotes
Author Contributions
The authors confirm contribution to the paper as follows: research idea conception, development, and design: Seonghwan Cho, John E. Haddock; data collection: Maya Khajehvand, Bongsuk Park; analysis and interpretation of results: Maya Khajehvand, Bongsuk Park, Seonghwan Cho, John E. Haddock, Pablo Orosa Iglesias; literature review and research plan: Tommy E. Nantung, Abdullah Al Mamun; draft manuscript preparation and reviews: all authors. All authors reviewed the results and approved the final version of the manuscript.
Declaration of Conflicting Interests
The authors declared no potential conflicts of interest with respect to the research, authorship, and/or publication of this article.
Funding
The authors disclosed receipt of the following financial support for the research, authorship, and/or publication of this article: This work was supported in part by the Joint Transportation Research Program administered by the Indiana Department of Transportation and Purdue University (SPR-3902).
ORCID iDs

The contents of this paper reflect the views of the authors, who are responsible for the facts and the accuracy of the data presented. The contents do not necessarily reflect the official views and policies of the Indiana Department of Transportation or the Federal Highway Administration.