






Abstract
This study presents a patented collet–chuck-based clamping system for uniaxial cyclic fatigue testing of asphalt mixtures using small specimen geometry. Conventional specimen preparation is time- and resource-intensive, requiring precise cutting and the use of epoxy adhesives to mount specimens onto loading platens. These steps are critical for test success and typically require highly trained personnel, and they introduce delays because of epoxy curing. The proposed mechanical clamping system eliminates the need for cutting and epoxy adhesives, which allows rapid, repeatable specimen mounting, streamlining the workflow and reducing testing time. The system is compatible with a standard asphalt mixture performance tester and can be fabricated using commercially available, off-the-shelf components. To evaluate its applicability, eight asphalt mixtures from three different states were tested using the conventional glued-end-plate method and the collet–chuck clamping system. The mixtures covered a wide range of material characteristics, including different nominal maximum aggregate sizes (NMAS), binder types (unmodified, polymer-modified, and highly polymer-modified), binder contents, and reclaimed asphalt pavement percentages. The results showed strong agreement between both methods, with similar damage characteristic curves and comparable normalized variance index v norm values. The collet–chuck system produced improved v norm values in five of the eight mixtures. In addition, no statistically significant differences were observed in the failure criteria based on pseudo stiffness versus time curve, and apparent damage index parameter between the two systems, confirming that the proposed clamping approach is a viable alternative for uniaxial cyclic fatigue testing without compromising test integrity or results validity.
Keywords
Introduction
In an online survey conducted as part of the Balanced Mix Design (BMD) framework under the NCHRP 20-07 project, fatigue cracking was identified by 40 state Departments of Transportation (DOTs), the highest number among all distress types, as the pavement distress most in need of performance-based testing. However, in the same survey, 36 out of the participating DOTs had concerns with the validity of current performance tests for BMD implementation ( 1 ). Currently, there is a myriad of laboratory fatigue cracking tests that differ in sample preparation, required equipment, and complexity. However, to select one test over another, multiple factors should be considered as follows ( 2 ).
Test variability: knowing that monotonic tests are usually less variable compared with cyclic tests.
Results interpretation: whether the test gives an index or a material property.
Field performance correlation: index-type tests are suitable for ranking mixtures and for QC/QA, while the mechanistic tests are better for performance analysis.
Test simplicity: the training required by technicians to perform the test, sample preparation, and data analysis difficulty are factors to consider when selecting a testing method.
Sensitivity to mix design parameters: the testing method should be able to differentiate between different volumetric properties and material properties.
Equipment availability and cost.
The uniaxial cyclic fatigue test is a rigorous test method that employs the simplified viscoelastic continuum damage model (S-VECD) to characterize the fatigue resistance of asphalt mixtures and model the damage evolution in asphalt materials mechanistically. The outputs of the S-VECD model are fundamental material properties, and the time–temperature superposition principle could be applied to the model’s output, which enables many applications such as pavement and mix design using the same test method. This leads to a direct link between pavement and mix design that could be used to optimize pavement designs based on actual fatigue resistance obtained from lab tests, which could also boost innovation in materials and enable a better understanding of the newly developed materials. When discussing the cyclic fatigue test for the previously illustrated factors, it is a strong candidate for fatigue cracking characterization because many studies demonstrated the test’s capability of differentiating between mixtures based on the mixtures’ material properties, and the test showed a strong agreement with field performance ( 3 – 6 ). However, the test is not as simple as other test methods. This encouraged many researchers to develop more efficient workflows and procedures to streamline the test. Among these were the studies that led to the development of small specimen geometry used in the American Association of State Highway and Transportation Officials (AASHTO) TP 132 ( 7 – 12 ). Other studies aimed to simplify the test protocol by retesting the specimens subjected to the dynamic modulus test ( 13 , 14 ).
However, the uniaxial cyclic fatigue test is overlooked by DOTs when considering BMD implementation because of the test’s complexity for sample preparation and testing procedure. This is illustrated in the map by the National Asphalt Pavement Association, shown in Figure 1, where simpler test methods, which require less effort in testing and specimen preparation, are considered for BMD implementation, such as the Illinois flexibility index (I-FIT), indirect tensile asphalt cracking test (IDEAL-CT), and overlay tests. The cyclic fatigue test is regarded as one of the most time and resource-intensive tests ( 15 ). Therefore, streamlining the uniaxial cyclic fatigue test is necessary to make it more appealing to DOTs and contractors.
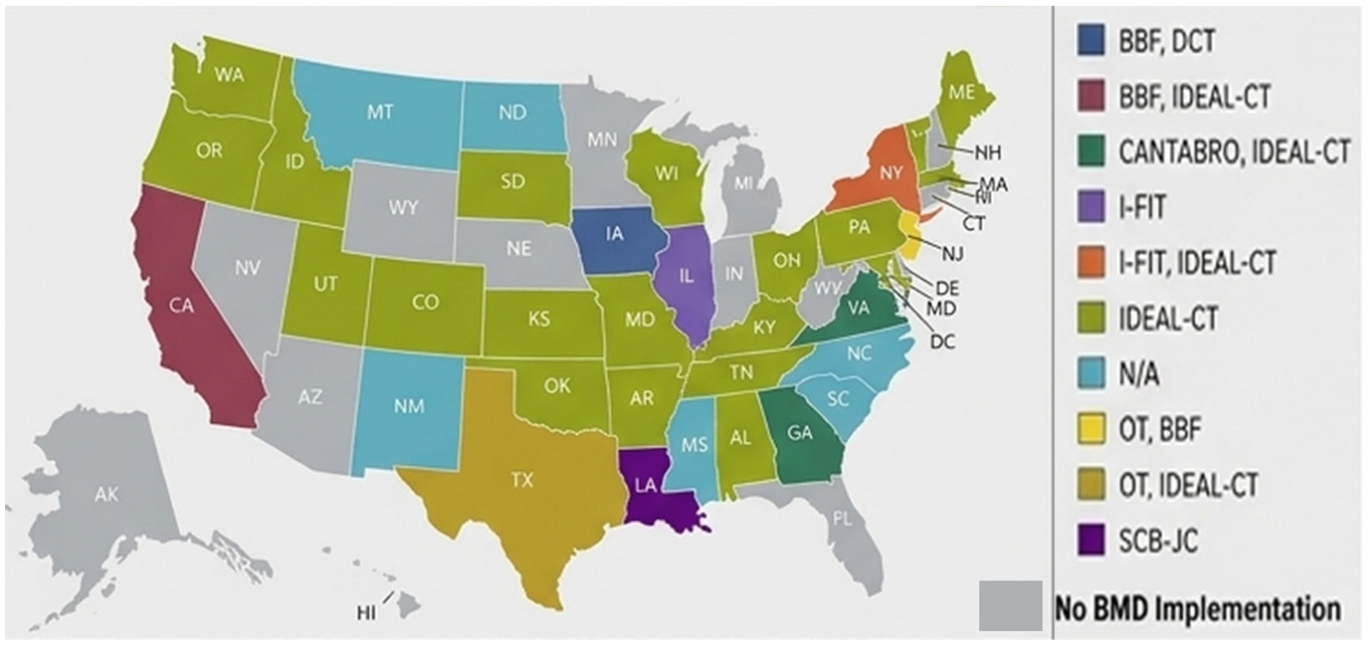
Balanced Mix Design’s fatigue cracking tests considered by each state ( 16 ).
Some key challenges associated with the cyclic fatigue test include precisely cutting specimens to tight tolerances in accordance with AASHTO TP 132 (23), as well as the requirement to bond the specimens to loading platens using epoxy adhesive, a process that is time- and resource-intensive because of the high cost of the epoxy and the significant curing time required. In addition, if any steps are not conducted properly, there is a substantial risk of an “end failure,” which renders the test results invalid and necessitates discarding them.
Objective
The overall objective of this study is to develop a simplified and accelerated procedure for mounting and testing asphalt mixture samples in uniaxial fatigue in an asphalt mixture performance tester (AMPT) device to reduce the testing time without compromising the test results’ integrity. This development aims for the wide implementation of AMPT testing and fundamentally based analysis methods across the state highway agencies and industrial stakeholders.
Background
S-VECD Model
The S-VECD model is a mechanistic model that describes asphalt materials’ integrity loss under cyclic loading using the damage characteristic curve (C–S curve), where the material integrity is C, and is called secant pseudo stiffness, and an internal state variable S represents the damage to the material. The C–S curve is a fundamental material property independent of the mode of loading and testing temperature ( 17 ). This relationship is expressed using the power function shown in Equation 1. Therefore, this model could be used to predict the material’s behavior for any given loading condition under different climate conditions.

where
C = secant pseudo stiffness,
S = internal state variable, and
C 11 and C12 = two fitting coefficients of the power law.
The time–temperature superposition principle, along with the linear viscoelastic properties of asphalt mixtures, is incorporated into the S-VECD model. These properties are obtained using the dynamic modulus test to characterize the material’s fatigue behavior using the S-VECD model. In this study, FlexMAT was used to characterize the linear viscoelastic behavior of the asphalt mixtures ( 18 ).
However, the C–S curve is not the only output of the S-VECD model. Another main output would be the failure criterion representing the material toughness D R because it relates the reduction in the material integrity to the number of cycles to failure ( 19 ). It is calculated by dividing the cumulative reduction in pseudo stiffness (1 – C) by the number of cycles to failure N f for each specimen, then averaging the D R values of all specimens (Equation 2). For similar asphalt mixtures, higher D R indicates a better resistance to fatigue cracking.

where
n = number of tested specimens,
Sum(1 – C) j = cumulative reduction in stiffness for the jth specimen, and
N f = number of cycles to failure for the jth specimen.
The apparent damage index parameter S app , which accounts for the asphalt material’s toughness and modulus, and D R only accounts for the material’s toughness ( 20 ), as shown in Equation 3. More details on the S app index can be found in the literature ( 20 ). The S app index also includes a traffic component where a S app value is recommended based on the equivalent single axle loads ( 21 ).

where
S app = cyclic fatigue damage index parameter,
α = function of the slope of the relaxation modulus and time relationship on a logarithmic scale,
|E*| = dynamic modulus value in the linear viscoelastic domain at 10 Hz,
a T = time–temperature shift factor at the S app calculation temperature based on the climatic region of the studied project,
D R = failure criteria based on pseudo stiffness versus time curve, and
C 11 and C12 = two fitting parameters from the damage characteristic curve (C versus S).
Materials
Plant-mixed, laboratory-compacted samples are prepared from eight mixtures, which were prepared and tested in this study. Loose mixtures were collected from Florida (FL), Michigan (MI), and Virginia (VA). These mixtures had different nominal maximum aggregate sizes (NMAS), binder Performance Grade (PG) grades, reclaimed asphalt pavement (RAP) contents, and different binder formulations, with some of the mixtures having unmodified binders (U), polymer-modified binder (P), and highly polymer-modified (HiMA) binders. These materials were collected for this study to ensure that the developed testing system and validation steps are applicable to a wide variety of mixtures. Mixtures are designated in the report as XX00YY11, where XX is the state abbreviation letters from which mixtures were collected, 00 is the NMAS (mm), YY is the binder type, where U is unmodified, P is polymer-modified, and HP is highly polymer-modified (HiMA), and 11 is the RAP percentage by weight of mixture. Therefore, FL12.5P25 means that the mix was collected in Florida with 12.5 NMAS, and the binder is polymer-modified with 25% RAP in the mixture. Table 1 gives the properties of mixtures analyzed in this study.
Summary of Asphalt Mixture Properties
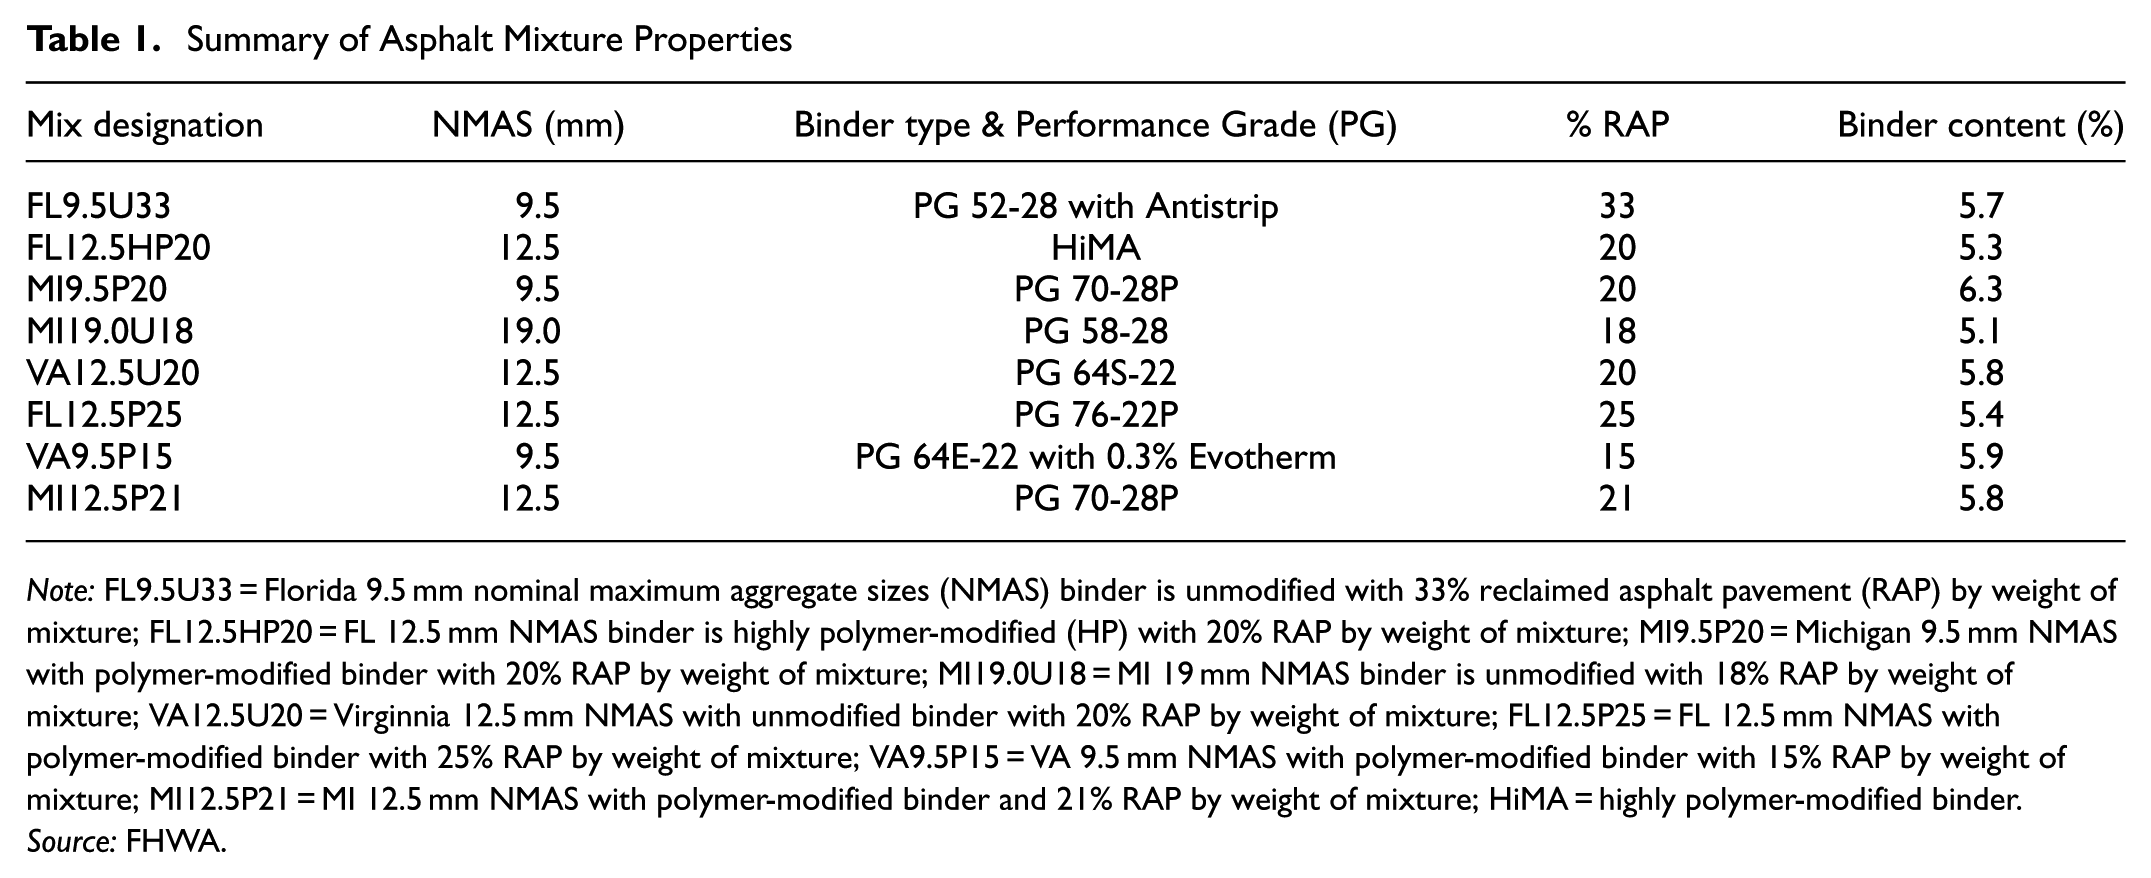
Note: FL9.5U33 = Florida 9.5 mm nominal maximum aggregate sizes (NMAS) binder is unmodified with 33% reclaimed asphalt pavement (RAP) by weight of mixture; FL12.5HP20 = FL 12.5 mm NMAS binder is highly polymer-modified (HP) with 20% RAP by weight of mixture; MI9.5P20 = Michigan 9.5 mm NMAS with polymer-modified binder with 20% RAP by weight of mixture; MI19.0U18 = MI 19 mm NMAS binder is unmodified with 18% RAP by weight of mixture; VA12.5U20 = Virginnia 12.5 mm NMAS with unmodified binder with 20% RAP by weight of mixture; FL12.5P25 = FL 12.5 mm NMAS with polymer-modified binder with 25% RAP by weight of mixture; VA9.5P15 = VA 9.5 mm NMAS with polymer-modified binder with 15% RAP by weight of mixture; MI12.5P21 = MI 12.5 mm NMAS with polymer-modified binder and 21% RAP by weight of mixture; HiMA = highly polymer-modified binder.
Source: FHWA.
Development of the Collet–Chuck Clamping System
The clamping system was designed to satisfy specific criteria to ensure that it could be a viable replacement for the conventional glued endplates. To achieve this, the clamping system had to be:
Market-ready (all parts of the system are readily available with minimal modifications).
Lightweight (system should have minimal weight).
Compact (the system should fit inside the AMPT with ease and effective fixation).
This section describes the new collet–chuck clamping system as well as the modifications and developments to the system to ensure that it can work with different materials and to ensure that it satisfies the aforementioned requirements.
Glued End Plates System
The traditional setup includes gluing endplates to cylindrical specimens after coring and cutting them from the Superpave gyratory compacted specimens (SGC). There are two geometries for the standard setup, large (100 mm diameter) and small (38 mm diameter) geometry specimens, as shown in Figure 2. The gauge length is 70 mm in the traditional and standard setup, and the distance between the boundary condition and the gauge point is 30 and 20 mm for the large specimen and the small one, respectively.
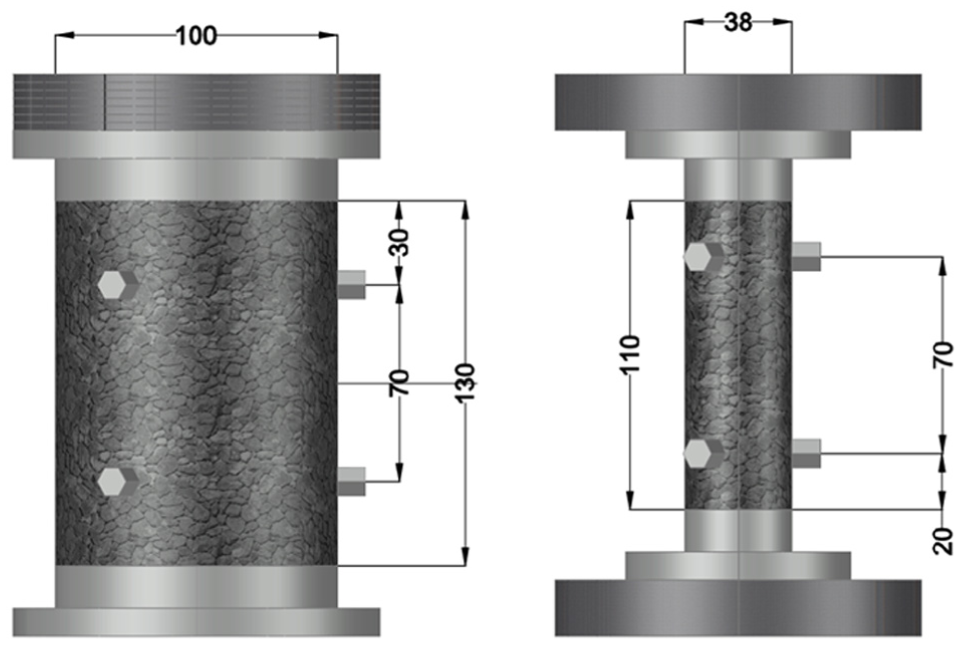
Standard large and small specimen geometries (mm).
Collet–Chuck System
The collet–chuck design was implemented to have a more market-ready design with a lightweight and compact design. Different collets and clamping systems were investigated to fulfill the previously discussed criteria. Therefore, the ER-50 collet shown in Figure 3 was selected as the best candidate. The ER collet provides a high clamping force distributed evenly along the contact area, which could alleviate the effect of stress concentration on the specimens because of its tapered design.
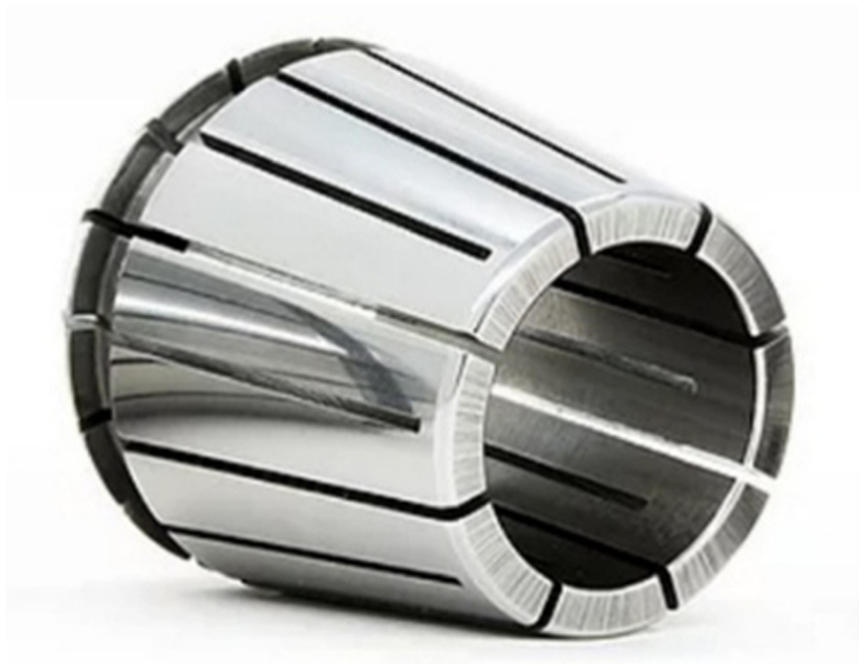
Selected ER-50 collet for uniaxial fatigue testing.
A chuck is used to hold the collet and to fix the setup in the AMPT. This chuck has a base diameter of 130 mm, the same diameter as the spacer platen in the AMPT. The chuck is used with a nut to hold the collet and to tighten it, as shown in Figure 4. However, the available chuck did not have screw slots matching the AMPT’s spacer platen screws. Therefore, the chuck was modified to bolt it inside the AMPT. Figure 5 shows the collet–chuck clamping system fitted inside the AMPT Pro.
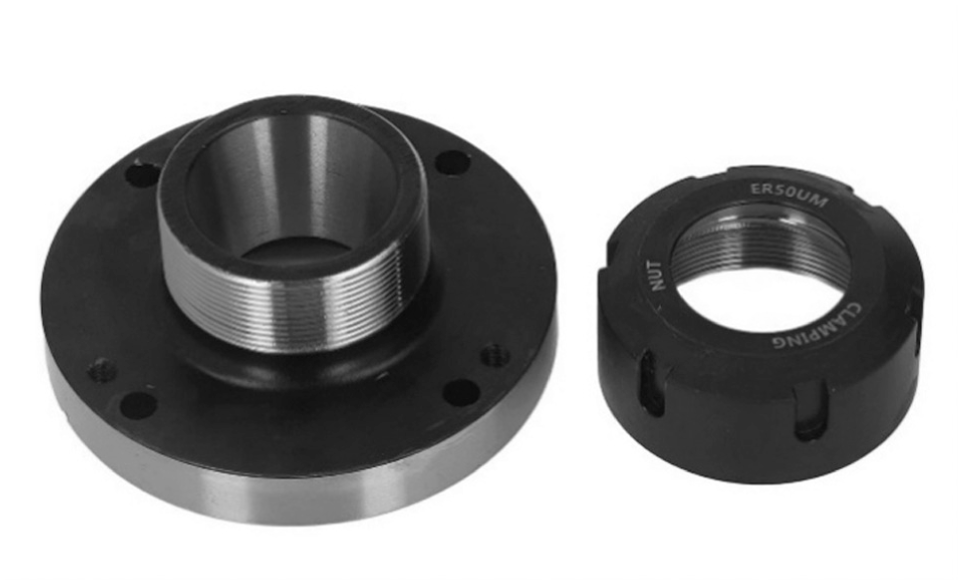
Collet–chuck and nut.
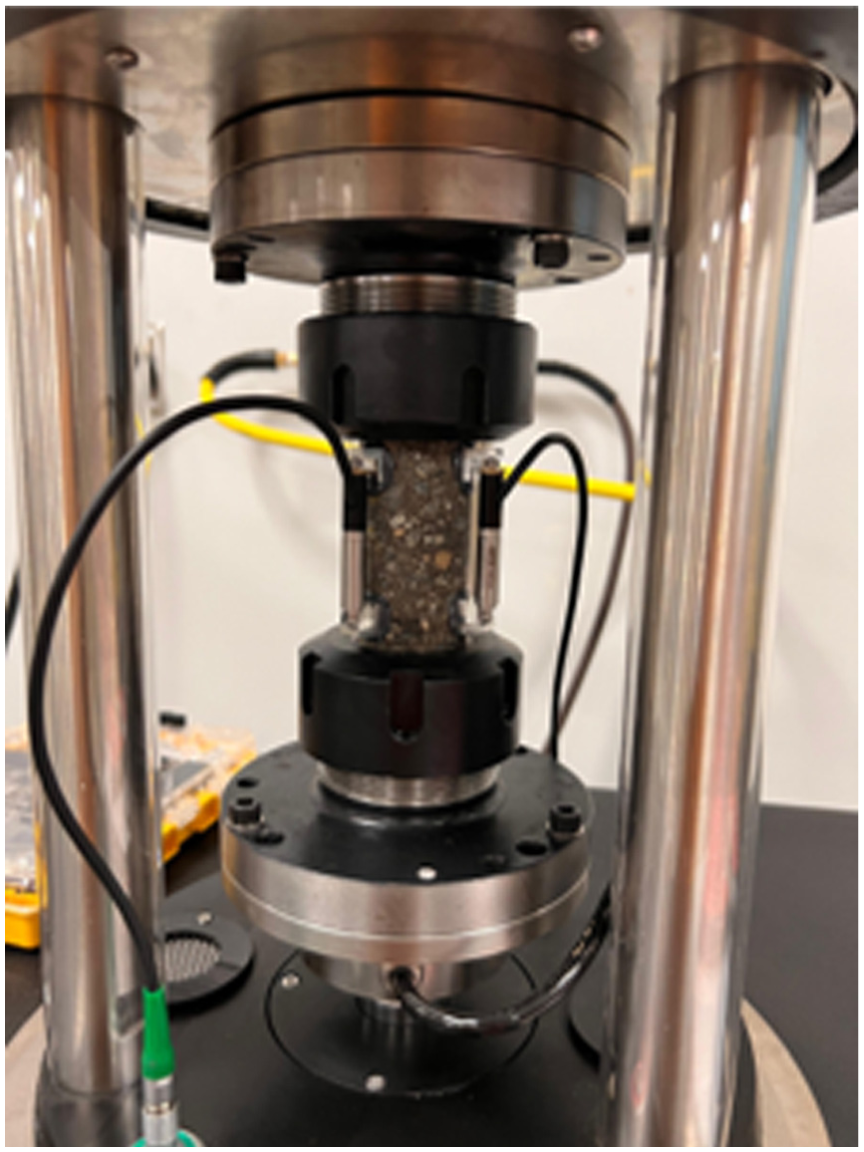
Collet–chuck clamping system fitted inside AMPT Pro.
Saint Venant’s Principle
Because the new design will have different boundary conditions compared with the glued endplates setup, it is crucial to gain insight into the effect of the boundary condition on the stress distribution. Therefore, understanding Saint Venant’s principle is vital to this study. Saint Venant’s principle states that: If the forces acting on a small portion of the surface of an elastic body are replaced by another statically equivalent system of forces acting on the same portion of the surface, this redistribution of loading produces substantial changes in the stresses locally but has a negligible effect on the stresses at distances which are large in comparison with the linear dimensions of the surface on which the forces are changed.
This principle addresses the influence of boundary conditions on the stress distribution across the specimen’s cross section at varying distances from the boundary and its relationship to the specimen diameter, as shown in Figure 6. This figure shows that the stress distribution becomes more uniform as the distance from the boundary increases. As a general guideline, when the region of interest is located at a distance approximately equal to the cross section width from the boundary, the stress distribution can be considered uniform. However, an accurate quantification of the stress distribution requires finite element (FE) analysis.
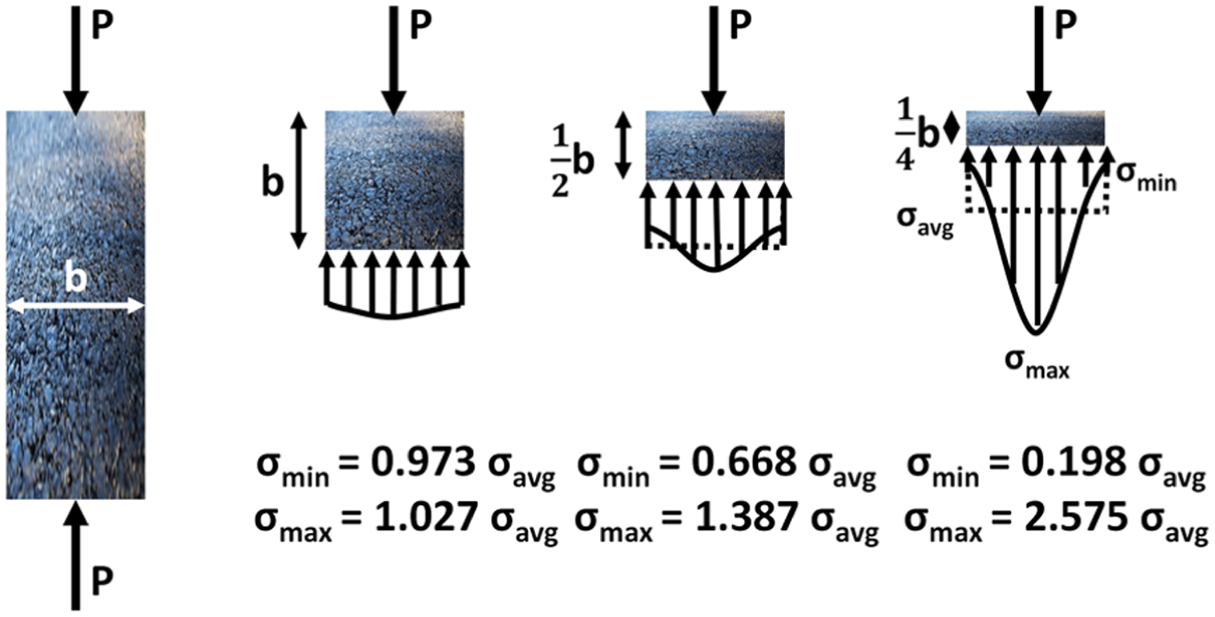
Boundary condition effect on stress distribution.P = load; b = diameter sigma is stress; sigma_min = minimum stress; sigma_max = maximum stress; sigma_avg = average stress.
Target Mounting for the Collet–Chuck Clamping System
Traditional Targets
If the traditional hexagonal targets are used, the setup with traditional targets will have a gauge length of 66 mm and a distance of 7 mm between the boundary condition and the gauge point, as shown in Figure 7. However, the proximity of these gauge points to the boundary condition influences the stress distribution, as discussed in the previous section. In addition, the Linear Variable Differential Transducers (LVDTs) in this configuration can only be mounted directly on the targets, without the use of brackets. Consequently, it became necessary to modify the target mounting procedure.
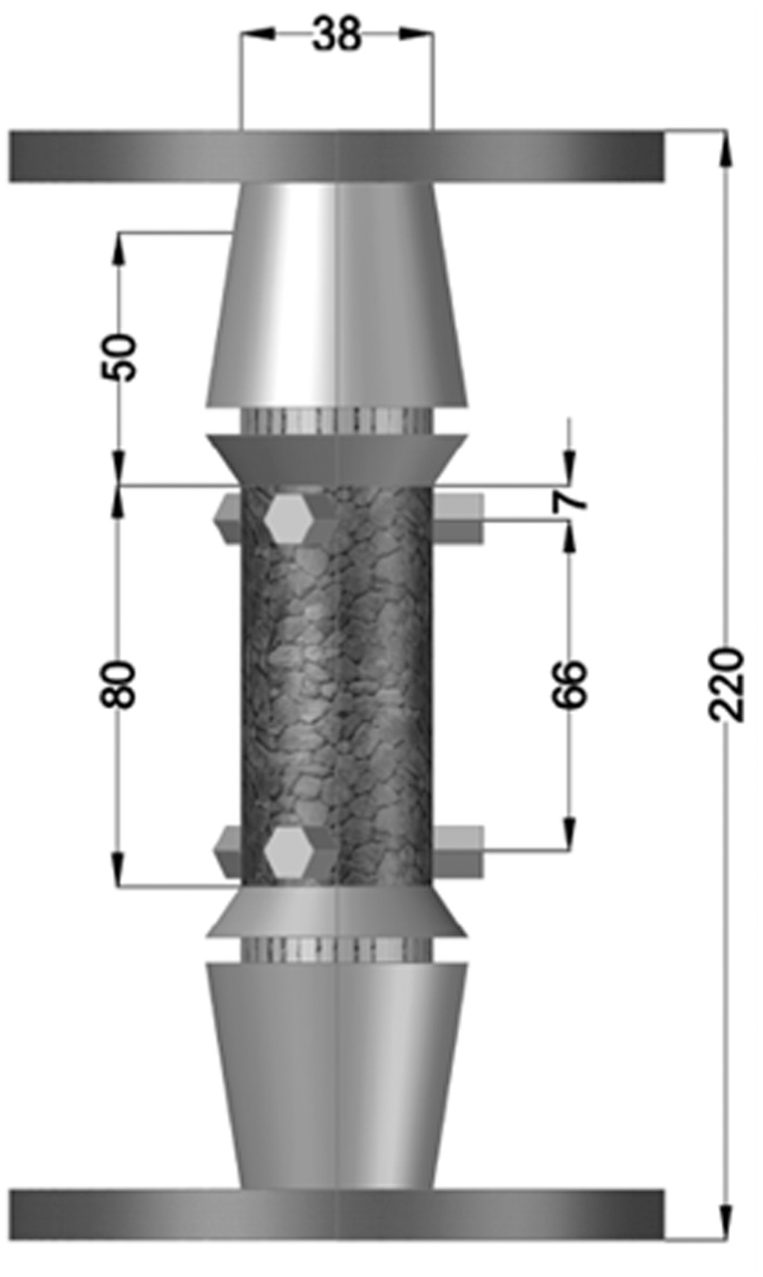
Setup with traditional targets (mm).
Target Modification
To accommodate the different target lengths, several prototypes were developed and manufactured. All prototypes were specifically designed for compatibility with the existing gauge point fixing jigs because many laboratories have these jigs and are familiar with their operation. To use these targets with the 180 mm specimen of the collet–chuck system, only the metal cylinder that the specimen rests on had to have a different height, as shown in Figure 8.
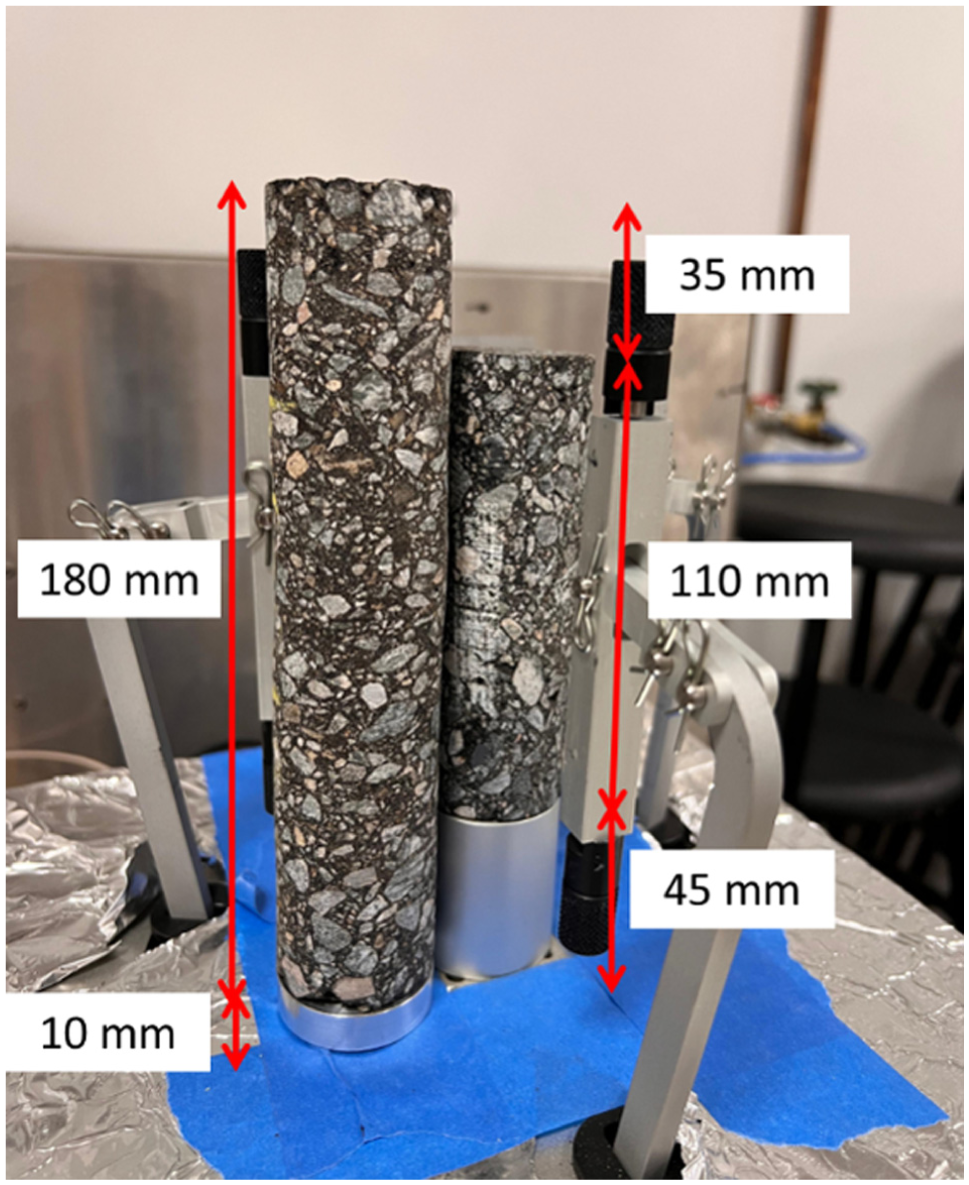
Using the 180 mm specimen with control’s gauge point fixing jig.
Fixing Jig Adapters
The LVDTs had a length of nearly 54–56 mm, as shown in Figure 9. The adapters, as shown in Figure 10, were used to fix targets onto the specimens with different gauge lengths without modifying the jig. These adapters were three-dimensionally (3D) printed with high-strength carbon to ensure that they are lightweight and compact. An L-shaped target with a curved surface matching the diameter of the cylindrical specimen. In addition, these targets have the same footprint on the specimen as the traditional hexagonal targets.
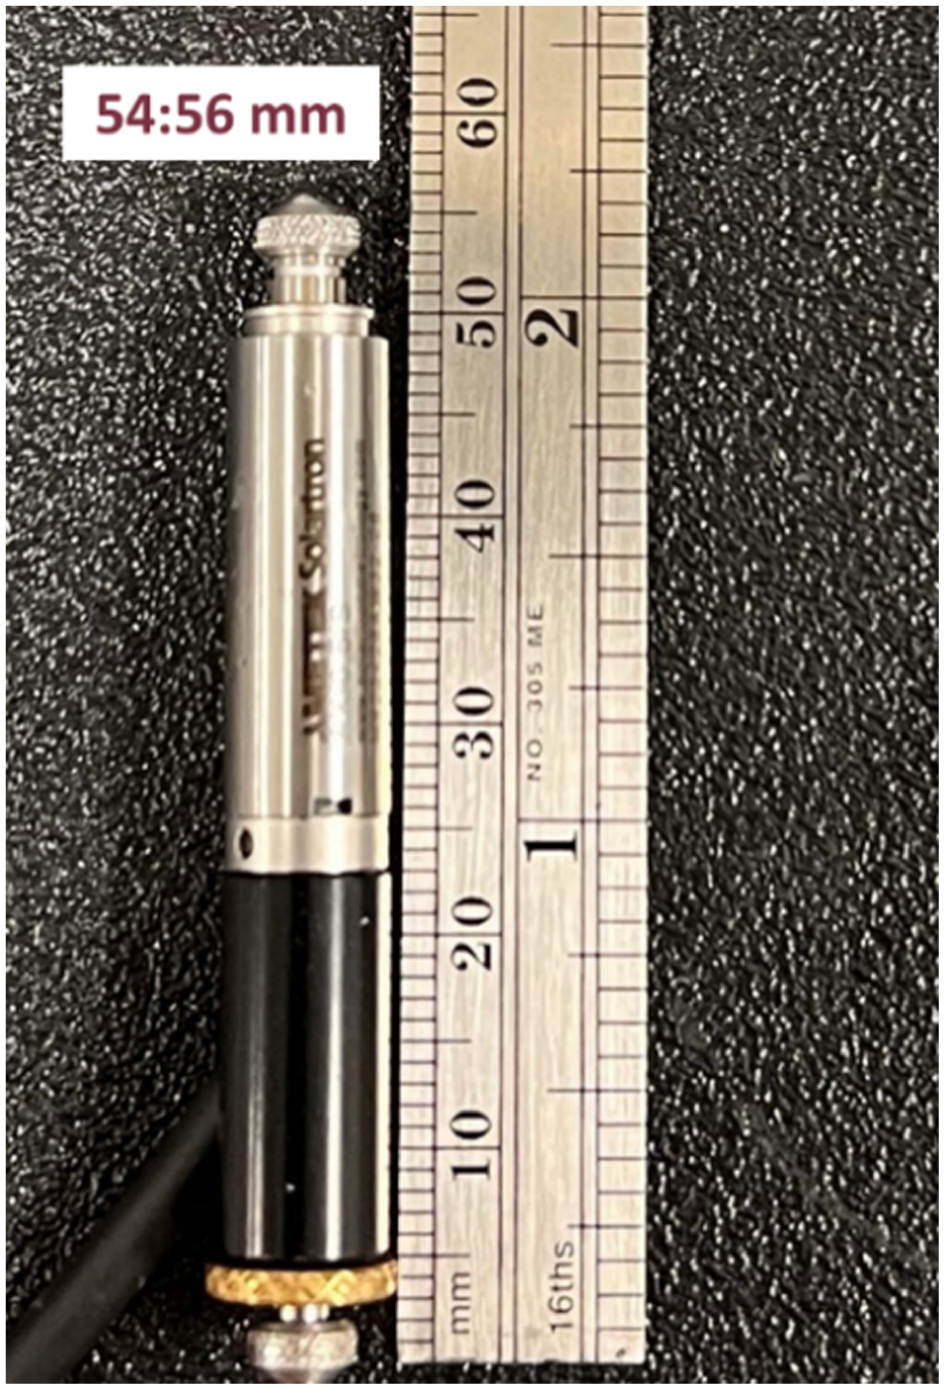
Spring-loaded LVDT length.LVDT = Linear Variable Differential Transducer.
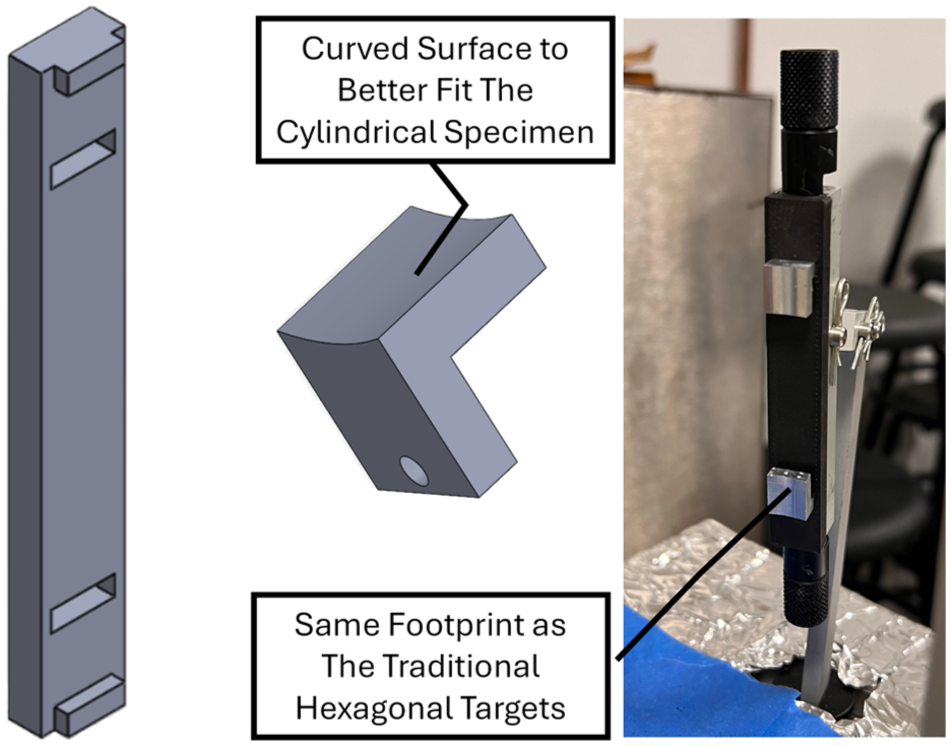
L-shaped target and adapter.
The final setup was developed with a gauge length of 50 mm, contact length of 55 mm with the ER-50 collet, and an unrestrained length of 70 mm, as shown in Figure 11.
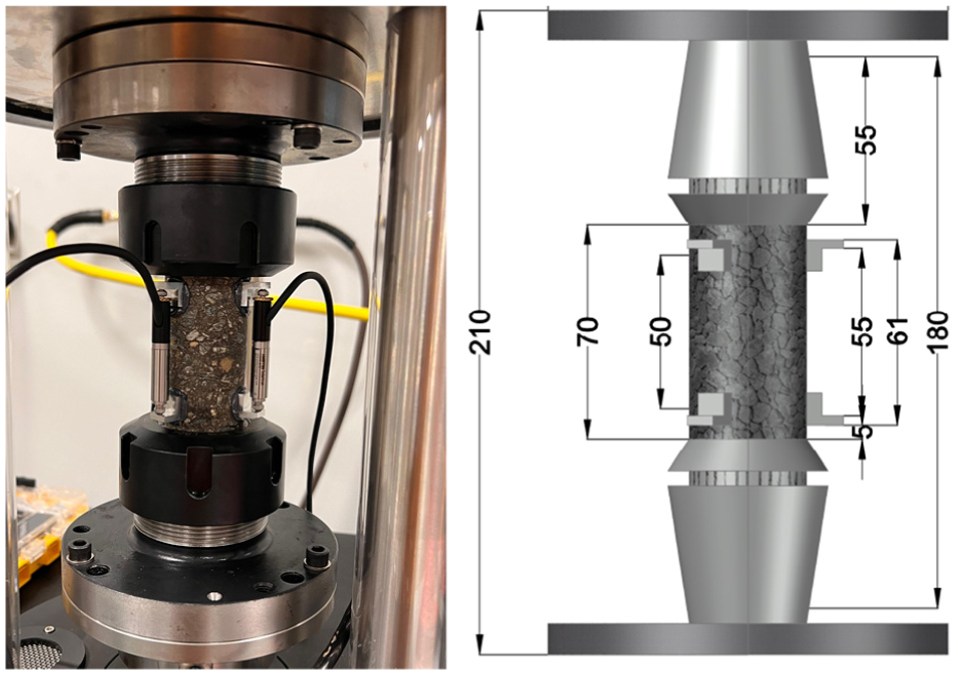
Collet–chuck clamping system with modified targets: (a) testing setup and (b) schematic drawing.
Comparison Between Different Setups
Table 2 gives the different ratios between the gauge length, contact length, unrestrained length, NMAS, and the distance between the boundary condition and the gauge point (the Saint Venant’s length). The specimen is completely restrained throughout the cross section when gluing it to the end plates, and in the collet–chuck clamping system it is only restrained from the periphery of the specimen, as shown in Figure 12, the distance between the boundary and the gauge point for collet–chuck systems was assumed to be in the middle of the contact length between the collets and the specimens because of the difference between the actual boundary conditions between the traditional setups and the collet–chuck system. This assumption needs further confirmation using comprehensive FE analysis modeling. The results presented in the Table 2 indicate that, based on this assumption, reducing the distance between the targets and the boundary may lead to a more uniform stress distribution when the clamping system is used.
Summary of Comparison Between Different Setups
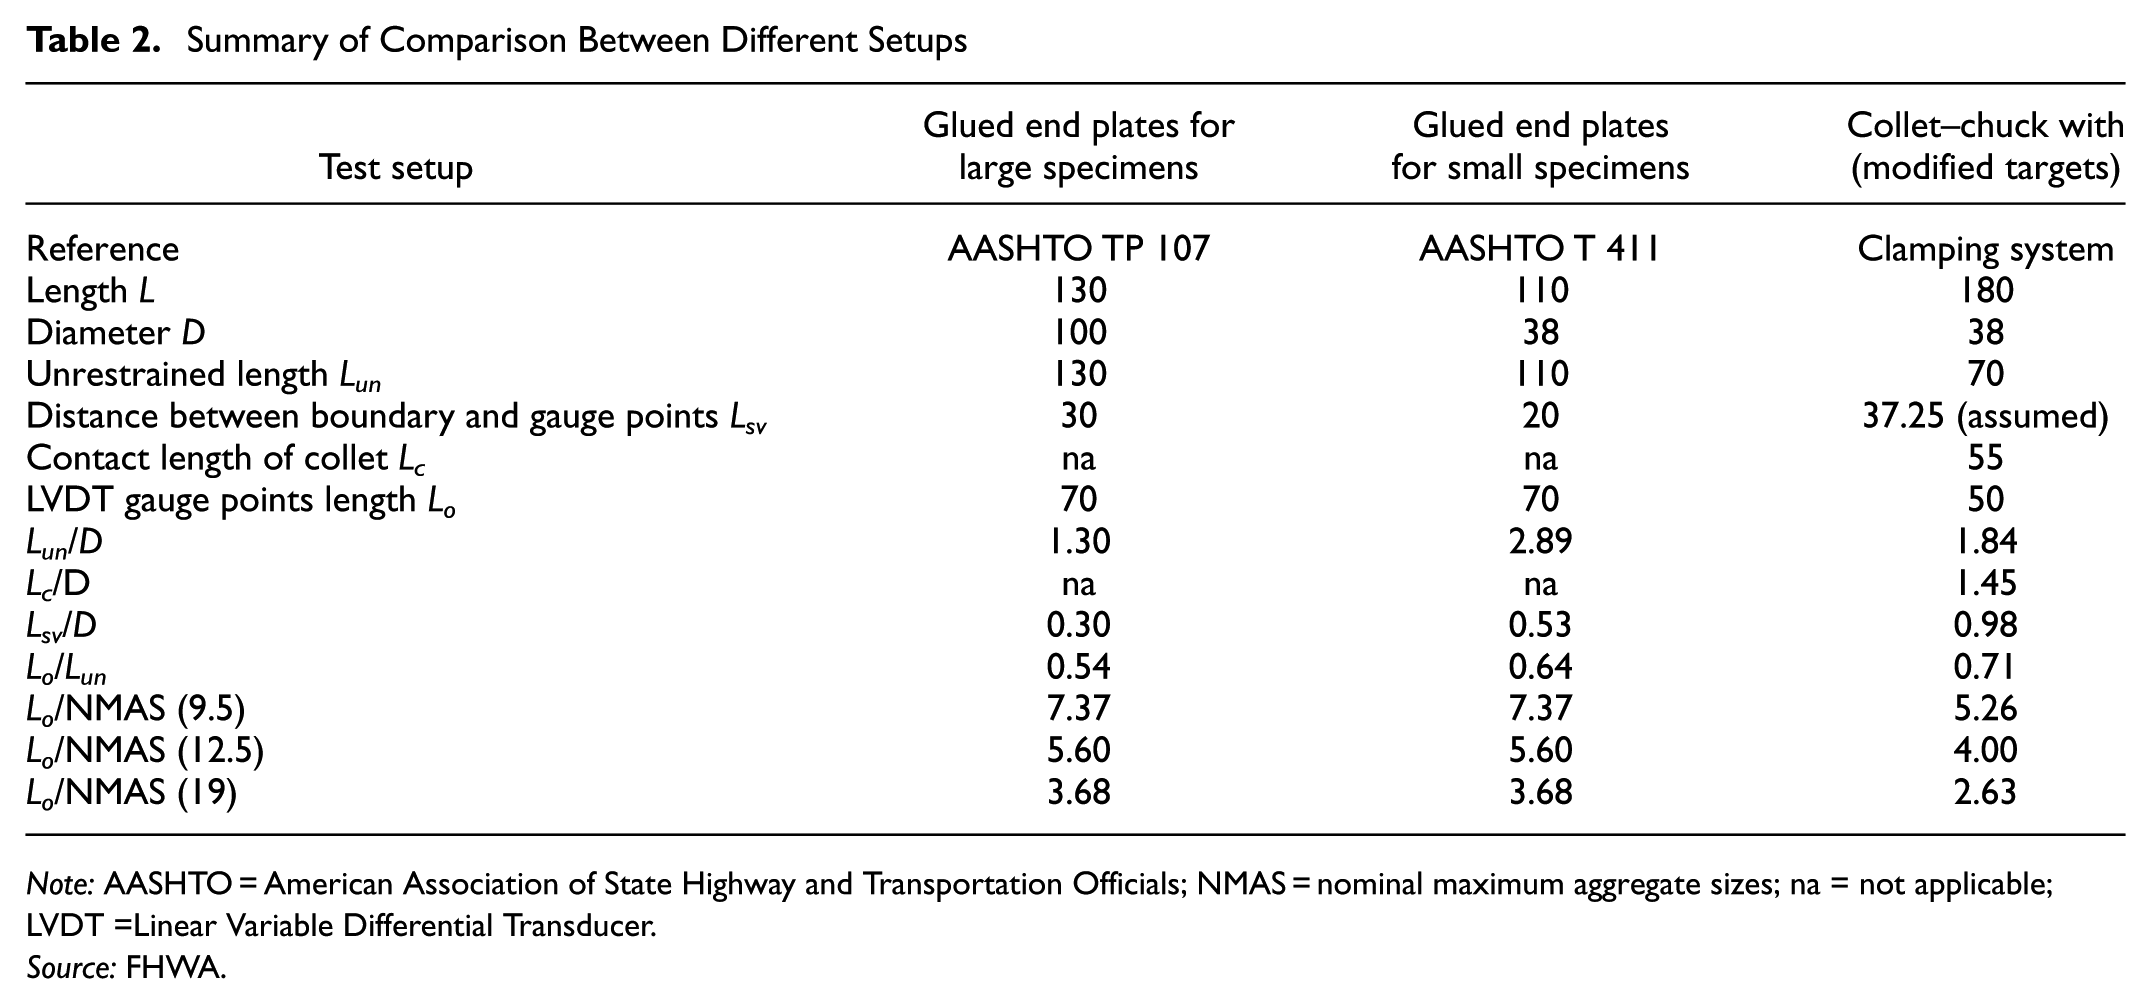
Note: AASHTO = American Association of State Highway and Transportation Officials; NMAS = nominal maximum aggregate sizes; na = not applicable; LVDT =Linear Variable Differential Transducer.
Source: FHWA.
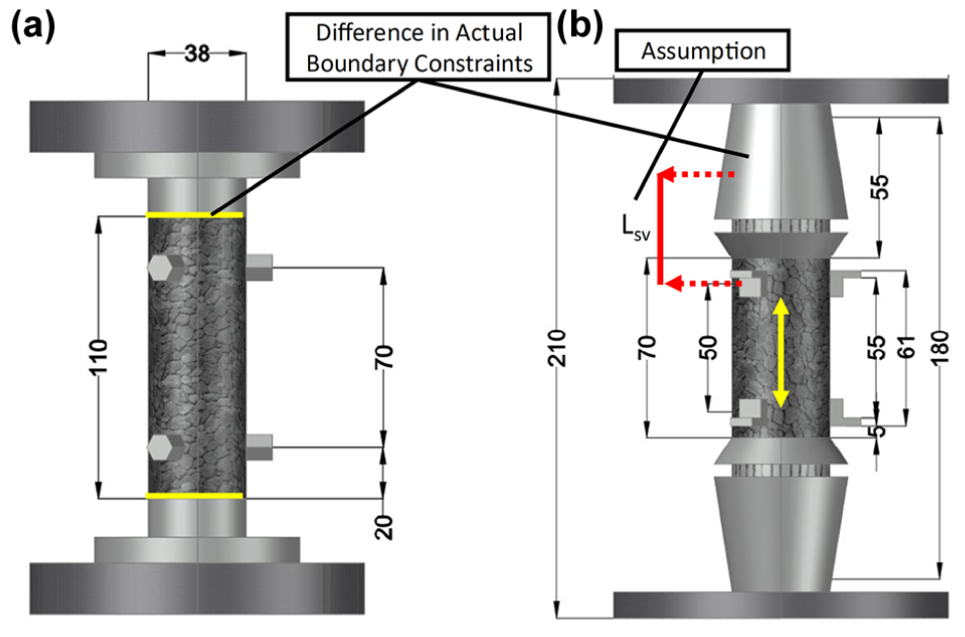
Difference in boundary conditions between the testing setups: (a) Standard testing setup and (b) collet-chuck testing setup.
Collet–Chuck System Modification
Chuck Modification
The efforts to optimize the clamping system included modifying the chuck to ensure an efficient load transfer from the AMPT tension ring to the upper chuck. This modification was required because the chuck and standard spacer platens are attached to the outer moving ring of the AMPT’s tension ring, with the standard ring having contact with the middle-fixed part of the tension ring to transfer loads, as shown in Figure 13. This was not the case in the unmodified chucks because there was a gap in the middle of the chuck, and full contact with the tension ring could not be achieved. The first trial for modification was performed by adding a steel plate to the bottom of the chuck to fill the gap in the chuck, as shown in Figure 14. Then, to ensure that the system was transferring the loads effectively, the chuck bottom plate was machined into a flat surface, as shown in Figure 15.
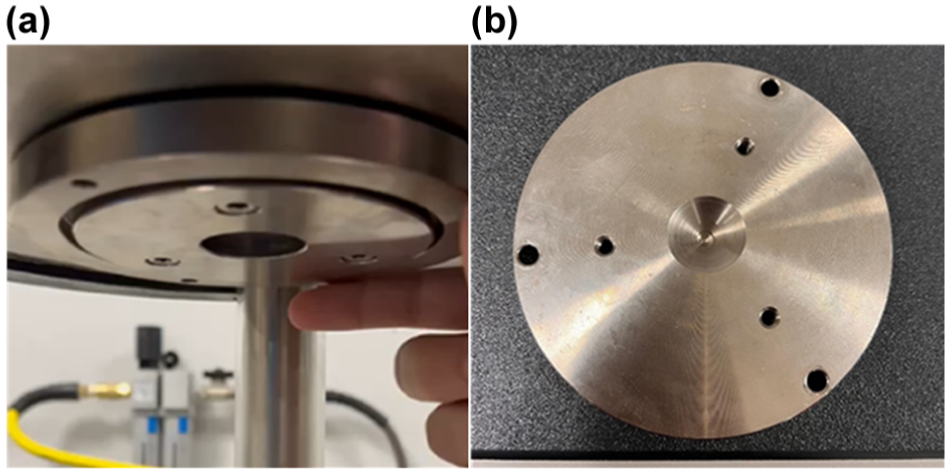
AMPT standard glued endplate fatigue testing setup: (a) AMPT tension ring and (b) spacer plate used to attach the tension ring to the glued endplate.
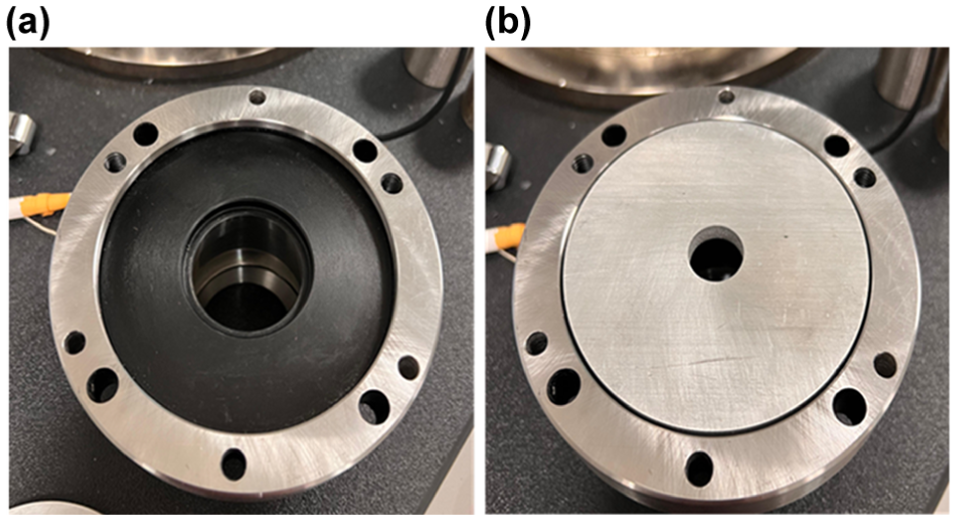
First trial to modify the chuck: (a) unmodified chuck; and (b) chuck with plate (loose and glued)
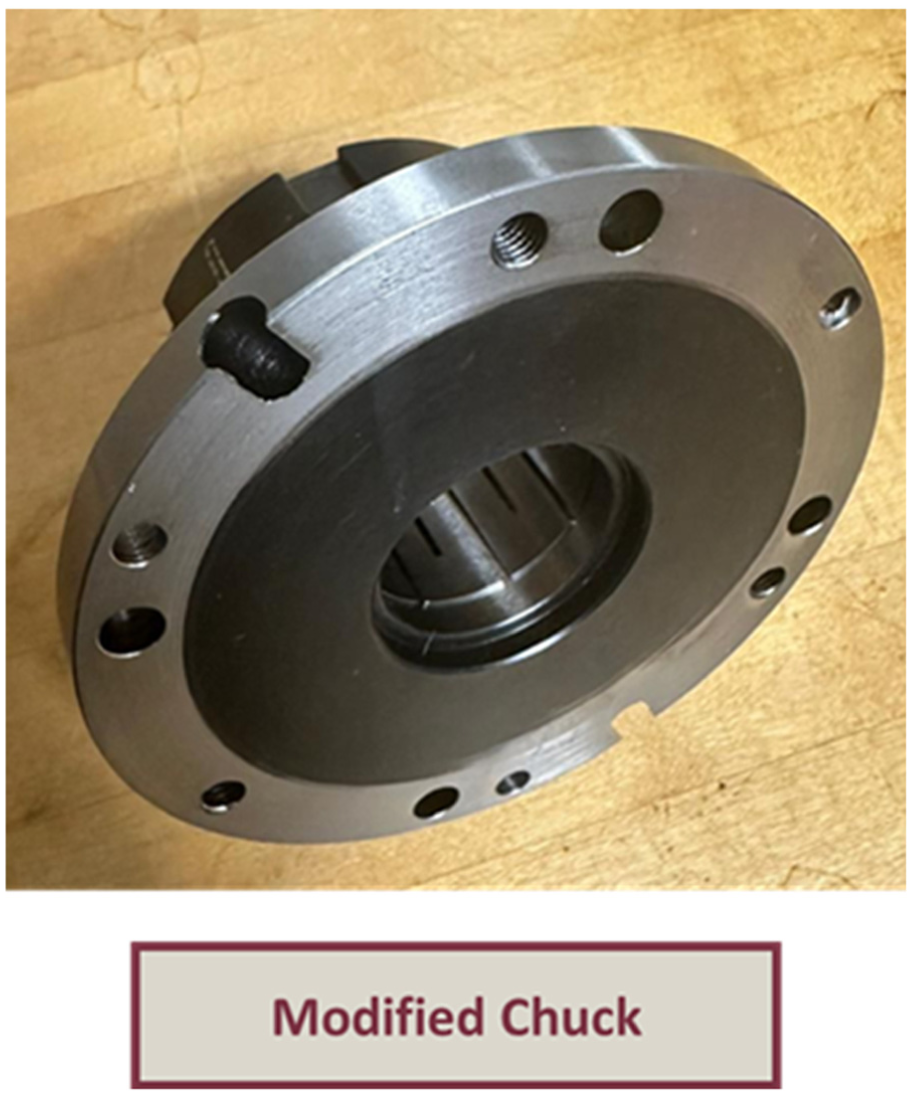
Modifying the chuck by cutting the edge ring.
Interlayers Between Collet and Specimens
An attempt was made to improve the contact between the specimens’ surface and the collet using different interlayers. Using interlayers could compensate for the imperfections on the specimens’ surface because the collet–chuck clamping system is more sensitive to the condition of the specimen’s surface imperfections resulting from the coring process.
Locknut Utilization
Because the uniaxial cyclic fatigue test involves dynamic loading on the specimen, the nut loosens when running the test. Therefore, an additional locknut was installed alongside the chuck nut, as shown in Figure 16, preventing the cap from loosening during the cyclic fatigue test. This concept is commonly applied in machinery and steel structures, with different examples of the nuts shown in Figure 17. Therefore, the machine’s compliance values improved compared with the glued endplate setup. Knowing that machine compliance is the ratio between the actuator movement and the on-specimen strain, lower machine compliance indicates a more efficient load transfer for the system. The locknut was also modified by reducing its thickness to allow the chuck’s cap to close all the way on the collet and to provide optimal clamping frictional forces for efficient load transfer.
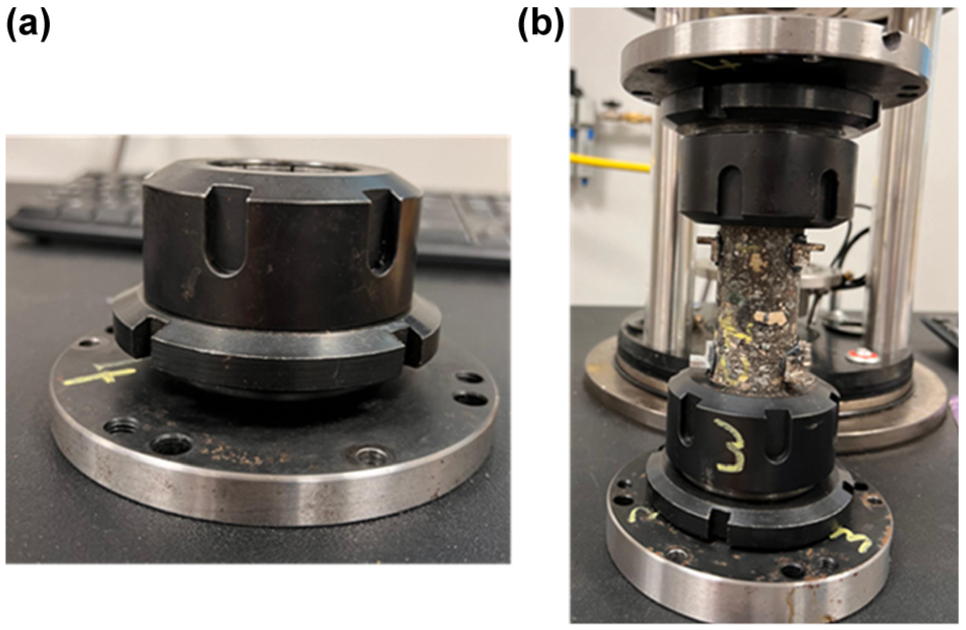
Final collet-chuck setup using the locknuts: (a) the locknut added to the collet-chuck and (b) collet-chuck assembly with the specimen.
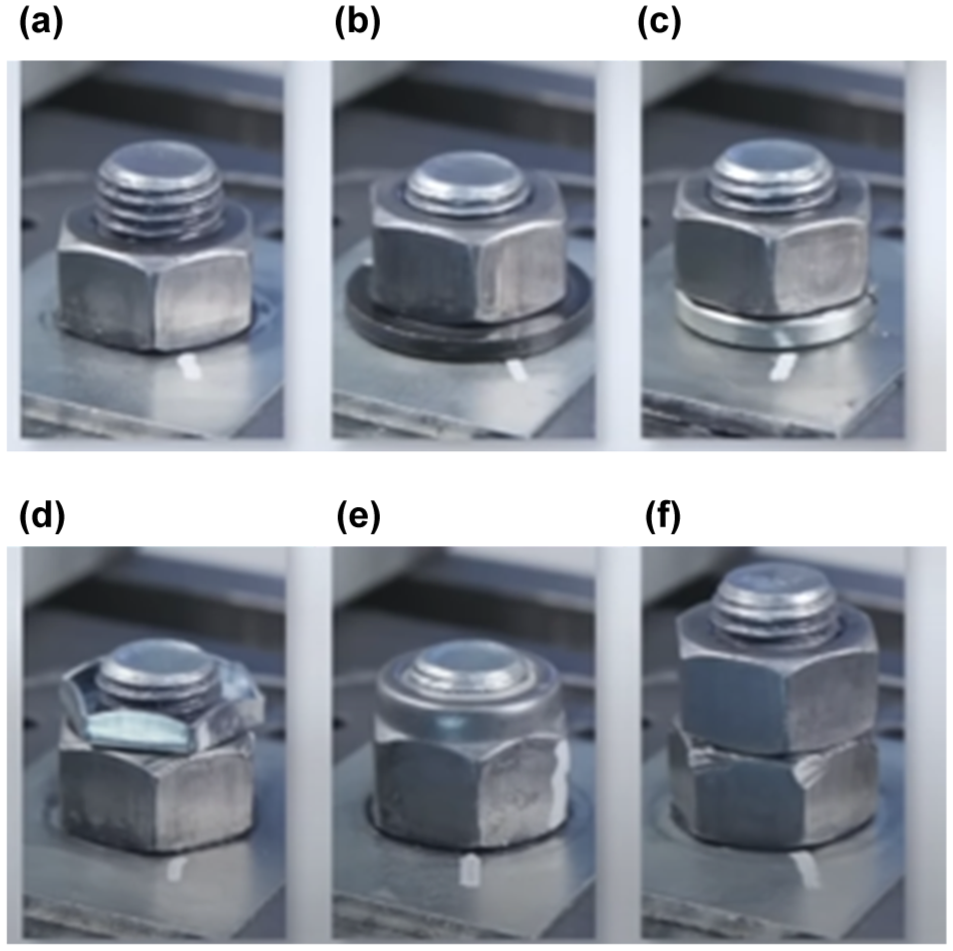
Different nuts to prevent bolts from loosening: (a) unsecured nut; (b) plain washer; (c) helical spring washer; (d) check lock nut; (e) nylon insert nut; and (f) double nut.
FE Simulation of Cyclic Fatigue Test with Collet–Chuck System
The FE analysis in this study was conducted to evaluate and refine the proposed collet–chuck fixture by examining its influence on the stress–strain response of asphalt concrete fatigue specimens. A 3D parametric FE model of the fixture–specimen system was developed to quantify stress and strain distributions, with particular attention to potential local stress concentrations introduced by the new design. The models were restricted to linear viscoelastic stress–strain analysis under the specified loading and boundary conditions and did not simulate damage evolution, microcracking, or progressive failure mechanisms in the asphalt mixture. To represent the cyclic fatigue test conditions, a cylindrical asphalt specimen was modeled in Abaqus ( 22 ), where viscoelastic behavior was defined using Prony-series parameters and Williams–Landel–Ferry shift coefficients derived from material characterization (Table 3).
Finite Element Model Input Parameters to Simulate Viscoelastic Material Properties of Asphalt Mixture
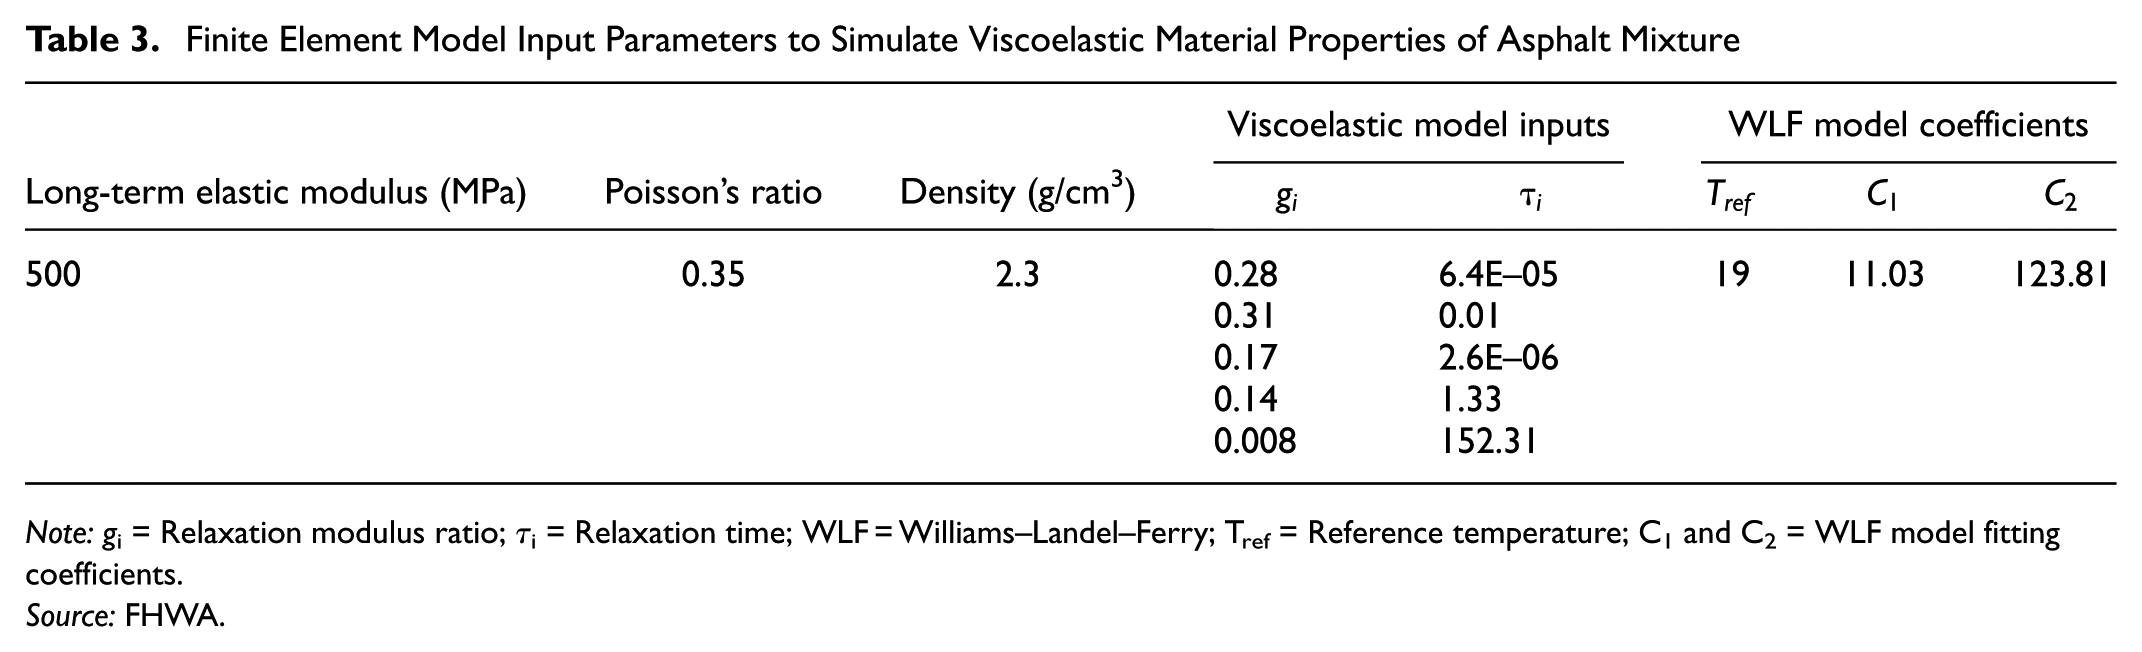
Note: g i = Relaxation modulus ratio; τi = Relaxation time; WLF = Williams–Landel–Ferry; Tref = Reference temperature; C1 and C2 = WLF model fitting coefficients.
Source: FHWA.
To replicate the uniaxial cyclic fatigue test configuration that uses a collet–chuck gripping system, an FE model was developed that includes the asphalt mixture specimen and the collets mounted at its ends. In this configuration, a pair of collets (proposed in earlier stages of this study) is clamped onto the top and bottom ends of the specimen, allowing axial loading while enforcing lateral confinement. A cylindrical specimen with a diameter of 38 mm and a height of 180 mm was modeled along with two collet assemblies. The geometry of the collets was created based on dimensional information available from a commercial manufacturer. Figure 18a shows the complete 3D model used for the simulation.
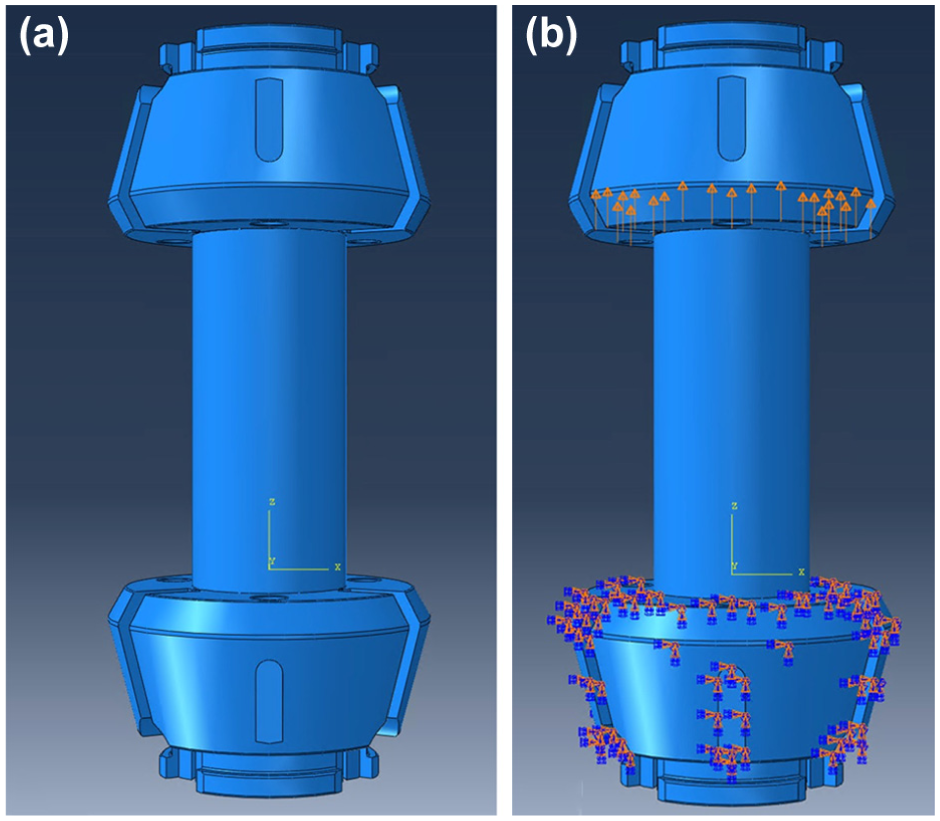
Showing: (a) assembly of collets and test specimen; and (b) boundary conditions applied in finite element simulation.
In the FE model, the bottom collet was fully restrained in all directions to simulate the fixed support. The loading was applied at the top collet by imposing axial displacement, while maintaining it free to translate or rotate, ensuring that the force was transferred throughout the specimen. The primary objective of this simulation was to investigate the effect of different boundary constraints and confinement stresses introduced by the collet–chuck system. To replicate the mechanical clamping effect of the collet, radial stresses were applied at the inner surface of the collets toward the specimen (Figure 18b).
The radial loads were chosen to represent typical and extreme clamping scenarios. The hysteresis loops generated under these two conditions are shown in Figure 19. For the lower radial stress (1 MPa), which corresponds to approximately 3% of the maximum axial load, the resulting stress–strain hysteresis loop is nearly symmetrical about the origin. The range of axial stress and strain in this case is approximately from −30 to +30 MPa and −0.0015 to +0.0015, indicating a well-balanced tensile–compressive behavior during cyclic loading.
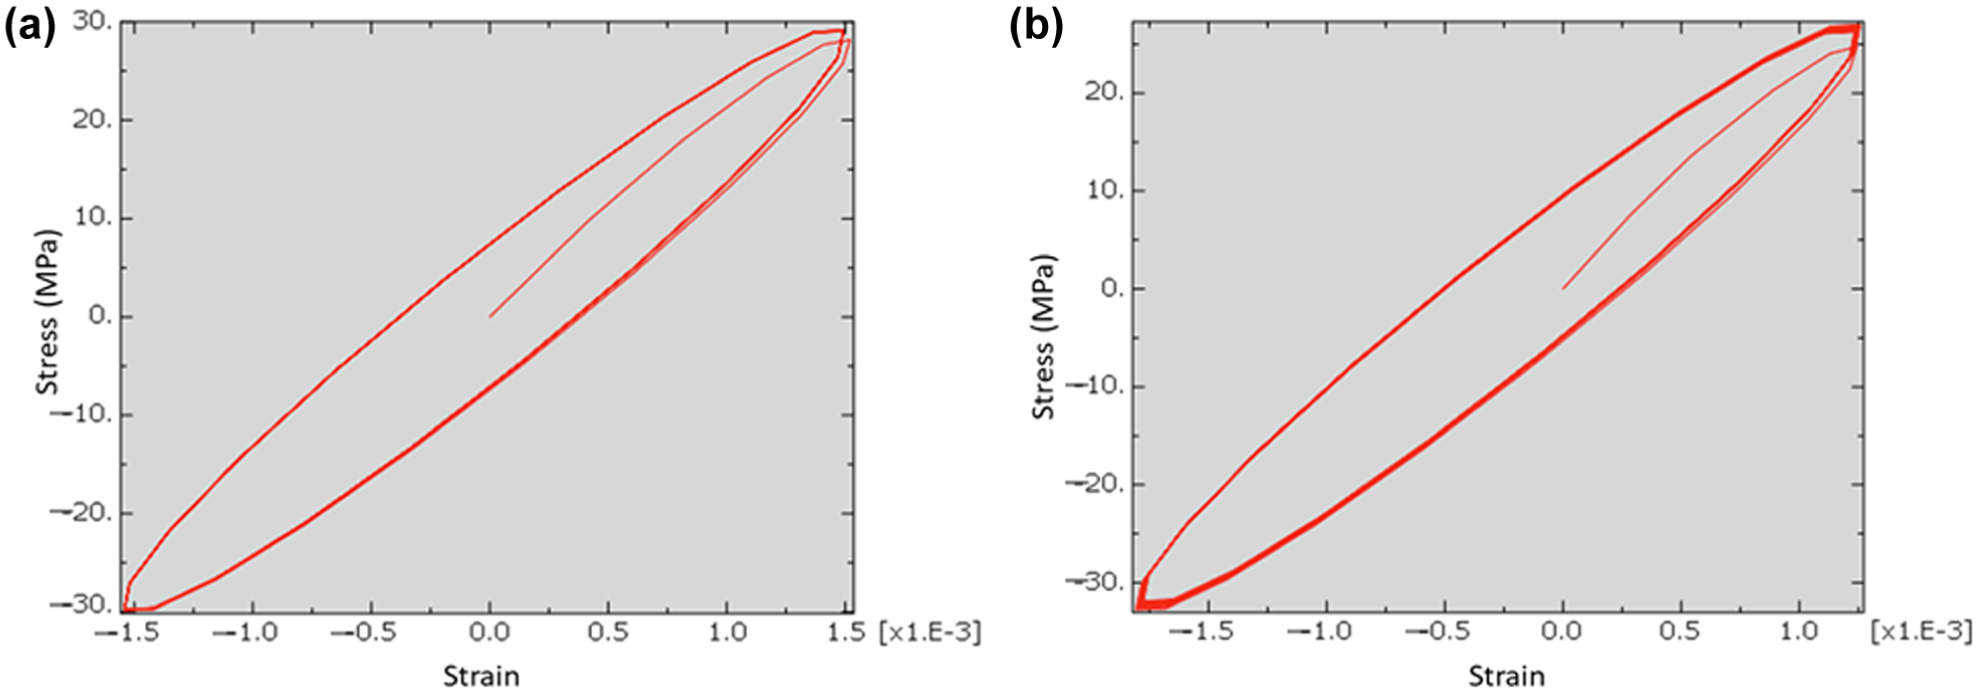
Variation in stress and strain with a tightening load of: (a) 1 MPa; and (b) 10 MPa.
In contrast, the hysteresis loop obtained under the higher radial stress of 10 MPa exhibits a distinct shift toward the compressive quadrant (Figure 19b). The loop is no longer centered but appears to move in the “southwest” direction (downward and leftward), indicating dominance of compressive behavior. In this case, axial stresses were from −34 MPa to +27 MPa, and the strains were from −0.00175 to +0.00125. This shift is primarily attributed to the Poisson effect: the radial confinement from the collet induces compressive axial stresses in the portion of the specimen enclosed by the collet. These residual stresses lead to a reduction in applied axial tensile stress, as well as reduced apparent tensile strain responses within the gauge length.
This finding reinforces the importance of minimizing tightening stresses to avoid distortion of the test results. During specimen setup, it is recommended to either place the AMPT in zero-force mode to eliminate preinduced compressive stresses or to assemble the specimen and collets outside the AMPT, where there is no external constraint preventing axial elongation. Assembling externally ensures that the specimen is not subjected to unintended compressive loading within the gauge length before testing. Failure to mitigate these effects may compromise the accuracy of stress and strain measurements, particularly during the early cycles. Figure 20 further supports this observation by showing the distribution of Von Mises stress across the model. Stress concentrations are most prominent near the collet grips, confirming the role of radial tightening in influencing local material behavior.
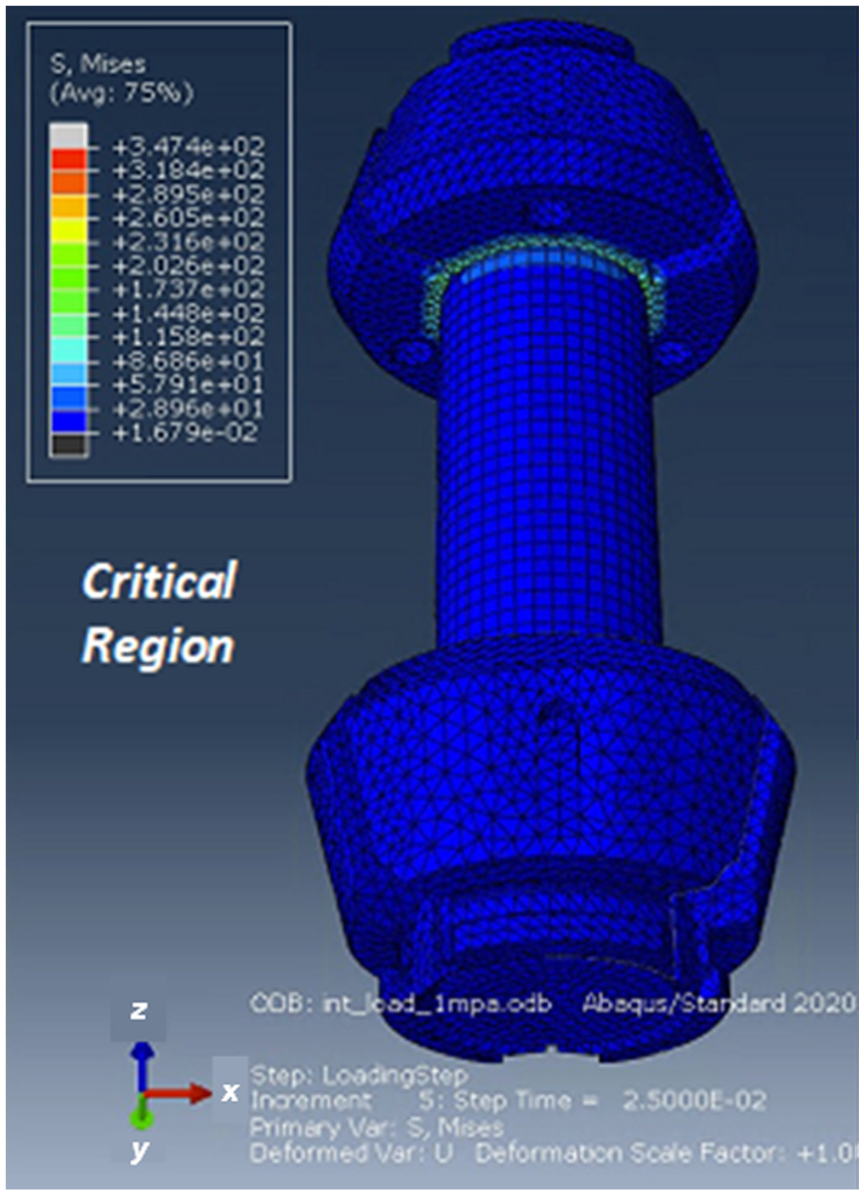
Critical region in a collet–chuck mounted test setup.
The FE simulations for uniaxial fatigue testing of asphalt mixtures with the collet–chuck system showed pronounced stress concentrations at the specimen’s grip interfaces, especially near the regions subjected to radial confinement. These localized peaks indicate potential sites of premature damage and must be accounted for when selecting gauge length and instrumentation placement.
Experimental Work
Three tests were conducted on all eight mixtures. The dynamic modulus test was conducted on the standard small specimen (38-mm diameter) geometry (AASHTO TP 132), and the cyclic fatigue test was conducted using the standard glued end plates (according to AASHTO T 411) on 110-mm high specimens and using the newly developed collet–chuck clamping system on 180-mm high specimens ( 23 , 24 ). One operator conducted the fatigue testing using the standard glued end plates and the collet–chuck clamping system to avoid any discrepancies because of operator bias. In addition, an air void study was conducted to determine the air voids’ relationship between the standard 110-mm high specimens and the 180-mm specimens.
Air Voids Study
The target air void for the 110-mm height specimens is 7.0% ± 0.5% in the standard specification for both the dynamic modulus and cyclic fatigue tests (AASHTO TP 132 and T 411) ( 23 , 24 ). However, when using the collet–chuck clamping system, there will be no need to cut the ends of the 180-mm height specimens. Moreover, the air void gradient in the SGC specimens is well documented. Therefore, these differences need to be quantified and the target air voids determined for the 180-mm specimens that will yield the target 7.0% ± 0.5% in the 110-mm specimens. This will be achieved by coring the SGC specimens and measuring the air voids twice, once before cutting the specimen ends and once again after cutting the specimens.
Dynamic Modulus Test
The standard dynamic modulus test was carried out on triplicate specimens for each mixture according to AASHTO TP 132-23 (23). The standard requires testing the specimens at three different temperatures with three frequencies from 10 to 0.1 Hz; however, the test in this study was conducted at six different frequencies from 25 to 0.1 Hz at 4.4°C, 21.1°C, 37.8°C, and 45°C. The test started at the lowest temperature with the highest frequency, then ended by testing the specimens at the highest temperature with the lowest frequency. Following this, the data was analyzed using FlexMAT software to obtain the master curves and the data necessary to conduct the S-VECD model analysis.
Uniaxial Cyclic Fatigue Test
The cyclic fatigue test was conducted on all mixtures using the standard glued endplates setup and the collet–chuck clamping system. The tests were conducted in accordance with AASHTO T 411-23 ( 25 ) and AASTHO T 411-24 ( 25 ). The testing temperatures are given in Table 4; testing of the first five mixtures in this table followed the new AASHTO T 411-24 standards ( 24 ), which included revised testing temperatures compared with the previous version. However, this standard was unavailable when the previous mixtures were tested. Therefore, the new standard was used for the first four mixtures in the Table 4 and the other mixtures followed previous standards. For the HiMA mixture, the testing temperature was based on binder PG, while the current standard set the testing temperature to 18°C for HiMA despite the binder PG.
Fatigue Testing Temperatures for All Mixtures
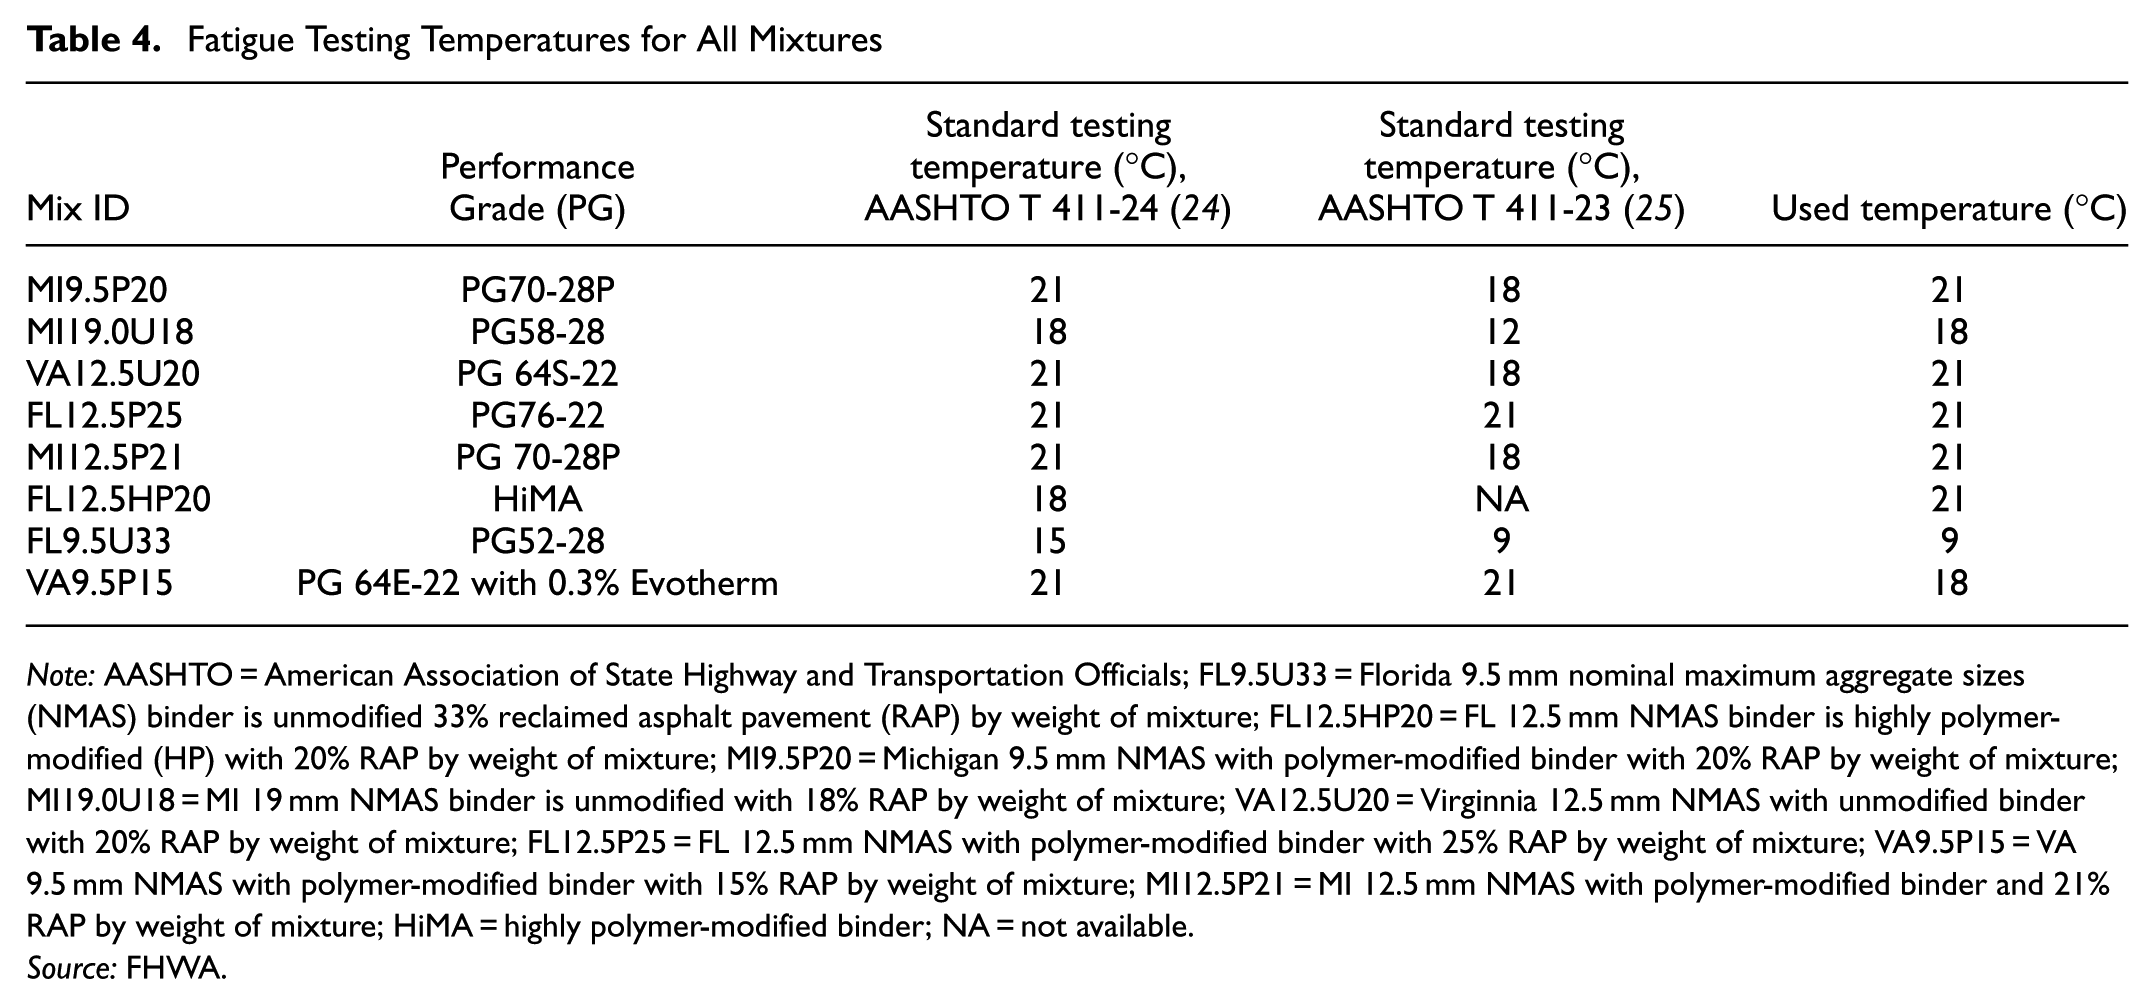
Note: AASHTO = American Association of State Highway and Transportation Officials; FL9.5U33 = Florida 9.5 mm nominal maximum aggregate sizes (NMAS) binder is unmodified 33% reclaimed asphalt pavement (RAP) by weight of mixture; FL12.5HP20 = FL 12.5 mm NMAS binder is highly polymer-modified (HP) with 20% RAP by weight of mixture; MI9.5P20 = Michigan 9.5 mm NMAS with polymer-modified binder with 20% RAP by weight of mixture; MI19.0U18 = MI 19 mm NMAS binder is unmodified with 18% RAP by weight of mixture; VA12.5U20 = Virginnia 12.5 mm NMAS with unmodified binder with 20% RAP by weight of mixture; FL12.5P25 = FL 12.5 mm NMAS with polymer-modified binder with 25% RAP by weight of mixture; VA9.5P15 = VA 9.5 mm NMAS with polymer-modified binder with 15% RAP by weight of mixture; MI12.5P21 = MI 12.5 mm NMAS with polymer-modified binder and 21% RAP by weight of mixture; HiMA = highly polymer-modified binder; NA = not available.
Source: FHWA.
For the clamping system, the specimens were conditioned in an environmental chamber along with the clamping system components. After conditioning, the specimen was inserted into the clamping system, then the assembly was bolted into the AMPT and metal shims were applied if needed between the upper chuck and the AMPT’s tension plate, similar to the glued endplates standard. The metal shims are used to ensure that the top and bottom loading platens are parallel, enabling uniaxial loading and reducing end failures caused by bending in the specimen.
The main purpose of this study was to accelerate uniaxial cyclic fatigue testing while obtaining comparable apparent damage index values S app . However, the previously discussed S-VECD outputs, such as the damage characteristics curve and DR, were also investigated to provide a more comprehensive validation of the newly developed test setup.
Results
Air Voids Study
The air voids of the 180-mm height specimens were measured before cutting them to the 110 mm required for the glued endplates testing to establish a relationship between the air voids in both heights. Since the collected mixtures had different gradations, RAP content, binder content, and NMAS, the data points from the eight mixtures were utilized to investigate this relationship. Figure 21 shows the relationship between the air voids measurements for the two heights for every mixture, using all the data points from the eight mixtures. Based on the measured data, a 7.5% ± 0.5% air void in a 180 mm specimen is equivalent to the standard 7.0% ± 0.5% required for dynamic modulus and fatigue testing in accordance with AASHTO TP 132-23 and AASHTO T 411 (23, 24). However, the results shown in Figure 21 were generated by a single operator in a single lab. Therefore, each user should further confirm this relationship based on their lab data and local materials.
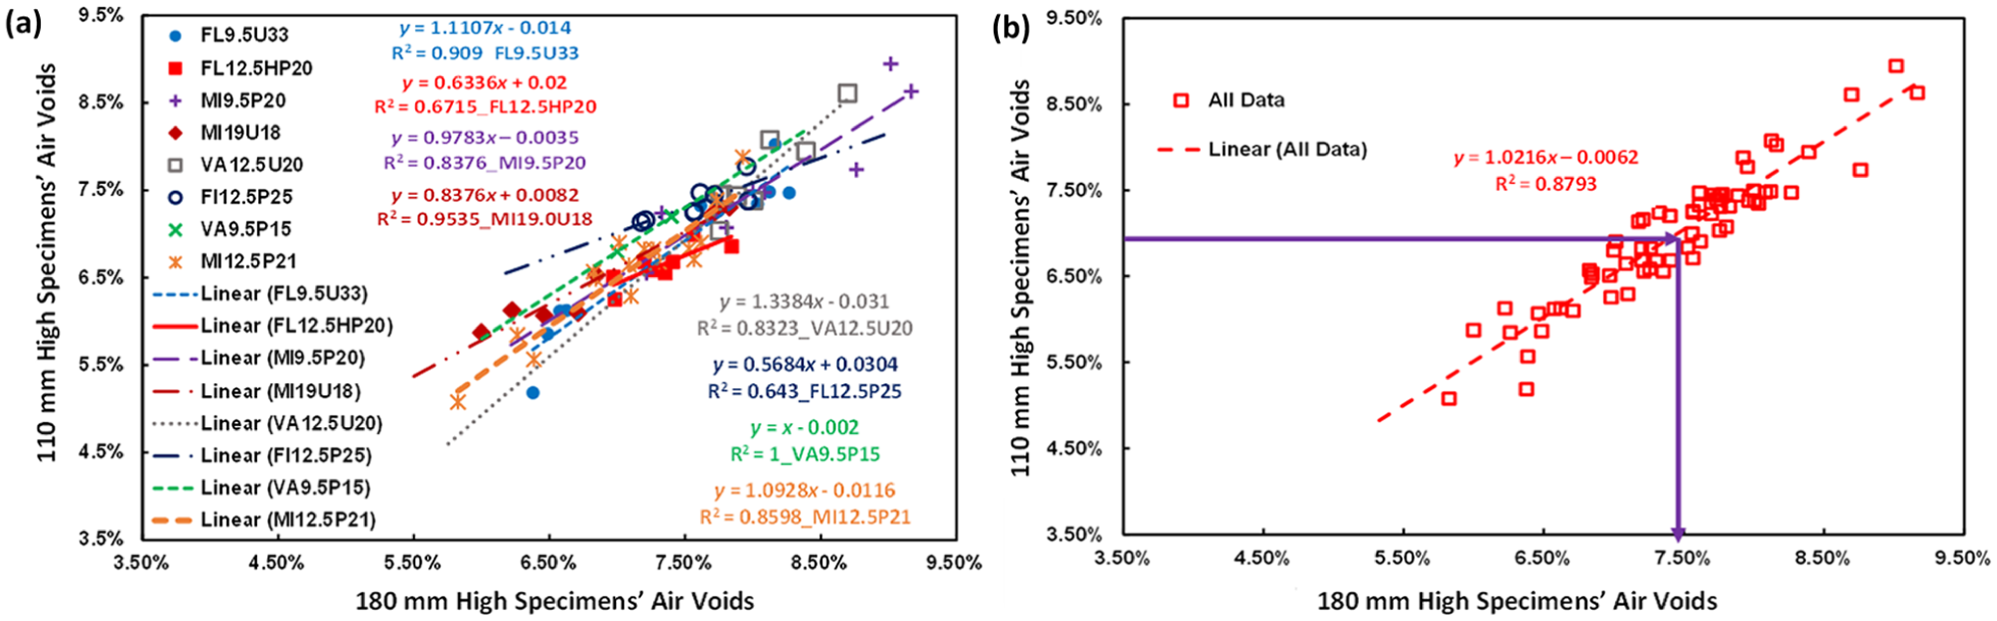
Relationship between air voids percentage for 110 mm and 180 mm specimens: (a) relationship for each mixture; and (b) relationship using all data points.
Dynamic Modulus Test Results
The dynamic modulus test was conducted at six different frequencies, starting from 25 to 0.1 Hz, and at 4.4°C, 21.1°C, 37.8°C, and 45°C. Then, the data were analyzed using the latest version of FlexMAT software. Figure 22 shows the dynamic modulus master curves for all the mixtures in this study. The master curves show that eight mixtures have different properties, which allows the verification of the collet–chuck clamping system using a wide range of materials, gradations, and RAP contents. VA9.5P15 shows the lowest modulus at higher temperatures and the highest modulus at lower temperatures, while MI9.5P20 shows a flatter master curve center slope displaying lower temperature sensitivity.
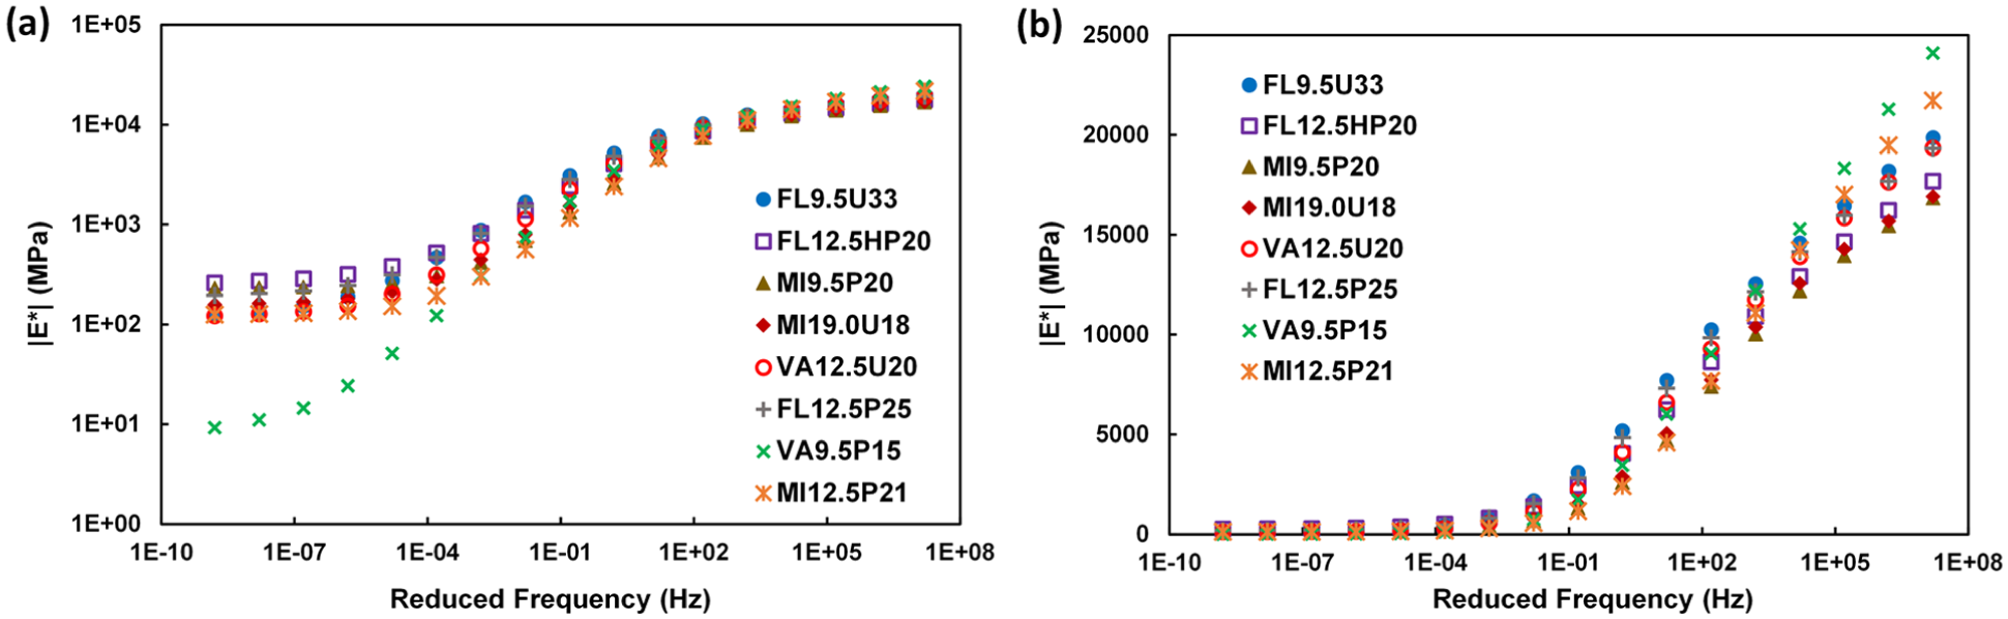
Dynamic modulus master curves for all mixtures: (a) dynamic modulus master curves at log-log scale; and (b) dynamic modulus master curve at semi-log scale.
Figure 23 shows the phase angle master curves of all the mixtures with VA9.5P15 peaking at a lower reduced frequency compared with the other mixtures, followed by FL9.5U33. FL12.5HP20 and MI9.5P20 showed lower phase angle values before reaching the peak compared with other mixtures. The phase angle master curves were generated using the 2S2P1D storage modulus in the FlexMAT software.
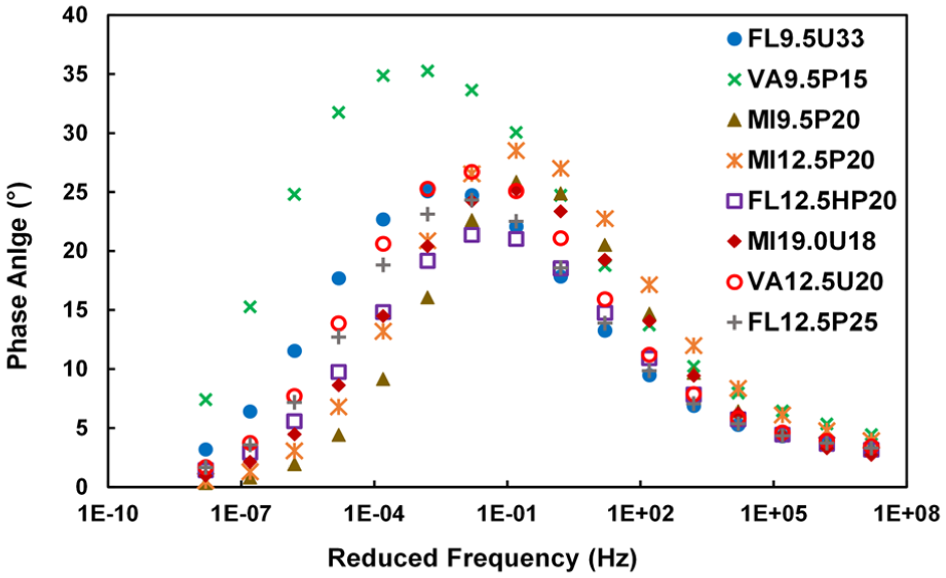
Phase angle master curves for all mixtures.
In addition, the shift factor of each temperature for the different mixtures was plotted at a reference temperature of 21.1°C, as shown in Figure 24. Shift factors are mixture-dependent and indicative of mixture temperature sensitivity. Mixture MI9.5P20 has the flattest slope among the tested mixtures, while FL9.5U33 had the steepest slope.
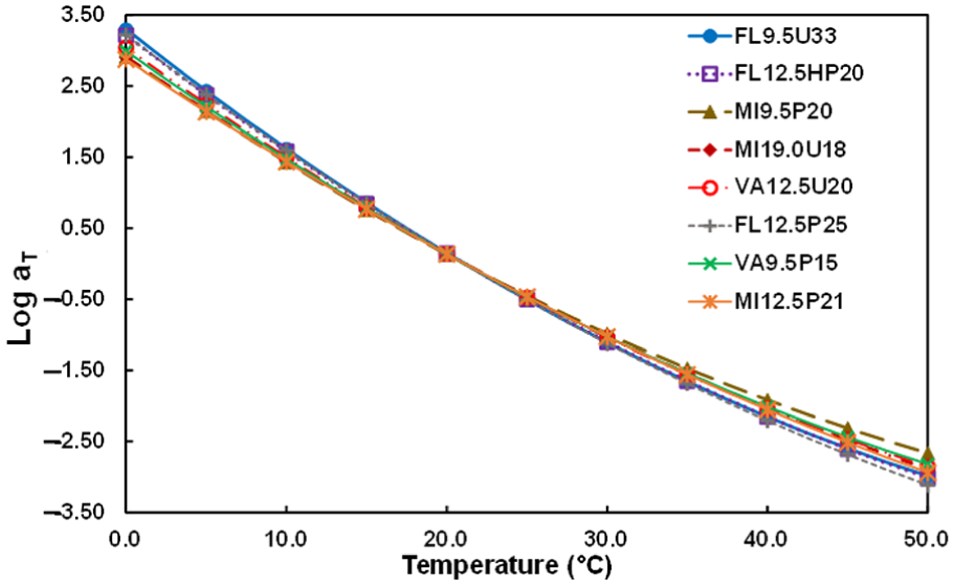
Shift factors for all mixtures using 21.1°C as a reference temperature.
Cyclic Fatigue Test Results
Glued Endplates Fatigue Testing
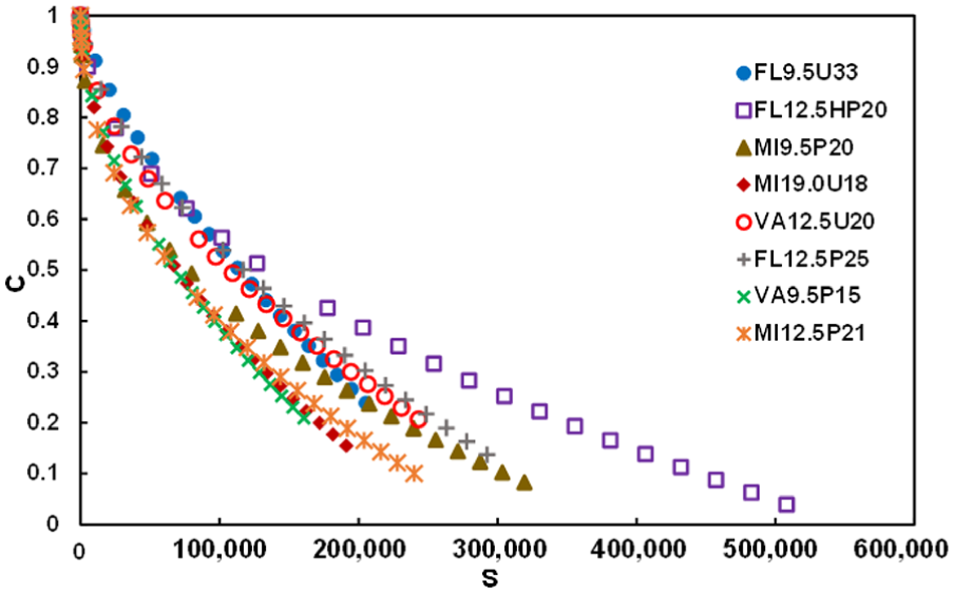
Figure 25 shows the damage characteristic curve for all mixtures, with the VA9.5P15 curve shifting to the left and bottom of all curves, indicating that to obtain the same pseudo stiffness for this mixture, less damage is needed compared with the other mixtures. FL12.5HP20, the HiMA, and FL12.5P25 need more induced damage to reach the same pseudo stiffness.
Damage characteristics curves for all mixtures.
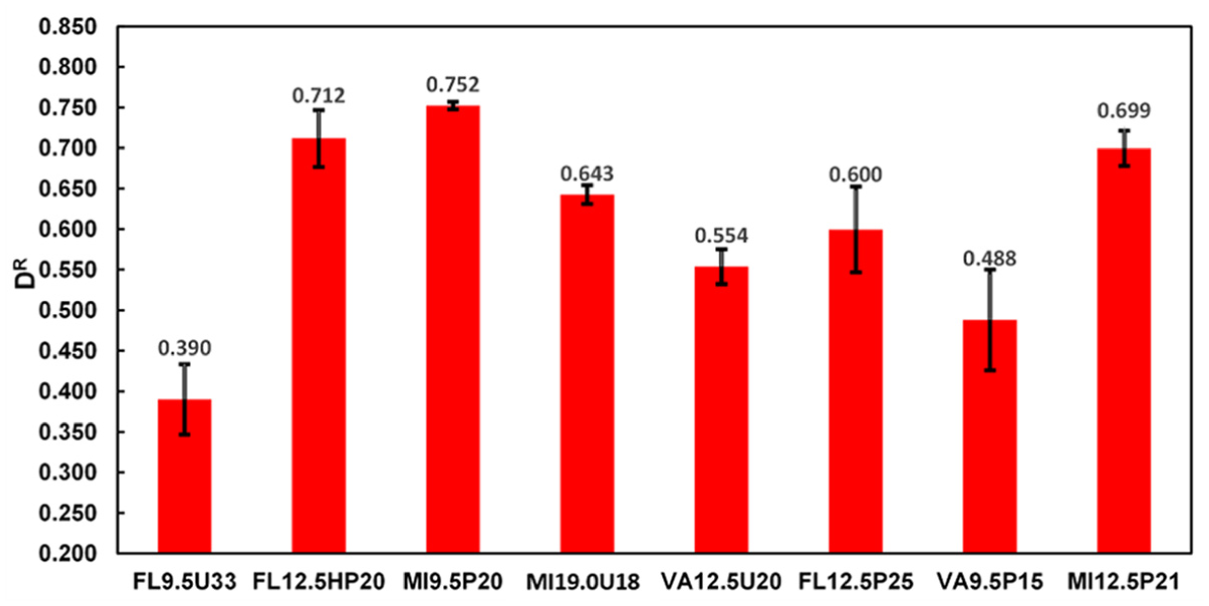
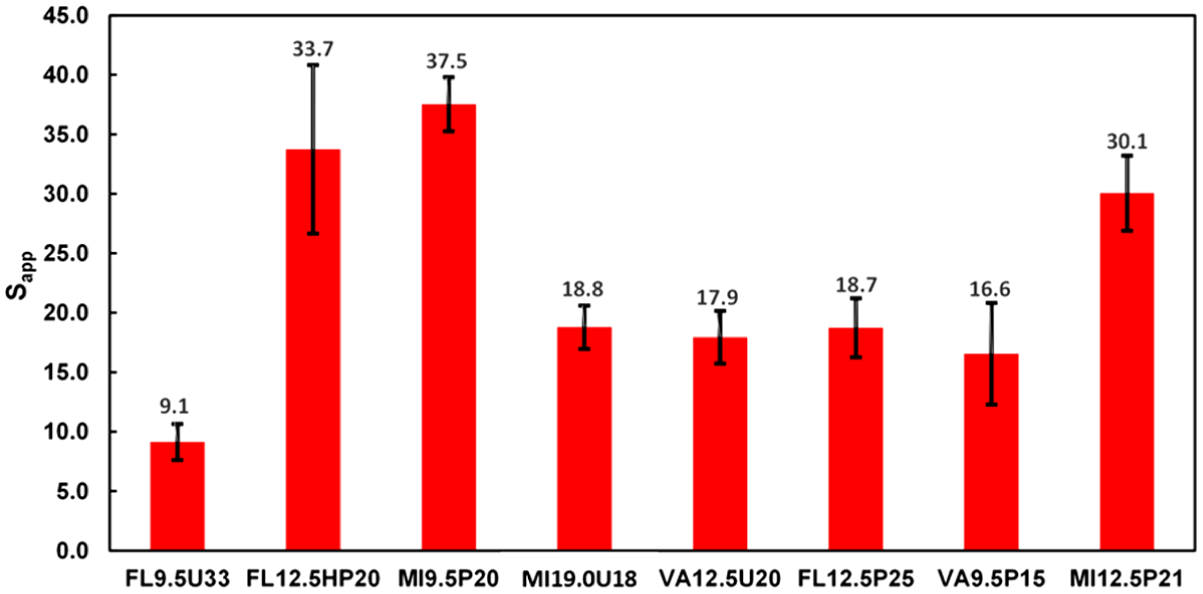
In addition, Figure 26, and Figure 27 show D R and S app for all the mixtures. The D R results for MI9.5P20 and MI19.0U18 showed high repeatability, with the standard deviation shown in the error bars being less than any other mixture. Moreover, the D R values for the mixtures were from 0.39 for FL9.5U33 to 0.752 for MI9.5P20, which shows that the materials selected for this study cover a wide range of properties and anticipated fatigue resistance performance.
D R values for all mixtures.
S app values for all mixtures using glued end plates.
The S app values shown in Figure 27 follow the logical trend, with MI9.5P20 being the top performer, along with FL12.5HP20, because they are polymer-modified mixtures and have high DR values, while FL9.5U33 had the lowest S app value because it contained an unmodified binder with the highest RAP content in this study. Of note, evaluating the performance of the different mixtures is not the focus of this study; the preceding discussion is intended to illustrate the wide range of materials included.
Collet–Chuck Fatigue Testing
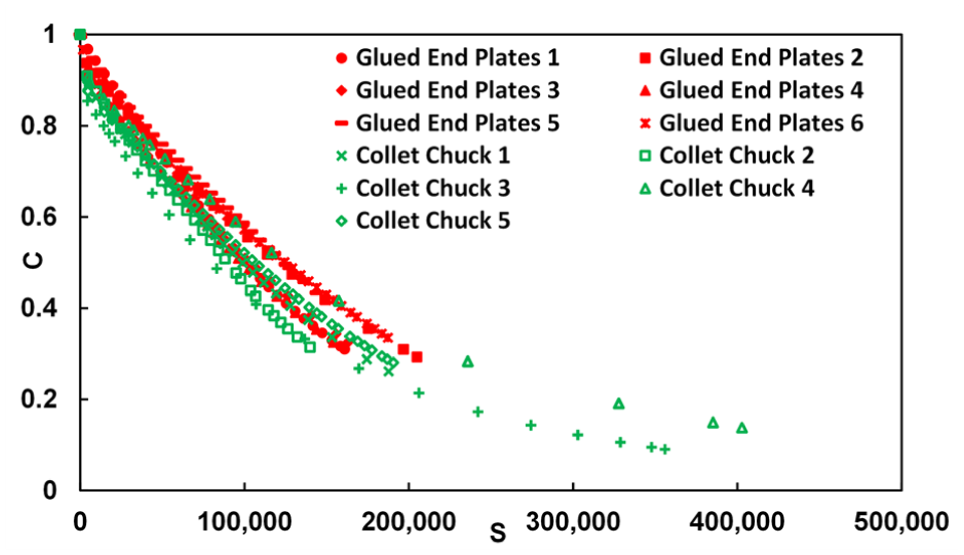
After the development of the collet–chuck clamping system and conducting the standard dynamic modulus and glued end plates testing, the cyclic fatigue test was performed using the clamping system. First, the FL9.5U33 mix was tested because it was assumed to be the most prone to cracking compared with the other mixtures in the study. Figure 28 shows the C–S curves for FL9.5U33 obtained with glued end plates and with the collet–chuck system. The close agreement between the two curves demonstrates that the collet–chuck system can provide comparable results, justifying its continued use in subsequent testing.
Damage characteristic curve for FL9.5U33 using glued end plates and collet–chuck clamping system.
Then, MI9.5P20 was tested because it has the highest S app value in this study, along with the highest input micro strain required to run the test based on the standard glued-end-plate testing. Therefore, the aim of testing this mixture was to investigate whether this high input of the micro strain will cause slippage between the ER collet and the cylindrical asphalt specimen in the clamping system or not. The C–S curve shown in Figure 29 demonstrates a strong agreement between the test results using the glued end plates and the collet–chuck system. In addition, the test was conducted successfully without any slippage incidents. Following this, testing for the remaining six mixtures was carried out. Figure 30 shows a tested specimen with a middle failure using the clamping system.
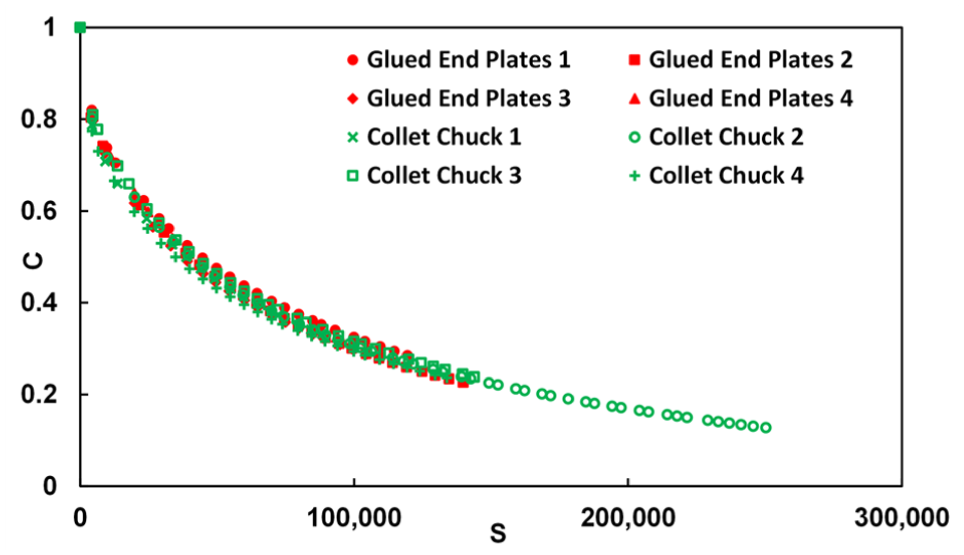
Damage characteristic curve for MI9.5P20 using glued end plates and collet–chuck clamping system.
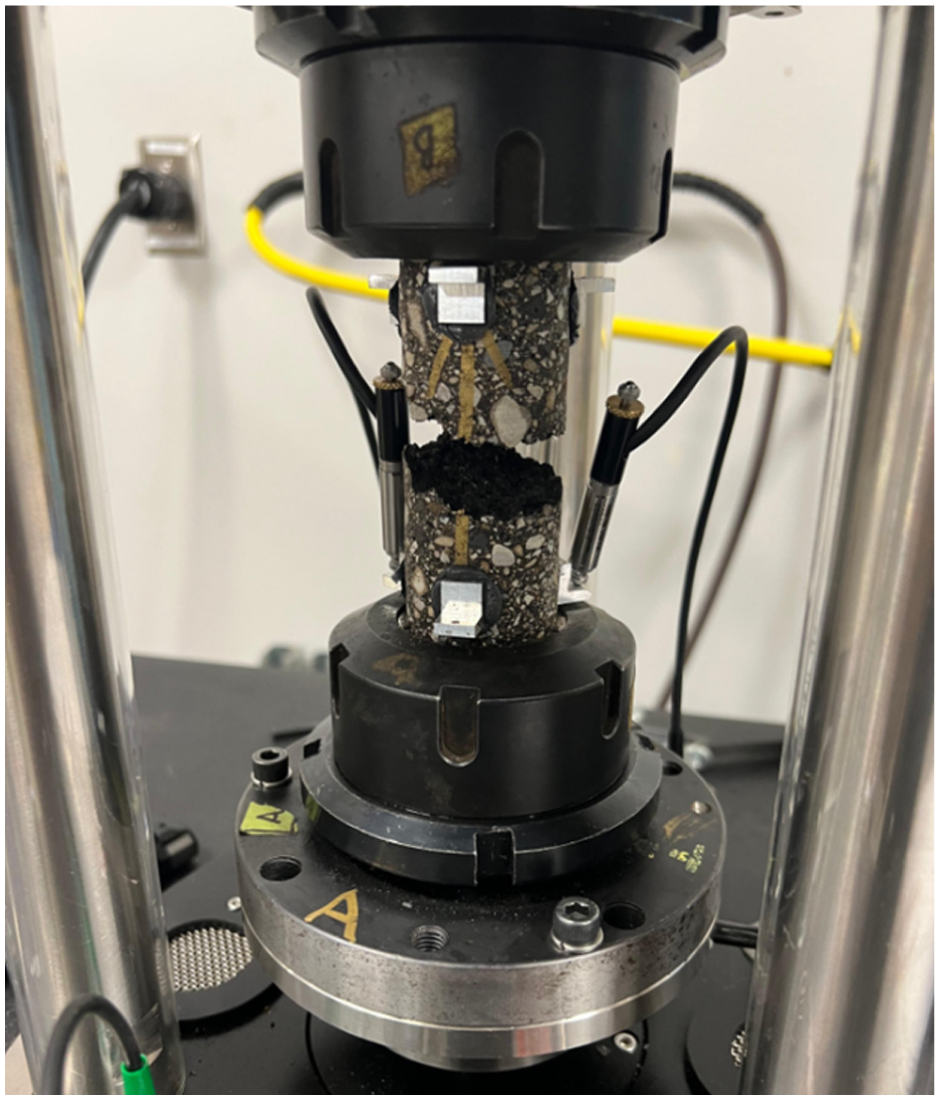
Middle failure using the collet–chuck clamping system.
The normalized variance index v norm was computed for the glued end plates and the collet–chuck clamping system, and using both data sets to investigate the C–S curves quantitatively. The parameter v norm was calculated using Equation 4, as presented in AASHTO T411, with more details on v norm available in the literature ( 26 , 27 ). For each mixture, at least four specimens were tested using the glued end plates to obtain at least three acceptable data points, and if there was high variability as determined by the v norm parameter, another two data points were added to the glued end plates data set. For the collet–chuck clamping system, at least four data points were generated with FL9.5U33, having five data points because it had higher variability. Figures 31 and 32 show the C–S curves and the D R plots for all eight mixtures using both systems. These figures show a strong agreement between the C–S curves and D R plots utilizing both testing systems and procedures. In addition, they show better repeatability in five out of the eight mixtures using the clamping system by looking at the v norm values at the bottom left corner of the C–S curves. Moreover, when calculating the v norm value using both glued end plates and the clamping system data points, the values showed that there is a strong overlap between the C–S curves using both testing procedures. In addition, the collet–chuck clamping system yielded similar or lower C at failure value C f when compared with glued end plates. Part of this variation could be attributed to the heterogenous nature of asphalt mixtures; the lower C f could be because of the improved efficiency of load transfer within the collet–chuck clamping system.

where
v norm = normalized variance index,
k = multiplier to change the magnitude,
C11_ new and C12_new = fitting coefficients for the power model of the mixture after normalization,
C 11– j _new and C12– j _new = fitting coefficients for the power model of the jth specimen after normalization, and
n = number of specimens.
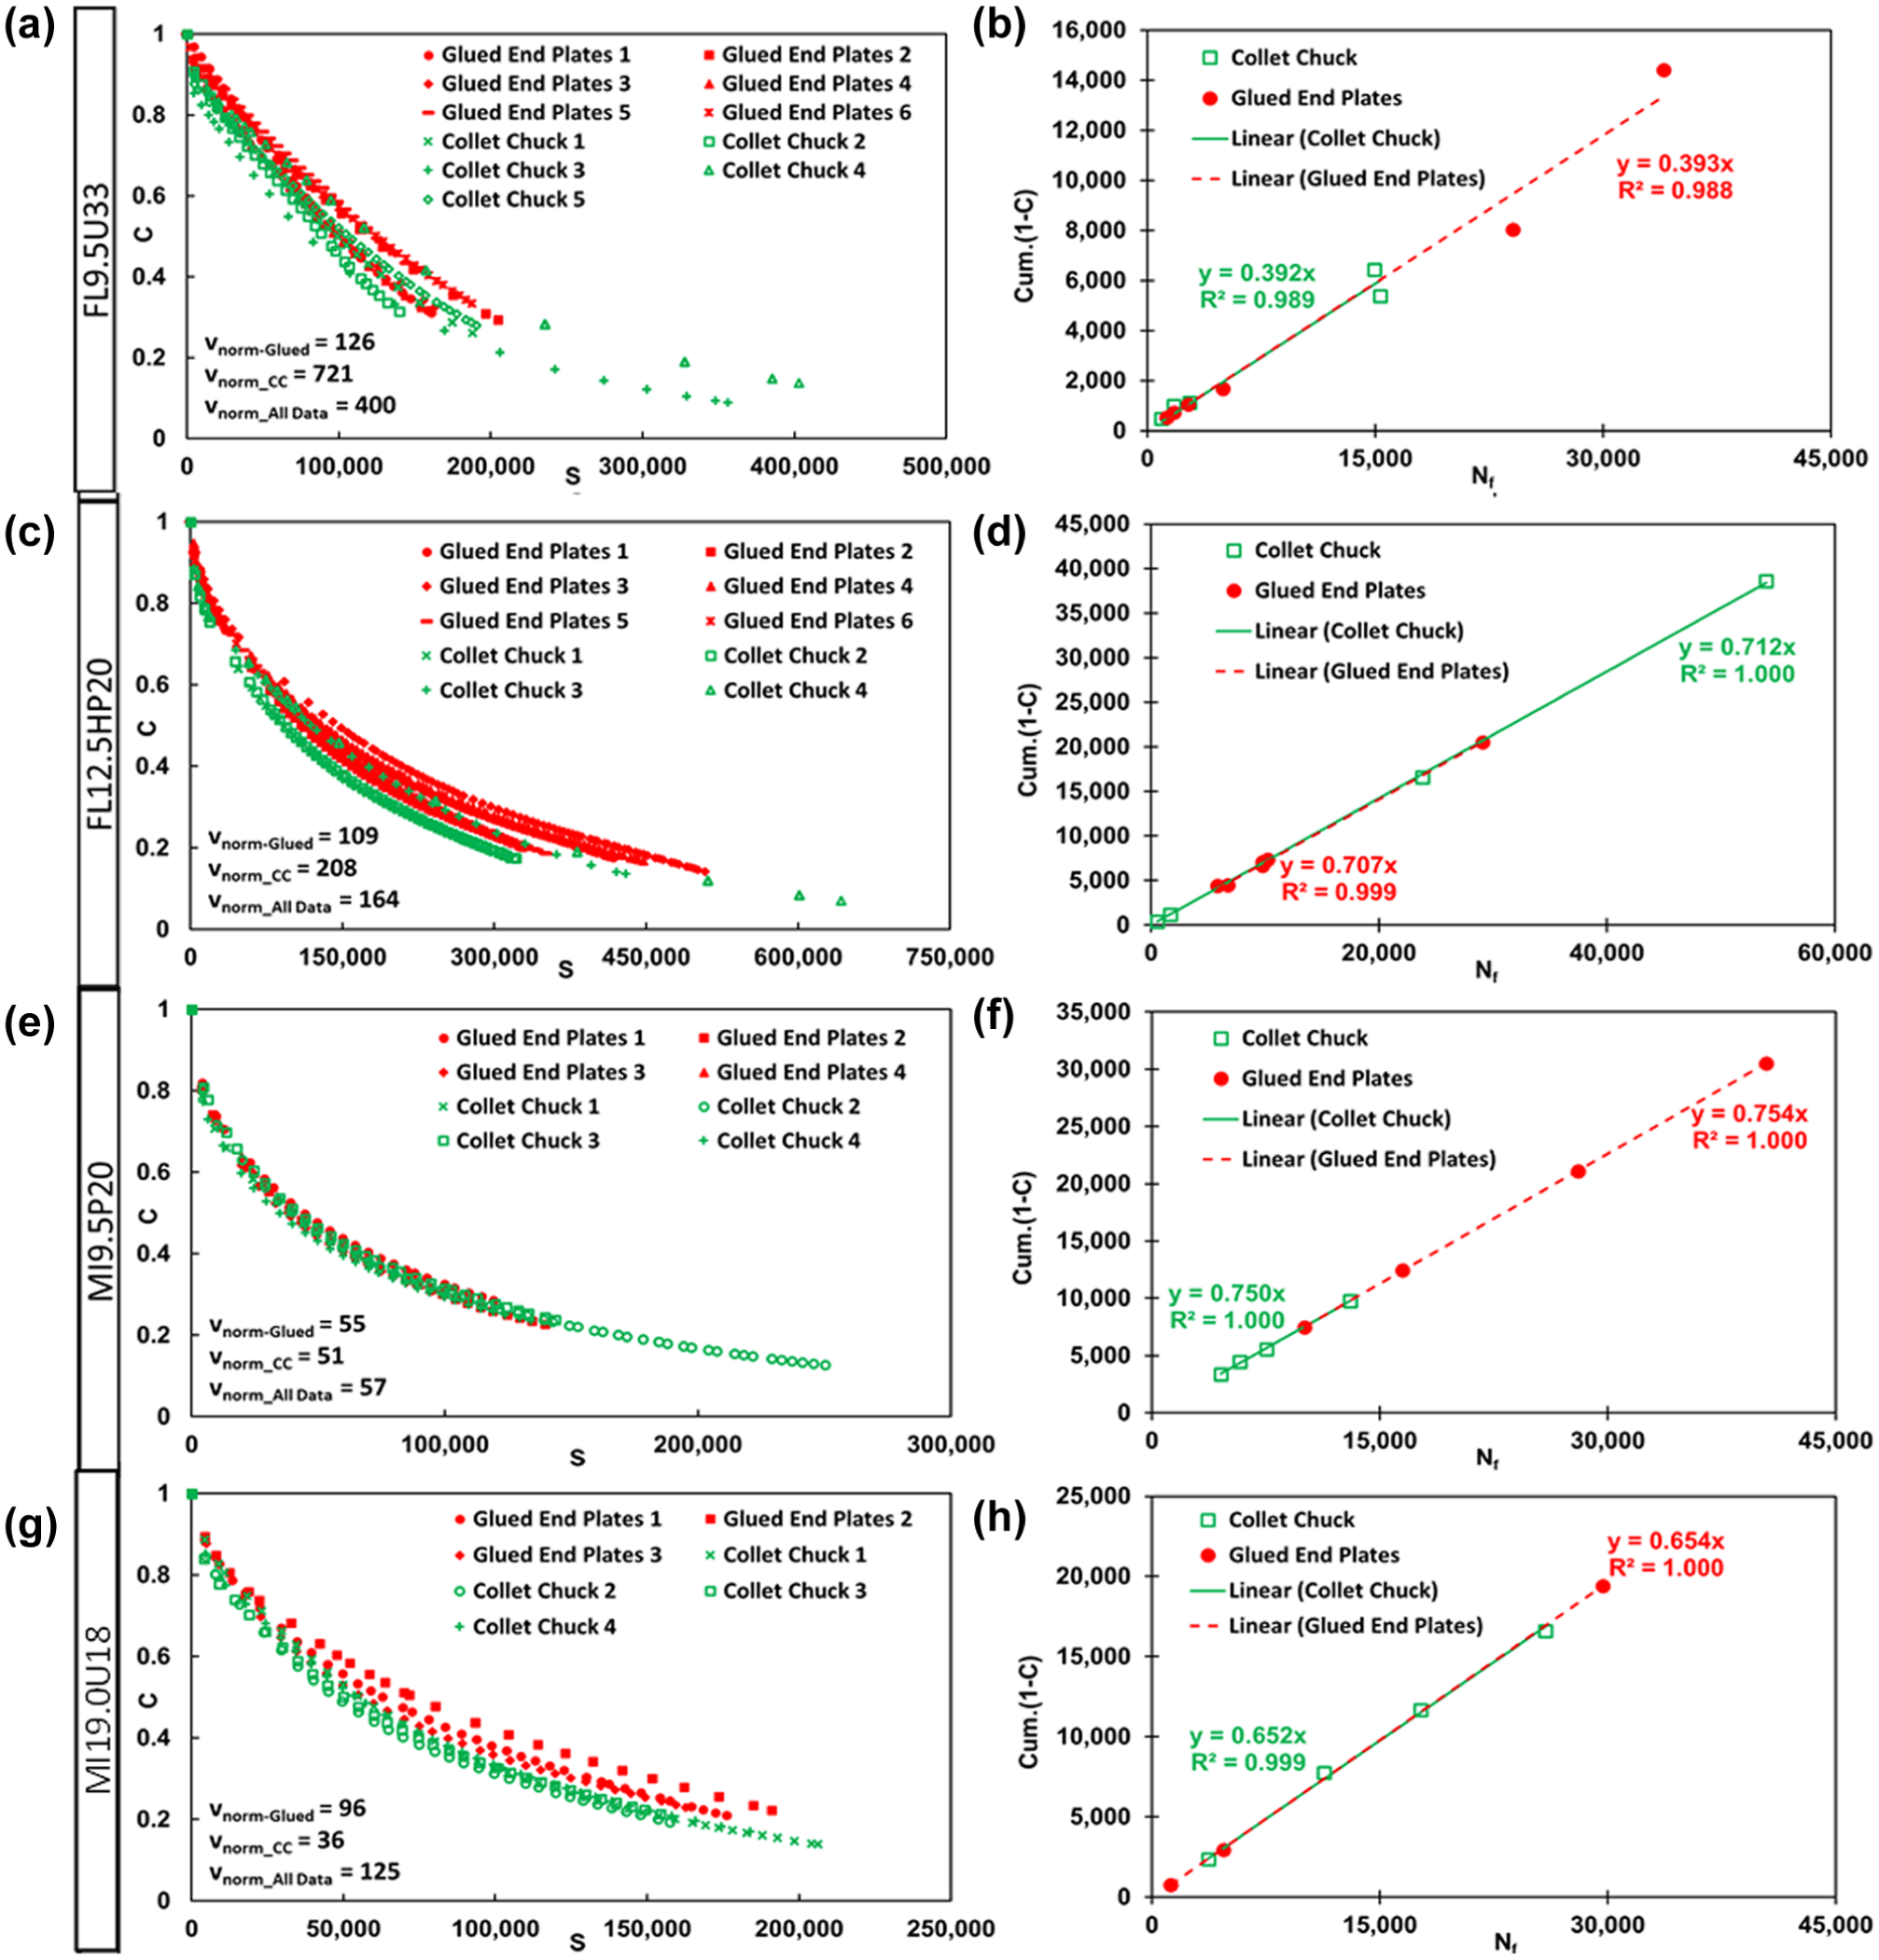
C–S curves and D R plots for: (a and b) FL9.5U33; (c and d) FL12.5HP20; (e and f) MI9.5P20; and (g and h) MI19.0U18.
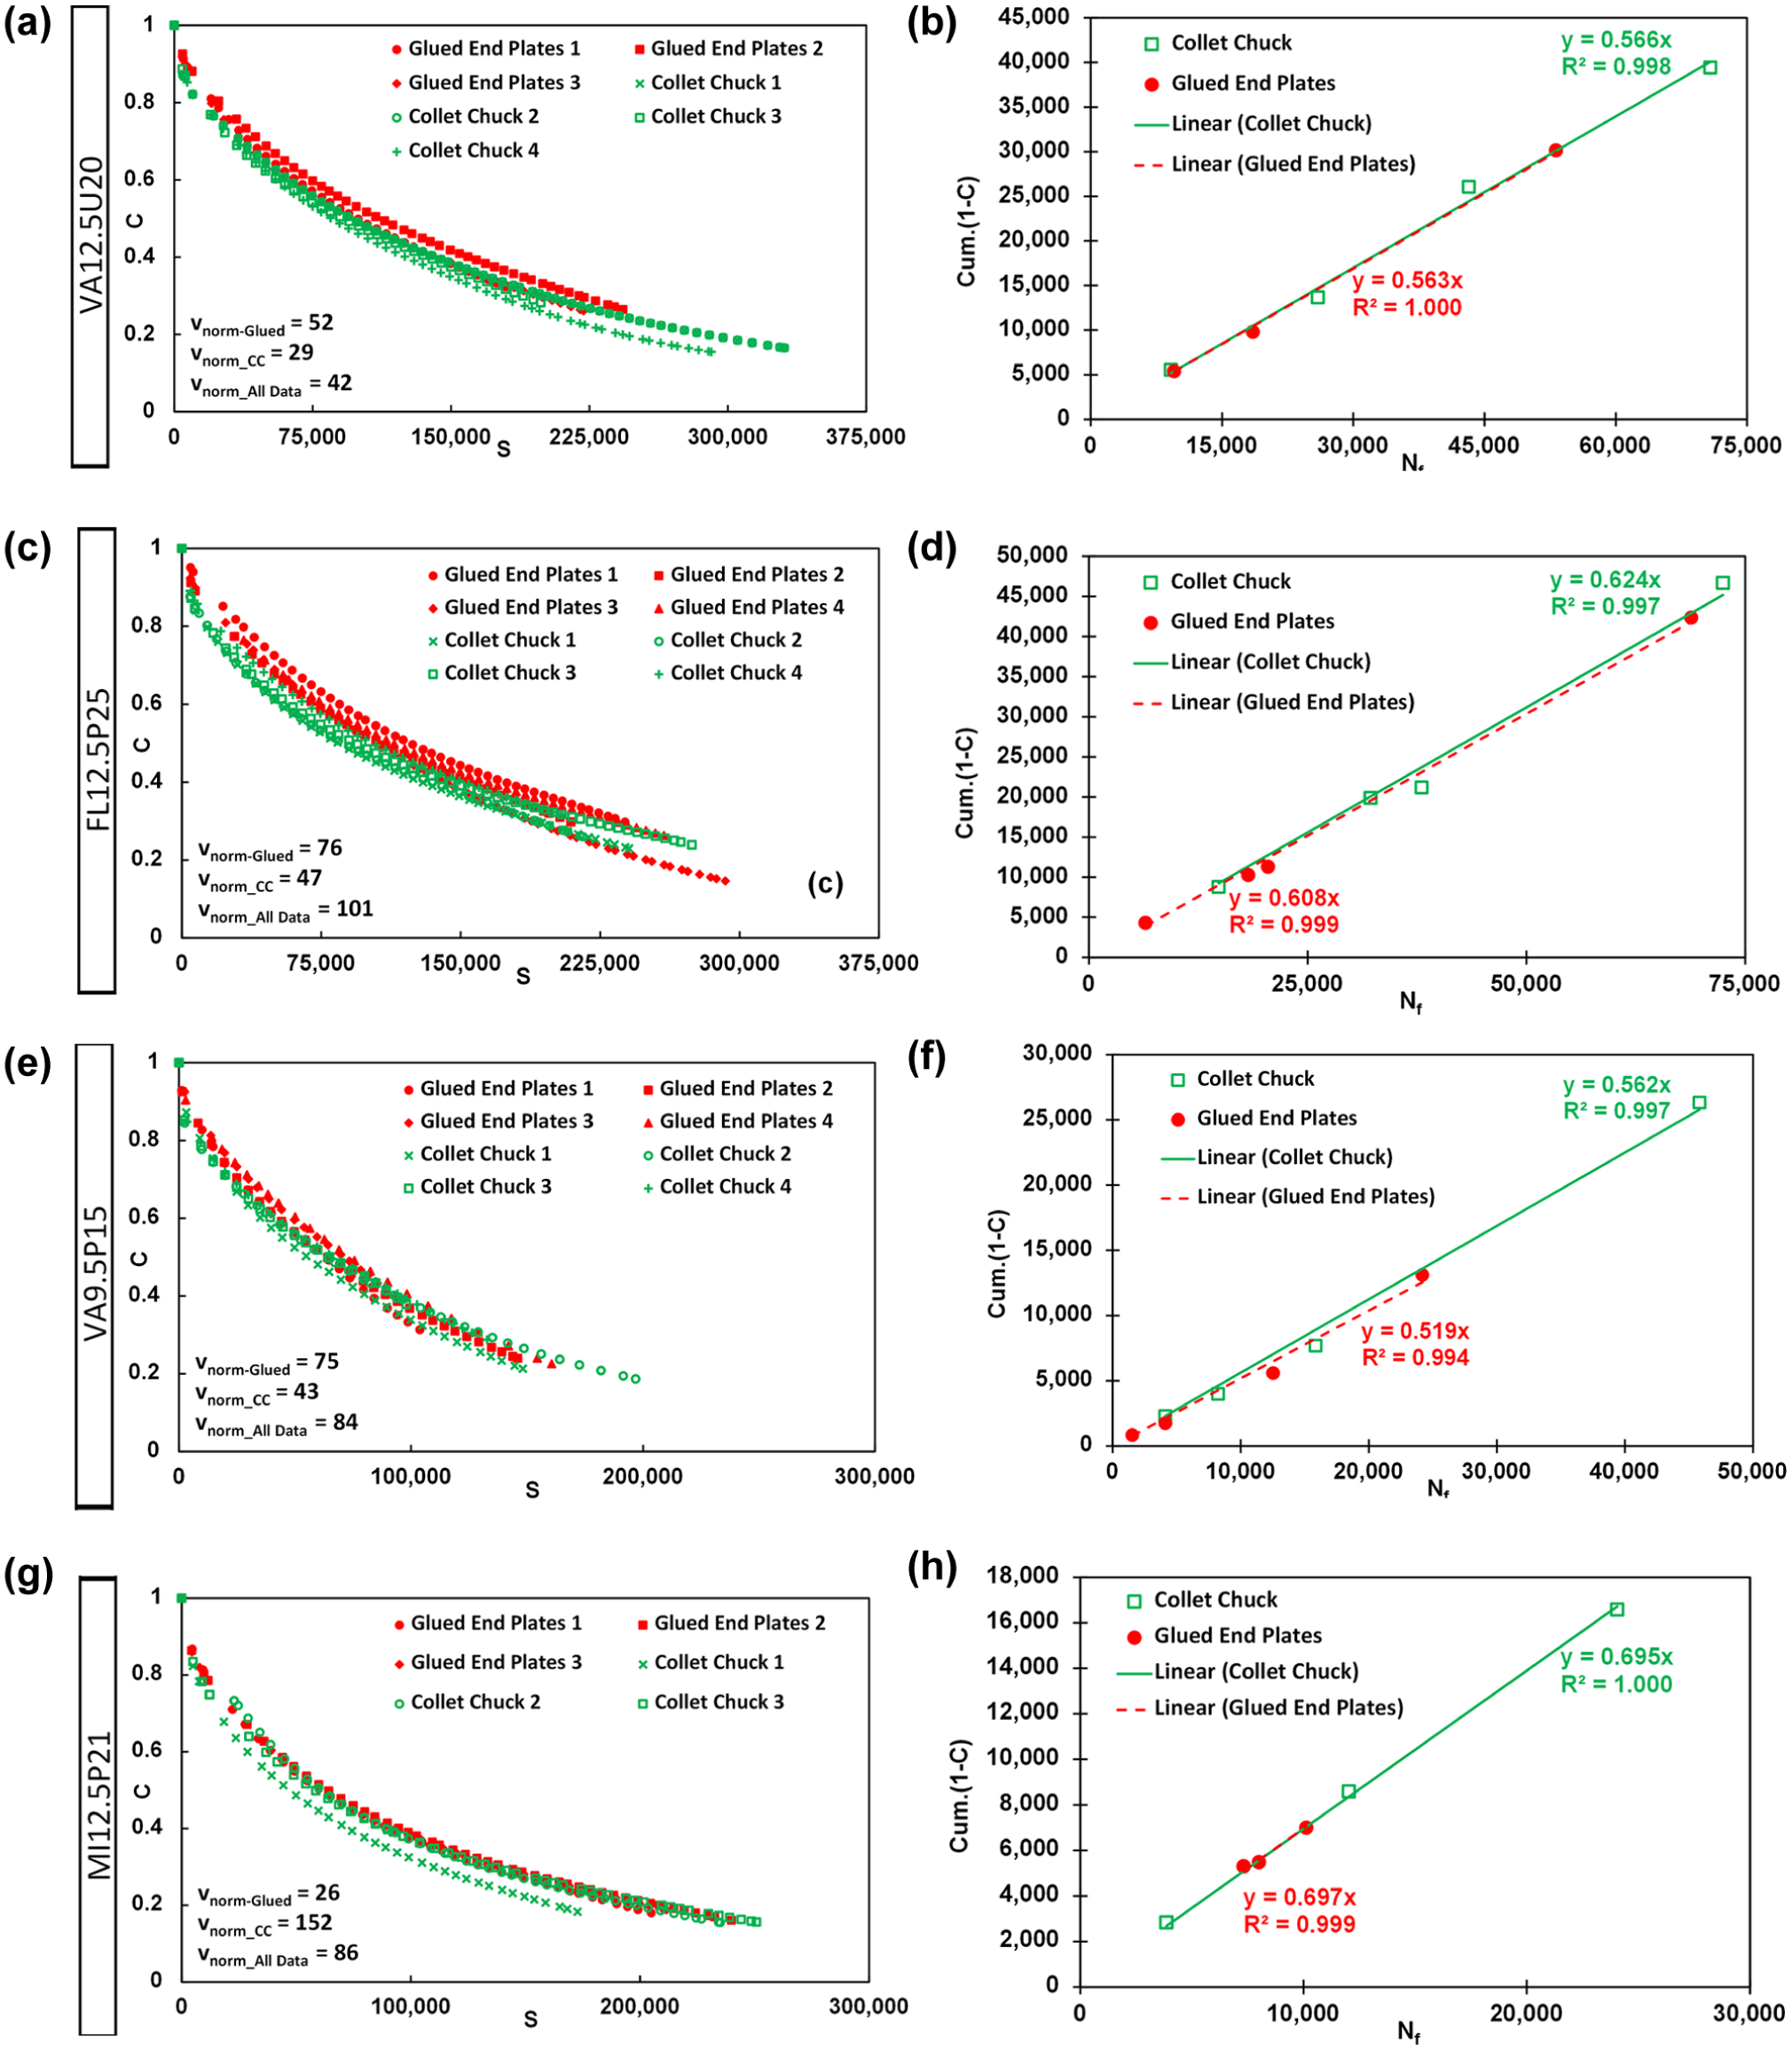
C–S curves and D R plots for: (a and b) VA12.5U20; (c and d) FL12.5P25; (e and f) VA9.5P15; and (g and h) MI12.5P21.
Figures 33 and 34 show the D R and S app values of the eight mixtures using both testing procedures. When evaluating the differences and observing the trends in D R and S app values, there is no consistent trend where the collet–chuck system yields higher or lower S app values. However, the D R values obtained using the clamping system were either similar to or higher than those of the glued end plates. This is because the clamping system yielded lower C f values because of improved efficiency in load transfer, which reflected higher D R values. The slightly higher D R values, combined with the C–S curves shifting slightly to the left (i.e., different C11 and C12 values), resulted in either higher or similar S app values as discussed earlier.
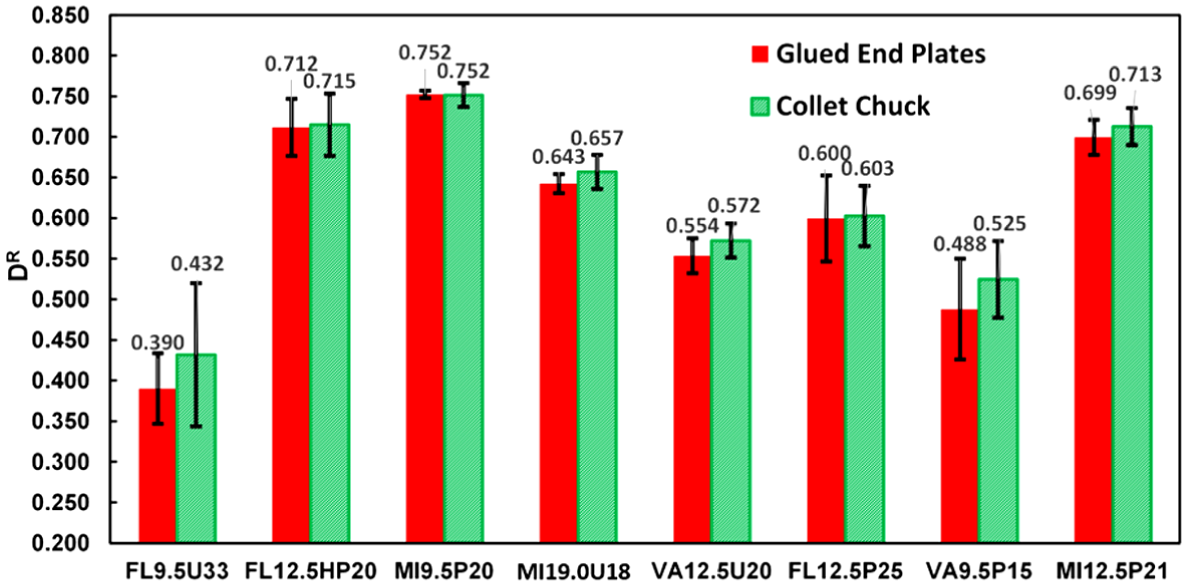
D R values for all mixtures using both systems.
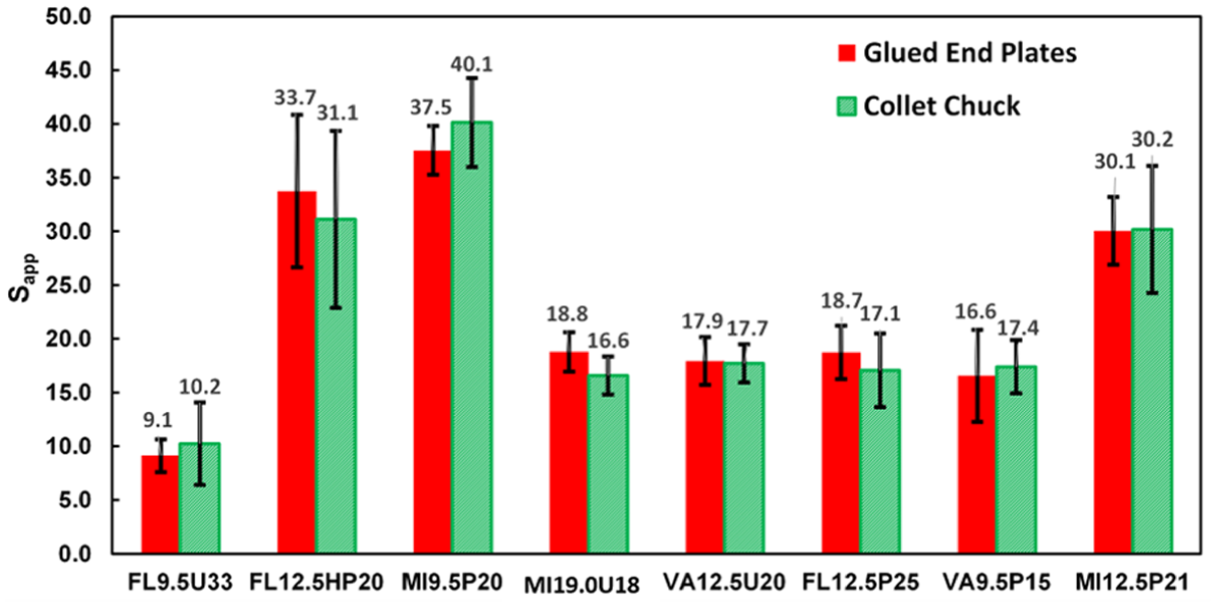
S app Values for All Mixtures Using both systems.
To quantify both S app and D R differences for all eight mixtures, a statistical analysis was conducted using a two-tailed Student’s t-test and F-test at a confidence interval of 95%. The statistical tests summarized in Table 5 illustrate that there was no statistically significant difference between the results using both testing procedures and that both testing systems (e.g., standard end plates and collet–chuck clamping systems) had a statistically equal variance.
t-test and F-test Results for S app and D R Using Both Systems
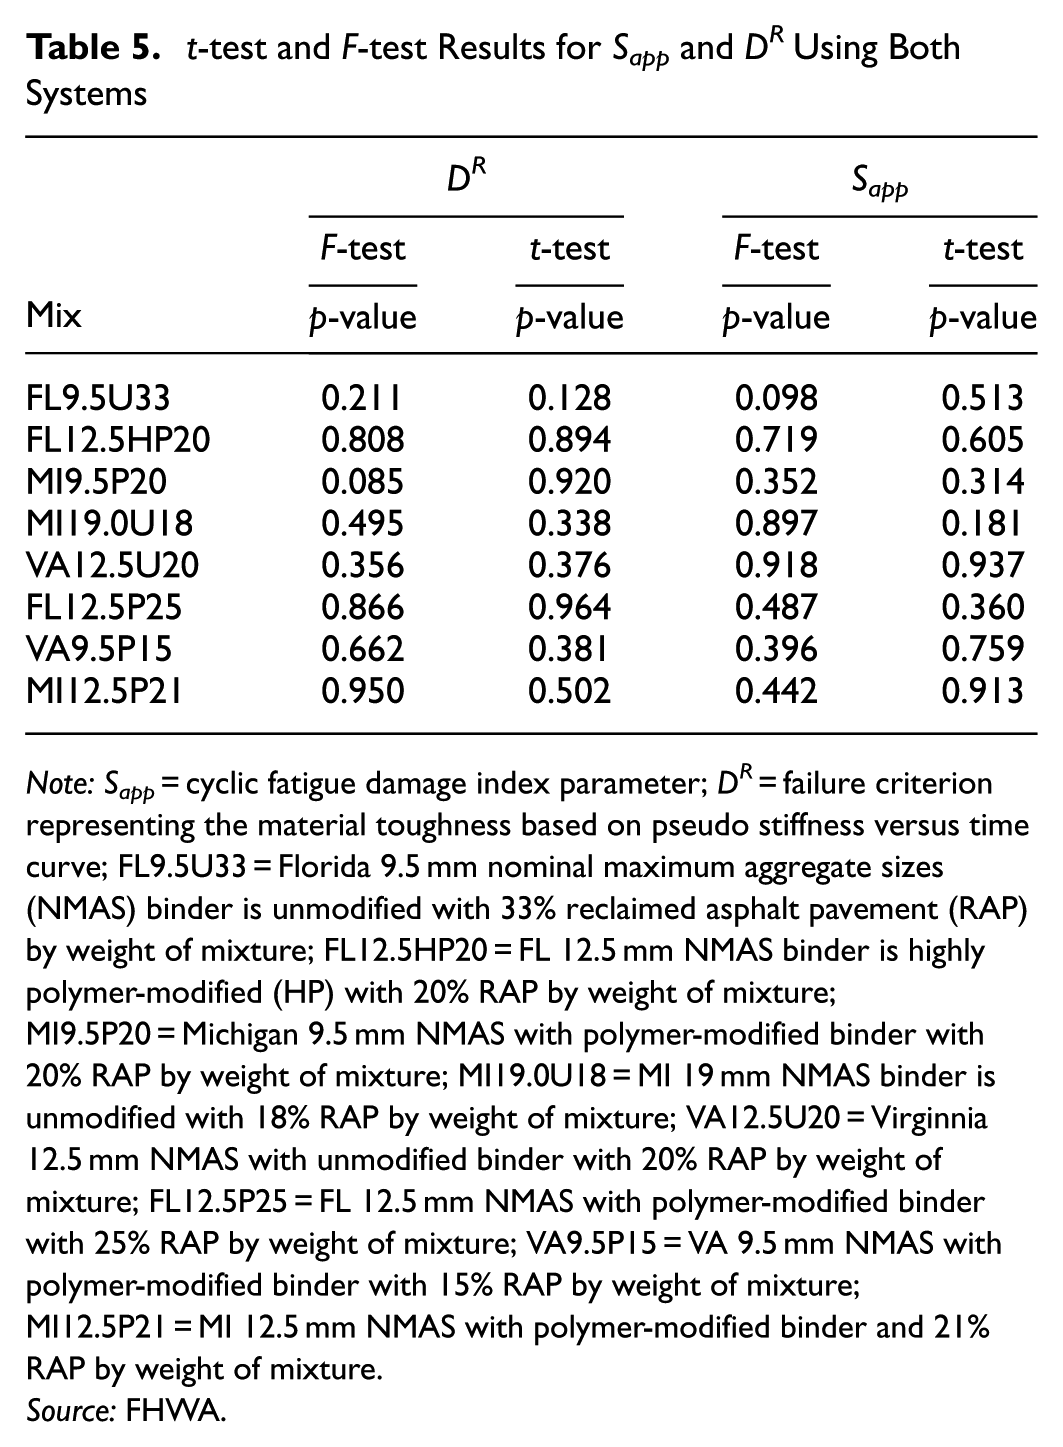
Note: S app = cyclic fatigue damage index parameter; D R = failure criterion representing the material toughness based on pseudo stiffness versus time curve; FL9.5U33 = Florida 9.5 mm nominal maximum aggregate sizes (NMAS) binder is unmodified with 33% reclaimed asphalt pavement (RAP) by weight of mixture; FL12.5HP20 = FL 12.5 mm NMAS binder is highly polymer-modified (HP) with 20% RAP by weight of mixture; MI9.5P20 = Michigan 9.5 mm NMAS with polymer-modified binder with 20% RAP by weight of mixture; MI19.0U18 = MI 19 mm NMAS binder is unmodified with 18% RAP by weight of mixture; VA12.5U20 = Virginnia 12.5 mm NMAS with unmodified binder with 20% RAP by weight of mixture; FL12.5P25 = FL 12.5 mm NMAS with polymer-modified binder with 25% RAP by weight of mixture; VA9.5P15 = VA 9.5 mm NMAS with polymer-modified binder with 15% RAP by weight of mixture; MI12.5P21 = MI 12.5 mm NMAS with polymer-modified binder and 21% RAP by weight of mixture.
Source: FHWA.
Throughout this study, close attention was paid to the fingerprinting modulus and the machine compliance for both systems because there is a difference in boundary conditions between both systems. For the fingerprinting modulus, Figure 35 shows that when using the collet–chuck clamping system, the fingerprinting modulus was higher by 13% on average because of the difference in boundary conditions. The difference in fingerprinting modulus would result in a higher dynamic modulus ratio (DMR); however, the S-VECD model uses the DMR to normalize the C–S curves to account for specimen-to-specimen variability, which explains the agreement in C–S curves between both systems even if there is a difference between the fingerprinting moduli.
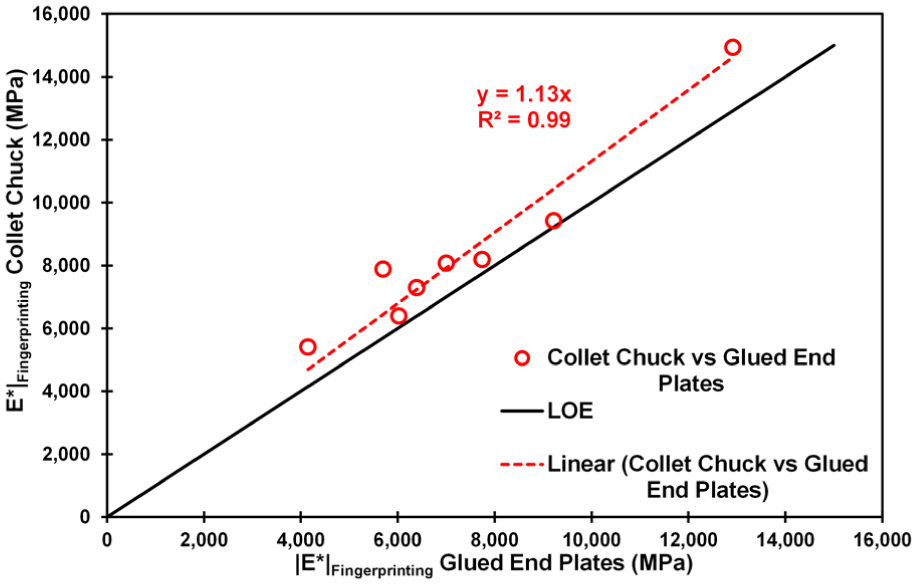
Relationship between fingerprinting modulus for both systems.LOE =Line of Equality.
In addition the collet–chuck clamping system proved to be more efficient in load transfer as the machine compliance for the clamping system was lower by 27% on average as shown in Figures 36 and 37. The consistently lower compliance values of the clamping system proved advantageous during specimen preparation because they provided an immediate indication, through the fingerprinting step, of whether the setup required adjustment, before initiating the cyclic fatigue test and risking damage to the specimen. This feature makes the clamping system more forgiving and allows practitioners to correct the setup before testing.
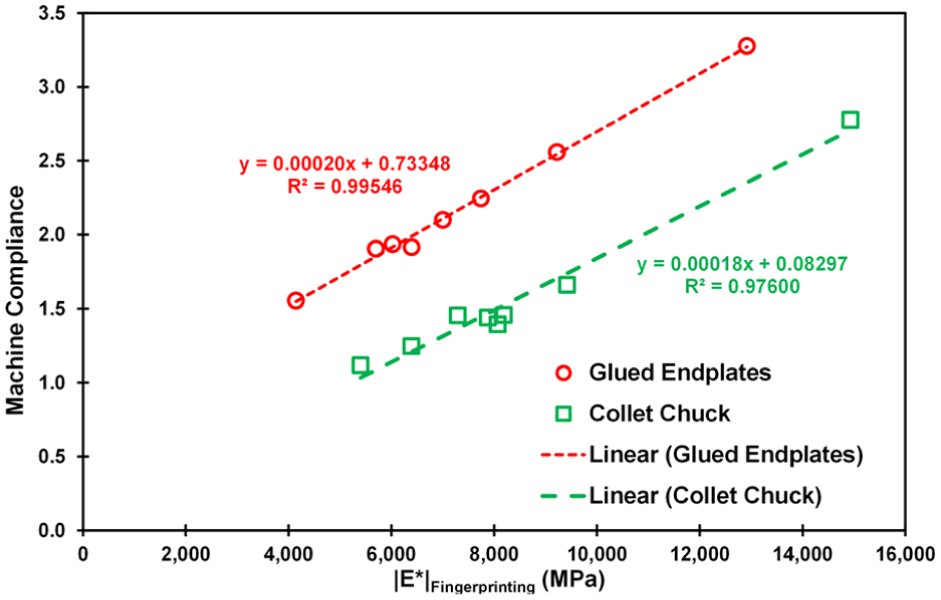
Relationship between machine compliance and fingerprinting modulus for both systems.LOE = Line of Equality.
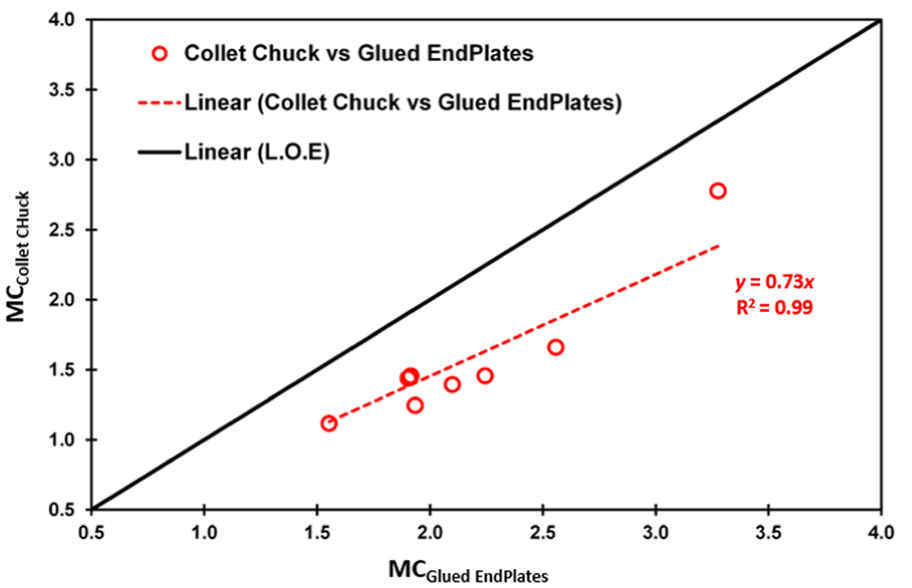
Relationship between machine compliance for both systems.Note:y = Machine compliane for the collet-chuck clamping system; x = Machine compliane for the glued endplates system; MCCollet Chuck = Machine compliane for the collet-chuck clamping system; MCGlued Endplates = Machine compliane for the collet-chuck clamping system; LOE = Line of Equality.
Recent studies have shown that retesting small-geometry dynamic modulus specimens in cyclic fatigue can reduce material consumption and specimen preparation effort ( 13 , 14 ). Building on these protocols, the proposed clamping system is designed to further enhance this efficiency by allowing dynamic modulus and cyclic fatigue tests to be conducted directly using one SGC specimen, without cutting or gluing additional samples. Therefore, the new system leverages and extends current best practices, minimizing sample preparation steps while maintaining compatibility with existing dynamic modulus and cyclic fatigue workflows.
Conclusion
This study presents an innovative approach to accelerate uniaxial cyclic fatigue testing by replacing the conventional specimen preparation procedure, which is performed through cutting the specimens precisely and gluing the specimens to the testing platens using epoxy glue. The newly developed procedure streamlines testing workflows, minimizes material waste, eliminates long epoxy curing times, and removes a significant barrier to repeatable, reliable fatigue testing of composite materials. The main findings of this study are as follows.
The collet–chuck clamping system could be used to replace the standard glued end plates procedure.
The newly developed clamping system can save time and materials without affecting testing integrity.
The clamping system results in similar C–S curves compared with the glued end plates, and in five out of eight cases resulted in more repeatable C–S curves.
Similar to the C–S curves, the D R and S app values generated using the clamping system did not show any statistically significant difference compared with the glued end plates and the F-test demonstrated that both systems have equal variance.
The clamping system was more efficient in transferring loads when comparing machine compliance results.
The difference in boundary conditions between both systems had an effect, which was observed in the difference in fingerprinting moduli of both systems; however, the normalization used in the S-VECD model negated these effects, and the resultant C–S curves were comparable.
Limitations
This study showed that the collet–chuck clamping system can produce fatigue test results comparable to those obtained with standard glued endplates; however, end failures were still observed in some mixtures at the collet–specimen interface. These failures are attributed to the combined effect of overtightening and end–surface irregularities, consistent with the stress concentrations identified in the FE analysis. Although eliminating the cutting step, which can introduce loading eccentricity and end failure, is an advantage of the clamping system, the results indicate that the clamping system is more sensitive to surface irregularities created during coring. In line with standard practice for glued endplates, metal shims were used to correct end irregularities and reduce loading eccentricity, and the same shimming procedure was applied when using the collet–chuck system to mitigate the loading eccentricity.
Future Work
Further research is needed to refine the clamping system and address observed limitations in specimen preparation and performance.
The interlayer between the specimen and the clamping system could be optimized to eliminate the need for any type of gluing.
The torque required tightening of the clamping system to be investigated in case of soft and stiff binders.
Although both testing procedures produce consistent results, pavement design analysis using data from both methods should be carried out before the clamping system results are adopted for design purposes.
Footnotes
Acknowledgements
The authors would like to thank Mr. Justin Pogge, Mr. Jeremy Phillips, and Mr. Tom Slade of Florida A&M University-Florida State University College of Engineering (FAMU-FSU) College of Engineering Machine Shop for fabricating and machining all the parts needed for this study. The authors would also like to acknowledge Dr. Matthew Corrigan, Dr. David Mensching, and Dr. Richard Duval, members of the FHWA technical panel for the Small Business Innovation Research (SBIR) project, for their technical support.
Author Contributions
The authors confirm contribution to the paper as follows: study conception and design: Elwardany, Kutay, Custer; data collection: Hassanien; analysis and interpretation of results: Hassanien, Elwardany, Kutay, Vaddy, Custer; draft manuscript preparation: Hassanien, Elwardany, Kutay, Vaddy, Custer. All authors reviewed the results and approved the final version of the manuscript.
Declaration of Conflicting Interests
The authors declared the following potential conflicts of interest with respect to the research, authorship, and/or publication of this article: Michael D. Elwardany is a member of the Transportation Research Record’s Editorial Board. All other authors declared no potential conflicts of interest with respect to the research, authorship, and/or publication of this article.
Funding
The authors disclosed receipt of the following financial support for the research, authorship, and/or publication of this article: This research was funded through the U.S. DOT SBIR program and the FHWA under contract 6913G623C100001.
