
Abstract
This article uses the population census of 1863 in order to compare relations between household size and household structure (according to Cambridge group typology), on one side, and the amount of household property per capita and household monthly income per capita, on the other. In terms of household size, a clear bimodal curve is visible in case of both: a steady decline to household size of five to seven members and undisturbed increase after that level up to eleven members. In terms of household structure, the amount of household property per capita generally declines from smaller to larger household structure, but the household monthly income per capita is similar among household classes. The old-age security strategy of peasants is the main driving force behind the paradox that majority of households are located within the poorest composition. Throughout his or her lifetime, an individual passes through several classes, and with the passage of time his or her well-being changes.
Keywords
Introduction
The formation, organization, and the way of functioning of families living in Serbia have attracted domestic and especially foreign professionals who studied various aspects of everyday’s life of the population in Serbia in the past. It was mainly due to various facts: high-quality medieval population records and property of monasteries, 1 high fertility rate in the nineteenth century, 2 distinctive nuptiality patterns, 3 strategies of family formation, 4 frequency of zadruga households,5,6 the difference in longevity of formal and family zadruga’s, 7 as well as settlements and population of the region of Brankovic in 1455. 8
Although the first census in Serbia principality was conducted in 1834, the 1863 census is considered as being the first modern one, at that time Serbia was still squeezed between two empires: the advancing Austrian and the withdrawing Ottoman. During the 1863 census, the studied area at the north of central Serbia consisted of the town of Smederevo and twenty-six surrounding villages (Figure 1). The population of 15,284 lived in 2,835 households making 79.6 percent of the total population in the municipality at that time. The average rural population was 588 in 109 households, with the average household size of 5.4 members. The census was comprehensive and thorough for the fact that not only the household listings, containing the household members age, kinship relations with the householder, but also the data on household property were collected.9,10
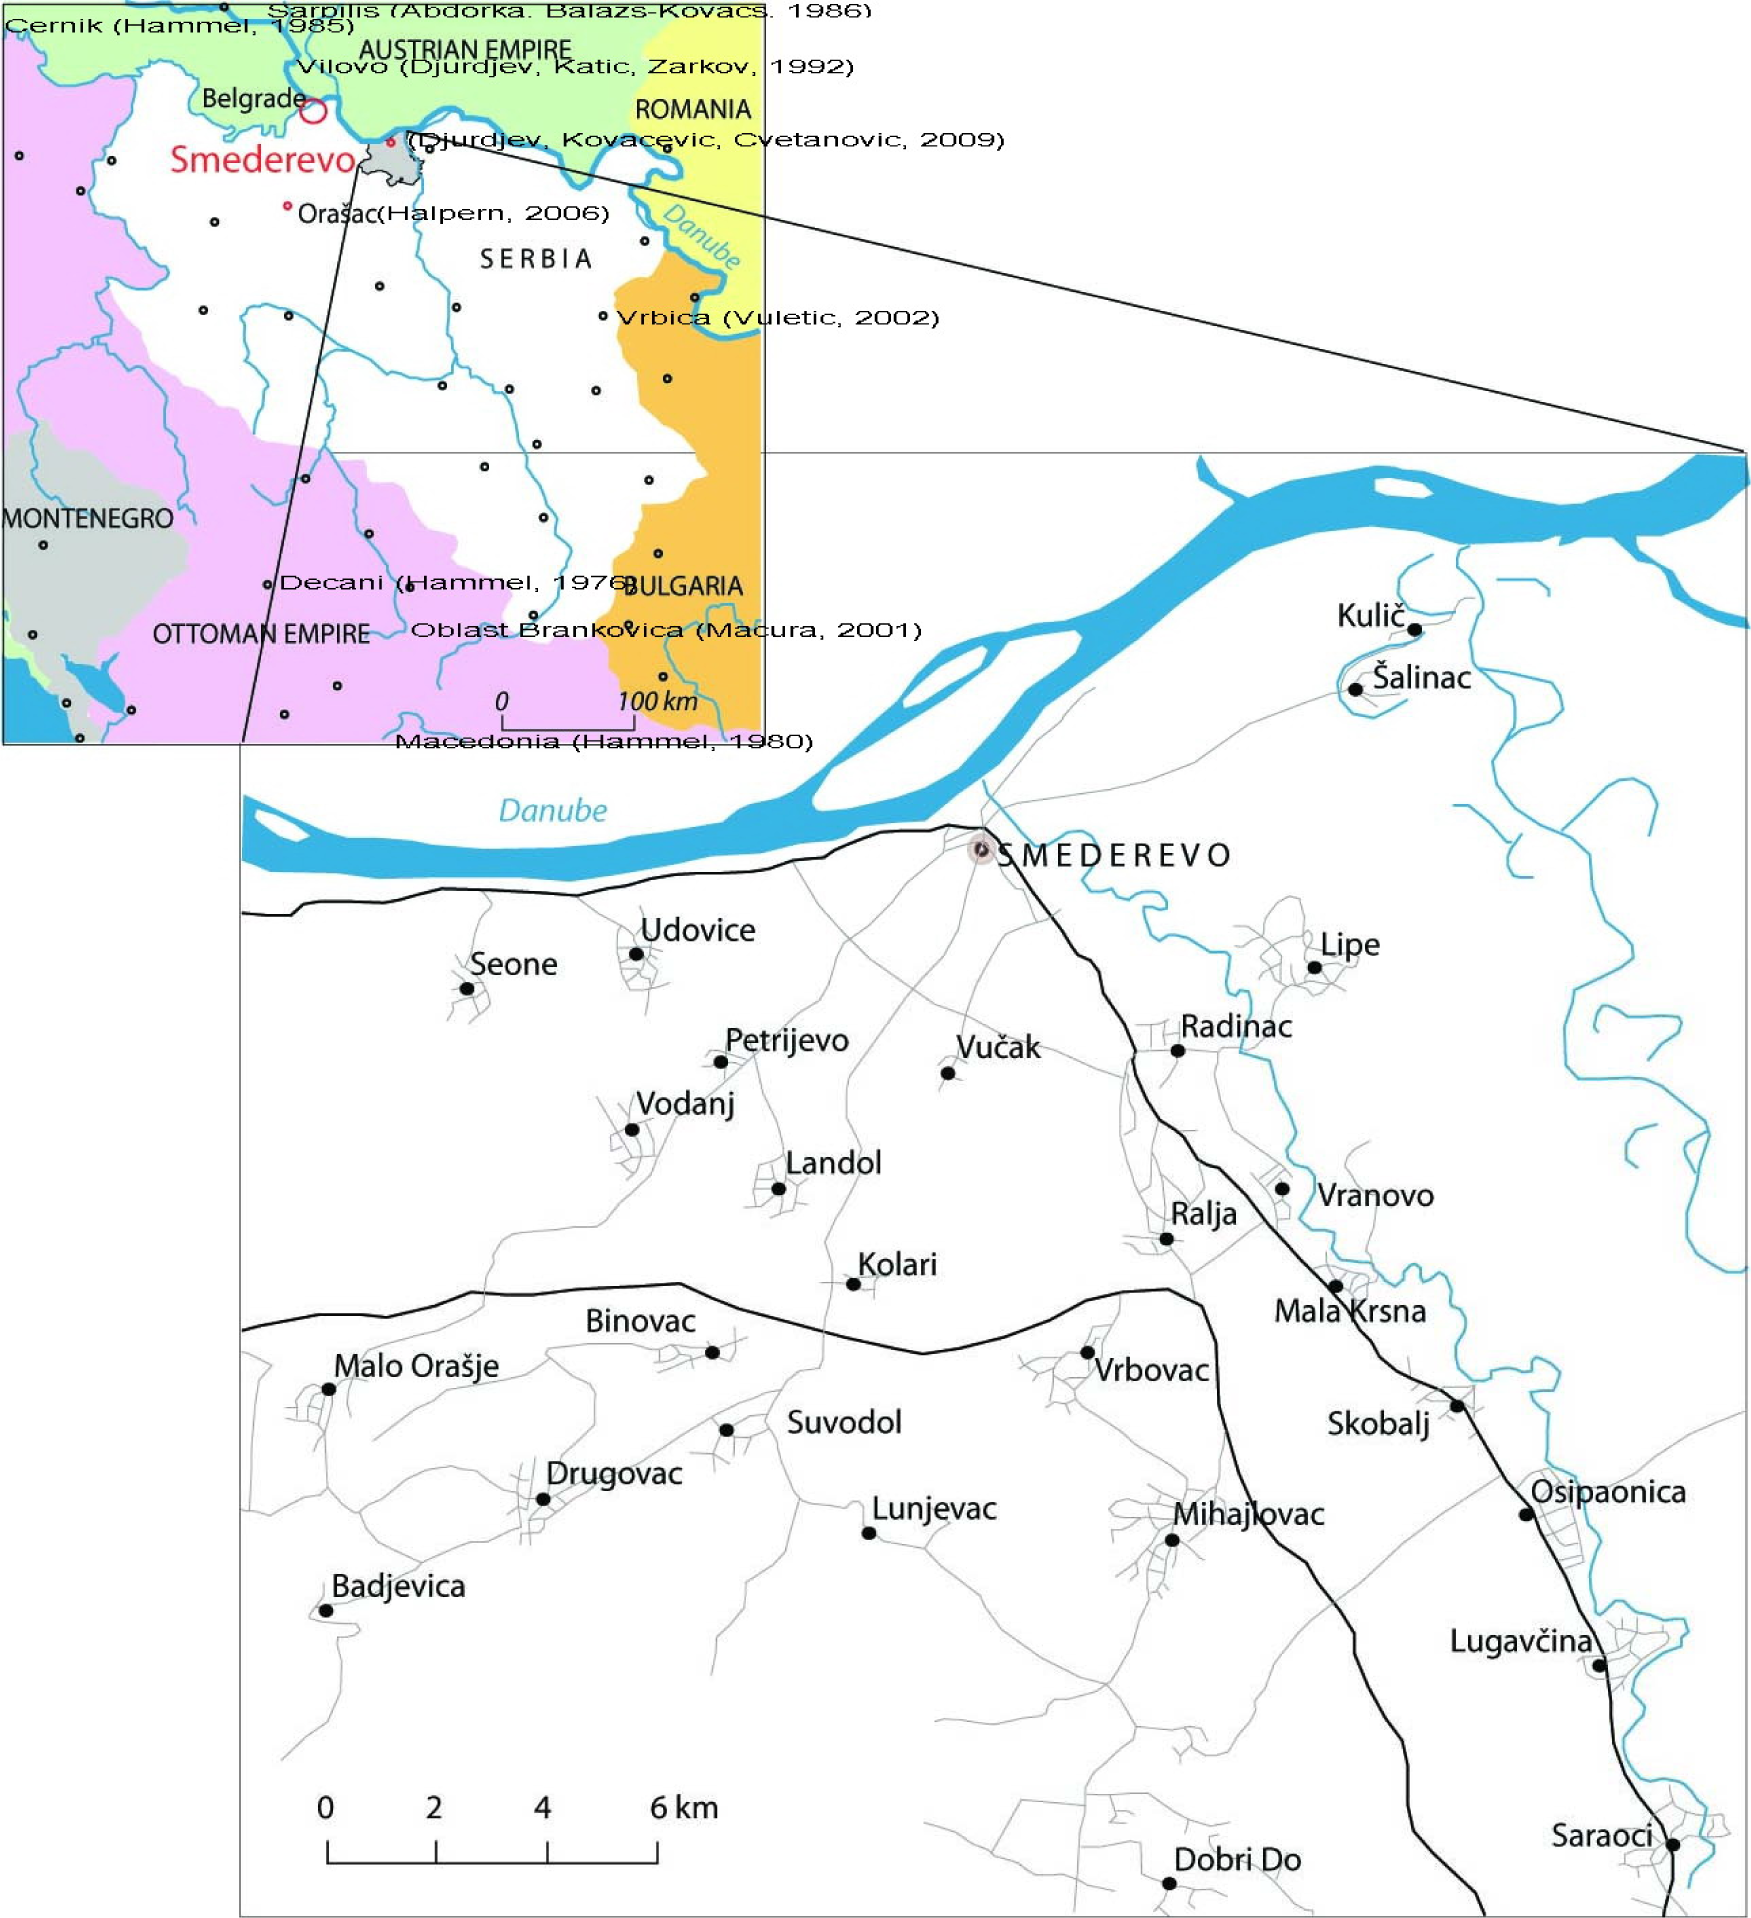
Location of Smederevo municipality in Serbia principality 1863 (with household history research sites).
The data on property status were acquired through estimation of the value of the following: the house and the yard, arable land, meadows, and vineyards. Frequently, the orchards (plum orchards) were also taken into account. The property value was calculated in two forms: as the total household property in ducats (old gold coins) and as monthly income of the households in talirs (old silver coins).
This article uses these census data as a unique opportunity to compare relations between household size and household structure (according to Cambridge group typology), on one hand, and the amount of household property per capita and household monthly income per capita, on the other hand, in villages of Smederevo municipality in Serbia principality in 1863.
Household Size and Well-Being
According to the 1863 census, the four- to six-person households were the most dominant, reaching the total of over 400 in each group with prevailing five-person households. The occurrence frequency of three-person households was recorded in 300–400 cases. In 200–300 cases, the two-, seven-, and eight-person households were recorded. The occurrence frequency of 100–200 was recorded for one- and nine-person households. The range of occurrence of 50–100 was recorded for ten- and eleven-person households, whereas the range of occurrence 10–50 was recorded for twelve-person up to fifteen-person households. The occurrence of 16 and more person households ranged from 0 to 5, whereas the nineteen-person households were not recorded. We may draw the conclusion that 99.5 percent of the households were up to fifteen-person households, whereas the total number of larger size households was 13 and they are considered as an exception (Figure 2).
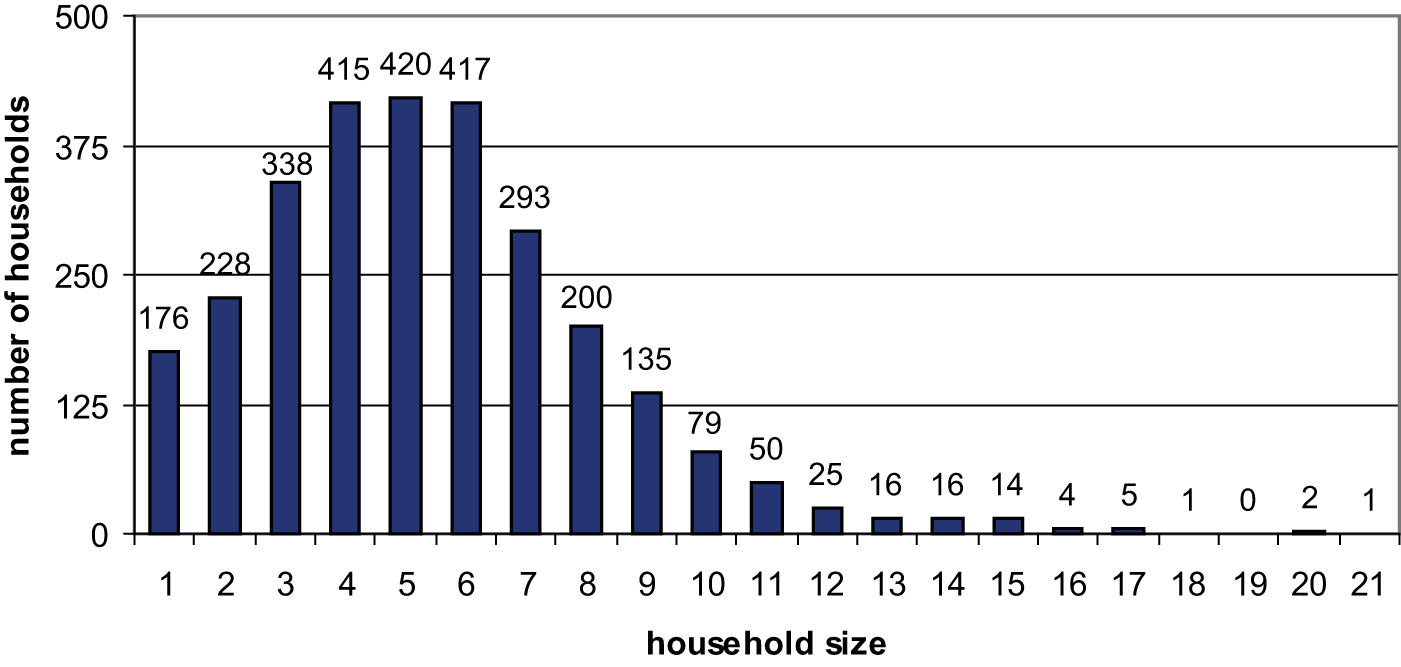
Number of households according to household size.
The majority of the population lived in six-person households, making the total of 2,502. The total of more than 2,000 persons was also recorded in five- and seven-person households. The three-, eight-, and nine-person households made the total of between 1,000 and 2,000. The two-, ten-, and eleven-person households made the total ranging from 450 to 1,000. The total of only 176–300 lived in single households and twelve- to fifteen-person households. Less than 100 (the total of 228) lived in sixteen-plus-person households (Figure 3).
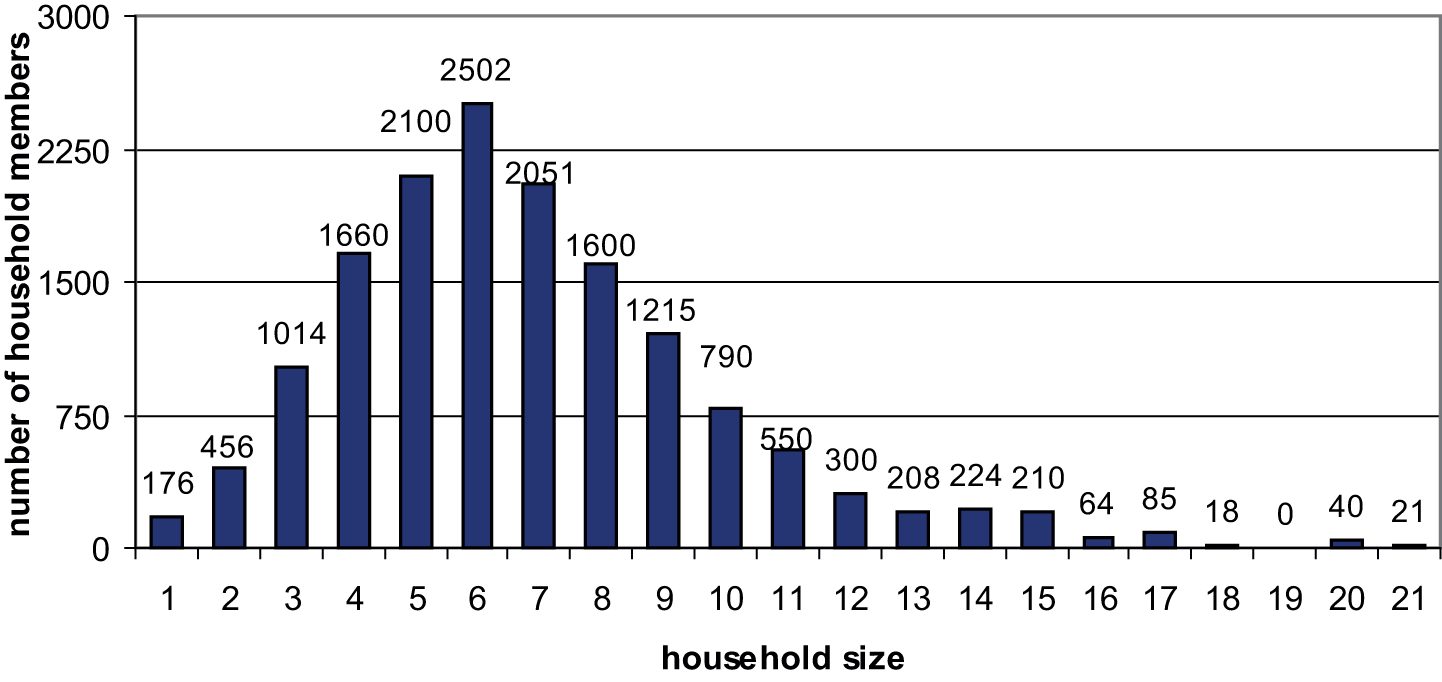
Number of household members according to household size.
Total property of all rural households was 569,369 ducats. According to the number of household members, the six-person households possessed the largest property (85,938 ducats), with average property per a household of 200.8 ducats and average property per capita of 37.2 ducats. The total property larger than 60,000 ducats was in the possession of four-, five-, and seven-person households. The property amount ranging from 40,000 to 60,000 ducats was in the possession of three-, eight-, and nine-person households. The property amounts between 20,000 and 40,000 ducats were in possession of two-, ten-, and eleven-person households, whereas the property between 10,000 and 20,000 ducats was in the possession of single households and twelve- and fourteen-person households.
The total amount of monthly income in villages around Smederevo was 23,828 talirs; with the average amount per a household 8.4 talirs and average amount per capita 1.6 talirs. The total monthly income of over 2,000 talirs was recorded for households with between four and nine members (the largest amount of 3,309 talirs for six-person households). The total monthly income of between 1,000 and 2,000 talirs was recorded for three-, ten-, and eleven-person households, whereas one-, two-, and twelve- to fifteen-person households had the total monthly income between 300 and 1,000 talirs. The income of larger households had minor significance.
The average household property was 200.8 ducats, which increased with the household size increase. According to Figure 4, the proportion of such increase is visible up to the household size of twelve members. For households with more then twelve persons, fluctuations are visible with the increase in average property. Minimum was recorded for single households (72 ducats) and maximum for eighteen-person households (982 ducats; Figure 4).
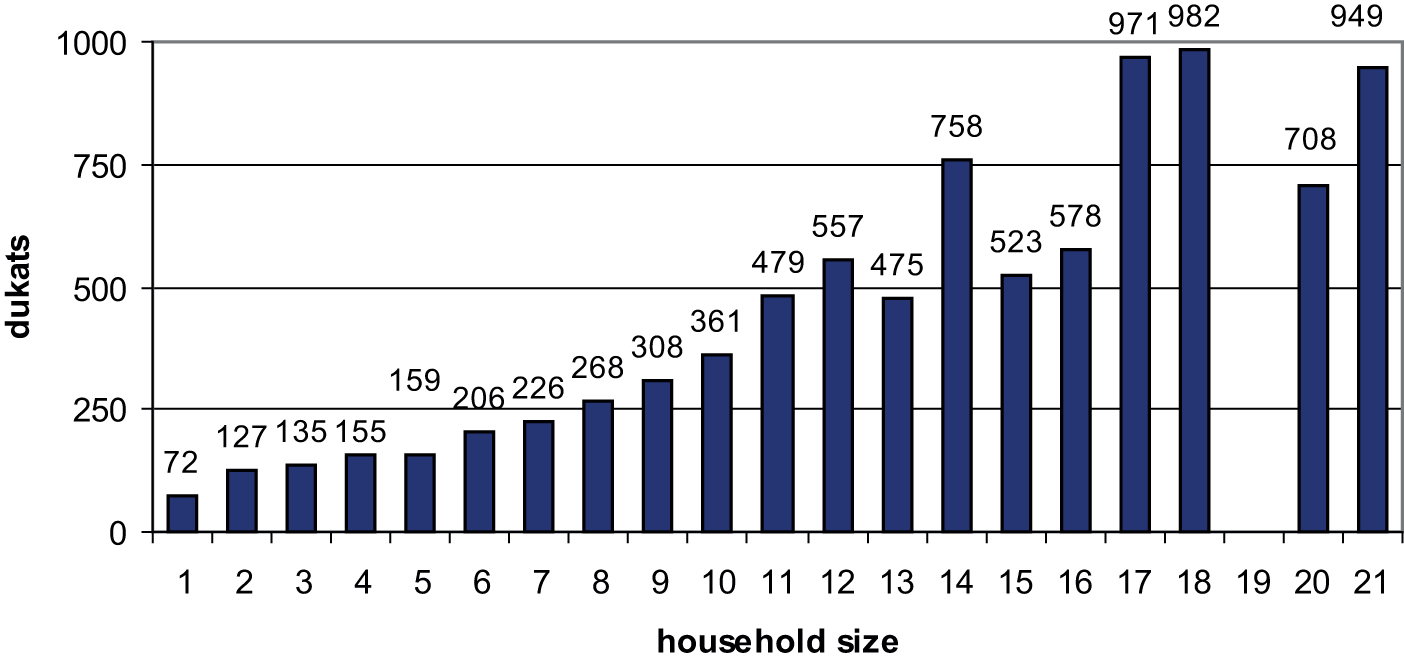
Average household property (in ducats) according to household size.
The average monthly income of a rural household reached the amount of 8.4 talirs, which increased proportionally to the increase in household size. The increase trend for the studied area was perceptible up to the household size of eleven members. With twelve-person households, the regularity is less obvious, although the income is higher than average. Minimum was recorded for one-person households (2.7 talirs) and maximum for twenty-person households (47 talirs; Figure 5).
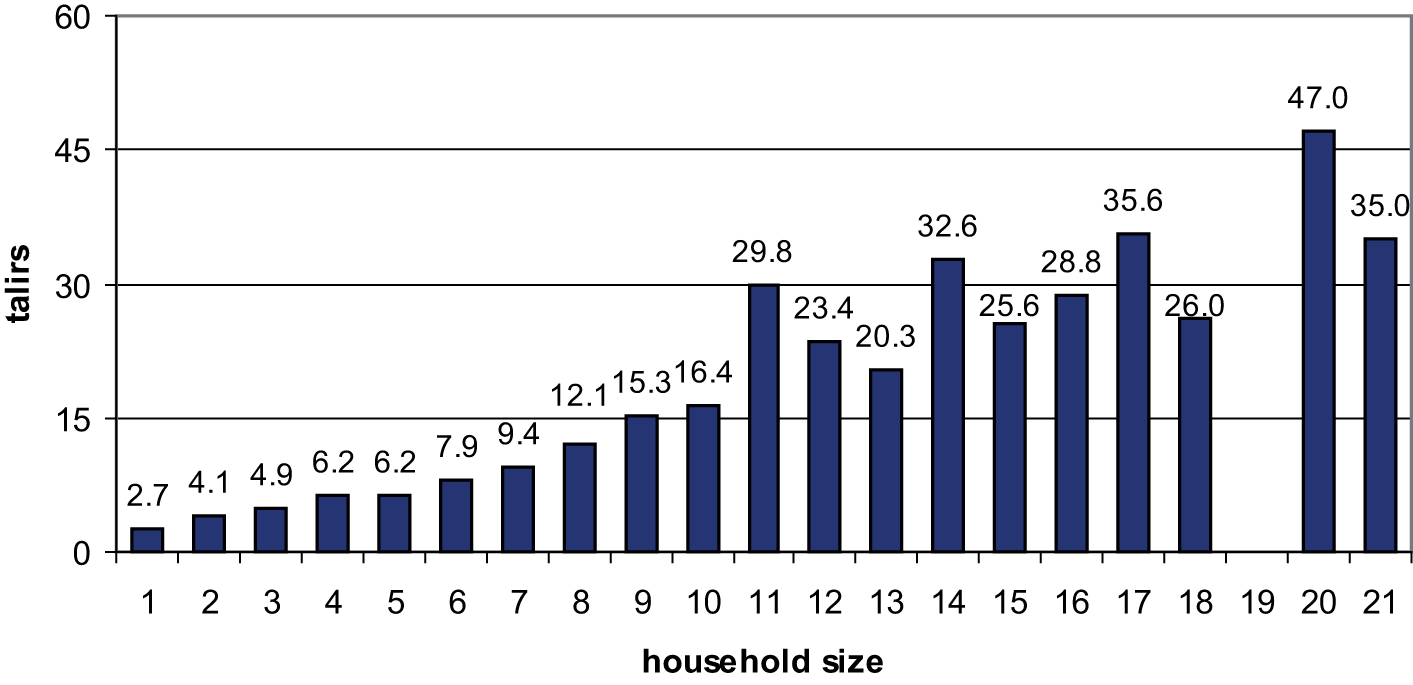
Average household monthly income (in talirs) according to household size.
The average household property per capita was 37.2 ducats. It was noticeable for up to five-person households that parallel to the increase in size, the property per capita decreased. Then property slowly increased up to twelve-person households. Minimum was recorded for five-person households (31.7 ducats) and maximum for one-person households (71.9 ducats; Figure 6).
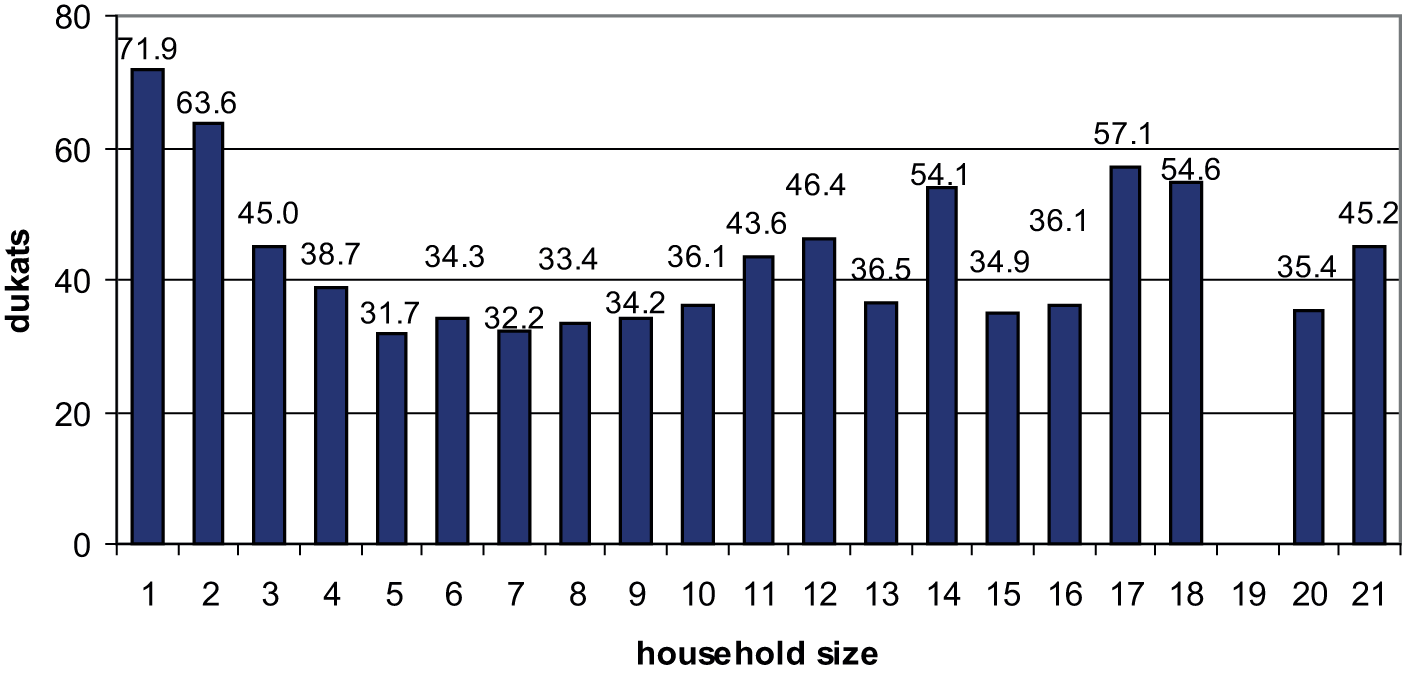
Household property per capita (in ducats) according to household size.
With the monthly income per capita, which amounted on average 1.6 talirs per capita, the steady decline is perceivable up to the five-person households. The eleven-person households showed abrupt convergence, but with twelve-person households clear degree of regularity was not perceived. The income ranged from 1.4 to 2.4 talirs per capita. It may be concluded that monthly income recorded a small range for all household sizes from 1.2 talirs (five-person households) to 2.7 talirs (one-person households and eleven-person households; Figure 7).
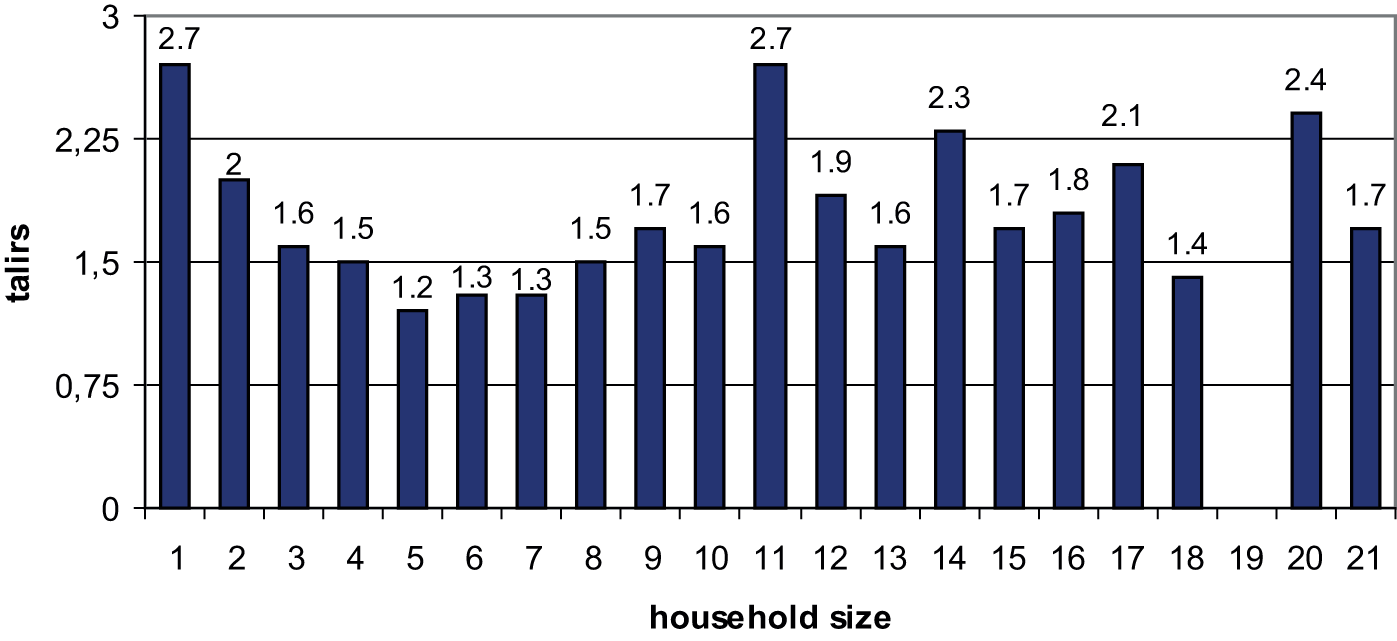
Household monthly income per capita (in talirs) according to household size.
When the pure household size is in question, we see clear bimodal curve in case of both, household property and household monthly income per capita: steady decline until household size of five to seven members and undisturbed increase after that level up to eleven members. After that size, we see slight fluctuations but at high level.
Household Structure and Well-Being
Our analysis of household structure employs Cambridge group typology developed by Hammel and Laslett 11 (Table 1). We will be referring mainly to categories from 2 to 5 because these categories are more stable than category of solitaries.
Classificatory Household Structure
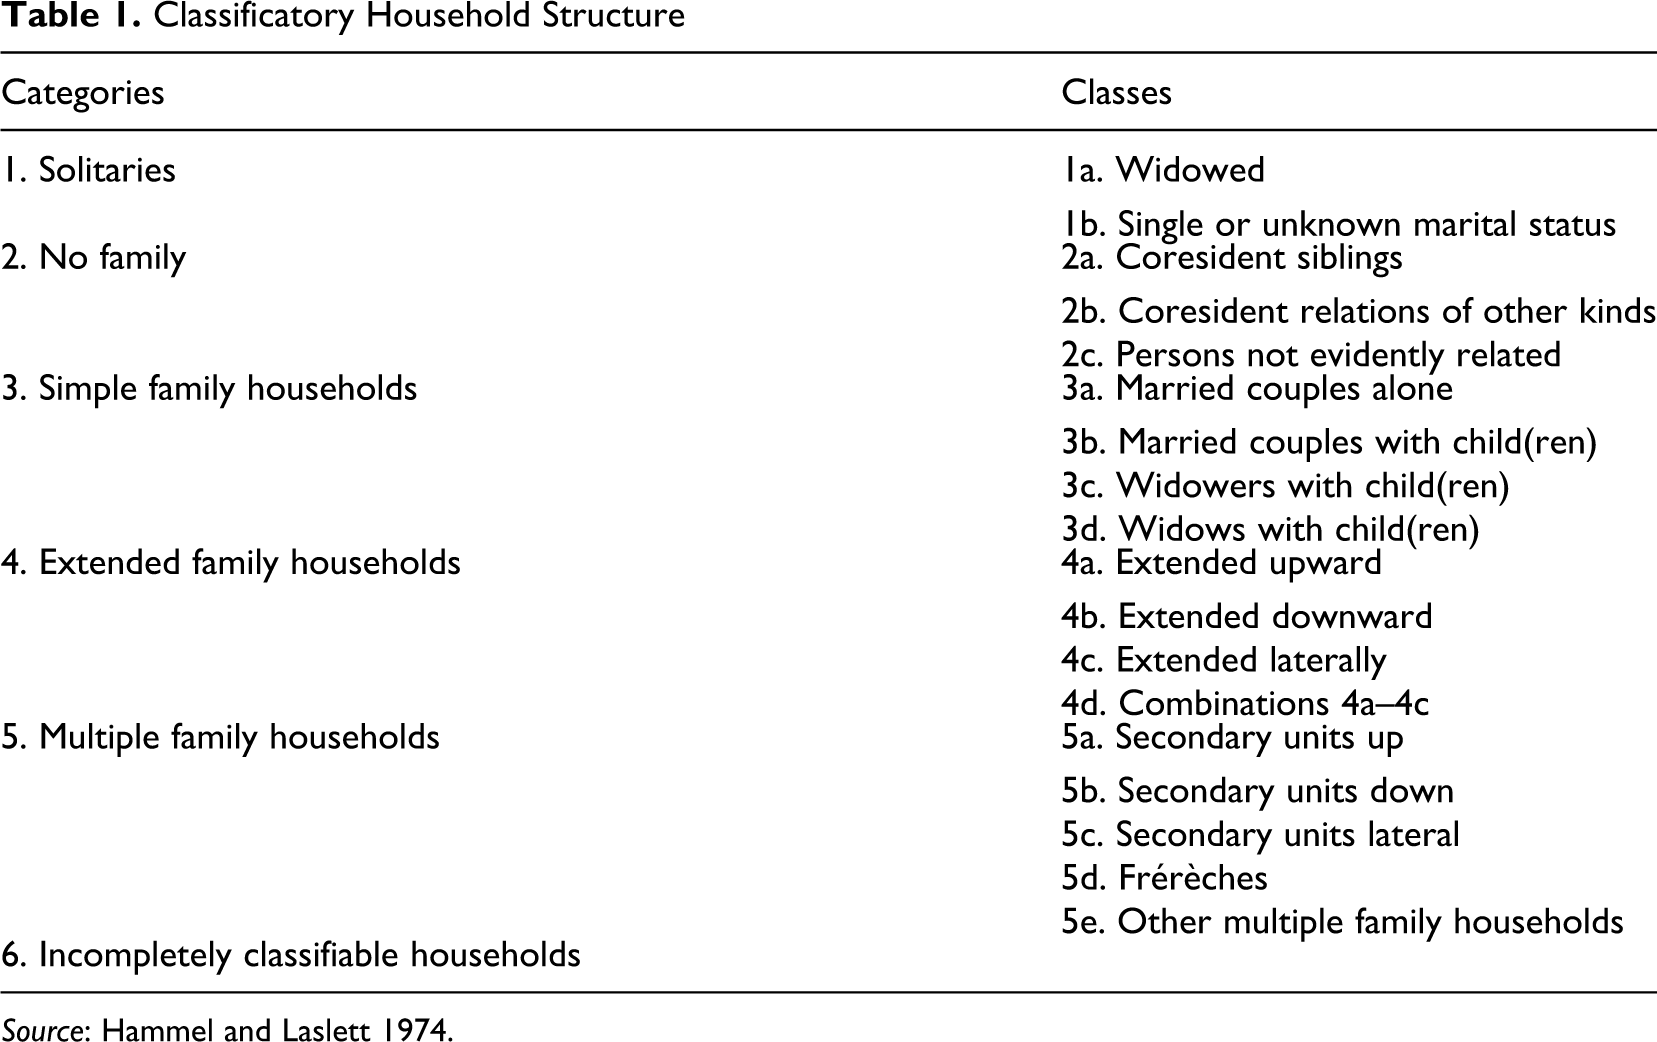
Source: Hammel and Laslett 1974.
Of the 2,649 households with classified structure (93.4 percent of the total of 2,835 households recorded in the census), the category simple family households enumerated 1,424 households or 53.8 percent of all rural households with classified structure, whereas 1,155 households or 43.6 percent fell within category 3b. Multiple family households numbered only 447 or 16.9 percent of all households which structure was completely classifiable, with the prevailing category 5b, secondary units down (Figure 8).
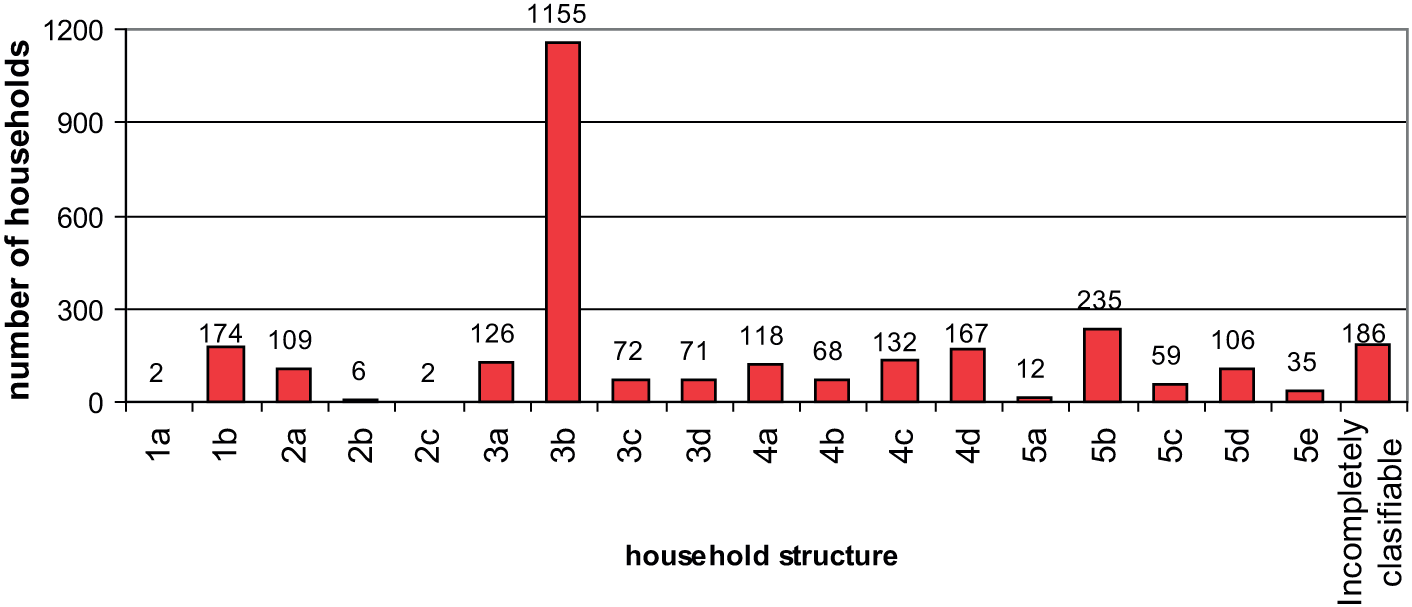
Number of households according to household structure.
A total of 13,822 members lived in households with classified structure, with the majority of 6,741 members or 48.8 percent who lived in simple family households, of which 5,953 or 43.1 percent fell within category 3b, married couples with child(ren). A total of 3,814 members or 27.6 percent of all rural population lived in multiple family households (Figure 9).
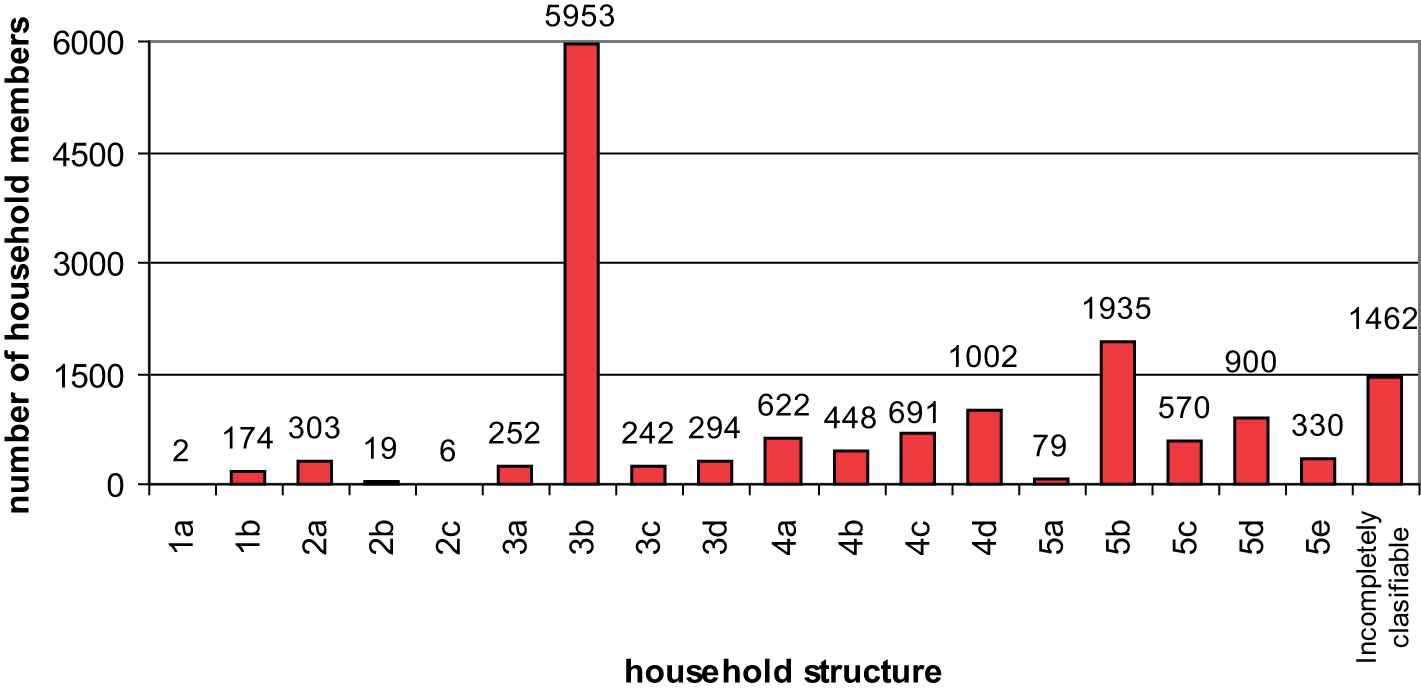
Number of household members according to household structure.
It has already been highlighted that the average size of rural households was only 5.4 members, which is far beyond the appropriate size for multiple family households. The average size of the prevailing category 3b was 5.1 members, which means that the households of this category consisted of parents living with their three, rarely more, children.
The average size for category 5 (multiple family households) was 8.5 members, which were the households consisting of several married brothers with their families living together (5c—secondary units lateral). For the households of 5b class (secondary units down) which consisted of parents (with the head of the house) living with their married children, even 1.5 members less was recorded than in former class (Figure 10).
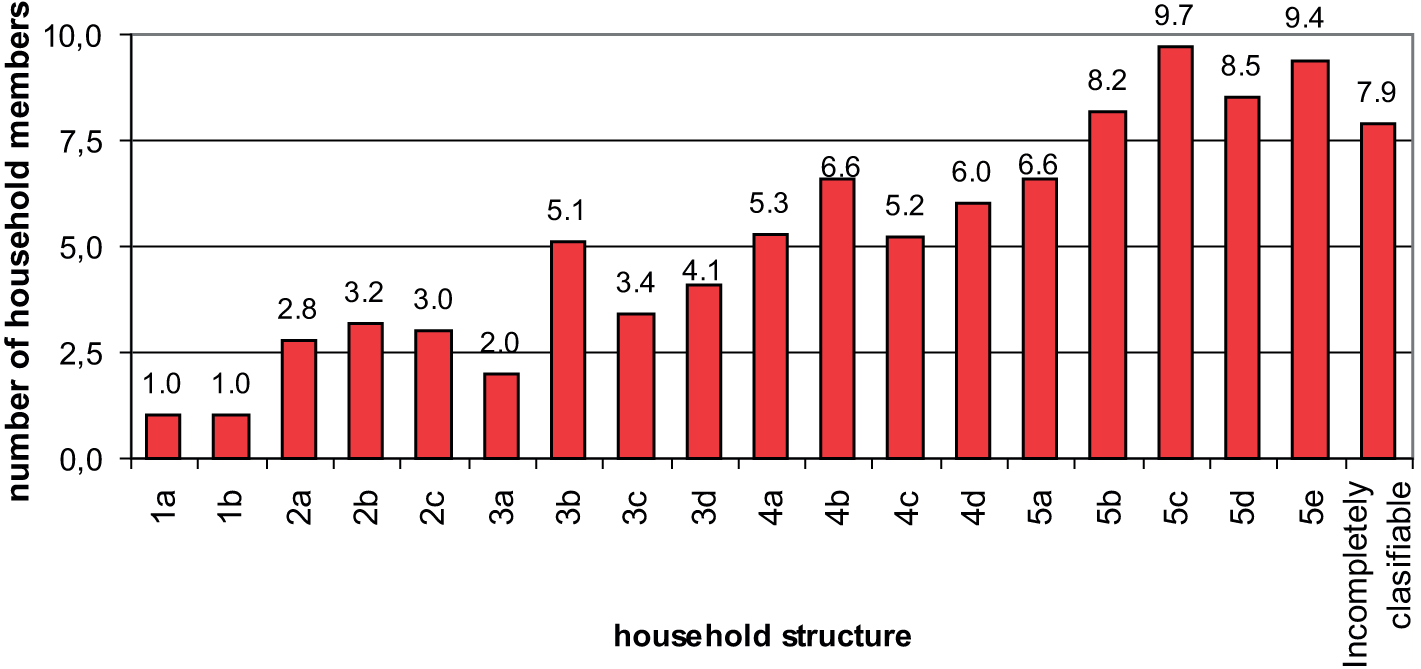
Average number of household members according to household structure.
Average property per rural household was 200.8 ducats, but it varied ranging from 0 ducats for a class 2c (households with persons not evidently related) up to 333.0 ducats for class 2b (coresident relations of other kinds). Observed by categories, among all rural households with classified structure, the largest property per household was recorded for category 5 (multiple family households). With the average amount of 308.4 ducats, the average property amount within this category surpassed the total average for 53.6 percent, also surpassing for more than a double (114 percent) the average amount for the category simple family households, to which the majority of households belonged (Figure 11).
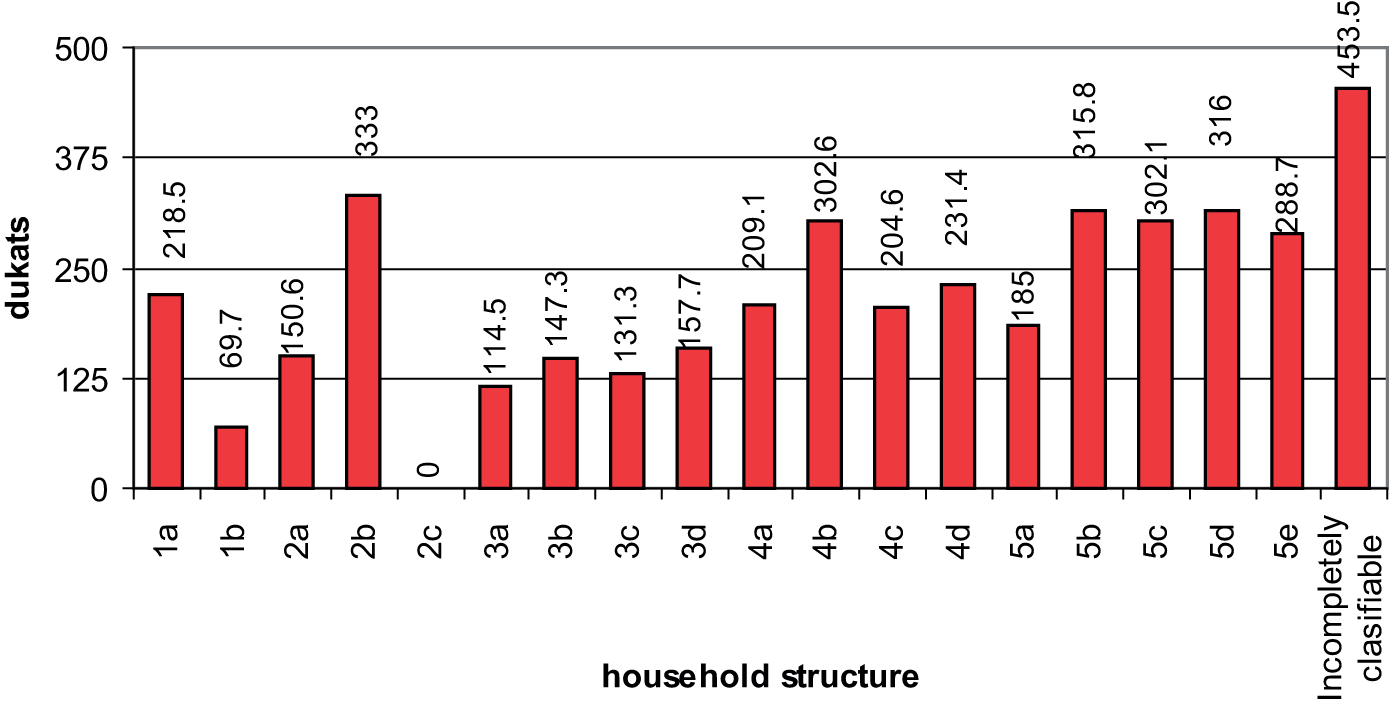
Average household property (in ducats) according to household structure.
Obviously, average household monthly income (in talirs) according to household structure increased with the more complex structure of the household (Figure 12). The average amount was 8.4 talirs, whereas for category 5, it was 15.1 talirs and for the most frequent category 3 only 5.9 talirs (the amount almost triple smaller).
Average household monthly income (in talirs) according to household structure.
The average household property per capita was 37.3 ducats. It is important to emphasize that among all family households, by far the largest property per capita (57.3 ducats) was in the class married couples alone (Figure 13). The custom of land inheritance and the custom of giving marriage dowry played the crucial role in mass formation of separate households by young married couples. Son who was living in father’s household after marriage got some part of family land. Peasant girls’ marriage dowry consisted of what they collected by themselves. The marriage dowry in cash would be widely welcomed, although it was not frequent. Single daughters or “dowry girls” were more desirable brides. 12 Later on, both material position and structure of those households were dependent on biological factors: giving birth to a child would impoverish the households for almost 10 ducats or 16.7 percent per each child.
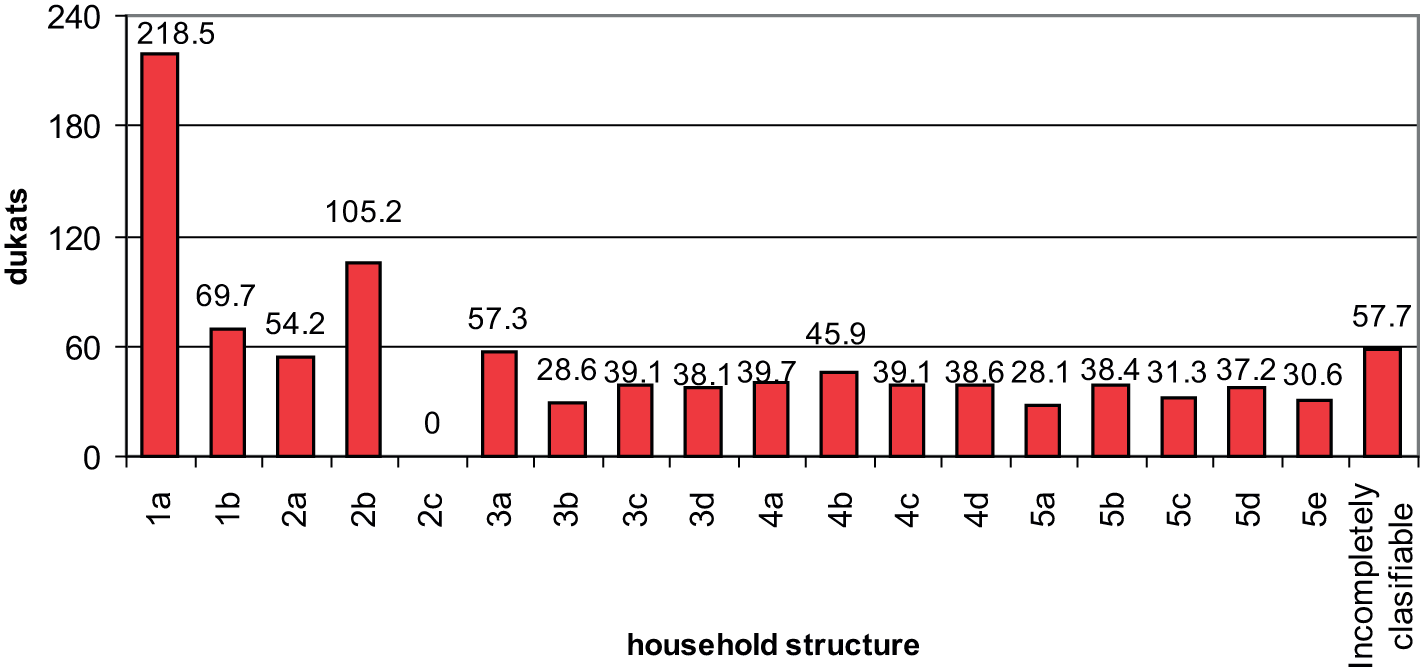
Household property per capita (in ducats) according to household structure.
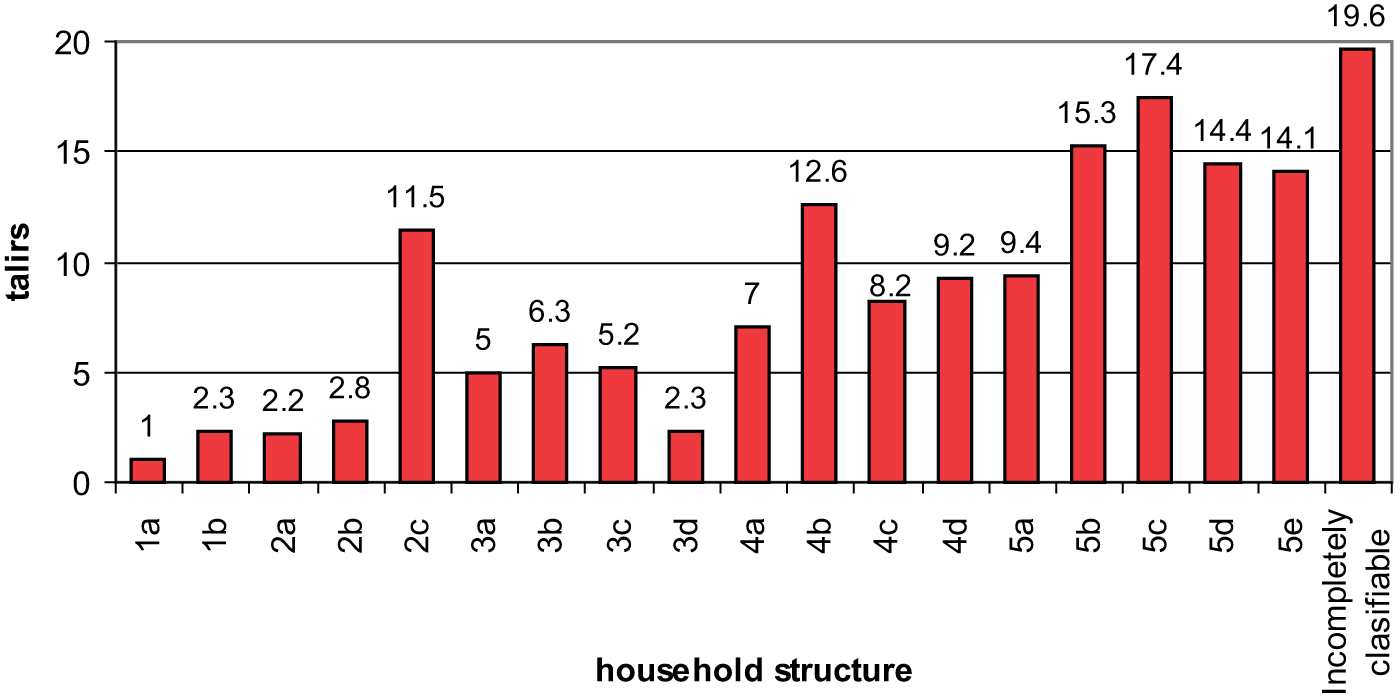
The average household monthly income per capita was 1.6 talirs, although variations among family households were from 0.5 for widows with child(ren) up to 2.5 for married couples alone. Later the amount was more than halved when child(ren) came [married couples with child(ren)] which is not surprise since mother was obliged to devote her time to bringing up the child(ren) (Figure 14). Later journey through time was directed by mortality conditions.
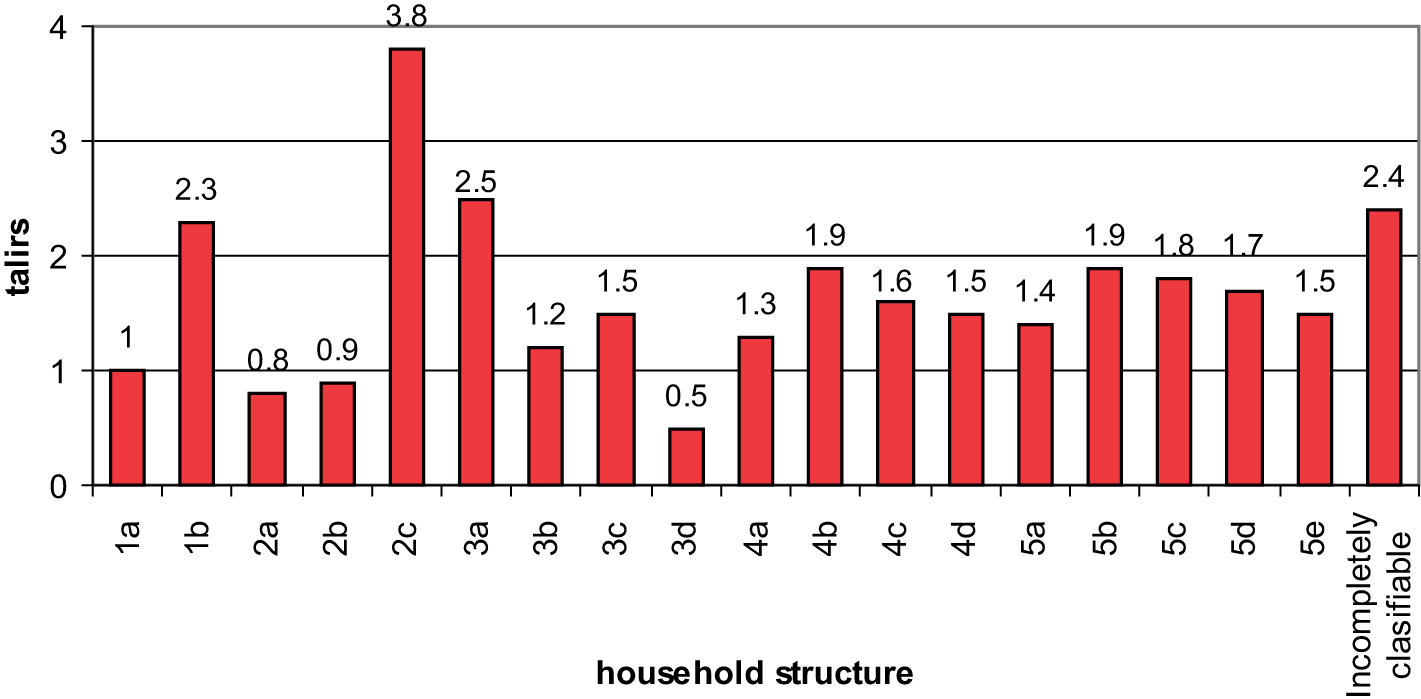
Household monthly income per capita (in talirs) according to household structure.
Discussion and Conclusion
The larger the size of the household, the older the householder. The example of villages around Smederevo shows that the trend has been followed for the up to seven-person households. However, stagnation has been perceived for seven- to twelve-person households since the average age ranges from 40.2 to 43.8. Also, the average age of household members in larger size households is over forty, with the exception of eighteen-person households. On average, the youngest households are one-person households (29.7) and the oldest are twenty-person households (55.0).
The cross reference of data concerning the household structure and property brought closer insight into the explanation why the majority of households and individuals falls within the class of simple family households, precisely the class of married couples with child(ren). The largest per capita property and monthly income was recorded for the class married couples alone, but it was a short-term situation for a year or two. Afterward, the households within this class transformed into the class married couples with child(ren), which lasted for about twenty years.
Peasants’ old-age security strategy, lacking a proper pension system, was the main driving force behind all these changes. Marriage was considered as only profound and desirable living pattern, 13 one of the reasons being that almost all the children were born inside marriage. Giving birth to children was an investment into the future and conscious sacrifice of living standard with the purpose of providing the descendants who would take care of their parents. Similar strategy was present in other parts of the world and during different times, for example, in China, during 1980s: “The economic fortune of peasant families was closely related to their size and labourer-to-dependent ratio that varied constantly over the family life cycle. Families during the initial phase of the cycle generally enjoyed the strong labour force of the young couples and the small size of their family. Their situation, however, turned unfavourable as the parents gave birth to more and more children during the second phase. Matured families of the third phase were often the largest among all families, and they also had the largest number of labourers when the children grew up and entered the labour force.” 14 However, a major difference arose during the last phase in the villages around Smederevo: not all the children would leave their parents, but aged parents or a parent would continue to live in households of their married sons or a son. Therefore, at the end of the nineteenth-century stem-family pattern, in which one married son would remain on the land, 15 became an alternative to then prevailing zadruga system. 16 There was a legal prohibition of zadruga division up to the enactment of the Civil Law Code of 1844 since the zadruga style of living was important for military organization. 17
When the pure household size is in question we see clear bimodal curve in case of both, household property and household monthly income per capita: steady decline until household size with five to seven members and undisturbed increase after that level up to eleven members. After that size we see slight fluctuations but at high level.
When the household structure is in question, the picture is not so clear. Amount of household property per capita generally declines from smaller to larger household structure, but household monthly income per capita is similar among household classes, although the class married couples with child(ren) is among the poorest.
Peasants’ old-age security strategy is the main driving force behind the paradox that majority of household is located within the poorest composition: the size of five members per household is the most frequent size of all households and the average size of class married couples with children is also five members. The size and structure of households are not stable, they change. Throughout his or her lifetime, one individual passes through several household classes.
After this scrutiny, we may draw some conclusion about family life cycles and well-being of one individual, taking into account custom law of land inheritance, custom of dowry, and demographic conditions at the time of our analysis (life expectancy of fifty years and total fertility rate of three children). Altogether, there were three main stages in the individual family life and well-being.
He or she spent his or her first twenty years living in household with father, mother, and two brothers and/or sisters and maybe one grandparent. After twenty years, he or she gets married and if he is the oldest son, he continues to live with and to support his parents and younger brothers and sisters and one grandparent. If individual is not the oldest son after marriage, he gets some part of family land and she gets some dowries and establish his or her own household. After forty years, he or she will continue to live in an extended household with oldest married son or with a spouse still alive in a multiple family household to the end of his or her life.
Footnotes
Acknowledgments
The article is a part of the project No. 114-451-1861/2011-02 “Facing the Challenges of Depopulation in Vojvodina Province.”
The author(s) declared no potential conflicts of interest with respect to the research, authorship, and/or publication of this article.
The author(s) received no financial support for the research, authorship, and/or publication of this article.