
Abstract
This article aims to provide some descriptive statistics about the deaths in Chioggia, between 1629 and 1631. Many details regarding the nature and socio-demographic characteristics of the deaths are provided, as well as the life expectancy for a three-year period. Results suggest that casualties were most severe in 1629 and 1630, rather than in 1631, that the death rate among women was worse than that among men, even if the former had a longer life expectancy, and that married women had an edge over widows in terms of survival probability. A list of the most common surnames is also provided.
Keywords
Introduction
The seventeenth century was afflicted by one of the last epidemics of the plague before the disease disappeared from Europe for over a century. This was very similar to what had happened about a thousand years beforehand when the plague also disappeared without any clear reason. 1 Looking at the literature, the first references that we have to pestilence are of an unscientific nature. Indeed, the first tales of it can be traced back either to an episode from the Bible (the fifth plague of Egypt is likely the description of one of the first epidemics) or to Homer, who wrote in the Iliad about a pandemic affecting the Achaean camp. The Greek poet calls it the “cruel plague,” and identified its origin in the anger of Apollo against Agamemnon, who had disrespected him. Thucydides 2 and Lucretius 3 also described a plague pandemic. Both of them considered the pestilence to have originated in Egypt. 4 For modern scientists, the most likely reconstruction is that the disease these authors talk about was not the bacterium identified in the nineteenth century, but a different kind of disease altogether. 5 It spread among a population already distressed by siege, and in a society with very low standards of personal and public hygiene. Finally, it is interesting to note that Sophocles probably describes the same epidemic in Oedipus Rex, a tragedy first performed in Athens in 425 BC.
After these initial manifestations in the ancient world, the first plague epidemic arrived on the Italian peninsula during the Greek-Goth war. It began in AD 543 in Constantinople and scourged the peninsula up to the eighth century. 6 Cesarea Procopius 7 and Paolo Diacono 8 both mention the pandemic. The two authors describe boils that grew all over the body, together with the appearance of fever and other symptoms. The disease was lethal in the vast majority of cases and led to a significant regression of society, which was decimated by the bacterium.
The epidemic, which at the time was unexplained and had no known remedy, suddenly disappeared in the eighth century, only to return as a second wave of the pandemic in 1347. This time it had a number of different names, among others atra mors, febris pestilentialis, infirmitas pestifera, morbus pestiferus, morbus pestilentialis, mortalitas pestis pestilential, and pestis. 9 Possibly because of the long period that had elapsed between the two pandemics, the new one was not connected by scholars and doctors of the time with the so-called Justinian Plague, which had happened centuries before. 10 Estimates suggest that this new pandemic caused the deaths of a third of the total European population. It originally manifested in Messina, Italy, in the fall of 1347, possibly coming from a ship that had sailed there from Africa or Asia. 11 From this wealthy seaport, the bacterium reached all the other Italian ports, as well as the mainland. The Italian poet Giovanni Boccaccio describes the plague in the introduction of his masterpiece, the Decameron. He recounts the physical devastation brought to the body by the disease and uses it as a metaphor for the disruption it causes. Indeed, the lethality of the bacterium, people’s inability to find useful remedies, and the fact that the contagion spread across all social classes, led to intense panic among the entire population.
After an initial period in which public authorities were unable to deal with the emergency created by the bacterium, almost all countries organized public health offices. These were initially temporary, but soon became permanent, and were established to try to cope with the situation in the best possible way and avoid further spread of the contagion.
The impact of the plague was especially severe in the southern part of the continent. 12 Possibly also for this reason, the Republic of Venice was among the best countries at fighting the pandemic with non-pharmaceutical remedies. This is arguably one of the places in which isolation and lockdown policies were first developed, policies that are still very much in use nowadays. 13 In Venice, in January 1486, following similar temporary decrees, two new permanent offices were created: the Provveditori (Intendent) and Sopraprovveditori (Superintendent) of Health. This was a public authority that had great power and was established in order to defend the city from the plague. A few decades prior, in 1423, the Maggior Consiglio (Great Council) decreed that whoever arrived in the city had to go into quarantine on the island of Saint Mary of Nazareth, later renamed Old Lazaret. In 1468 a second island was reserved for this use, the so-called New Lazaret. The two isles, although homonymous, had different targets in terms of the people they aimed to admit. In the first, Old Lazaret, sick people were assisted by the clergy, who usually worked in the leprosy hospital of the Venice Lagoon. The second, New Lazaret, housed people suspected of being infected (i.e., who had been in contact with people known to be infected) and people recovering from the plague. 14
This was arguably the first time in human history that fighting the plague was not simply a medical topic to be discussed among doctors, but instead a civil issue, to be confronted with policies put in place and strengthened by public authorities. The bacterium was not fought simply with drugs prescribed by doctors: public authorities joined the fray and provided laws to fight it. And it was indeed the field of public policy that saw the biggest results: isolation to contain the bacterium proved far more efficient than any medical remedy. After the final waves in the 1600s, the plague disappeared from Europe. Of course, this was not the last pandemic we have seen, as recent history suggests. Other notable examples include the 1832 cholera outbreak, which caused more deaths on the Italian peninsula than the three Risorgimento wars. 15
The plague bacterium was only identified many years after this pandemic, in 1894, separately by Alexandre Yersin and Shibasaburo Kitasato during an epidemic in Hong Kong. Only later were fleas and rats identified as carriers. Currently, the plague is spread only where hygiene conditions are very poor, and thus proliferation is not impossible. The World Health Organization reports between one and three thousand cases per year spread among Africa, South America, and Asia. The bacterium is not present in Europe and Australia. There is no vaccine against it, but once identified it may be treated with antibiotics. 16
While much attention has been devoted to Venice and what happened during its plague, 17 surprisingly little attention has been given to other cities in the Serene Republic. This work aims to fill the gap in the literature by examining the mortality rate in Chioggia, an important city near Venice, and historically part of the Most Serene Venetian Republic. We will look at the years in which the impact of the plague was most severe, i.e. between 1629 and 1631, and consider different demographic characteristics of the dead. We consider Chioggia to be a particularly interesting case study, because the plague of 1348 killed half of its population, 18 and because the waves in subsequent centuries continued to have a severe impact on a population that was often already weakened by other diseases and famine. Here too, as in nearby Venice, a lazaret was created in 1463, following the decree of the Maggior Consiglio (Great Council). However, unlike the islands used by Venice, here the lazaret was made of wooden structures over the Lombardo canal. These were made of wood because after each plague the structures were burnt and rebuilt. 19 Following the literature, 20 we should expect to measure a peak of the deaths in 1630, and a lower number in the previous and subsequent years, given that this year is considered that in which the plague had the most severe impact.
The society of Chioggia has typical features of an island, despite its proximity to land. In the seventeenth century the great families that would dominate the city over following centuries were already established. The complicated relationships among these and the need to distinguish one from the other despite identical names and surnames led to the wide use of nicknames, not just for individuals but for entire families. Nicknames are so important for the population of Chioggia that in 1991 a special law was passed so that they became part of surnames. 21 The study of mortality and its impact during the last great plague epidemic could lead to a better understanding of population dynamics: which families survived and afterward prospered, and which were reshaped or even extinguished. Moreover, the society of Chioggia is strictly connected to the organization of the city, which, even historically, has been based around two centers: Clugia Maior and Clugia Minor. 22 The first of these is recognized as the historical center of the city (Figure 1), whereas the second, less densely populated, is located on the coast of Sottomarina. Clugia Minor was completely destroyed during the Chioggia War (1378–1381), and the Government of the Venetian Republic decided not to rebuild it, fearful of the possibility of another war (it was on the coast, while Clugia Maior was detached and so more easily defended). The population returned to Clugia Minor only after a long period, and did so slowly. The two Clugias were distinguished not only by their positions but also by the activities of their inhabitants: those of Clugia Maior were fishermen or traders, those of Clugia Minor were farmers. There was a good deal of resentment between them, and, although they were inhabitants of the same city, they distinguished themselves from one another. Inhabitants of Clugia Maior thought “Marinanti” (as the inhabitants of Sottomarina were called) excessively hard-working because they were always busy on their fields. Those of Sottomarina, on the other hand, judged the inhabitants of Clugia Maior negatively because they remained at home for long periods.
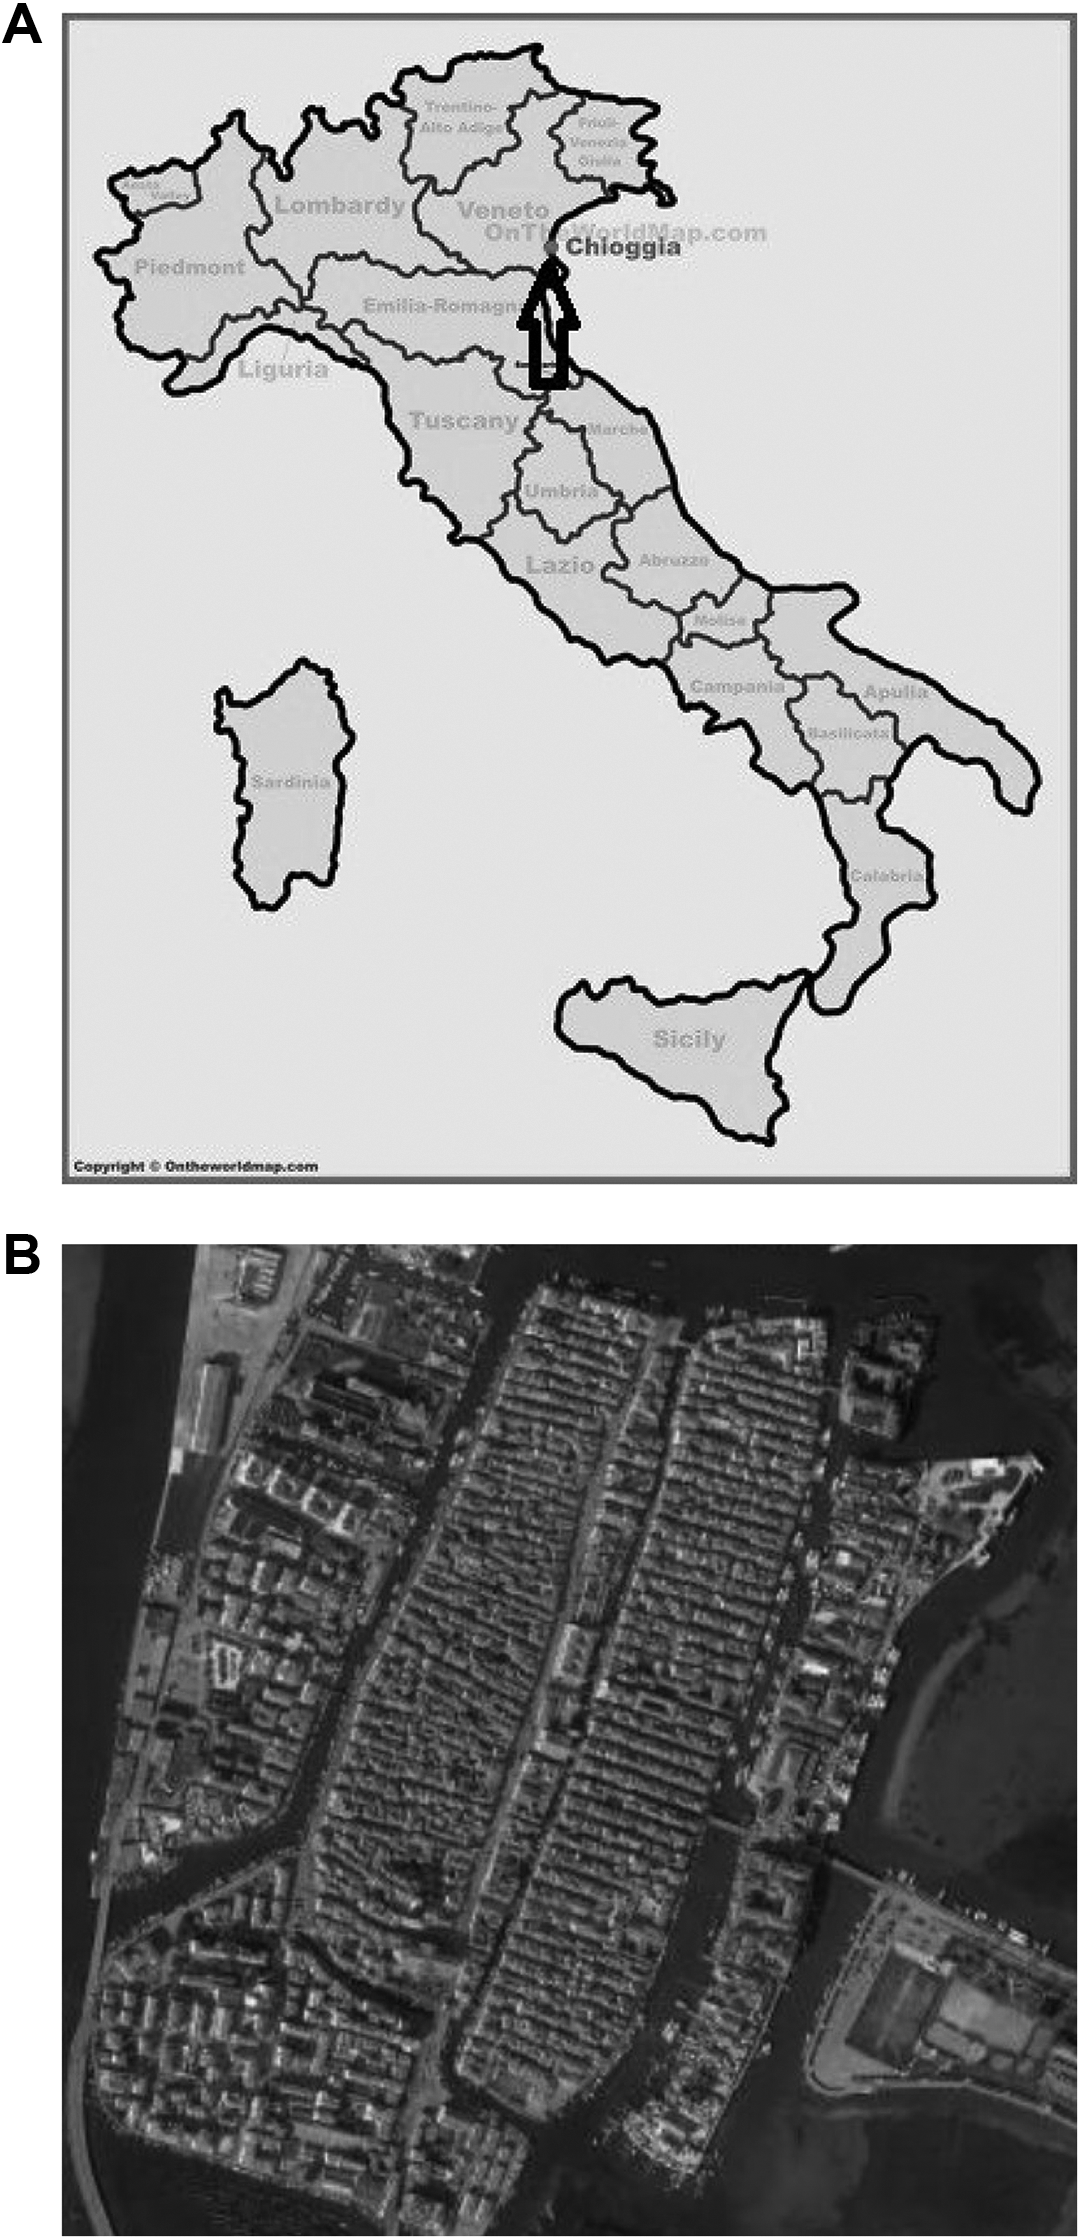
(A) Localization of the city of Chioggia in the Italian state, the position is marked by a black arrow. (B) Image of the historical center of Chioggia (Clugia Maior) view from above.
Expanding on previous findings, 23 the aims of this paper are twofold: i) to find and report evidence of the plague in the historical documents of the Chioggia archive; and ii) to understand what impact the plague had on the population in its various stratifications. Our objective, also in light of the paradigm of the so-called Nueva Ciencia Genealógica, 24 is to pass the traditional boundaries of genealogy and adopt new approaches that involve statistic and data analysis in order to provide research with results that are not just of genealogical interest.
The remainder of the work is organized as follows. Second section describes the data, while third section draws a picture of the general trend of the pandemic; fourth section calculates the life expectancy by gender and year, and fifth section performs analysis on a subsample of the deaths, according to different socio-demographic characteristics. Finally, sixth section concludes.
Data
To study mortality trends, we created a digital dataset from original data taken from the Liber mortuorum of Chioggia for the years 1629, 1630, and 1631. The books are kept in the Historical Archive of the Diocese of Chioggia. While death records were very common across Christendom as early as the Trent Council in the late Middle Ages, and are commonly used for demography studies, including those looking specifically at the plague, 25 Venetian records are particularly detailed. To give an example, in the Patriarchal Archives of Venice, more than seventy parishes that existed at the time possess at least part of the records for the plague years (for a period spanning from September 1630 to September 1631), while their civil counterpart in the State Archive of Venice has only a few and scattered records for the plague years. 26
Venetian death records from this period are organized by parish. The records contain the systematic registration of more or less every death among the resident population. These necrologies, edited by the parson, had been established by decree since 1504 and kept in the archives of the magistracy responsible for this function. 27
From there we extracted names of the deceased, date of death, age, paternity, and any other possible notes from the priest from which socio-demographic characteristics could be derived. There are over four hundred single surnames individuated in the dataset. For married women, we attributed the frequency to the husband’s surname only when the original surname was not indicated.
General Trend of the Pandemic
Just before the pandemic of 1630, the city of Chioggia had around 13,800 inhabitants. 28 As we shall see, this number was seriously affected by the pandemic.
From an initial general analysis of the data, we can see how the number of deaths recorded in 1629 and 1630 was more or less comparable, while we register a much lower number in 1631 (Figure 2). More precisely, we register 867 deaths in 1629, 675 in 1630 (and thus a growth rate of −22.14 percent), and 353 in 1631 (with a growth rate of −47.7 percent). Deaths among infants were also substantially lower in 1631, even if its rate did not shrink as much as that for adults. Indeed, the share of mortality referable to newborns was about 14 percent in 1629 and 1630, and much lower in 1631. It is important to highlight that this finding should be taken with caution. Indeed, we are only measuring deaths in which the deceased is reported by the priest as a neonato (Italian for newborn), and this datum may be influenced by the annotation of the priests, who were occasionally somewhat careless in reporting details; also, more generally, this finding is affected by the natality rate, which could—and certainly does—vary significantly across different years.
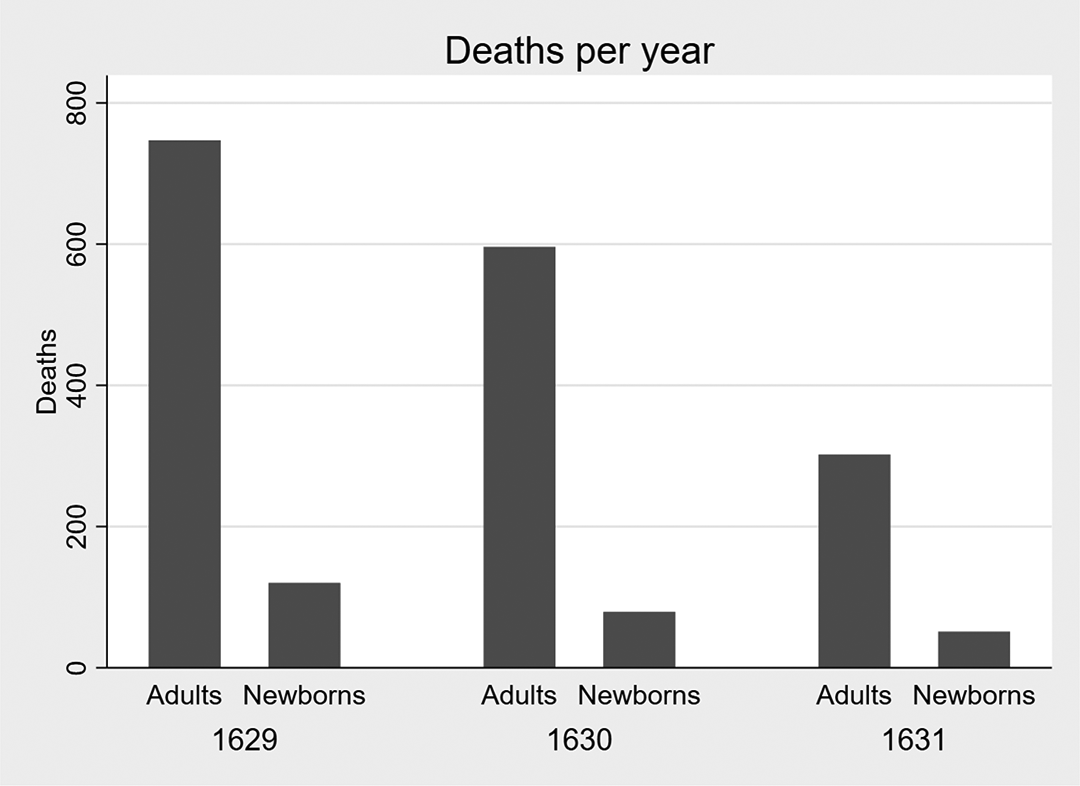
Deaths in Chioggia per year, adults and newborns.
It is interesting to note that the result of this first elaboration does not coincide with the expectations based on the literature. While we expected a peak of mortality in 1630, it actually happens toward the end of 1629 and the beginning of 1630, after slowing down in the middle of 1629. This result makes sense given the seasons; in the colder seasons the death rate increases anyway, 29 and thus the total mortality is higher. The next logical step, therefore, appears to be a seasonal analysis, taking into account this factor to avoid biased conclusions.
This is presented in Figure 3. It gives two findings: i) that the worst season in terms of mortality was not winter, as one may expect, but instead fall; and ii) that the mortality rate in 1631 was on average much lower—for every season—than previous years. The first point may be explained by colder temperatures than in spring and summer, and the fact that during fall there were relatively more occasions for contact than wintertime, which was even colder; this may have favored diffusion of the bacterium and consequently increased the number of deaths. Furthermore, it is important to highlight that during 1629 there was a severe famine. While malnutrition does not have any direct effect on the lethality of the plague, it can certainly favor other diseases and increase the lethal effect of an epidemic, in which people may die for a number of accessory reasons, indirectly related to the plague. For instance, malnutrition may favor the diffusion of petechial typhus, 30 which in 1629 also broke out in Chioggia. 31 Thus, at the outbreak of the pandemic, the population of Chioggia was already weakened by a previous epidemic, with similar symptoms. This is also confirmed by what was likely a lower life expectancy in Chioggia compared to (scarce) data about life expectancy in northern Italy at the time offered by the literature (more on this further below).
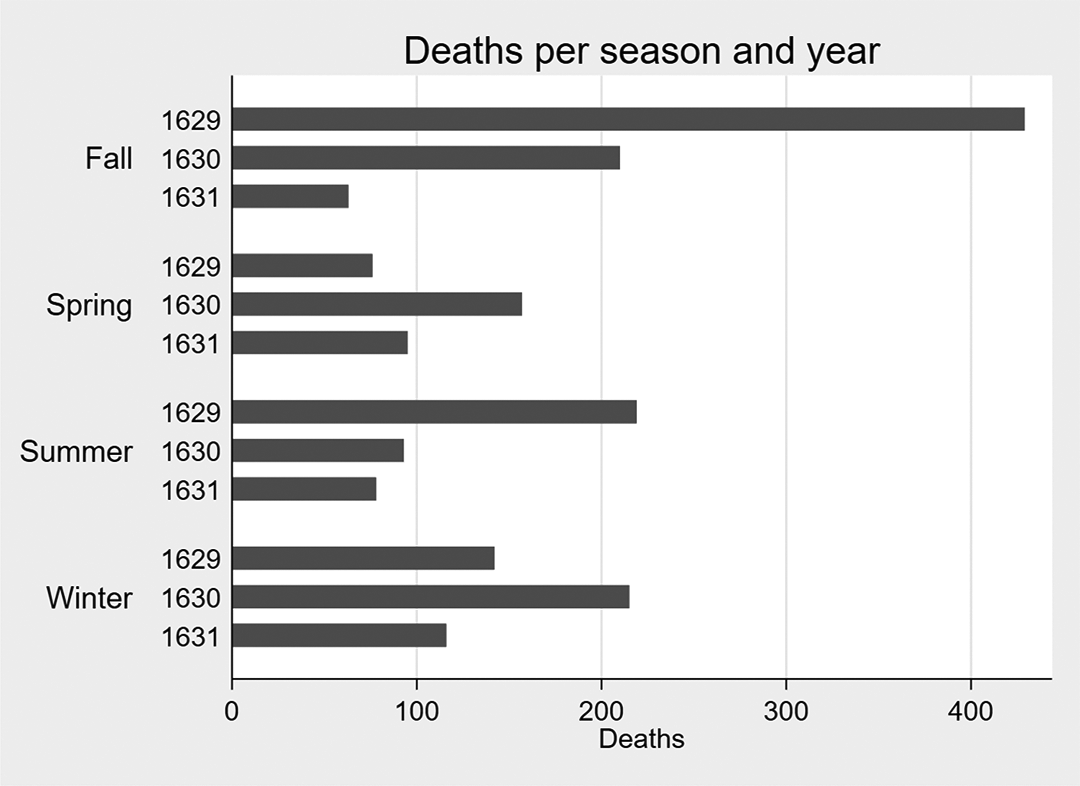
Deaths in Chioggia per season in the three years studied.
In Figure 4 we report the deaths per month. This allows us to observe the outbreak of the first epidemic. Indeed, typhus spread in Chioggia over the winter of 1629, as can be seen from the trend of the curve. The number of deaths shrank in December, then increased again during the first months of 1630. That year the number of deaths decreased during spring and summer, in the middle of the year. But why was this the case? Once again, we may impute this to the higher mortality rate in winter. What remains strange is that the peak of the typhus pandemic was in April of 1630, 32 while the peak in deaths was in November of the same year. A possible explanation is that the people buried in the mass graves were not registered. Indeed, the first death reported in the documents is in November 1630. Thus, it is possible that we have no notice of many deaths in April, due to the lack of proper funerals and thus of registrations of deaths in the Liber mortuorum. It is important to note that Perini’s (1996) elaborations are not based on the funeral act, like ours, but on municipality numbers which, although not discriminating for single deaths, do report all the people buried in mass graves.
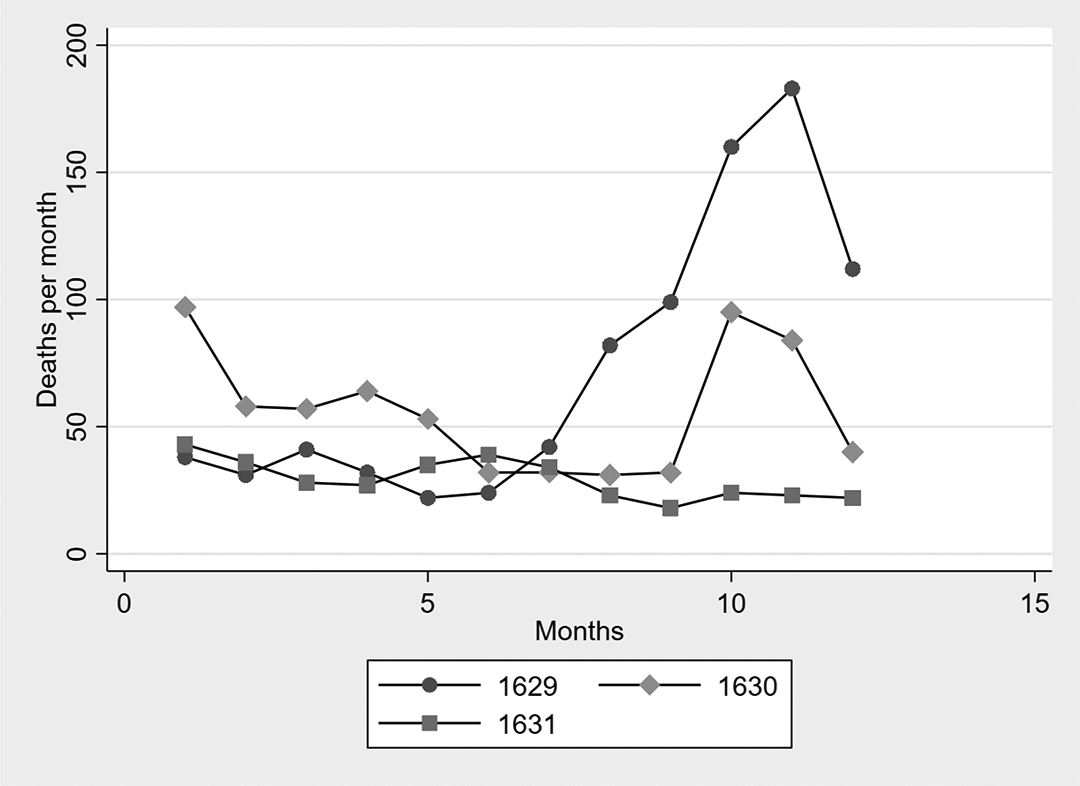
Deaths per month in the three years studied.
Finally, it is important to note that the reduced number of deaths in 1631 was due not only to the weakening of the plague but also to the shrinking of the population, which had already halved. 33 According to Perini (1996), the deaths were about 5,000, thus about a third of the population recorded before the epidemic.
This leads us to highlight another interesting result of our research: the plague may be correlated in the archives not with a high number of deaths, but instead with a decrease in the registrations in the Liber mortuorum, since the priest did not oversee proper funerals due to a large number of deaths and the risk of getting the bacterium.
Life Expectancy
While, as highlighted, our data may miss some deaths due to the lack of specific death registrations for people who were buried in mass graves, or who were not honored by a funeral or registered in the Liber mortuorum for some other reason, there are also advantages in using this kind of source. Indeed, having micro-data for each death gives us a number of insights into individual dead people, such as their ages at death. With regard to this, our data also allow us to calculate the average life expectancy of people who died during the three years being analyzed. While this information must of course be taken with caution, for the same reasons that suggest caution when interpreting the results of the rest of the analysis, i.e. the lack of some registrations on the part of the local priest and a certain degree of uncertainty in the age registered in the file, we believe that they are nevertheless interesting findings.
As can be seen in Figure 5A and 5B, the average life expectancy was extremely low in Chioggia during those years. Excluding dead newborns, the average life expectancy increased. Similarly to today, in the seventeenth-century life expectancy was higher for women than men. Nevertheless, even excluding the deaths of newborns, we may conclude that it was extremely low even for the period, barely reaching thirty years for women in 1631, the year that saw the highest values. Also of interest is the fact that life expectancy increased noticeably over these three years, suggesting that the impact of a pandemic was disastrous for the general life expectancy in these centuries. To the best of our knowledge, there are currently no available estimates in the literature of the life expectancy in Chioggia (or in cities comparable to it) for these years. The closest estimates that we were able to find in the literature, which are more or less comparable to our research, are those inferred by Galloway (1994) in his article about northern Italy. 34 His data, obtained from parishes scattered around central and northern Italy, show an average life expectancy in northern Italy in 1650 of 27.4 years (far higher than the figure we found for Chioggia twenty years before, which was less than twenty years). It should be noted that in the same source this average rose to 37.1 just five years later, in 1655. Of course, the data collection of Galloway is quite narrow (as is our own), and thus standard errors are large and the mean may not be a very representative index. In any case, even if considered only as anecdotal evidence, these numbers show how short life expectancy in Chioggia was at the time.
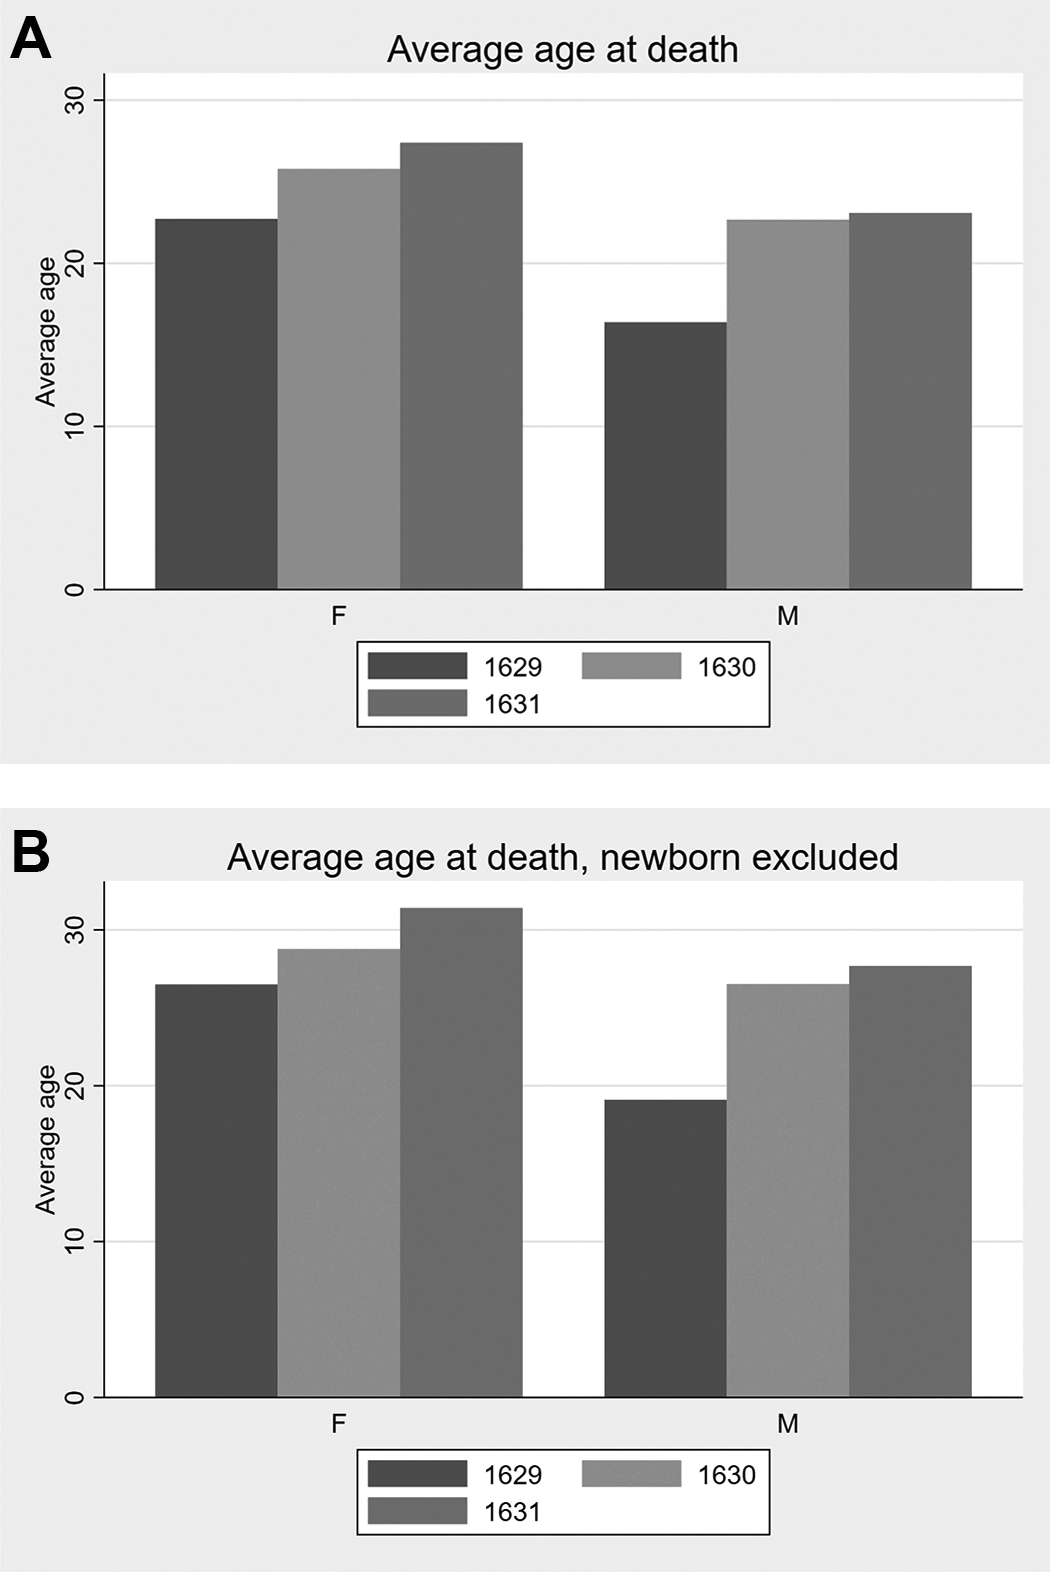
(A) Average age at death per gender in the three years studied. (B) Average age at death per gender in the three years studied, excluding newborns.
We also studied life expectancy with regard to the mortality trend over the seasons of the three years being analyzed. After dividing the number of deaths by age group (between ten and twenty, between twenty-one and thirty, and so on) and by season, we plot the result for each year being analyzed. As can be seen in Figures 6A, 6B, and 6C, the most exposed age group, i.e. those that registered the greatest mortality, was that for children aged ten and under, especially during the fall and winter. This class was followed in mortality by people aged between ten and twenty. There were then two relatively safe decades, in which the deaths registered were much lower, followed by other age groups that were more exposed to death. The dynamic was very similar for both 1629 and 1630, and, all things considered, for 1631 too, with any differences due to a lower total number of deaths.
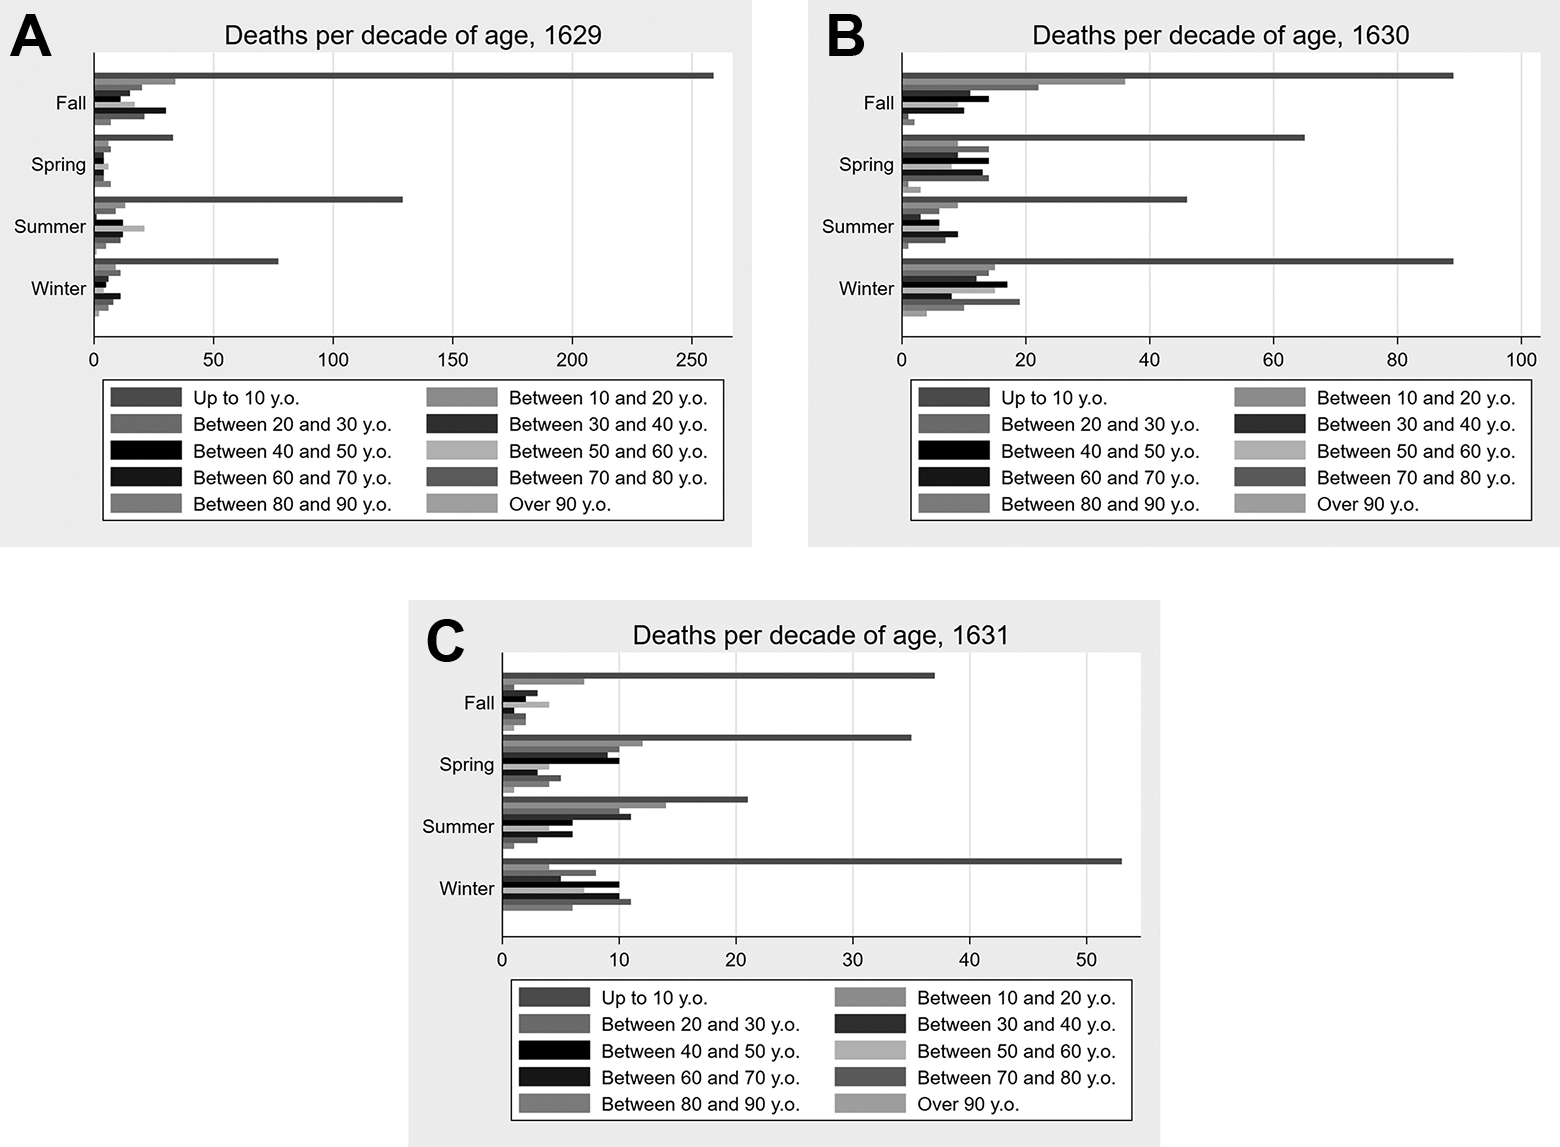
(A) Deaths by age group, per season (1629). (B) Deaths by age group, per season (1630). (C) Deaths by age group, per season (1631).
We may thus conclude that, with the exception of children under ten (who nevertheless did not enjoy a great life expectancy even in times that were not affected by the plague), the pandemic affected all the ages over forty in a largely similar way. In other words, after the third decade, the registered deaths are comparable.
Deaths according to Socio-demographic Characteristics
The next step of our analysis is to consider the impact of certain socio-demographic characteristics on the death rate. As we have seen, women had a higher life expectancy on average. Nevertheless, there were more dead women than men, as can be seen in Figure 7, given the reasonable assumption 35 that genders were more or less equally represented in Venetia at the time. This may be due either to the impossibility of knowing the identities of the people buried in mass graves (which in that case should be mostly men, something that could be a further finding of this research), or to the fact that women, being older on average due to their higher life expectancy, suffered greater casualties following the outbreak of the plague given their average higher age and thus greater sensitivity to the pandemic.
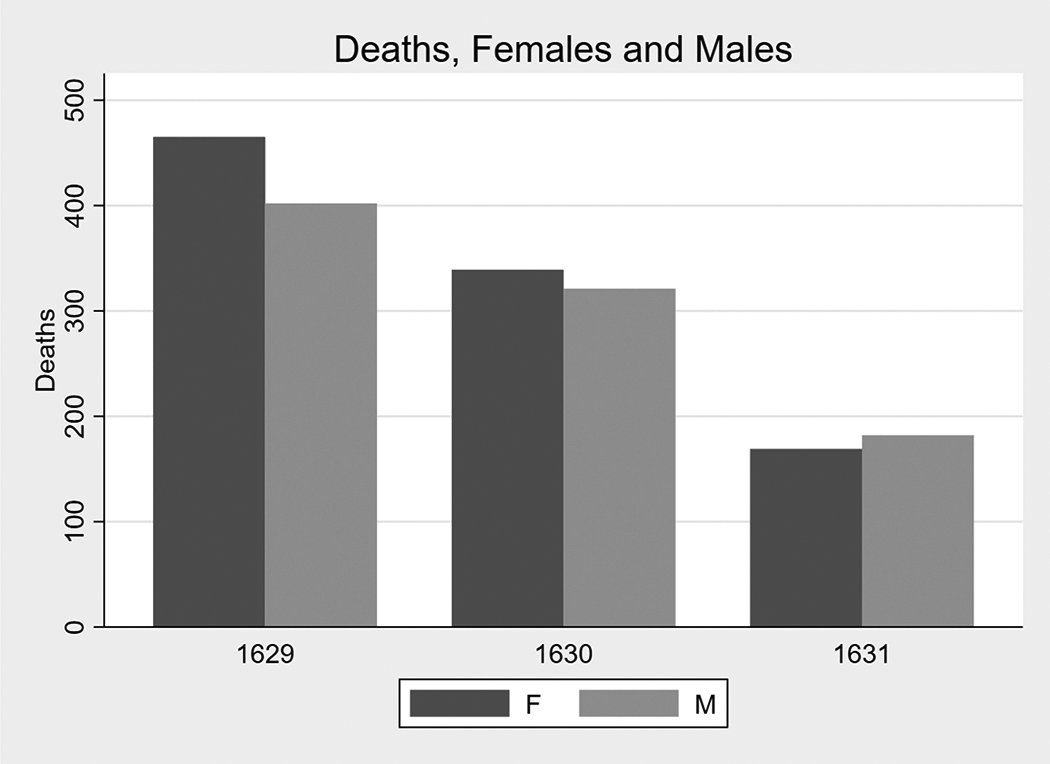
Total Deaths per gender in the three years studied.
This assumption seems to be confirmed by the graph reported in Figure 8, where it can be seen that the seasons in which the rate of death among women overtook that for men were the colder ones (at least for 1629 and 1630, when the pandemic was at its most severe, compared to the last year analyzed). Indeed, during the warmer seasons, in which we may expect less of an impact of the cold on personal health, more men died than women.
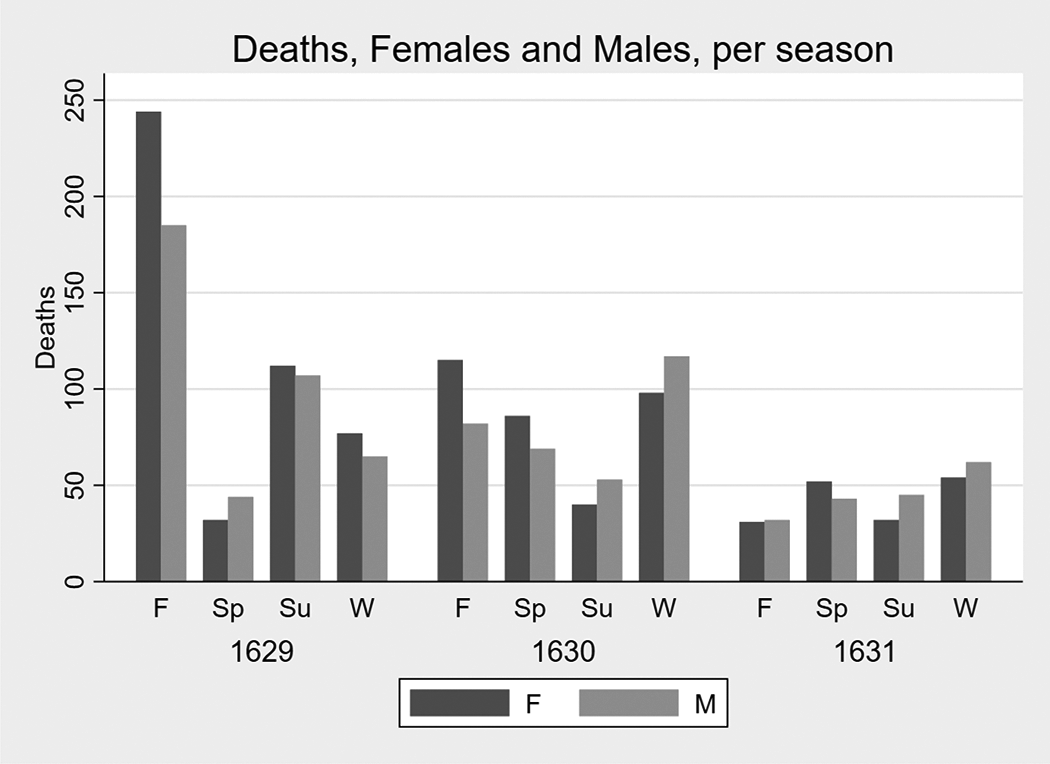
Total Deaths per gender and season in the three years studied.
If we look at marital status, investigating the subsample of women only, we may see a pattern in the seasonal deaths of widows, compared to women who were not widowed. Indeed, as can be seen in Figures 9A, 9B, and 9C, women older than fourteen (we decided to perform the analysis on this subsample in order to depurate this analysis of both infant mortality and those who died while still very young), and those who were not widowed (i.e., either unmarried or married), were more likely to die than widows in fall, spring and winter, but not in summer. Indeed, for both 1629 and 1630, the number of dead widows was lower than that for those who were not widows for these three seasons. The effect was stronger in 1629 than in 1630, although it was still in effect in the latter year. In 1631, on the other hand, we observe a different dynamic. Indeed, widows died less often than women who were not widows in each season. This finding may be interpreted in light of the fact that during the colder months, because of the fact that they spent more time at home, people with a family (either their original one or the one acquired through marriage) had more chances of getting infected than people without a family, due to a greater amount of contact with other people, who could be carriers of the bacterium. On the other hand, in the warmer seasons, this difference shrank, since widows also had more active social lives and spent more time outside in contact with other people. Possibly, this category paid the price of not having a family to rely on during these months and thus suffered greater mortality. This mechanism was not in place in 1631 when the dynamic became more regular due to the retreat of the pandemic.
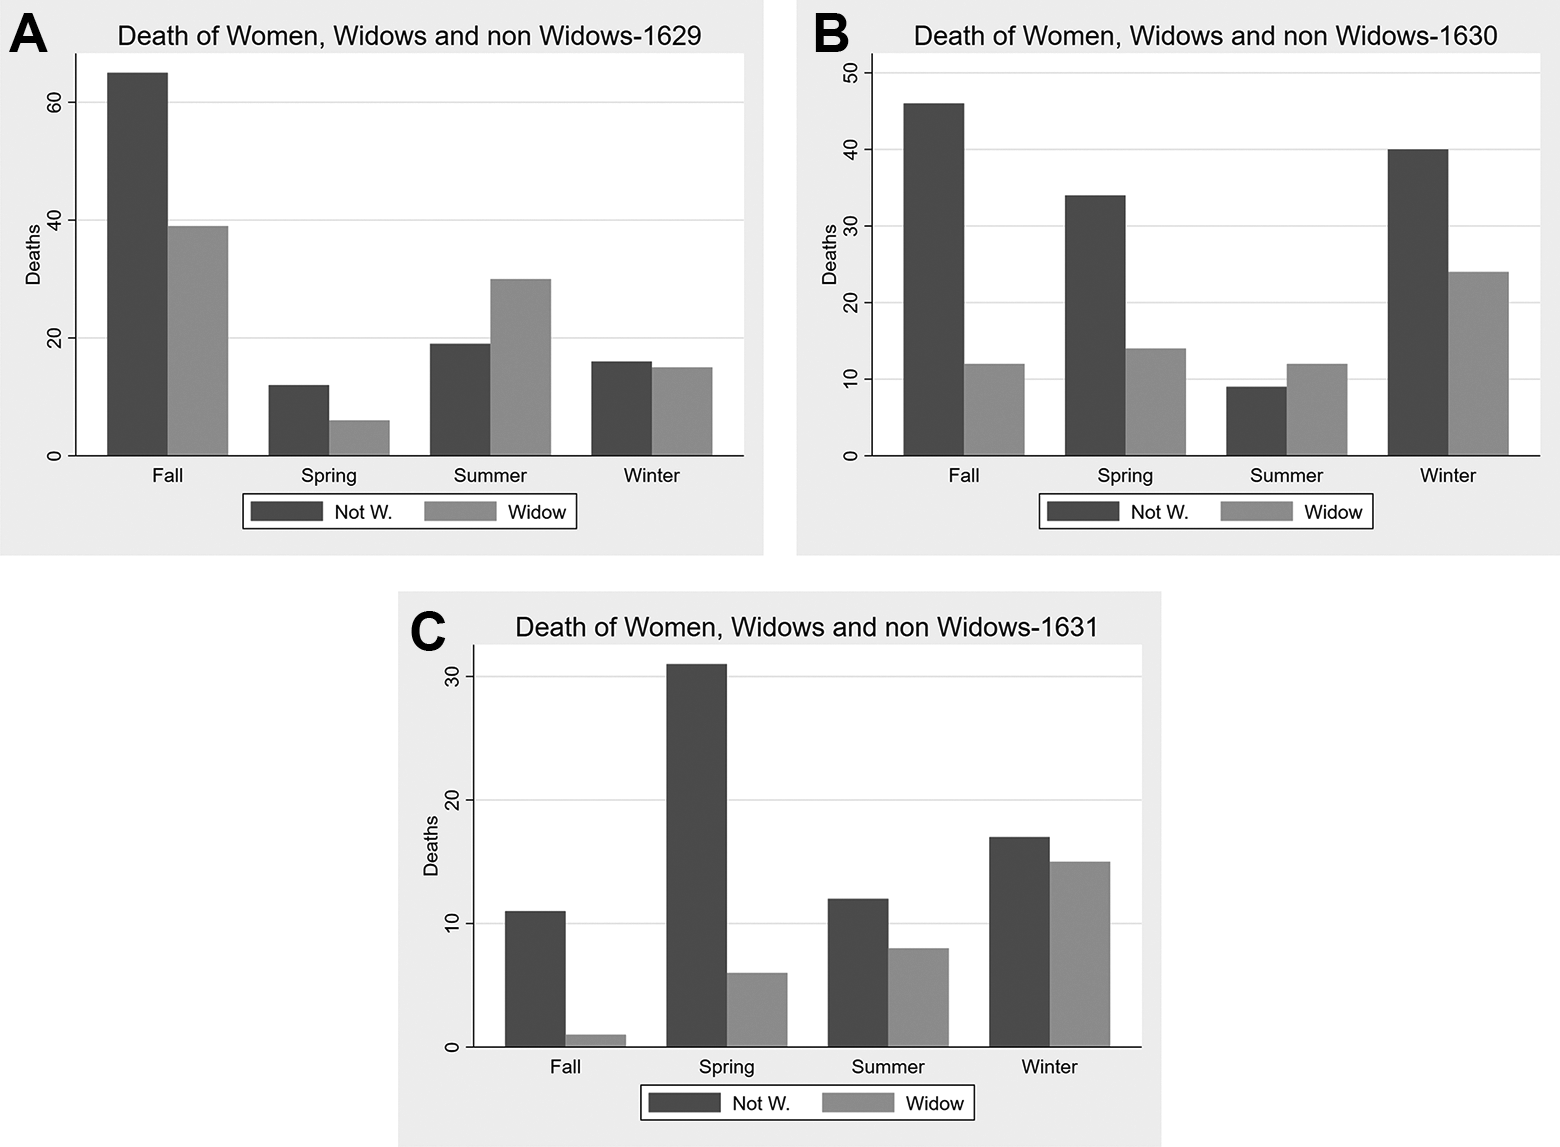
(A) Deaths of women, by widow status, per season (1629). (B) Deaths of women, by widow status, per season (1630). (C) Deaths of women, by widow status, per season (1631).
Interestingly, if we restrict the analysis to a subsample with married women only, and compare the number of deaths between these and the number of dead widows, we have a different result. As can be seen in Figures 10A, 10B and 10C, widows died more frequently than married women in all the seasons of 1629, and in half the seasons in 1630. This outcome changes for 1631, when married women died more than widows in all the seasons but winter. While of course the first explanation of this result may be the higher average age of widows compared to non-widows (in 1629 the average age of widows at death was 60.47 years, compared to 42.09 years for non-widows; in 1630 59.45 versus 35.51; and in 1631 38.25 versus 58.82), a part of the explanation of these results may be found in light of the high likelihood of dying during childbirth. In a relatively normal year, such as 1631, i.e. one less affected by the plague, the likelihood of dying in childbirth made married women more likely to die than widows. On the other hand, when the plague was more severe, unmarried women (while protected by their reduced social interaction, as we have seen in the previous analysis) had more problems than married women in finding the resources to survive. In the coldest seasons, they died more often, possibly because of the lack of proper heating or of financial resources to buy food.
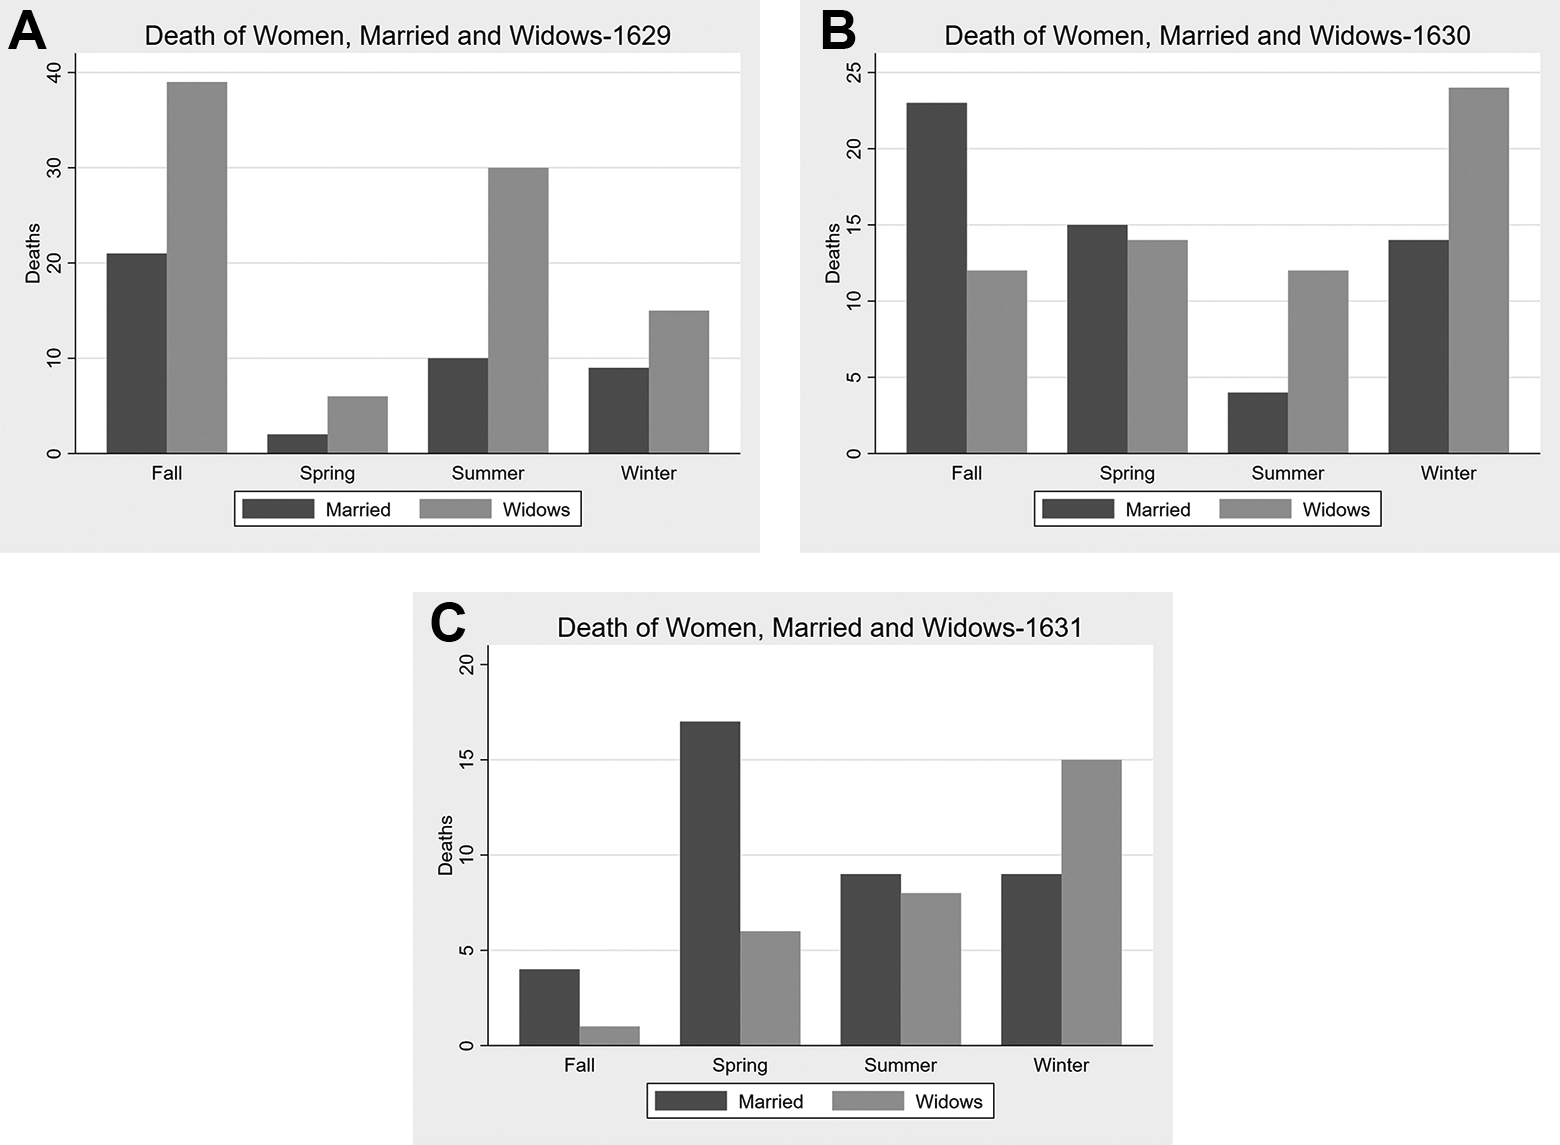
(A) Deaths of women, by marital status, per season (1629). (B) Deaths of women, by marital status, per season (1630). (C) Deaths of women, by marital status, per season (1631).
Our data also allows us to identify people who belonged to the clergy. These included just thirty people 36 in the whole sample, all Catholic, of both sexes, and at different levels of the Church hierarchy. In this subsample, women belonging to the Church died much more frequently than men: two-thirds of these religious people were women (twenty), against only ten men. This is possibly due to better living conditions offered by the Church to men in the clergy, as compared to women.
Nevertheless, it is also important to highlight that many religious people died on this occasion who are not present in our data. This is because as the pandemic advanced they were buried quickly and without a personal death registration. Of course, this was especially true for people who belonged to the lower levels of the hierarchy. Among these, there were all the Capuchin friars—and it is easy to understand how quickly the bacterium could spread in a community of this sort, where people lived in close contact—and various other people belonging to the clergy who were brought to the Lazaret in an extreme hurry. Looking at some of these data more closely, there is Don Primissera Morari, a man who died when he was forty years old, on 1 August. He was buried outside the walls of the church of Saint Francis, where his family had an altar. He is an interesting case since he was a member of the family of the Bishop of Capodistria, and also the person in charge of walking many infected people to the Lazaret—a job that possibly played a role in his death.
Moving on to another aspect of the data, albeit with a certain degree of uncertainty, we may also distinguish the upper class of society from the rest of the population. Indeed, the title of the dead was often reported in the death registration, and this allows us to have an idea of a deceased person’s position in society. We operationalized this in two different ways. First, we consider whoever had a title of respect reported in his or her funeral act as belonging to high society. 37 This strategy led us to a total of just ten people: one woman and nine men, their deaths spread over the three years, as reported in Figure 11A. While it is hard to infer anything from such a small sample, it is interesting that half of the deaths of this class were in the last year analyzed, as if the impact of the plague needed more time to have an impact on this class, possibly due to their access to better cures or better living conditions in general, which managed to slow down the disease (or this may also be due to a greater probability of dying from the bacteria among women, who are less present in this cluster).
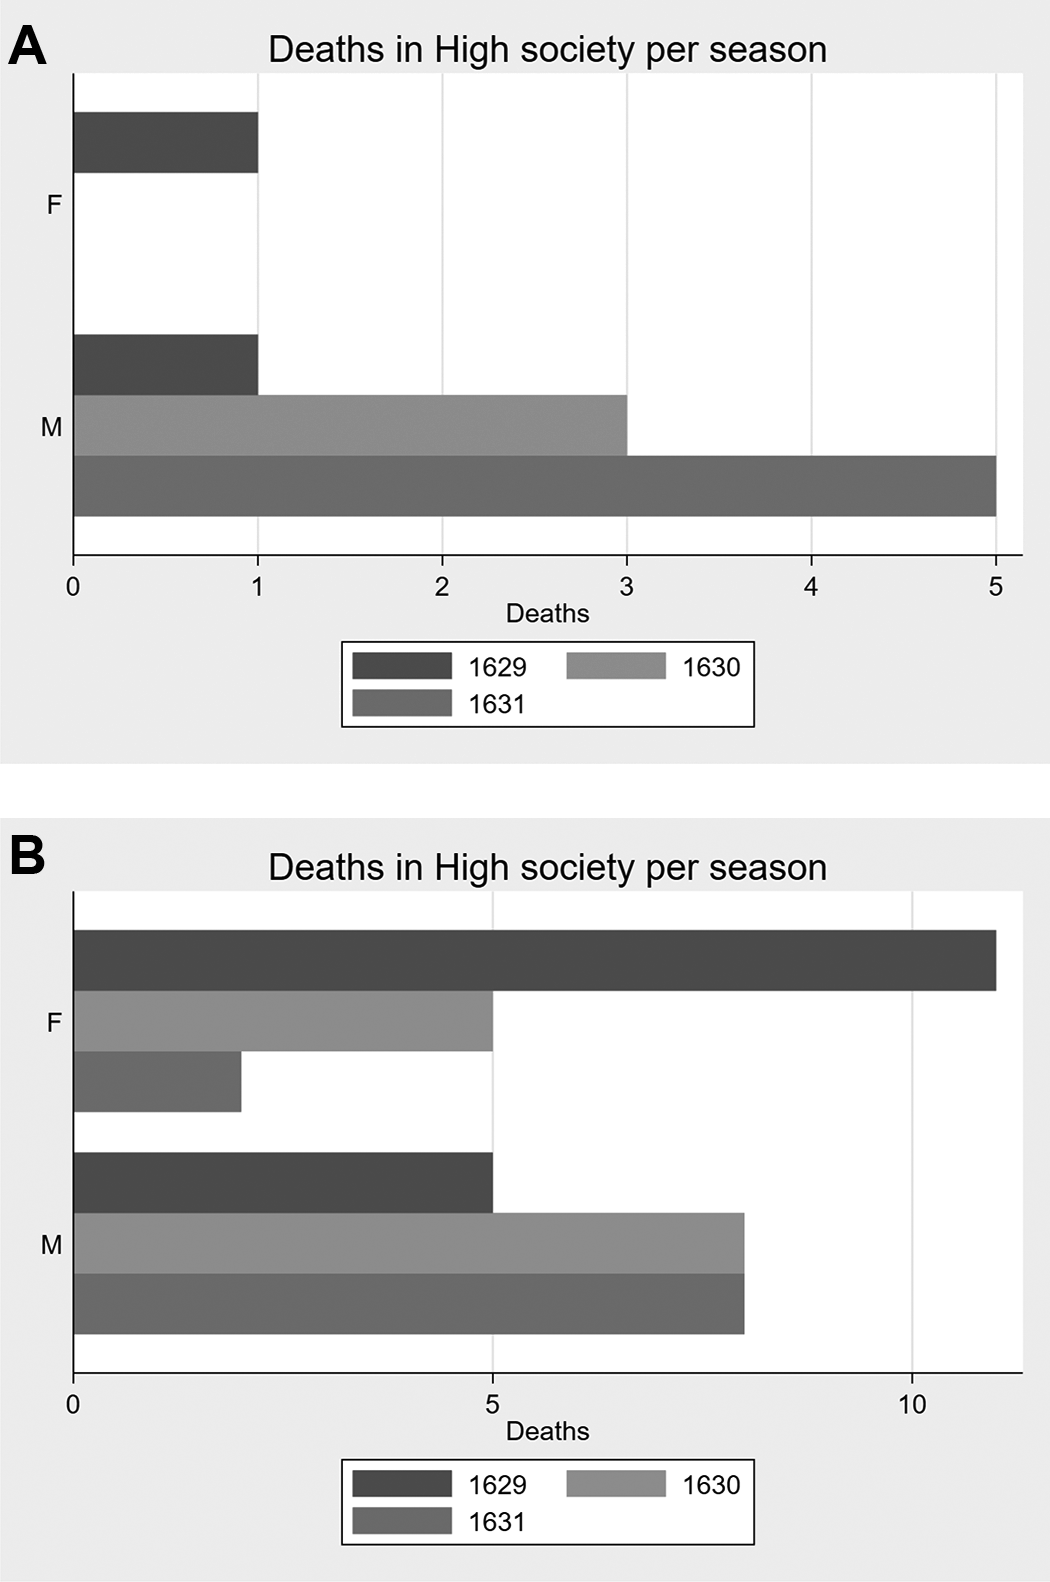
(A) Deaths of people belonging to high society, by year and gender. (B) Deaths of people belonging to high society, second operationalization, by year and gender.
We also proceed to a second operationalization of the idea of being part of the upper class. The Liber mortuorum reports when the whole reverendo capitolo, the reverend chapter, 38 i.e. the highest priesthood of the city, reunite to celebrate the funeral. This was of course a sign of respect from the Church, and one that in the years we are studying was probably a good proxy of the deceased’s belonging to the upper class of the city. This operationalization led us to a greater number of people; indeed, we found registers of forty-three different occasions in which the reverendo capitolo celebrated a funeral. The analysis of the frequencies, reported in Figure 11A, shows a greater frequency of dead women only in 1629. The males, on the other hand, count more casualties than women in 1631 especially. More generally, while the deaths of females have a negative trend over the three years, that for males goes in the opposite direction and rises. This result may be driven by the fact that, due to the mindset of the time, fewer women than men were seen to deserve this honor.
Finally, it is important to add a few historical details regarding these deaths. In order to understand how the disease arrived in Chioggia, a possible hint to be followed, although impossible to confirm, lies in the death of doctor Alvise Beltrame, one of those we determined as belonging to the upper class. He was twenty-three years old and came from Castiglione, a small town near Mantua. The literature suggests that this is the area from which the disease arrived in the Venetia area. 39 Thus he could be what we would now call the “patient zero” of the pandemic in this area.
On the subject of doctors, also of genealogical interest is the death of an entire family: that of doctor Mattio Mengati. His son Francesco died in 1629, his daughter Livia, died at the age of five on 23 July 1630, and his wife Leonella died at the age of thirty-two on 28 July, the same year. Both the latter two were buried in the church of Saint Nicolò. The doctor himself died on 4 August 1631, possibly after having given the plague to the rest of his family.
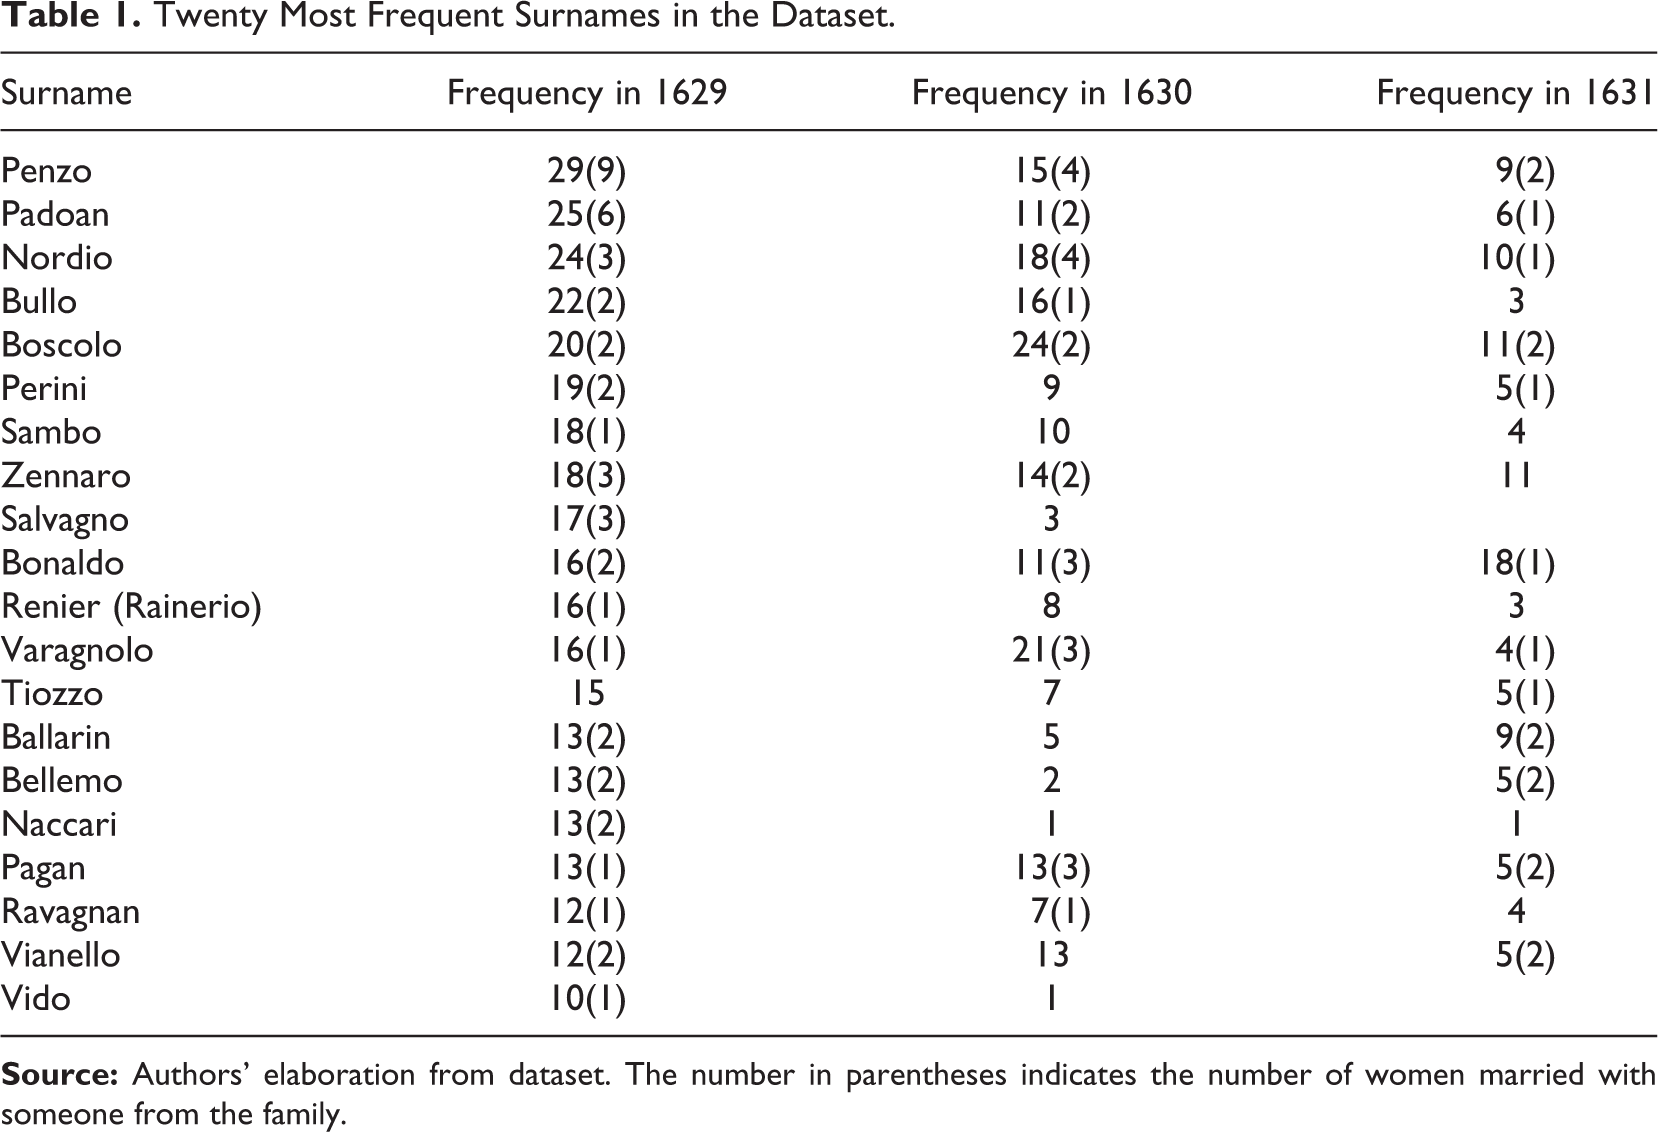
Finally, analyzing Table 1, which reports the twenty most frequent surnames in the data, we can determine that the first three, Penzo, Padoan, and Nordio, were probably very large families, since its frequency is very high. If we compare the list of surnames with those currently present in Chioggia, nowadays Boscolo is very common. Of course such an analysis is incredibly hard, since the survival-rate of surnames depends on many different variables, other than on a certain amount of luck. A tentative analysis of the frequencies in our data and in 2011 (most recent available data) is presented in Table 1, without any aim of being exhaustive or of inferring a causal relationship.
Twenty Most Frequent Surnames in the Dataset.
Conclusion
Pandemics have contributed to shaping the world as we know it. In human history, each pandemic represents a huge discontinuity, a border that allows us to distinguish between before and afterward. Due to the tremendous change that it entailed, the seventeenth-century plague pandemic also had a huge impact on history. Nevertheless, this impact may also be seen as the sum of many small changes in the family histories of hundreds of thousands of people.
In this study, we offered some insights into the characteristics of the deaths in Chioggia, a city in the Republic of Venice, during the worst years of the pandemic, namely 1629, 1630, and 1631. Our findings show how the difference in deaths may be due to social and demographic mechanisms underlying society at the time. Furthermore, a list of the twenty most common surnames was provided. It is interesting to note that the vast majority of these are no longer present in Chioggia today.
Future studies may focus on another city, studying the differences with Chioggia, or aim to extend the findings to the whole Venetia area.
Footnotes
Authors’ Note
Vincenzo Alfano is also affiliated with CES-ifo, Munich, Germany.
Declaration of Conflicting Interests
The author(s) declared no potential conflicts of interest with respect to the research, authorship, and/or publication of this article.
Funding
The author(s) received no financial support for the research, authorship, and/or publication of this article.