
Abstract
Background:
Age-related disability and lost independence currently plague one third of older Americans. Many causes of disability, lost muscle mass and bone mineral density, are modifiable with exercise. Most exemplary of successful aging are the Senior Olympians; this group of vital athletes exhibit persistently high levels of functional capacity.
Purpose:
This study describes demographic data, injury characteristics and the effect of aging on physical performance in senior athletes to identify key time points for intervention to address declining performance.
Study Design:
Cross-sectional study; Level of evidence, 4.
Methods:
Senior Olympians (>50 years) participating in the 2001 National Senior Olympic Games were surveyed for demographic and health characteristics. Age-related changes in physical performance were determined from mean winning performance times in track and field events. These were plotted against age and task for men and women. Analysis of variance and intergroup significance were analyzed using the Tukey procedure. Percentage performance change across events was compared. The 2001 National Senior Olympic Games results were compared with American track and field record holders.
Results:
Senior athletes' performance declined (male and female) approximately 3.4% per year over 35 years of competition—slowly from age 50 to 75 years and dramatically after age 75 years. Men showed no difference in decline of sprint and endurance events, whereas the decline in the sprint was greater than in endurance for women, especially after the age of 75 years.
Conclusion:
Even the healthiest examples of musculoskeletal aging experience significant performance declines around age 75 years. This may be a key time point for preventive intervention.
There is a relative paucity of research examining ways to slow or arrest the seemingly inevitable decline from vitality to disability that accompanies aging. The study of senior athletes may provide vital answers to this question, as research outcomes are less likely to be confounded by the variables of disuse or chronic disease. This group continues to exhibit high levels of functional capacity as well as quality of life throughout their life span.
This cross-sectional study evaluated senior athletes participating in the 2001 Summer National Senior Games—the Senior Olympics. Their winning performance times were compared with the American Masters track and field records. We documented the gradual change in physical capacity that occurs with aging.
Background
To date, research has focused on optimizing treatment of bone disease and trauma in the elderly. Little attention, however, has been paid to healthy bone aging, and there is currently no definition of a healthy skeletal system throughout the life span. The purpose of this large cross-sectional study was to examine performance decline with aging to identify key time points for intervention for prevention of lost independence.
Methods
Health Information Survey
All 10 000 participants in the National Senior Olympic Games, held in Baton Rouge, Louisiana, were invited to participate in the Health Information Survey. The survey was distributed to all registrants as part of the registration packet and collected during the course of the games at a booth in the exhibit area of the athletes’ village. All participants signed an informed consent form approved by the institutional review board. The booth was staffed at all times by physicians and research personnel who answered questions and reviewed the surveys for completeness.
The Health Information Survey was constructed specifically for this project and included general demographic information, medical and surgical history, drug/vitamin history including hormone replacement therapy, duration of training (hour/day/week/year), highest level of training/competition, personal best record in sport, fall history, musculoskeletal injury history, and the Short Form-36 (SF-36).
Statistical analysis included calculation of descriptive statistics. This included measures of central tendency (means, medians, other percentiles) and dispersion (SDs, ranges) for continuous data and frequency distributions for categorical variables. The characteristics of the athletes across sports (gender, age group, and race) were compared using a χ2 test for discrete data and appropriate parametric or nonparametric analysis of variance techniques for continuous data.
The Effect of Physical Performance on Aging
To determine the relationships between age, gender, performance times, and event types, performance versus age data were obtained from the National Senior Games Association for senior athletes participating in the 2001 Summer National Senior Olympic Games in Baton Rouge, Louisiana. The top 8 performance times from the track and field event finalists were divided into 5-year increments from ages 50 to 85 years. Data for athletes older than 90 years existed; however, the limited number of participants prohibited analysis. The mean performance times, per 5-year age interval, were plotted against age for men and women. Analysis of variance within each age group for both men and women was determined. The data were further analyzed using the Tukey procedure to determine whether there was a significant difference between the mean performance times of each age group. From this analysis, we were able to determine at what age the mean performance times became significantly different. Significance was set at P < .05 in all comparisons.
To answer the question of whether the performances across events differ with age and sex, the decline in performance (ie, percentage increase in mean time) per age group was calculated. The mean decline per year, over a 35-year period, from 50 to 85 years, was then determined by dividing the total percentage increase, in times, by 35 years. Because the Tukey procedure revealed a significant change in performance times at approximately 75 years of age, the percentage decline per year was further subanalyzed for the first 25 years (50–75 years old) of competition and the final 10 years (75–85 years old). Finally, the range of events was divided into sprint and endurance distances to observe differences in power versus endurance events.
Analysis of Record Performance Times: Masters Track and Field
To capture the performance of athletes with the maximum function for their ages, the Masters track and field records were analyzed. Athletes holding Masters records demonstrate the utmost capacity to overcome the difficulties of aging.
Results
Health Survey
General Information
A total of 2599 (1351 men and 1248 women) surveys were returned, which represented approximately 26% of all Senior Olympics participants. The mean age of participants was 67.76 years, more than 90% of all participants were white, 70% were married, approximately 80% had completed some college studies, and 32% held postgraduate degrees. More than 40% of the senior athletes continued to work in jobs they described as moderately active, whereas 46% were retired but not owing to health reasons (Figures 1–3). Many athletes reported a lifelong history of physical activity, including 95% participation in sports as teenagers and 85% as young adults.
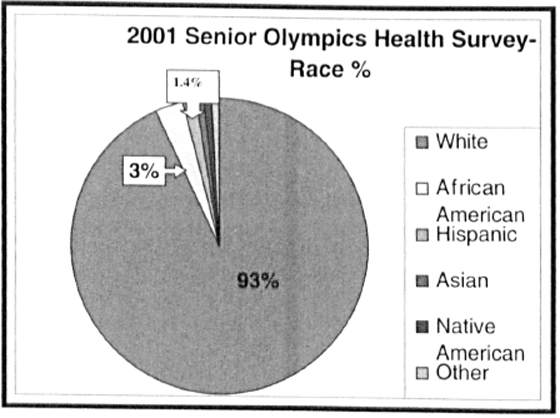
2001 Senior Olympics health survey: more than 90% of senior athletes were white.
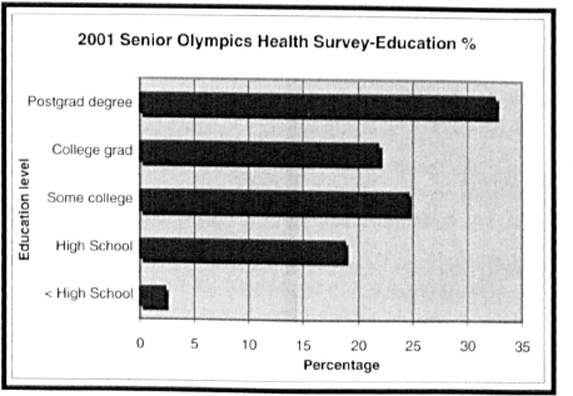
2001 Senior Olympics health survey: senior athlete education.
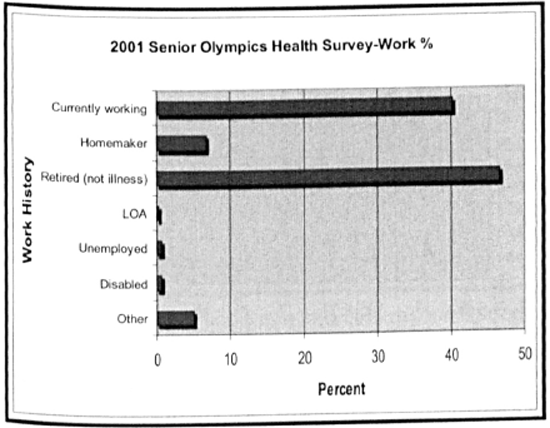
2001 Senior Olympics health survey: more than 40% of senior athletes continue to work, and those who are retired did not do so because of disability. LOA, leave of absence.
Comorbidities
When the athletes were asked about their health, the 3 most frequently reported comorbidities were low back pain (25.3%), hypertension (22.9%), and knee osteoarthritis (15.3%). Prior knee surgery was reported by 16.4% of the total population. Back surgery (4.6%) and hip surgery (1.2%) were reported less frequently (Figure 4).
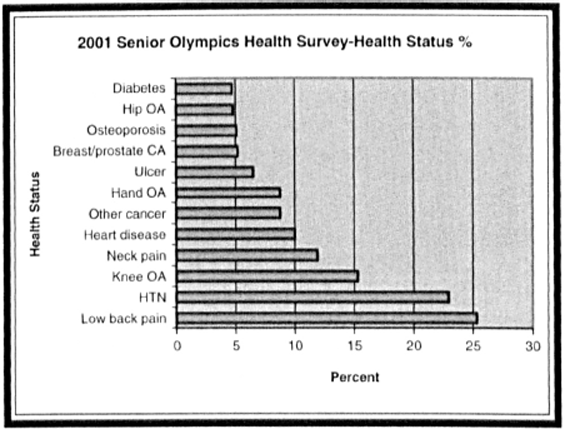
2001 Senior Olympics health survey: self-reported health comorbidities. CA, cancer; HTN, hypertension; OA, osteoarthritis.
Subjective Physical and Mental Health: SF-36
Relative to the US population norms, this sample of senior athletes reported better scores for each of the 8 SF-36 subscales. Physical and mental component summary scores that combine the 8 SF-36 scale scores into scores that represent physical and mental function, respectively, were also calculated. In the US population, these scores have a mean of 50 and an SD of 10. For men and women, respectively, the physical component summary scores were 52.2 (SD, 6.6) and 51.8 (SD, 7.1). The mental component summary scores were 56.3 (SD, 5.9) and 55.2 (SD, 6.2) for men and women, respectively. These physical and mental component summary scores indicate that, on average, the health status of men and women participating in the National Senior Olympic Games is above the US population average. On average, physical health of these senior athletes is two tenths of an SD above the US average, and mental health is approximately one half of an SD above the US average.
Performance Data
2001 Age and Gender Differences in Performance Times
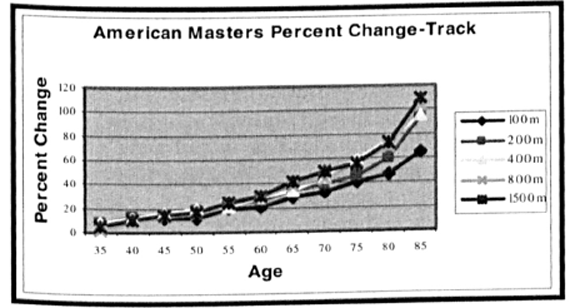
Figure 5 illustrates the male track and field running performance times with advancing age. Running times at all distances increased (performance decline) somewhat linearly until approximately 75 years of age, when performance times increased sharply. The same general trend was observed for women (Figure 6). For both men and women, the differences between age groups became significant (P < .05) at approximately 75 years of age. In both genders, the variability among the top 8 winning times in each 5-year age interval increased markedly with advancing age.
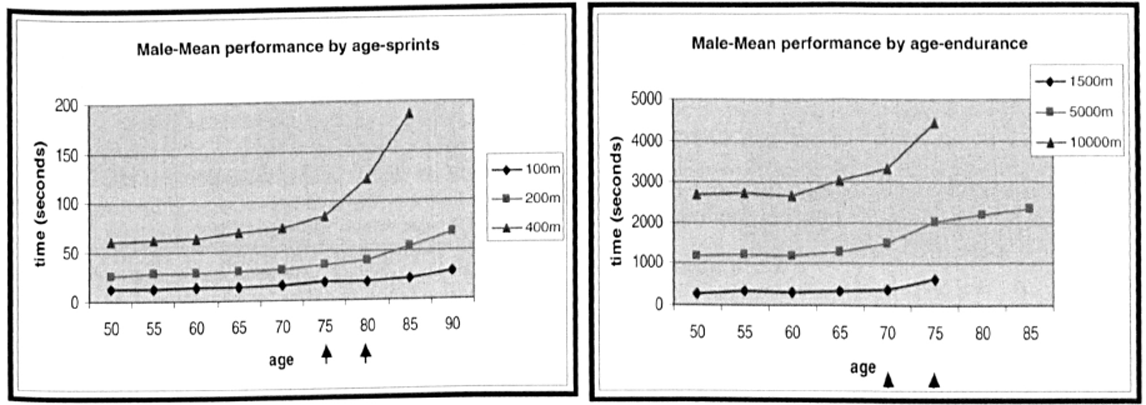
2001 Senior Olympics track performance data: male mean performance by age. Arrows indicate age at which performance times first became significantly (P < .05) different from those of the previous age group.
2001 Senior Olympics track performance data: female mean performance by age. Arrows indicate age at which performance times first became significantly (P < .05) different from those of the previous age group.
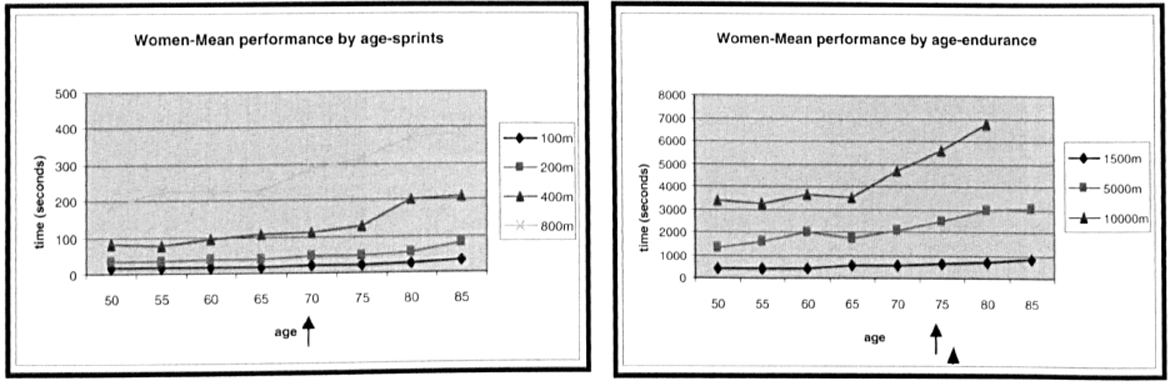
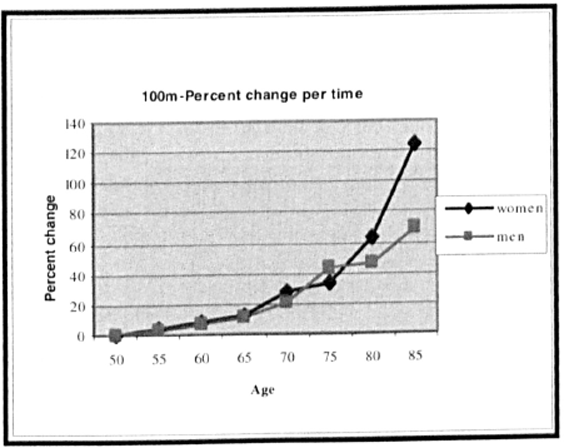
To more clearly define the changes in performance over time and event type, the percentage change in times between age groups, using the youngest group (50 years) as the baseline, was calculated for track and field events. Within each event, there was a significant difference in performance versus percentage change by age. Figure 7 is a typical graph. As expected, as with the mean performance versus age data, the differences between age groups became significant (P < .05) at approximately 75 years old. The total percentage change in performance over 35 years of competition versus gender and event was compared. The mean percentage increase per year, over 35 years, for all track distances did not differ significantly between men (3.44%) and women (3.36%). Using 75 years as the age when performance times increase significantly, the differences between the rate of change during the first 25 years of competition (ages 50–75 years) and the last 10 years (ages 75–85 years) were compared. The rate of decline was dramatically higher in the last 10 years of competition across all events (Figure 8). The mean decline in function was greater for women competing in sprint events than in the endurance events. This was especially true after the age of 75 years. This difference between sprint and endurance events was not apparent in male athletes.
2001 Senior Olympics track: typical graph of percentage performance change with age.
2001 Senior Olympics track: percentage change in performance times per year for all events. F/M 35, percentage change per event over 35 years of competition; F/M 50–75, percentage change per event from ages 50 to 75 years; F/M 75–85, percentage change per event from ages 75 to 85 years.
American Masters Track and Field Records: Age and Gender Differences in Performance Times
To capture the performance of athletes with the maximum function for their ages, the American Masters track and field records were analyzed as above. Athletes holding Masters records demonstrate the utmost capacity to overcome the difficulties of aging. As expected, the performance times and percentage change in performance times increased with age. Like their 2001 Senior Olympic Games counterparts, the American record holders experienced a progressively larger increase in performance times (performance declines) as they aged (Figure 9). Women's performance declined more rapidly than that of the men (3.31% vs 1.9% change per year over 50 years of competition, ages 35–85 years) (Figure 10). American records data were available for 50 years of competition. Between the ages of 30 and 50 years, there were minimal changes in percentage performance per year. Over the next 25 years (ages 50–75 years), the percentage change in performance per year continued to increase moderately (men, 1.46%/y; women, 2.52%/y), however, at a rate 3 times that seen during the years from 30 to 50 years old. After age 75 years, the rate of per-year performance decline between 75 and 85 years old increased dramatically (women, 10.29%; men, 4.1%). The rate of the women's performance declined 4 to 5 times faster per year than during the previous 25 years of competition. The rate of the men's performance declined 2 to 3 times faster per year during the same period.
Male American track and field record holders: percentage change in performance by age for all events.
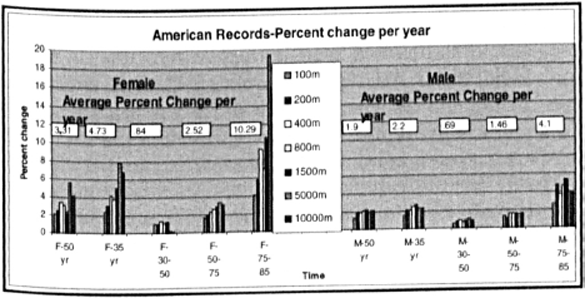
American track and field record holders: percentage change in performance times per year for all events. F/M 35, percentage change per event over 35 years of competition; F/M 50, percentage change per event over 50 years of competition; F/M 30–50, percentage change per event from ages 30 to 50 years; F/M 50–75, percentage change per event from ages 50 to 75 years; F/M 75–85, percentage change per event from ages 75 to 85 years.
Comparison of 2001 Senior Olympians and the Masters Track Record Holders
When comparing the American record holders and their 2001 Senior Olympics counterparts, the male athletes’ age-dependent decline in performance was not as great as seen in their 2001 senior games peers. When the percentage decline for each event over 35 years was averaged together, the male American record holders declined at a mean rate of 2.2% versus 3.46% per year for the 2001 senior games winners. Although the declines in performance were similar from ages 50 to 75 years, the 2001 winners declined approximately twice as fast as did the record holders after reaching 75 years old (7.86% vs 4.1%) (Figure 11). The same is not true for the female American record holders. This group demonstrated a greater decline than that seen in their 2001 counterparts; the mean percentage change in Performance over 35 years equaled 4.73% versus the 3.36% per year decline in performance seen in the 2001 group. The female American record holders declined at a mean rate of 4.73% per year over 35 years (ages 50–85 years) versus 3.36% per year for the 2001 senior games winners. From age 75 to 85 years, the female American record holders had a greater percentage decline per year over the senior athletes (10.29%/y vs 7.36%/y).
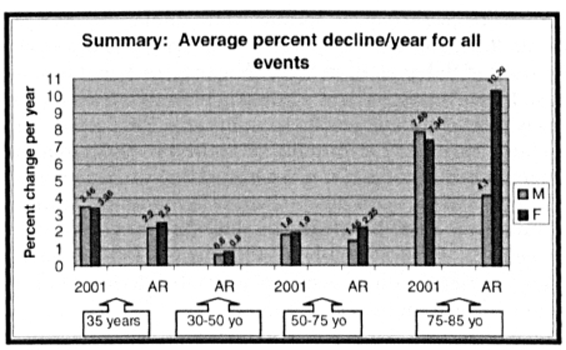
Comparison of mean percentage decline per year for all events: 2001 Olympians (2001) versus American record (AR) holders. F, female; M, male.
Discussion
In the past 15 years, incredible strides have been made toward understanding the positive effects of exercise on health and well-being as we age. As the baby boomers approach their 60th birthdays, the desire to live longer, healthier lives has become more prevalent. Perhaps most exemplary of successful aging are the Senior Olympians; this group of vital athletes exhibit persistently high levels of functional capacity as well as quality of life. To determine the natural history of primary (physiologic) aging, we looked to senior athletes, who are less likely to be confined by disuse or chronic disease.
Demographics
Senior Olympians are largely white, well educated, and middle class. They, therefore, are not a true representation of the aging population in general and may reflect the health benefits of their socioeconomic status. Most of the participants have been active throughout their life spans and report better physical and mental health than that of the general population. They are not, however, immune to chronic illnesses but are only better able to physically handle them.
Physical Performance: The Effect of Age, Gender, and Event Type on Performance
Performance times and percentage change in performance increased for both men and women over time. In track athletes, performance times are well maintained until age 50 years and then modestly decline until age 75 years, when performance plummets. This finding is supported by several other studies of senior athletes5, 6, 30, 31 and suggests that if disuse and disease are eliminated as confounding variables, seniors should be able to remain functionally independent until that age. The loss of independence before 70 to 75 years is most likely owing to the effects of disease, disuse, genetic predisposition, or destructive lifestyle habits. Knowledge of this tipping point, which may be earlier with less active individuals, has key implications for our aging population as the increased cost of care for seniors becoming sedentary is much greater than if these individuals remained active and independent. 34
Rates of performance decline were similar in male and female 2001 senior athletes. This similarity is supported by the work of Baker et al 1 in World Masters track and field athletes. Male American record holders, however, declined more slowly than did their female counterparts. This could reflect the large variability of winning times in the 2001 group. The faster performance decline in record-holding women may have a biologic basis or may reflect the smaller numbers of women continuing to compete in old age. Are they no longer able to compete, or do they simply decide that enough is enough? There are many examples of age-associated declines in activity in nature, from insects to humans.7, 16, 17, 28
In Senior Olympians, the rates of decline are more rapid in sprint races in both men and women. In record holders, rates of decline are greater in the endurance races. This was especially true in 75-year-old women but was less a trend in men. Several authors did not see distance- or time-dependent performance trends in running, 1 but in swimming, the sex differences were greatest in the sprints and smallest in the distances. 31 The differences we found between the way the 2001 Senior Olympians’ and American record holders’ performances changed with event type are reflective of the literature. Moore 23 reported a larger decline in performance in the sprint distances, and Stones and Kozma 29 found a larger decline in the endurance races. Two camps are evident in the literature—those postulating that age-related decline is greatest in sports that tax the body's energy resources more (“energy expenditure hypothesis”), such as sprints, versus those proposing that energy supply (needed in endurance races) is more important. Perhaps the mechanisms of decline are different for different sports depending on the specific demands of the event.
Factors Affecting Performance
Multiple age-related factors have been attributed to the functional decline seen in senior athletes. These include declines in training intensity, reaction time, joint mobility, skeletal size, body fat composition, anaerobic and aerobic power supply, recovery ability, strength, endurance, and coordination.1, 19–22, 26
Loss of Muscle Strength
In addition to the previously discussed loss of bone mineral density, a large component of lost independence is weakness secondary to loss of lean muscle mass, termed sarcopenia. Muscle power is lost at a greater rate than is endurance capacity: 3.5% versus 1.8% per year. 33 This may be a reason that aged sprinters have markedly shorter stride lengths (40% shorter) 10 and require a significantly higher number of strides to cover the same distance. In a longitudinal study of aging skeletal muscle in sedentary adults, Frontera et al 11 found a 14.7% decline in muscle cross-sectional area in men over a 12-year period. Several authors3, 11, 25 have documented increased fat infiltration into muscle with age in nonathletes. Although there is a clinical impression that the composition changes and muscle mass loss are associated with a functional decline, results have been inconsistent in the literature. Visser et al, 35 in conjunction with the National Institutes of Health ABC Study, recently documented an association between lower leg muscle mass and greater fat infiltration in the muscle with poorer lower extremity performance in older men and women. Their study examined healthy 70- to 79-year-old nonathletes. Baumgartner et al 2 found that elders with low muscle mass were 3 to 4 times more likely to report disability, have balance abnormalities, and use an assistive device for ambulation. Goodpaster et al14, 15 found that high fat infiltration into muscle was associated with poor knee extensor strength and decreased muscle contractility, muscle fiber recruitment, and muscle metabolism. A greater muscle fat content has also been associated with glucose intolerance and diabetes mellitus.13, 18 The issue is therefore not only loss of absolute muscle mass but loss of lean muscle mass.
On the positive side, however, muscle attenuation can be modified by physical exercise. 27 Even in people older than 90 years, the supposed age-dependent loss of muscle size and strength can be reversed by weight lifting. 9 The strength gains, however, were modest compared with those in young individuals.
Loss of absolute muscle mass is primarily owing to a decrease in the size of type II (fast-twitch) muscle fibers. Individual fibers shrink approximately 30% between the ages of 20 and 80 years. There is also a decline in the absolute number of muscle fibers. Paralleling the decline in performance seen in this study, muscle fiber number declines modestly until the age of 50 years and increases more rapidly thereafter. 33 The effect of lost type II fibers may be attenuated by the maintenance of type I (slow-twitch) muscle cells. These durable cells remain constant or may actually expand up to 20% with physical activity. The loss of muscle cells is thought to be secondary to age-related neural degeneration. Muscle cells require stimulation from motor nerve cells to live, and without it, they too atrophy. Resistance training has been found to halt the shrinkage of type II muscle fibers and increase their capillary blood supply.4, 24 In fact, studies have shown that aerobic exercise alone is not enough to maintain muscle mass. Only strength-trained seniors had muscle mass and composition similar to that of a young control group. Coggan et al 4 further found that only training intensity and duration affect muscle fiber distribution, not aging alone. All these factors point to the critical need for resistance training after the age of 50 years for maintenance of muscle strength and independence.
Loss of Endurance Capacity
Tanaka and Seals 32 demonstrated that the changes in endurance performance with aging are attributed to reductions in maximal oxygen uptake (VO2 max) and the decline in lactate threshold. VO2 max is the maximum energy production via oxidative pathways. It is dependent on heart rate, cardiac output, and tissue oxygen uptake. Reductions in the VO2 max are believed to be the primary reason for a decline in functional endurance with aging. The decline in VO2 max is cut in half by intense habitual exercise. This effect is thought to be owing primarily to maintenance of cardiac output. Men and women have relatively similar rates of VO2 max decline. As training levels decline, so does the VO2 max.
The lactate threshold is the exercise intensity at which lactate concentrations in the blood increase significantly. Several studies have implicated a lower lactate threshold in decreased performance.8, 12 It appears, however, that lactate threshold is more important in youth and young middle age, whereas VO2 max is more significant in later middle age.
Loss of Exercise Economy
Decreased joint motion, coordination, and flexibility contribute significantly to declines in exercise economy. As already discussed, aged sprinters have markedly shorter stride lengths than do their younger counterparts and may take up to twice the number of strides to cover the same distance. Although part of this may be the effect of lost muscle strength and power, the other important component is joint flexibility. Connective tissue is inherently stiffer with aging, and knee motion decreases up to 33% with aging from 123° to 95°. This means that the stride transition from swing phase to stance phase (the knee bent 90°) is near the maximum joint flexion in the senior athlete and slows the free leg's power to take the next step. 33 Flexibility also maintains the stretch/reflex response of muscle and thereby boosts speed. Finally, stretching may reduce delayed exercise soreness.
Summary: What Lessons can be Learned from Senior Athletes?
This study demonstrates that aging alone is not a reason for becoming inactive. Although chronic disease still exists in this population, senior athletes maintain active lifestyles and report a great sense of physical and mental well-being. The tipping point for this change in physical ability seems to center around 75 years old. This has important implications for Physicians and patients alike as we seek to prevent the balance between senior independence and disability from tipping toward disability.
One must be cautious in the use of this National Senior Games Association data for several reasons. First, the response rate for the survey was only 26% (N = 2599) of competitors participating in the 2001 Senior Olympics. Although this may change our subjective results, this would not change our objective performance finding with the use of the top 8 finishers of each race. Second, senior athletes are active individuals, likely not suffering from the effects of disuse and inactivity, thus making it difficult to parallel a general population.
Future Directions
Future clinical and translational research of senior athletes should focus on 3 areas: keeping the senior athlete competitive longer, sustaining the independence of seniors in the community, and monitoring not only the health status outcomes of these programs but their impact on health care resource use.
As always, data from cross-sectional studies must be considered with caution. Because we are not following the same people throughout their life spans, other factors besides physiologic aging may play a large role in the performance declines seen here. It is difficult to monitor the effect of self-selection, chronic illness, activity history, or genetic propensity in a cross-sectional study. Longitudinal studies of this population will clarify these confounding issues.
This study is the first step in understanding the role of exercise in prevention of disability in seniors. Examining the population of senior athletes who have slowed the disabling effects of aging will provide a valuable means for not only understanding this growing population but also designing preventive measures for the general population.