
Abstract
Lateral ankle sprains are among the most common orthopaedic injuries, estimated to occur at a rate of 1 injury per 10 000 people daily. 19 The disruption of the lateral ligament complex often leads to mechanical instability (ligamentous laxity), pain, swelling, peroneal muscle weakness, and neuromuscular dysfunction, leaving it particularly susceptible to further injury. 13 The result of these residual symptoms is often recurrent ankle sprains, which have been linked to an increased risk of osteoarthritis and articular degeneration.8,12
In 1965, Freeman et al 7 were the first to describe functional ankle instability (as opposed to mechanical instability) as a condition characterized by repeated episodes of the ankle “giving way” after an initial lateral ankle sprain event. They postulated that ankle instability was attributable to articular deafferentation after injury to the lateral ankle ligaments. Many researchers have studied this closed-loop mechanism of ankle instability.2,6,20,23 Most of this research has involved testing in static conditions, despite the fact that most injuries occur during dynamic activities (running, cutting, and landing). More importantly, the results of these studies are inconsistent. Regardless, it has become evident that these reflexive factors may not act quickly enough to prevent an ankle injury on their own, 21 implying that preparatory muscle activation, which occurs before a stimulus, is essential to providing dynamic stability to the joint. 11
While several studies have evaluated preparatory muscle activity in the knee, specifically with regard to anterior cruciate ligament injury,4,28,30 little research has focused on preactivation strategies at the ankle joint before jump landings, which represents a common injury scenario. Caulfield et al have conducted the majority of studies that have evaluated preactivation during jump landings in individuals with ankle instability.3,5 They found that those with ankle instability demonstrated reduced activation of the peroneal musculature before touchdown in several different landing techniques, which resulted in an increased amount of inversion of the ankle. Both factors could theoretically predispose individuals with ankle instability to repeated episodes of the ankle “giving way.” However, to date, no one has investigated both preparatory neuromuscular control and reflex responses to a perturbation in individuals with ankle instability. Proper functioning of the open-loop (feedforward/preparatory) and closed-loop (feedback/reactive) neuromuscular control systems is crucial for the maintenance of dynamic joint stability; therefore it is likely that dysfunction in both systems leads to ankle instability.
Comparing dynamic stability in individuals with ankle instability (AI group) to those who have suffered a lateral ankle sprain but did not develop ankle instability (LAS group) and uninjured controls (CON group) may help elucidate the pathologic changes behind ankle instability. The LAS group is understudied, but may represent a promising avenue to understanding how the nervous system can adapt after a lateral ankle sprain to maintain stability after damage to the ligamentous structures of the ankle. Identifying a successful open- and/or closed-loop compensatory neuromuscular strategy for dealing with a lateral ankle sprain may lead to the development of more appropriate treatment and rehabilitation protocols to promote adaptations that may reduce incidence of instability.
Therefore, the purpose of this study was to assess the preparatory and reactive muscle activation and kinematics in the 3 (AI, LAS, and CON) groups before and after landing on a supinating surface. Based on previous research, we hypothesized that the AI group would demonstrate altered preparatory neuromuscular control relative to the other 2 groups, which may predispose them to episodes of their ankle “giving way,” including reduced activation of the peroneus longus (PL) muscle and increased ankle inversion and plantar flexion before landing and after a perturbation.
Materials and Methods
Participants
A total of 45 (15 per group) active, otherwise healthy individuals (ages 18-30 years) were recruited from the university community to participate in the study. All participants provided written informed consent that was approved by the university’s Human Subjects Review Board (HSRB# 07-288). Participant demographics are presented in Table 1. To determine ankle health status and group, they were given a custom preparticipation questionnaire and the Cumberland Ankle Instability Tool (CAIT). The preparticipation questionnaires collected demographic information, ankle injury history and treatment, and sports/exercise activity level and type. The CAIT is a validated and reliable tool used to objectively measure the presence of ankle instability. 14 It consists of 9 questions that relate the symptoms of instability to different functional activities, such as walking, descending stairs, running, and hopping. All recruited individuals were asked to rate their feeling of instability or pain during these activities, and then a score was assigned based on the severity of the symptoms. Each question has a different possible score, but the maximum score obtainable in the CAIT is 30; the minimum is 0. Scores equal to or higher than 28 are defined as functionally stable ankles. Scores equal to or less than 24 constituted functionally unstable ankles. 14 Those whose CAIT scores were between 24 and 28 were excluded from the study. After administration of the questionnaires, a follow-up interview was conducted to verify/clarify the answers given.
Individuals with a history of ankle sprain who experienced repeated episodes of “giving way” and had a score of 24 or lower on the CAIT questionnaire were included in the AI group. Individuals in the LAS group had a history of ankle sprain but no reports of instability, and scored no lower than a 28 on the CAIT. The CON group was uninjured on either ankle and scored above a 28 on the CAIT questionnaire. For the LAS and AI groups, the more affected limb, as determined by the questionnaires, was used for testing. For all participants, if a more affected limb could not be determined (ie, equivalent CAIT scores), the test limb was designated randomly via a coin flip. All subjects were free from serious ankle injury (Grade 3 sprains, fractures) or any other orthopaedic lower limb injuries within the last 6 months before participation in the study. Participants reported for a single testing session that lasted approximately 2 hours.
Participant Demographics a
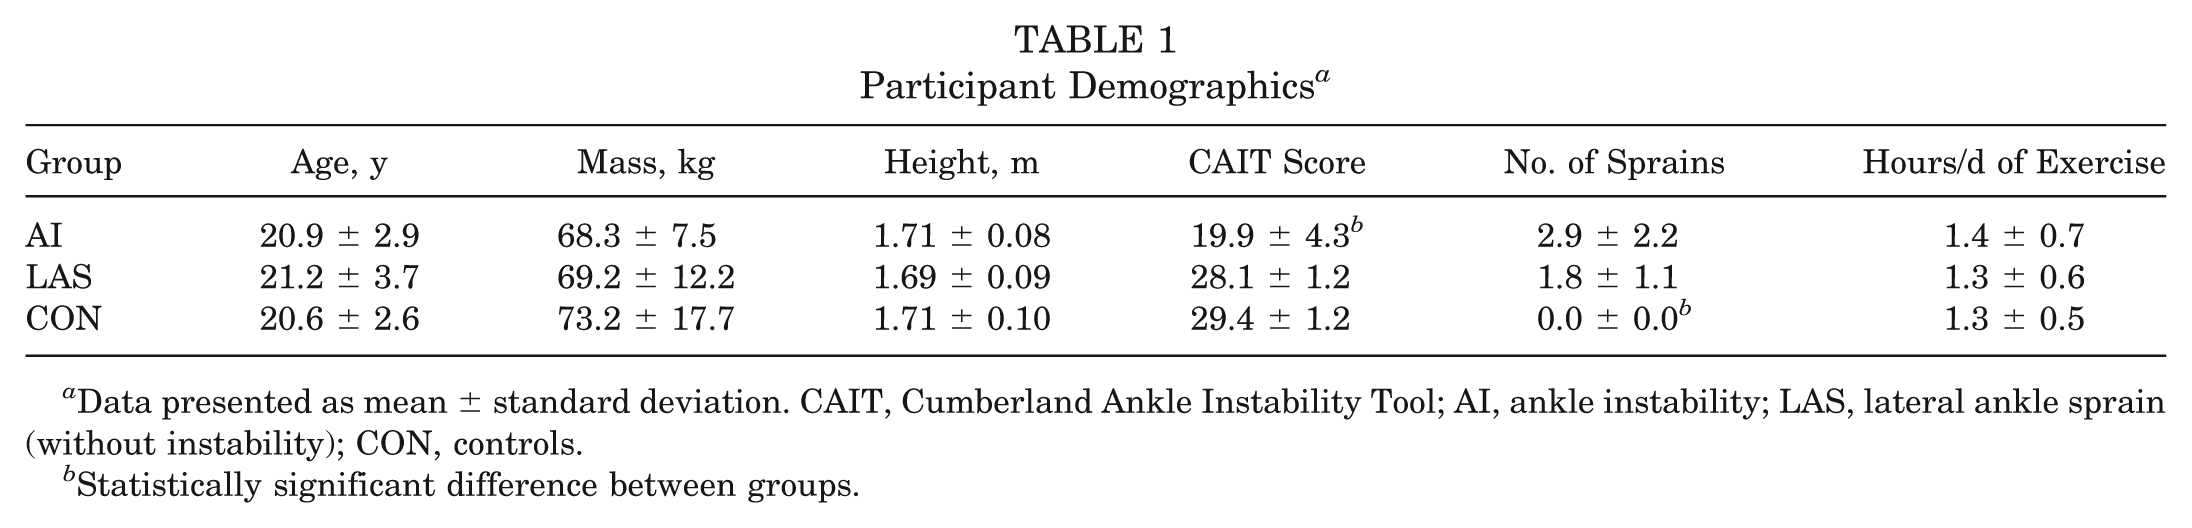
Data presented as mean ± standard deviation. CAIT, Cumberland Ankle Instability Tool; AI, ankle instability; LAS, lateral ankle sprain (without instability); CON, controls.
Statistically significant difference between groups.
Procedures
After completion of the questionnaires, participants were asked to warm up on a stationary bicycle for 5 minutes, followed by a measurement of ankle joint laxity using a custom ankle arthrometer (Blue Bay Research, Inc, Milton, Florida) (Figure 1). The arthrometer has been found to be a valid and reliable tool to measure laxity in the lateral ankle ligaments. 22 Instrumented measurement of total anterior displacement and inversion-eversion rotation of both ankles was performed on all participants. The arthrometer consists of an adjustable plate that was affixed to the foot, a load-measuring handle that is attached to the footplate through which the load is applied, and a tibial pad attached to the tibia. A 6 degrees of freedom spatial kinematic linkage system is connected between the tibial pad and the foot frame to measure the relative motion between the arthrometer footplate and the tibial pad. A custom software program written in LabVIEW 8.1 (National Instruments, Austin, Texas) controlled and recorded the anterior displacement (mm) and load (N), and inversion-eversion rotation (degrees of range of motion) and torque (Nmm). A second custom LabVIEW program was used to analyze and reduce the data to the following variables: anterior displacement (mm), anterior stiffness (N/mm), inversion and eversion rotation (deg), and inversion and eversion stiffness (Nmm/deg). Although these data were not an element of the inclusion criteria or a criterion for participant grouping, physiologic range of motion was measured to provide a more detailed description of the anatomic characteristics of our participant.
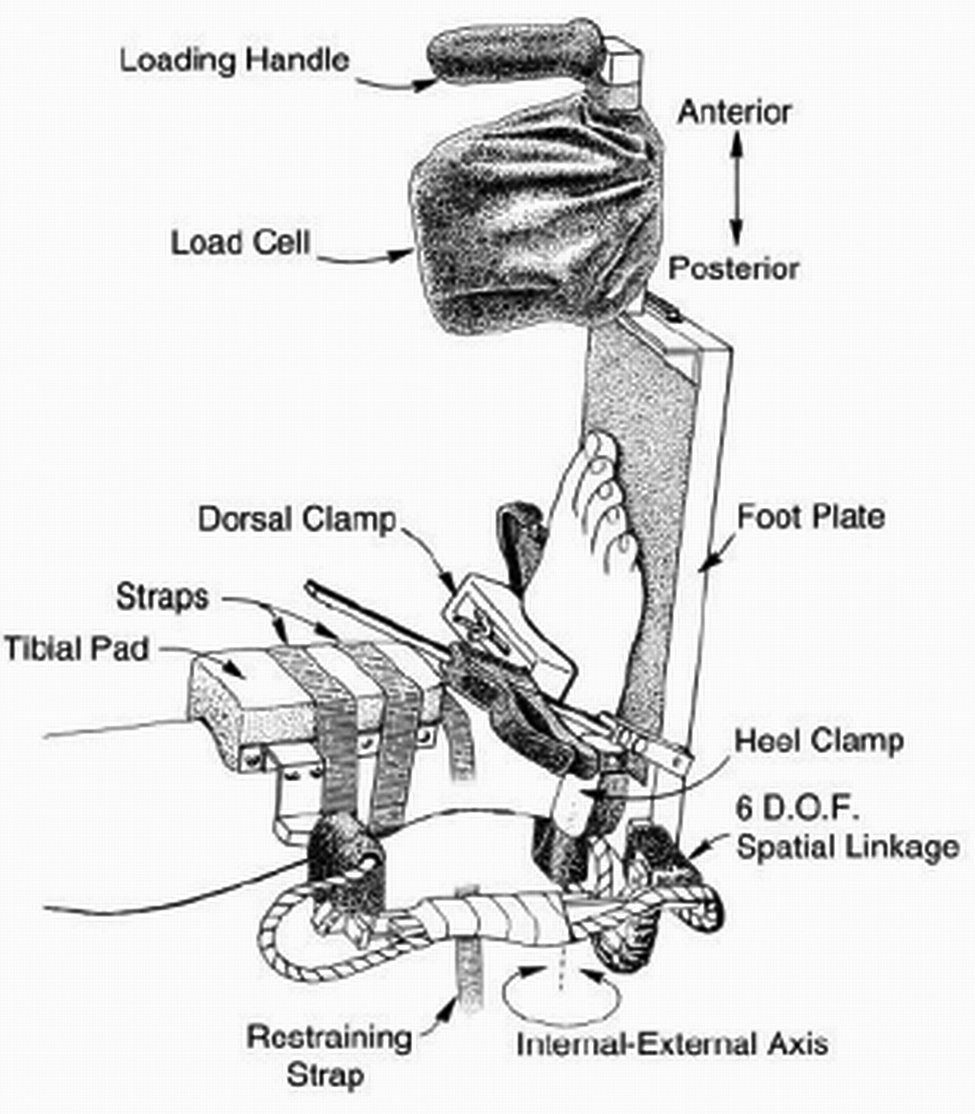
Diagram of a foot and ankle complex positioned in the ankle arthrometer. (Reprinted with permission from Kovaleski JE, Hollis J, Heitman RJ, Gurchiek LR, Pearsall AW 4th. Assessment of ankle-subtalar-joint-complex laxity using an instrumented ankle arthrometer: an experimental cadaveric investigation. J Athl Train. 2002;37:467-474.)
After ankle arthrometry, participants were equipped with electrodes on the tibialis anterior (TA) and PL muscle bellies on both legs. 26 Silver–silver chloride surface electrodes (interelectrode distance, 22 mm; electrode diameter, 33 mm), integrated with a differential preamplifier circuit, were placed on the skin over each muscle belly, such that the contact surfaces were aligned in parallel with the muscle fibers. To reduce impedance at the skin-electrode interface, the skin of each electrode site was shaved, abraded, and cleaned with isopropyl alcohol. A single reference electrode was placed on the skin over the spinous process of C7. A T42-8T 8-channel telemetered electromyographic (EMG) transmitter (Konigsburg Instruments Inc, Pasadena, California) was used for collection and all EMG data were sampled at 1200 Hz.
To conduct a 3-dimensional kinematic analysis, a motion analysis system, including 8 Eagle cameras (Motion Analysis Corp, Santa Rosa, California) operating at 120 Hz, was utilized. Retroreflective markers were placed directly on the skin of the lower extremities (bilaterally on the anterior superior iliac spine, thighs, medial and lateral knee joint lines, shanks, medial and lateral malleoli, calcanei, and second metatarsal heads, as well as a single sacral marker and an offset marker on the right posterior shank), to establish anatomic coordinate systems for the pelvis, thighs, shanks, and feet (Figure 2A). The medial markers were removed during dynamic trials. The marker set was customized to include both a proximal and distal calcaneal marker (Figure 2B) to better monitor foot motion, specifically in the frontal plane. The heel counters of several pairs of shoes were removed and holes were cut in the shoe so that rearfoot calcaneal markers could be fastened directly to the skin and allowed for unobstructed motion of the markers on the heel. All data were collected using EvaRT software (Version 5.1, Motion Analysis Corp) and imported into Visual3D (C-Motion Inc, Rockville, Maryland) for data reduction and analysis.

A, anterior view of modified Helen-Hayes marker set. B, posterior view of the modified Helen-Hayes marker set in neutral shoes, demonstrating the double heel marker placed directly on the skin via a cutout of the shoe’s heel counter.
For the drop-jump testing, participants were asked to drop off a 30-cm–high take-off platform and land with both feet, with their test leg contacting the supinating device approximately 30 cm away in the anterior direction. The experimental set-up and supinating device are pictured in Figure 3, while a more detailed description is provided elsewhere. 10 Participants were asked to visually spot their landing on the platform, land with both feet simultaneously, and then perform a vertical leap “as high and as fast as possible” after touchdown. The width of the base of support was standardized at shoulder width apart during landing. The resultant vertical jump height was measured using a Vertec (Sports Imports, Columbus, Ohio) jump trainer. This not only provided a measure of jump height, but also served as a goal for the participants to reach for and made the task more functional (ie, the landing was not the end of the task). To help familiarize the participants with the protocol, they initially performed the maneuver twice with knowledge of the condition; once without the platform supinating and once with the platform supinating. This was done to allow the participants to experience the perturbation while anticipating it, which assured them that the risk of injury was minimal, thereby encouraging them to perform the task as naturally as possible. Data were collected during these “known” familiarization trials.

The supinating device and experimental set-up. The supinating device is pictured in the neutral (a and c) and supinated (b and d) positions. A representative participant is pictured in the experimental set-up (before the drop jump) from anterior (e) and lateral (f) views. (Adapted with permission from Gutierrez GM, Kaminski T. A novel dynamic ankle-supinating device. J Appl Biomech. 2010;26(1):114-121.)
Once the participant was comfortable with the device and experimental set-up, 20 consecutive trials were performed. Of the 22 total trials (including the 2 familiarization trials), only 12 were used for analysis, while the other 10 served as dummy trials. The 12 trials were categorized by condition (supinating vs nonsupinating) and type (known vs unknown) equally. Thus, the 12 analyzed trials consisted of 3 known, nonsupinating trials; 3 known, supinating trials; 3 unknown, nonsupinating trials; and 3 unknown, supinating trials. The dummy trials were presented to the participant as unknown, nonsupinating trials. The order of the trials was standardized (Table 2), but unknown to the participant. Participants were informed that the order was randomized. The standardization and dummy trials were crucial to minimizing habituation to the perturbation by ensuring that at least 3 nonsupinating trials were presented between each supinating trial. The “known” trials were evaluated, but were not the primary aim of this work, thus no hypotheses were made.
Order of Trial Presentation a

Dummy trials were presented as unknown, nonsupinating trials.
Data Reduction
The supinating device was placed over a force plate, which served the dual purpose of triggering the device to rotate (when switched on during the supinating trials) and to assist in the determination of touchdown. Touchdown was defined as the initiation of the vertical ground-reaction force, calculated as 2 standard deviations above baseline noise, and was visually verified in the Visual3D software. The preparatory time period was defined as 200 milliseconds before touchdown, while the reactive time period was defined as 200 milliseconds after the instant of touchdown. All EMG data were band-pass–filtered (second order, zero lag, Butterworth filter, with cutoff frequencies of 20 Hz and 300 Hz), rectified, and smoothed with a low-pass filter (second order, zero lag, Butterworth filter, with a cutoff frequency of 7 Hz). The EMG data were normalized to the maximum activity during the unknown, nonsupinating trials in each respective muscle. Preparatory and reactive EMG areas and ensemble EMG patterns for the pretouchdown and posttouchdown phases were calculated. Ankle joint angles were calculated using the Visual3D software.
Statistical Analysis
To evaluate the homogeneity of our participant groups, a 1-way between-subjects (group) multivariate analysis of variance (MANOVA) was performed. The following dependent variables were included in the analysis: participant age, height, mass, CAIT score, number of sprains, hours of sports/exercise participation per week, and displacement/stiffness measures from the arthrometer (anterior displacement, anterior stiffness, inversion rotation, inversion stiffness, eversion rotation, and eversion stiffness).
Kinematic and EMG variables were analyzed using a 3 × 2 (group × condition) mixed MANOVA using data from the unknown trials. The dependent variables for this analysis included the preparatory (pretouchdown PL and TA EMG area, and ankle inversion and plantar flexion angle at touchdown) and reactive (posttouchdown PL and TA EMG area, and maximum ankle plantar flexion, adduction, and inversion angles after touchdown) muscle activity and kinematics. Tukey post hoc comparisons were performed when necessary. For all statistical analyses, the significance level was set at P = .05.
A priori power was assessed for the proposed MANOVA using the GPower 3.0 program. For the power analysis, the significance level was set to P = .05, with an effect size of 0.25, and power set at 0.80. Results from the power analysis showed that 45 cases (15 per group) would be necessary for sufficient power for the multivariate tests.
Results
The 1-way MANOVA revealed a significant main effect for group (F2,42 = 12.437; P < .001). Univariate tests demonstrated there were no significant differences between groups in terms of demographics, amount of time participating in sports/exercise, or in ankle laxity measures (P > .05). The significant differences between groups were noted in CAIT scores (F2,42 = 55.413; P < .001) and number of sprains (F2,42 = 15.785; P < .001). Not surprisingly, based on our inclusion criteria for groups, AI subjects had a significantly lower CAIT score than the LAS and CON groups, while CON subjects had suffered significantly less ankle sprains (none) relative to the LAS and AI groups. Participant demographics and ankle arthrometry data are presented in Tables 1 and 3, respectively.
Arthrometric Data a

Data presented as mean ± standard deviation. No statistically significant differences were noted between groups. AI, ankle instability; LAS, lateral ankle sprain (without instability); CON, controls.
The 3 × 2 (group × condition) mixed MANOVA revealed a significant condition main effect (F9,34 = 13.389; P < .001), where significant increases were noted in the posttouchdown (reactive) time period in the supinating condition for PL reactive EMG area (F1,42 = 12.133; P = .001), maximum ankle plantar flexion (F1,42 = 71.287; P < .001), adduction (F1,42 = 25.536; P <.001), and inversion (F1,42 =0.290; P < .001). Specifically, the device, when triggered, created increased ankle plantar flexion, adduction, and inversion in all participants, which resulted in an increased reactive activation of the PL muscle—a typical reflex response. 14 Preparatory PL and TA EMG area, ensemble EMG patterns for the PL and TA, and ankle kinematic patterns are depicted in Figures 4, 5, and 6, respectively.
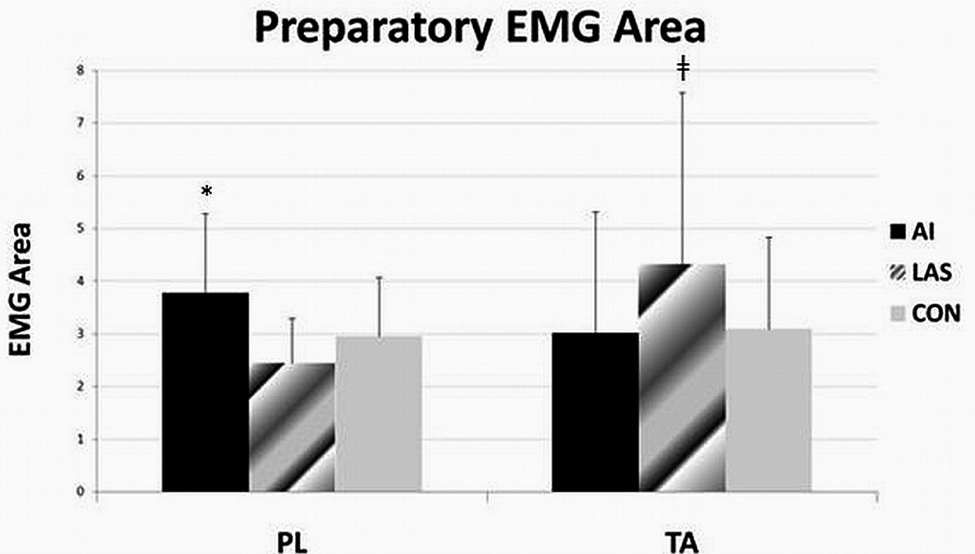
Preparatory electromyographic area for the posterior longus (PL) and tibialis anterior (TA) muscles. Error bars denote standard deviation. *Indicates P < .05; ‡ indicates P < .10.

Ensemble EMG patterns for the posterior longus (PL, top) and tibialis anterior (TA, bottom) muscles depicted from 200 milliseconds before touchdown to 500 milliseconds after touchdown. The solid lines represent the nonsupinating trials, while the dashed lines represent the supinating trials. The lateral ankle sprain (LAS) group demonstrated an increased preparatory TA activation and an earlier long-latency response (LLR) to the perturbation in the PL (approximately 100 milliseconds after touchdown).

Graphical representation of ankle kinematics, including dorsiflexion/plantar flexion (top), adduction/abduction (middle), and inversion/eversion (bottom) depicted from 200 milliseconds before touchdown to 500 milliseconds after touchdown. The solid lines represent the nonsupinating trials, while the dashed lines represent the supinating trials. The device caused increased plantar flexion, abduction, and inversion of the ankle in the supinating trials beginning at 50 milliseconds after touchdown.
Discussion
Participant Characteristics
Statistical analysis revealed that all 3 participant groups were similar in terms of demographics and activity levels, indicating homogeneous groups. Answers on the preparticipation questionnaire revealed the types of sporting/exercise activities were similar between groups, including highly dynamic sports that have a high ankle injury risk (soccer, volleyball, basketball, football, and lacrosse), sports that have a low ankle injury risk (swimming and rowing), and strictly exercise-only activities (running, weight lifting, and elliptical). Surprisingly, the 3 participant groups were not different in terms of ankle laxity (Table 3). It has been reported that on average there is greater laxity present in unstable ankles than in those without symptoms of ankle instability.15,16 However, while it has been reported that there is a correlation between measures of functional and mechanical instability, it has also become clear that hypomobility may be as much of a concern as hypermobility. 17 Upon inspection of the individual participant data, there was a large amount of variability, indicating both hypomobile and hypermobile participants in all 3 groups, leading to the statistical similarity between groups.
Ankle Supinating Device
The effect of the ankle supinating device is evident upon inspection of the ankle kinematics (Figure 6), as well as the statistical analyses. The kinematic patterns are altered from 50 to 500 milliseconds after touchdown. The perturbation caused increased ankle plantar flexion, adduction, and inversion—which combined are ankle supination—simulating the mechanism of a lateral ankle sprain. Subjective feedback indicated that after the familiarization period, they felt safe, albeit abnormal, while landing on the device. On average, at 200 milliseconds after touchdown, the platform caused approximately 5° of ankle plantar flexion, 8° of ankle adduction, and 4.5° of ankle inversion. The motion would best be described as a mild supination of the ankle, but judging by the muscle activations, it was enough to stretch the PL muscle and cause a reflex contraction. Similar to the findings of Gruneberg et al, 9 the only published work evaluating landings on an inverting surface, the peroneal musculature was more active in the supinating condition relative to the nonsupinating condition. This rise in activity represents a reactive response, superimposed on the preprogrammed muscle activations, to landing on a supinating platform that is part of a complex balance correction strategy aimed at providing stability in the frontal plane after a perturbation. 9
Open-Loop (Preparatory) Neuromuscular Control
While there was no significant multivariate group main effect, there are interesting differences in EMG patterns and ankle kinematics worthy of discussion. Upon evaluation of the univariate tests, it was noted that the AI group had significantly more activity of the PL before touchdown (P = .009; Figure 2) than the other 2 groups. This resulted in a less inverted position of the ankle at touchdown (Figure 6). Further, although falling into the realm of closed-loop control, these individuals also demonstrated greater PL activation after touchdown as well (P = .017). It appears the AI group participants were guarding themselves throughout the testing protocol (increased PL activation leading to reduced inversion at touchdown), potentially to reduce the potential for injury during a subjectively high-risk activity.
These findings are in direct contradiction to previously published reports.3,5 Both prior studies reported a decreased preparatory activation of the PL, resulting in a more inverted position of the ankle, in a group of individuals with ankle instability relative to a group of uninjured controls. There are several methodologic differences between the studies mentioned and the present one, which may explain the difference in findings. First, the inclusion criteria used to define their subject groups were different than what was used in this study (based on subjective clinical evaluation vs using CAIT score). Second, they evaluated single-leg landings, as opposed to double-leg landings. The dynamic restraint requirements of these 2 tasks are very different because of the role of the contralateral limb in aiding the maintenance of stability during landings. However, the most significant difference is the fact that those testing protocols did not utilize any perturbation; they simply asked participants to land from different jumps onto level ground. In our study, participants were aware they were landing on a device that was designed to simulate the mechanism of an ankle sprain, thus it is likely the AI group participants were acting in a protective manner throughout testing to avoid potential injury. These findings suggest that while these individuals may not activate those muscles appropriately during situations they may consider “safe,” when a potentially injurious situation is presented they can still maintain dynamic joint stability. This indicates these individuals have the potential to be trained to activate these muscles appropriately when necessary.
Separately, the LAS group differed in their neuromuscular control patterns from the other 2 groups. There was a trend (P = .079) toward a larger preparatory TA EMG area in the LAS group relative to the other 2 groups (Figure 4 and 5) leading to a less plantar flexed ankle (and thus more close-packed ankle mortise because of the relative shape of the talar dome) at touchdown in those participants (Figure 6). The stronger eccentric action of the TA may be able to reduce the amount of plantar flexion during a forced supination of the rearfoot and thus help prevent injury to the lateral ankle ligaments. 29 It must also be noted that the increased preparatory TA activation resulted in a more inverted position of the ankle before touchdown—a pattern similar to that described in previous studies for individuals with ankle instability.3,5 It cannot be understated that the TA has a dual role in the ankle as both an invertor and dorsiflexor, making its role in the maintenance of lateral ankle stability somewhat conflicting. Regardless, it is possible that the LAS participants have “learned” to keep their ankle in a less plantar flexed position during landings, even if that entails a more inverted ankle position, to help maintain ankle stability. If this is the case, impact would need to be absorbed at other joints (knee, hip, spine, etc), which suggests a need to study the role of other joints in dynamic ankle stability.
The peroneal muscles are the primary muscles that protect against lateral ankle injury via their eccentric action providing lateral stabilization of the ankle. 1 Palmieri-Smith et al 25 recently reported that arthrogenic muscle inhibition was present in the peroneals of individuals with ankle instability; however, that was not related to the dynamic muscle activation during gait when presented with an inversion perturbation. While they suggest dynamic muscle activation of the peroneals must be restored after injury to help maintain ankle stability, they also suggest that reducing arthrogenic muscle inhibition may not protect the ankle from further episodes of giving way. Instead, it has been hypothesized that the primary issue in ankle instability is not a depressed activation of the peroneal musculature, but instead a selective inhibition of the ankle joint invertors, including the TA. 11 Selective inhibition is when the decreased stress tolerance of an injured joint triggers a reflexive inhibition that affects muscles that are capable of increasing tensile stress on the damaged ligaments. 31 It follows that the invertors would be inhibited after lateral ankle joint injury because they initiate movement in the same direction as the initial injury. Concomitantly, it has been found that dorsiflexion strength is reduced in persons with ankle instability,27,32 which may limit their ability to dorsiflex before landing. Wilkerson et al 32 postulated that in the closed kinetic chain (foot fixed to the ground), the ankle invertors become very important to the maintenance of postural stability over the foot. This is evident when the center of mass moves laterally past the lateral border of the fixed foot, causing the shank to move laterally and resulting in closed chain eversion. In these situations, the eccentric action of the invertor muscles keeps the medial edge of the foot firmly planted, which would prevent the lateral border from becoming a fulcrum about which the ankle turns.
Perhaps the compensatory strategy for the LAS group is an increased activation of the TA muscle to prepare for a situation where the center of pressure will be moving laterally past the lateral border of the foot once the kinetic chain is closed. Typically, upon landing from a jump on a stable surface, the foot is forced into dorsiflexion, abduction, and eversion, which may move the center of pressure laterally. Recent research has found a similar AI group demonstrated a more laterally situated center of pressure than the LAS group during running gait. 24 Therefore, the role of the TA in maintaining frontal plane joint stability, specifically in preparation for a lateral center of pressure trajectory, during dynamic tasks is significant. Future research should include kinetic analyses of the center of pressure during jump landings in individuals with ankle instability to monitor how well they control the center of pressure, specifically in the medial-lateral direction. The role of the TA in providing dynamic stability to the ankle joint requires further attention.
Closed-Loop (Reactive) Neuromuscular Control
Contrary to our hypotheses, there were no statistically significant group differences for the AI group relative to the other 2 groups in terms of reactive neuromuscular control strategies. There is little work available concerning the reflex/reactive muscle responses to a perturbation in a group of individuals with ankle instability during dynamic conditions. In static experiments, there are mixed results concerning the stretch reflex response in individuals with ankle instability.2,6,20,23 Specifically, there is controversy concerning whether there is a delay or a reduced amplitude of the reflex response in these individuals. This reflex response is typically divided into 3 distinct responses: short-latency (SLR, 40-70 milliseconds after stimulus), medium-latency (MLR, 70-100 milliseconds after stimulus), and long-latency (LLR, >100 milliseconds after stimulus) responses. 18 It is difficult to separate the stretch reflex responses from the preprogrammed posttouchdown activation already present during landings. However, typically these responses become evident when averaging over multiple trials. Upon further inspection of the ensemble EMG patterns of the PL (Figure 5), 2 distinct bursts of activity are present—one 40 to 100 milliseconds after touchdown and another 100 to 200 milliseconds after touchdown. The first burst most likely encompasses both the SLR and MLR, while the second burst likely represents the LLR, based on the timing of those responses. 18 It is clear that the LAS group activates the LLR sooner than the CON and AI groups. This supports a control strategy (including increased inversion and dorsiflexion and appropriate muscle activations during landings) aimed at compensation after an inversion injury in the LAS group. Perhaps the LLR of the PL happens quicker in the LAS group, which allows them to control dynamic stability in the frontal plane during an inversion movement. This may allow them to handle the increased inversion before landing, because of increased TA activity aimed at producing a less plantar flexed position. Meanwhile, the other 2 groups demonstrate little change in this response, perhaps predisposing them to injury when faced with perturbations. This alteration indicates motor learning in the LAS group at the supraspinal level to promote dynamic restraint and prevent further insult. The LLR in both the AI and LAS group deserves further investigation.
Limitations
The major limitation of this work is that participants were aware their ankle could be subjected to an unexpected perturbation. Although no statistical tests were performed on the data from the “known” trials, upon inspection of the EMG ensemble curves and kinematics, it was clear that, on average, participants were behaving similarly in all trials, including those in which they were informed that no perturbation would take place (known, nonsupinating trials). Upon subjective questioning after the testing, it became apparent that all participants maintained a consistent anxiety level throughout testing, with some highly anxious and others generally unconcerned. Further, aiming to maintain safe conditions, where volunteers would not face significant risk of actual injury, leads to a reduced perturbation intensity. While the device does simulate the mechanism of a lateral ankle sprain, this occurs well within a safe range and thus the reflex responses noted are not the same as would be present during a potentially injurious perturbation. Injuries typically happen unexpectedly, thus monitoring participants when they know a perturbation may happen might not truly represent their neuromuscular control patterns before or during an actual incident of injury. All findings must be tempered with these caveats in mind. Another limitation lies in the participant groups and inclusion criteria. Because of the subjective nature of the condition and the inherent difficulty in quantifying instability, it is possible that individuals in our study groups do not represent the neuromuscular control strategies noted in similarly categorized groups in other research studies. Further, we did not control for rehabilitation after previous ankle sprains in the LAS or AI groups, which may have accounted for our contradictory findings. As with all retrospective work, it is unknown whether individuals who develop ankle instability presented with improper neuromuscular control strategies before suffering their first lateral ankle sprain. Finally, classification of participants relied primarily on subjective information, which is not as controlled as one would desire in an experimental design.
Conclusion
We evaluated preparatory and reactive neuromuscular control strategies during landings with simulated ankle sprains in 3 groups: those with and without ankle instability and uninjured controls. Contrary to our hypotheses and previously published research, the group with ankle instability presented with an increased activity of the peroneals, which may be a protective strategy used during a testing protocol in which they knew they might be perturbed during landing. On the other hand, the group without instability demonstrated greater activation of the tibialis anterior muscle, which resulted in a more inverted, but also a less plantar flexed, position of the ankle at landing. This may be another protective strategy aimed at keeping the ankle in a more close-packed position. Perhaps individuals with ankle instability do not alter their dynamic control strategies after a lateral ankle sprain to compensate for damage to the lateral ligaments after injury, while those without instability do and thus do not suffer episodes of the ankle “giving way.”
Footnotes
Acknowledgements
We acknowledge Matt Hinsey, MS, ATC, and Brittany Kozitzky for helping collect and process the data for this project. We also thank Dr Thomas Buchanan, PhD, for allowing us to modify and utilize the supinating device.
The authors declared that they have no conflicts of interest in the authorship and publication of this contribution.