
Abstract
Background:
Anterior cruciate ligament (ACL) reconstruction tunnel placement is often evaluated by radiographs. This study examines the interobserver reliability of various radiographic measurements of ACL tunnels.
Hypothesis:
When ideal radiographic views are obtained, the interobserver reliability of the measurements among experienced surgeons would be good to excellent.
Study Design:
Descriptive laboratory study.
Methods:
Tunnels for single-bundle ACL reconstruction were drilled and filled with metal interference screws or a tibial reamer on 73 cadaveric knees. Ideal fluoroscopic radiographs were obtained. Three independent reviewers performed 18 measurements including a modification of the grid method. For the grid method analysis, reviewers fit a 16 × 12 grid to the lateral knee radiograph, and the center of the femoral tunnel was marked. Interobserver reliability of the measurements was performed using intraclass correlation coefficients (ICCs). A precision grouping analysis was performed for the grid measurements to calculate the mean radius and standard deviation grouping distances.
Results:
The ICCs were excellent (>.75) for the tibial tunnel angles and tunnel measurements, the clock face measurement, and the Aglietti et al and Jonsson et al measurements. The ICCs were good (.4-.75) for an estimation of graft impingement, Harner et al measurements, and notch height. The mean radius for grid measurements was 0.6 ± 0.4 units (range, 0-2.36 units), with each unit being 1 box in the 16 × 12 grid. When a circle was constructed with a 1.3-unit radius, 95% of the 3 surgeons’ measurements would be included in the area of that circle.
Conclusion:
Reliability of ACL tunnel measurements was good to excellent under ideal circumstances for the majority of measurements. The modified grid method demonstrated very acceptable reliability.
Clinical Relevance:
Measurements with good to excellent reliability can be used to evaluate ACL tunnel placement when ideal radiographic views are obtained.
Anterior cruciate ligament (ACL) reconstruction is one of the most common orthopaedic procedures. 5 Rerupture rates at a minimum of 5 years’ follow-up are estimated to be 5.8%. 21 Revision surgery is more difficult to perform and adds a substantial cost to health care expenditures. It is important to better understand why ACL reconstruction fails and to develop measures for prevention.
Anterior cruciate ligament reconstruction failure has been postulated to occur by various causes including graft failure, fixation failure, secondary instability of the knee, and surgical error. 11 Inaccurate tunnel placement is thought to be one of the most common technical reasons for ACL reconstruction failure.12,20 Postoperative radiographs are frequently used to assess tunnel location. Multiple measurement techniques have been developed to analyze tunnel placement accuracy.1,2,8,13,14 There is limited knowledge about the reliability of some of the common tunnel radiographic measurements. Pinczewski et al 17 found an overall intraclass correlation of .73 from all measurements of 2 orthopaedic fellow raters, but reliabilities were not reported about specific measurements. Klos et al 15 and Giron et al 6 have examined the reliability of assessing femoral tunnel placement on sagittal imaging. Overall, there is a relative paucity of data reporting the accuracy or precision of these measurements in light of how frequently ACL reconstruction is performed and analyzed. As a result, it is difficult to ascertain which measurements are the most relevant clinically. Our hypothesis was that when ideal radiographic views are obtained, the reliability of the various different measurement techniques among experienced surgeons would be good to excellent.
Materials and Methods
Twelve knee surgeons in the Multicenter Orthopaedic Outcomes Network (MOON), who routinely perform arthroscopically assisted ACL reconstruction, drilled ACL tunnels in 73 cadaveric specimens and filled the femoral tunnels with 11-mm metal interference screws. Tibial tunnels were either filled with 11-mm metal interference screws, or a 10-mm tibial reamer was placed in the tunnel during imaging. The reamer was used in the tibial tunnel on 65 of the 73 cadaveric specimens because of a limited number of interference screws available. Each knee was subsequently imaged using a large digital C-arm fluoroscopy unit operated by a radiology technologist. An orthopaedic surgeon not participating in the tunnel drilling portion of the study positioned the specimens and directed the imaging. Fluoroscopic anteroposterior (AP), lateral, and notch view radiographs were taken and repeated until ideal views were obtained. The optimal AP view was defined as the lateral tibial plateau overlapping the center of the fibula. The optimal lateral view was defined by having the medial and lateral femoral condyles overlapping by at least 90%. The optimal notch view was obtained by adjusting the amount of flexion and rotation until the notch was in profile for the greatest dimension by height (adjusting flexion) and width (adjusting rotation). During the process, lateral images were not saved on 2 specimens, which left 71 specimens for the lateral radiographic measurements.
Radiographic Measurements
Three independent MOON knee surgeons then performed a series of measurements described below (including those described by Harner et al, 8 Aglietti et al, 1 and Jonsson et al 13 ) (Figure 1). All 3 reviewers were sports medicine fellowship–trained surgeons. They had 14, 5, and 3 years of clinical practice, respectively. All images were imported into a PowerPoint (Microsoft, Redmond, Washington) slide presentation. The surgeons individually performed measurements with an Iconico (New York, New York) digital protractor, caliper, and digital compass. All measures demonstrated in Figure 1 result in a percentage or angle measurement that facilitates comparison by eliminating differences in magnitude when the zoom is adjusted by the surgeon before performing the measurements. The Harner et al 8 method measures the aperture of the tunnel along the Blumensaat line as a percentage of the total distance of the Blumensaat line from posterior to anterior (Figure 1A). For the Harner et al 8 measurements, we used the anterior edge of the tunnel aperture as well as the center of the aperture for reference points. The Aglietti et al 1 method and the Jonsson et al 13 method both measure the aperture of the tunnel along the Blumensaat line as a percentage of the distance from the anterior edge of the condyle (Figure 1B). Aglietti et al 1 measured from the anterior edge of the tunnel, and Jonsson et al 13 measured to the center of the tunnel. The tunnel aperture height was measured relative to the notch height perpendicular to a line along both distal femoral condyles as seen on an AP radiograph (Figure 1C). The “o’clock angle” was measured on the flexed knee AP radiograph. A protractor was used to draw a line across the most inferior aspect of the femoral condyles. The second limb of the protractor was positioned vertically at 83° to establish orientation to the 12-o’clock position accounting for 7° of femoral valgus. A digital compass was then used to create a circle with the upper border touching the top of the notch and the lower border tangent to the line along the inferior aspect of the femoral condyles. The digital compass was then centered in the circle, and the angle was measured from the 12-o’clock position to the center of the aperture. This angle was used for the o’clock position measurement (Figure 1D). 7 For the coronal plane tibial tunnel measurements, the reference point used for measurements on AP radiographs was the medial plateau. The distance from the edge of the medial tibial plateau to the edge of the lateral tibial plateau was measured in comparison to the distance to the center of the tibial tunnel (Figure 1E) as well as in comparison with the lateral aspect of the tibial tunnel. The sagittal plane tibial reference point was the anterior aspect of the tibial plateau. The distance from the anterior plateau to the posterior plateau in comparison with the distance to the center of the tibial tunnel (Figure 1F) and the posterior aspect of the tibial tunnel as it enters the joint was measured. 2 The tibial tunnel measurement angles in the sagittal and coronal planes of lateral and AP radiographs were made in comparison with the joint line (Figure 1G and 1H). Radiographic potential for graft impingement was also evaluated on the lateral radiographs as described by Howell and Taylor. 10 A line was placed over the anterior aspect of the tibial tunnel and extended proximally to cross the femur. If that line projected anterior to the Blumensaat line, then it was reported that there was potential graft impingement.
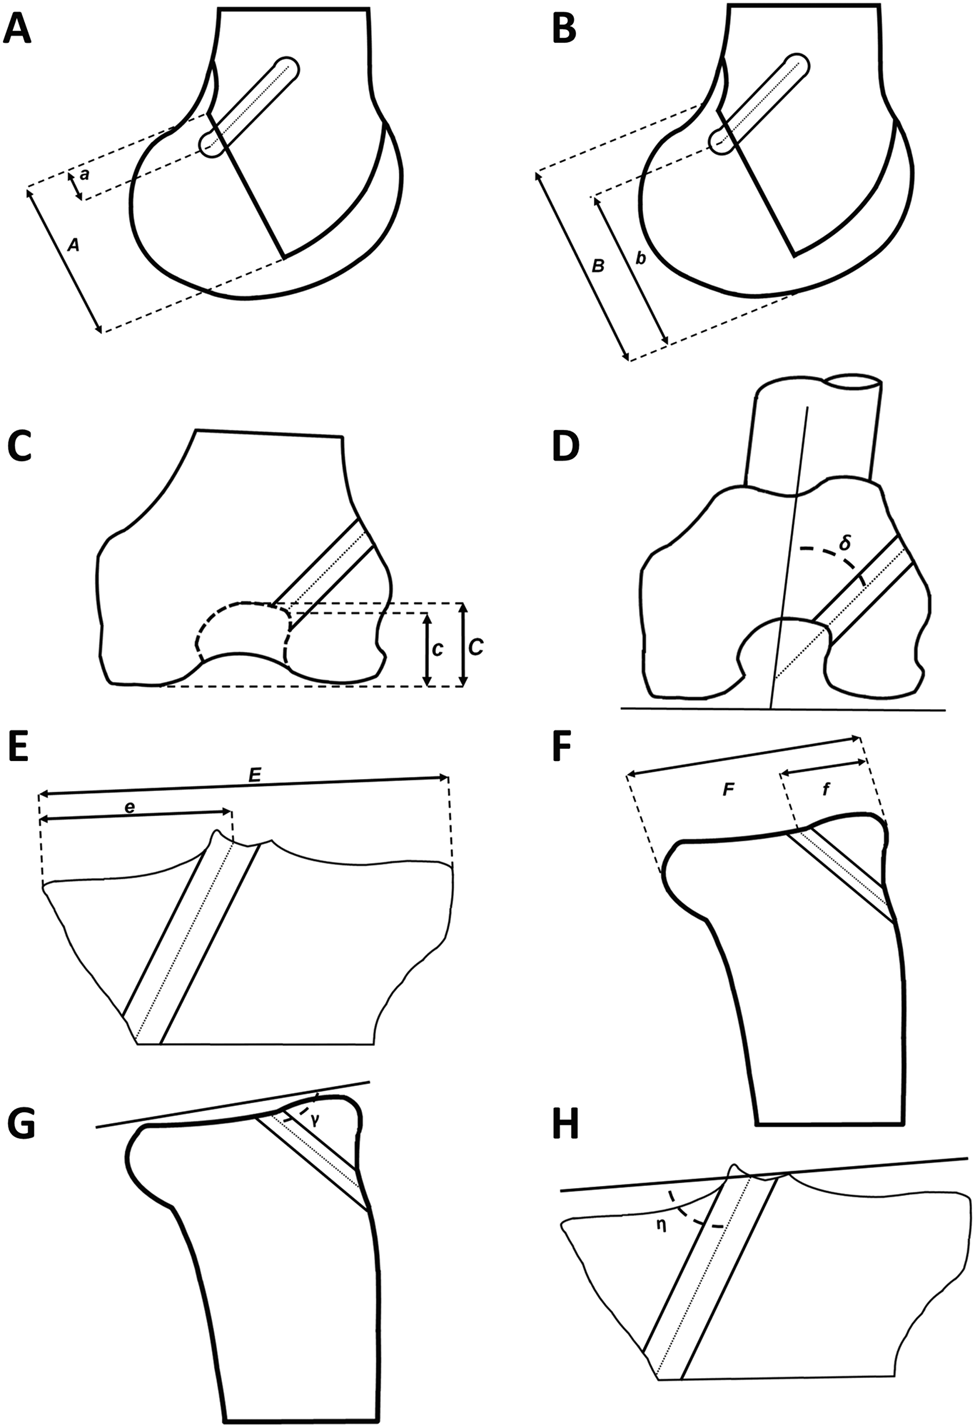
Diagrams describing each radiographic measurement. (A) Harner et al 8 (%), (B) Aglietti et al 1 /Jonsson et al 13 (%), (C) notch height (%), (D) clock face on Rosenberg view (deg), (E) tibial medial-lateral position (%), (F) tibial anterior-posterior position (%), (G) tibial sagittal tunnel angle (deg), and (H) tibial coronal tunnel angle (deg).
Grid Analysis
Anatomic radiographic studies have published the location of the femoral footprint in terms of percentages; however, our purpose was not to identify the anatomic location of the footprint or the accuracy with which these surgeons could place the tunnels compared with the anatomic footprint. Our purpose was to identify whether surgeons using the grid method could identify and report with precision the location of the femoral tunnel.
Reviewers were given digital lateral radiographs and a 16 × 12 box grid representing a modification of the 4 × 4 box grid method described by Bernard et al. 3 The preset grid [x,y (16,12)] could be expanded or collapsed in both the x-axis and y-axis and rotated as needed to be fit over the lateral femoral condyle. The surgeons were instructed to place the most superior x-axis line of the grid overlapping and parallel to the Blumensaat line. The most inferior x-axis line is tangent to the distal femoral condyle. The outermost y-axis lines are positioned so that they cross the proximal line (x-axis line along the Blumensaat line) at the point that the x-axis crosses the anterior and posterior aspects of the femoral condyles (Figure 2). The reviewers then marked the box deemed closest to the center of the femoral tunnel aperture on the grid. The subunits in the original grid method graph were increased from 4 × 4 to 16 columns × 12 rows so that there would be increased specificity for our analysis (Figure 2). If the results of the analysis demonstrated low precision, then it could be argued that the low precision may just be a result of our measurement methods. However, if the precision is good, then the question of whether the methods are precise enough is irrelevant. Ultimately, the grid that we devised was just a digital tool that the surgeons used to make the measurements. One unit is 1 box or subunit of the modified Bernard et al 3 grid system.
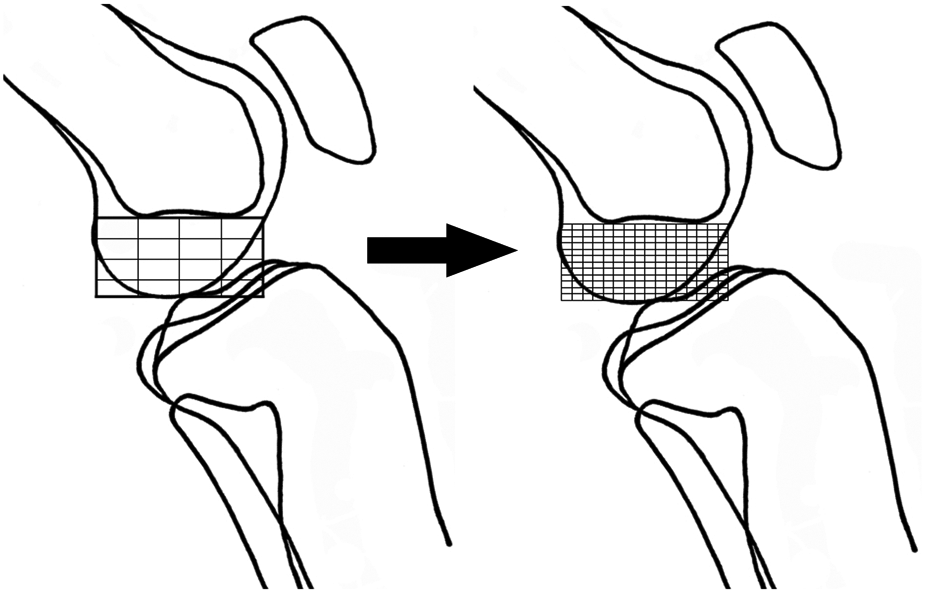
The method of Bernard et al 3 with a 4 × 4 grid was modified to a x,y (16,12) diagram.
For each specimen, the center of the 3 surgeon’s measurements was calculated. We then calculated the distance of each subunit marked by the surgeon to the center of the group of subunits. This allowed us to calculate an average radius for all specimens combined, and it gives perspective of how close together the surgeons’ measurements were located.
Statistical Analysis
All measurement data were reviewed for gross errors. After data were reviewed, 14 of nearly 4000 measurements were eliminated because they were impossible based upon the description and definition of the measurements. Intraclass correlation coefficients (ICCs) were used to determine the reliability of all measurements, excluding the grid analysis, as described by Shrout and Fleiss (ICC 3,1). 19 Agreement was classified according to the Shoukri and Pause 18 ICC value rating scale of reliability as poor (<.40), good (.40-.75), and excellent (>.75). This is only 1 breakdown analysis for the ICCs, and other methods have been reported with slightly more complex breakdowns for the reliability. Landis and Koch 16 reported a scale of reliability for ICCs of slight (.0-.2), fair (.21-.4), moderate (.41-.6), substantial (.61-.8), and almost perfect (.81-1.0). Although they used this comparison for the κ statistic, ICCs have been shown equivalent to the weighted κ for ordinal data. 4 Both methods of analyzing ICCs offer a similar interpretation, and both can be used by the reader for comparison. We elected to use the Shoukri and Pause 18 method for our analysis to simplify categorizations, but the data stand alone for comparison by the reader.
For the grid measurements, the distance from each surgeon’s measurement to the calculated center was taken for each specimen, and total averages were obtained for all specimens combined. The standard deviation was calculated, and the distribution and frequency of measurements were reported. Because all of the measurements were done within the grid diagram, the grid results are all reported as units within the plotted diagram.
Results
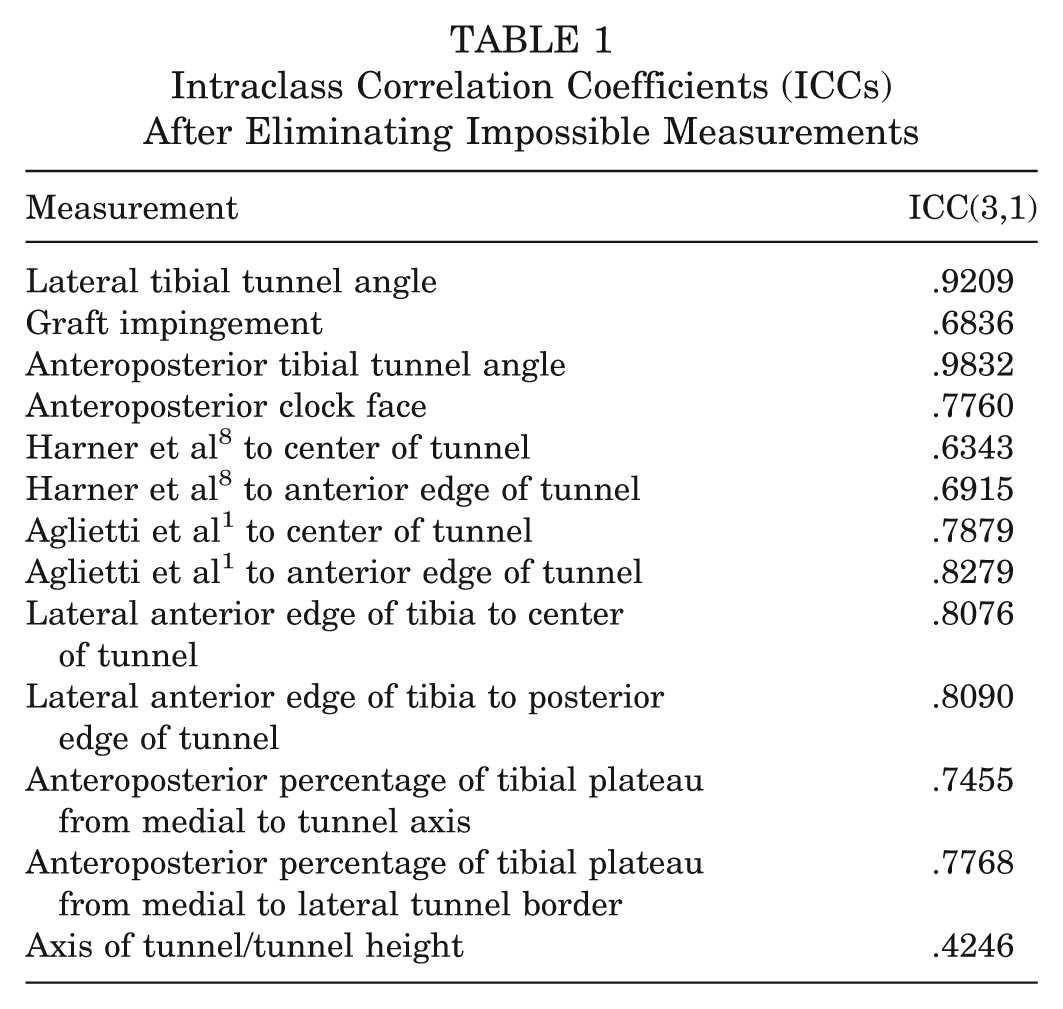
The ICCs were excellent (>.75) for the Aglietti et al 1 and Jonsson et al 13 femoral tunnel measurements, the sagittal and coronal plane measurements and angles of the tibial tunnels, and the clock face measurement. The ICCs were good (.4-.75) for an estimation of graft impingement, the Harner et al 8 measurements, and tunnel height measurements in the notch. There were no poor (<.4) measurements (Table 1).
Intraclass Correlation Coefficients (ICCs) After Eliminating Impossible Measurements
The mean radius for the grid measurements was 0.6 ± 0.4 units (median, 0.47 units; range, 0-2.36 units), with each unit being 1 box in the 16 × 12 grid. When a circle was constructed with a 1.3-unit radius, 95% of the 3 surgeons’ measurements would be included within the area of that circle (Figure 3).
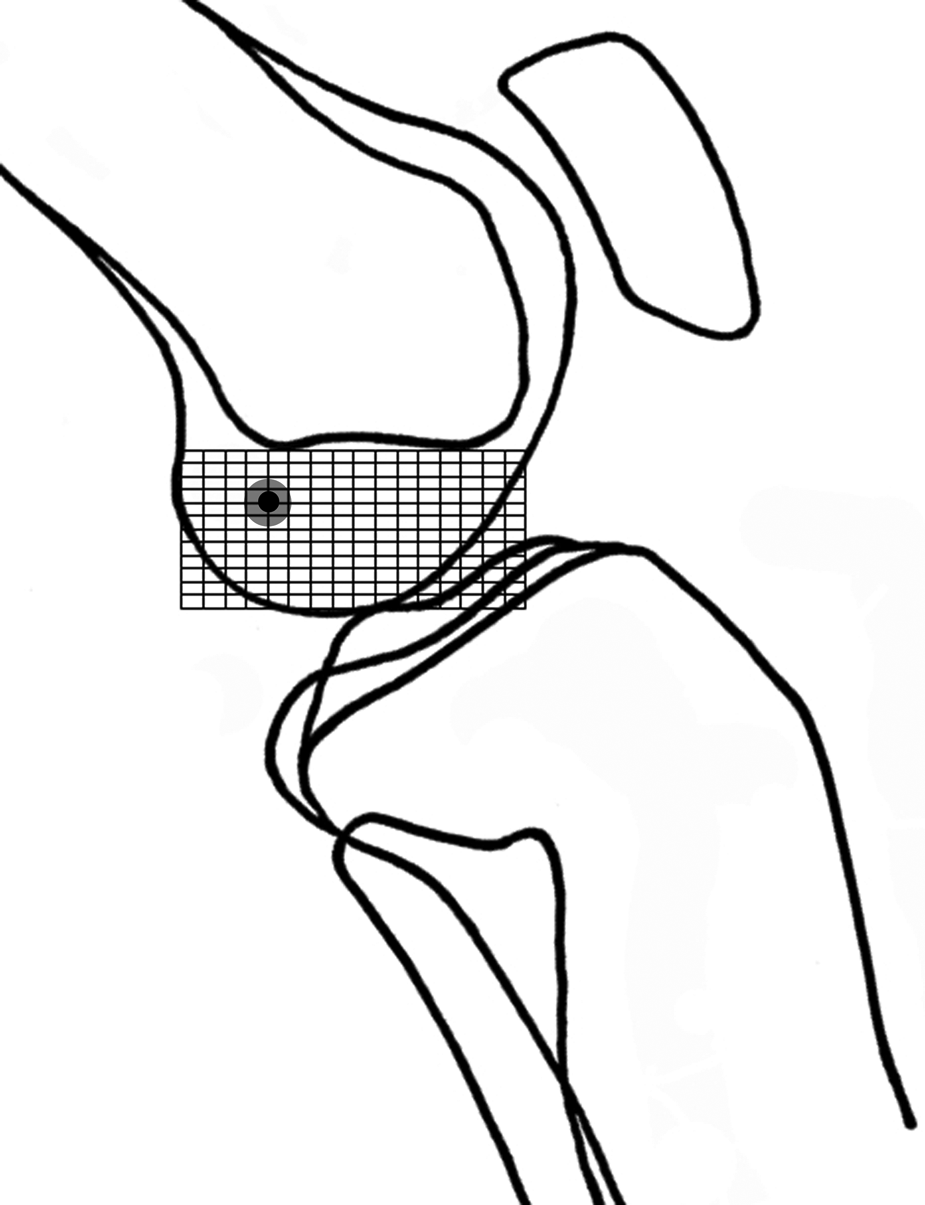
The black circle represents the mean radius of 0.6 units, and the gray circle represents the radius that included 95% of the surgeons’ measurements (1.3 units). The locations of the circles on the grid were chosen independent of any data from the study.
Discussion
This study reports on the reliability of several commonly used measurements for evaluating ACL tunnel position on ideal radiographs after reconstructive ACL surgery. The majority of the radiographic and angular measurements were excellent. There was excellent interobserver reliability, according to the ICCs, for the AP and lateral tibial tunnel angles, the clock face measurement, Aglietti et al 1 and Jonsson et al 13 tunnel measurements, the sagittal plane tibial tunnel measurements, and AP tibial tunnel measurements. The findings of our study agree with those of Pinczewski et al, 17 which demonstrated an overall ICC of .73 for ACL tunnel measurements. However, that study did not subdivide reliabilities of the different measurements so individual comparisons are difficult. We advocate that these measurements on ideal radiographic views of the knee can be used for analyzing tunnel positions on plain radiographs postoperatively or intraoperatively.
This study demonstrated good interobserver reliability results based upon the ICCs for the impingement measurement, the Harner et al 8 femoral tunnel measurement, and the notch height measurement. However, the Harner et al 8 measurements and the estimation of graft impingement were borderline to being classified as excellent, whereas the notch height is borderline to being classified as poor. The investigators in this study believe poorly defined or difficult to visualize radiographic landmarks led to this result for notch height. It can be very difficult to identify the borders of the notch in some of the radiographs that were taken, which would lead to increased variability in measurements (Figure 4). This finding concurs with that in the study of Hoser et al 9 in which they were unable to measure the femoral tunnel height on the AP radiograph in 92% (46/50) of their radiographs because landmarks were not identifiable. Because of the lack of reliability studies in the orthopaedic literature and in light of our current findings, we believe the notch height measurement should be used with caution.
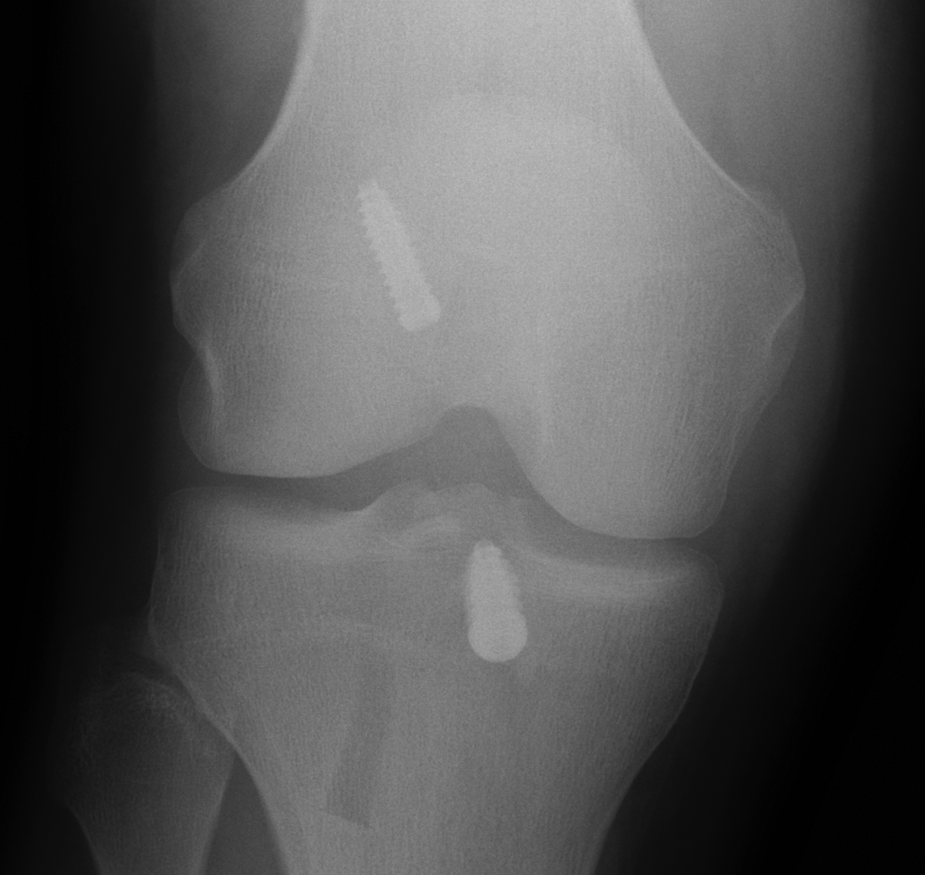
Anteroposterior radiograph of the knee from this study demonstrating the difficulty in clearly delineating the radiographic landmarks for the femoral notch.
The most extensive prior study on radiographic measures for ACL tunnels was done by Khalfayan et al, 14 who analyzed the variability for 5 radiographic measurements performed on 42 patients. Four reviewers performed 5 different measurements, which included a novel AP and lateral femoral tunnel measurement, a notch height measurement, and AP and lateral tibial tunnel measurements. The measurements were performed on 2 separate occasions. The authors used an analysis of variance and reported interobserver and intraobserver variability in terms of a P value. The only measurement that they found to have a statistically significant amount of variability was the interobserver notch height, suggesting that that measurement is highly variable and less useful in a clinical context. Because this prior study did not evaluate an ICC, direct comparisons cannot be made about the degree of consistency or reproducibility of the measurements. Also, direct comparison with the results of the current study is difficult.
No prior study has evaluated the reliability of the grid measurement system described by Bernard et al. 3 To increase the reviewers’ measurement accuracy, and to more definitively analyze reviewer agreement, the number of boxes in the grid was increased from the original quadrant 4 × 4 grid to a 16 × 12 grid. Increasing the number of boxes allows for more precise analysis of rater agreement and functions as a digital measurement tool in the study. Because there is no standard for comparison, the results stand alone for interpretation. Our impression is that there was substantial precision with a mean radius of 0.6 units of the entire grid. If the complex statistics are thrown aside, all 3 surgeons’ measurements were within a distance of 2 of the small boxes 95% of the time. This proximity is appreciated better visually than verbally (Figure 3). The quadrant method is often utilized with percentage measurements from anterior to posterior and superior to inferior. In terms of percentages, each box would represent 6.3% from posterior to anterior and 8.3% from superior to inferior. Hence, applying these percentages to our mean radius analysis, the reviewers were, on average, within 0.6 boxes or 4% to 6% of each other. Similarly, 95% of the measures were within a circle with a diameter roughly representing 12% to 16% of the superior-inferior and anterior-posterior percentages of the lateral femoral condyle.
There are several limitations of the study that merit discussion. This study used fluoroscopic radiographs rather than plain radiographs. These radiographs were considered ideal as they were repeated under the supervision of an orthopaedic surgeon until deemed acceptable. It is likely that the results would be less reliable with radiographs taken in a routine clinic or hospital setting because of rotational issues with the radiographs. An additional weakness is that no graft was placed during these procedures. As a result, the metal interference screws would be positioned in the center of the tunnels rather than eccentrically as would happen in clinical scenarios when the graft would push the screw to an eccentric location. This does not change the precision of the measurements, which is the focus of this study, but for clinical scenarios, it could slightly alter the location of the reconstructed ACL, changing the accuracy of the calculated location. In addition, a reamer was used in the tibial tunnel in most cadaveric specimens in place of an interference screw. We have no evidence whether the reamer would be better or worse than the interference screw; however, it would more clearly identify the tunnel borders and may increase the accuracy for that small subset of the data. All reviewers were sports medicine fellowship trained and regularly perform ACL surgery. Hence, our findings may not be generalizable to other reviewers with different types or levels of training. No assessment of intraobserver reliability was performed, nor was there any analysis of accuracy of measurements against dissection or advanced imaging. Lastly, although several measures were performed for both the tibia and femur, there are other measures that we did not evaluate for reliability, including the femoral tunnel circle method as described by Amis et al. 2 Klos et al 15 later demonstrated superior ICCs with the circle method when compared with the Harner et al 8 and Giron et al 6 measurements. However, because this method is not used regularly in our clinical environment, it was not included in the design of this study.
In conclusion, when ideal fluoroscopic imaging and metal interference screws or markers are obtained, the majority of the ACL tunnel measurements described are excellent. The poorest reliability was found to be with notch height measurements, where the ICC was categorized as borderline between poor and good. While there is no standard for comparison for the grid method in terms of reliability, subjectively, it demonstrates acceptable reliability.
Footnotes
Acknowledgements
The authors thank DonJoy Orthopaedics for providing the cadaveric knees and arthroscopy laboratory used in this study.
One or more of the authors has declared the following potential conflict of interest or source of funding: Cadaveric specimens for the study were donated by, and cadaveric study was performed at, DonJoy Orthopedics, San Diego, California. The study was funded by the Vanderbilt University Sports Medicine Research Fund. Dr Wolf’s work was supported by a grant from the National Institutes of Health Mentored Clinical Research Scholar Program at the University of Iowa (5K12RR017700-04). This study was supported by a grant from the National Football League Charities Medical Grants Program.