
Abstract
Background:
Tibial tubercle–trochlear groove distance (TT-TG) is a commonly used measurement for surgical decision making in patients with patellofemoral malalignment and instability. This measurement has historically been performed utilizing axial computed tomography (CT). More recently, magnetic resonance imaging (MRI) has been proposed as an equivalent method, but this has not yet been fully validated.
Purpose:
To determine the reliability of TT-TG distance measurements on both MRI and CT and to determine whether the measurements are interchangeable with one another.
Study Design:
Cohort study (diagnosis); Level of evidence, 2.
Methods:
All patients with patellar instability who underwent both CT and MRI of the knee from 2003 to 2011 were included (n = 59 knees in 54 patients). Two fellowship-trained musculoskeletal radiologists measured the TT-TG distances for each patient by CT and MRI in a randomized, blinded fashion. Interobserver reliability was calculated between radiologists for both imaging modalities, and intermethod reliability was calculated between the 2 imaging modalities. The results are reported using intraclass correlation coefficients (ICCs) and Bland-Altman analysis.
Results:
The 59 knees had a mean TT-TG distance of 16.9 mm (range, 8.3-25.8 mm) by CT and 14.7 mm (range, 1.5-25.1 mm) by MRI. Interobserver reliability between the radiologists was considered excellent for both CT and MRI (ICC = 0.777 and 0.843, respectively). When comparing CT to MRI, the ICC was considered only fair for each of the raters (0.532 and 0.539). Eleven patients (19%) had a TT-TG distance of ≥20 mm on CT preoperatively and underwent distal realignment by tibial tubercle osteotomy. In this surgical subgroup, the mean TT-TG distance was 22.5 mm (range, 19.8-25.8 mm) by CT and only 18.7 mm (range, 14.4-22.8 mm) by MRI for a mean difference of 3.80 mm (P < .001).
Conclusion:
The TT-TG distance can be measured with excellent interrater reliability on both MRI and CT; however, the values derived from these 2 tests may not be interchangeable. This observation should be taken into consideration when MRI is used for surgical planning because MRI may underestimate the TT-TG distance when compared with CT.
Patellar instability is a common reason for patients to see an orthopaedic surgeon, with an estimated annual incidence of first-time dislocations of 5.8 per 100,000 people. This value is 5 times higher (29 per 100,000) in patients aged 10 to 17 years. 8 The cause of patellar instability is multifactorial and exists across a spectrum of severity. As such, it requires a multifaceted diagnostic and therapeutic approach. Treatment options range from nonoperative therapies (activity modification, strengthening, and bracing) to surgical interventions in the form of a number of different soft tissue and/or bony realignment procedures. Initial evaluation typically requires a detailed history and physical examination, radiographs, computed tomography (CT), and/or magnetic resonance imaging (MRI).4,6-8 A common anatomic finding associated with patellar instability is lateralization of the tibial tubercle, which can be quantified by calculating the tibial tubercle–trochlear groove (TT-TG) distance on axial CT.5,19 Increased TT-TG distance has been implicated as a risk factor for patellar dislocations and subluxations and is typically used to determine whether patients will benefit from surgical procedures that medialize the tibial tubercle.9,12,14,21
Historically, TT-TG distance calculations have been performed by CT, and several authors have demonstrated its efficacy and validity.10,16,19,22 More recently, published studies have utilized axial MRI to calculate TT-TG distance, despite sparse evidence demonstrating its validity.1,2,17,19,23-25 Schoettle et al 16 compared the reliability of MRI to CT in measuring TT-TG distance. This study was able to demonstrate good interrater and intermethod reliability of CT and MRI in measuring TT-TG distance in a small cohort of 12 patients. Limitations of this study primarily include a small sample size and disproportionate number of female patients.
Because these patients typically require MRI for soft tissue evaluation, it is desirable that TT-TG distances could be reliably calculated by this modality. If validated, this could eliminate the need for CT in this generally young, and often skeletally immature, population of athletes. This would result in reduced radiation exposure for patients as well as reduced health care costs, both of which are critically important concerns. Given the inconclusive evidence that MRI is a valid replacement for CT when calculating TT-TG distances, this study was undertaken to determine the accuracy and reliability of measuring TT-TG distance by MRI as compared with the gold standard of CT in patients with patellar instability. Specifically, we sought to answer the following 3 questions: (1) Can TT-TG distances on MRI reliably be measured between radiologists? (2) Are these measurements equivalent to those made by CT in patients with patellar instability (especially those with a TT-TG distance of >20 mm on CT)? (3) Can the 2 modalities be used interchangeably to obtain the same TT-TG distance? We hypothesized that TT-TG distances by MRI would have high reliability between radiologists and that these values would be equivalent to those obtained by CT, making the tests interchangeable for TT-TG distance.
Materials and Methods
After approval from our institutional review board, records of all patients with a diagnosis of patellar instability (with at least 1 dislocation or subluxation event up to multiple dislocations that were too numerable to count) by a fellowship-trained orthopaedic surgeon (M.J.S., A.J.K., B.A.L., or D.L.D.) at our institution from 2003 to 2011 were reviewed. Only patients who had undergone both CT and MRI of the affected knee were initially enrolled in the study. Patients were excluded if they demonstrated physeal growth or closure between CT and MRI examinations. We were able to locate a total of 62 patients with a diagnosis of patellar instability with both CT and MRI results available for review. Three of these were excluded, as 1 underwent knee surgery between the 2 testing modalities, and 2 demonstrated physeal change between the tests. This left a total of 59 patients (95%) to be included in the study. The median time that elapsed between MRI and CT examinations of the knee was 21 days. For both examination types, efforts were made to position the knee in full extension with the patella directed anteriorly. Thus, CT and MRI scans were obtained by the following protocols.
MRI Protocol
The patient was scanned in the supine position with a dedicated transmit-receive coil with the knee extended and supported by padding within the cylindrical coil as needed to ensure patient comfort and avoid motion. The scanning protocol included sagittal and coronal imaging, but only axial imaging was considered for the purpose of this study. During the time period of the study cases, patients were scanned on 1.5-T or 3.0-T GE MRI scanners (n = 34 and 25 knees, respectively) (GE Healthcare, Waukesha, Wisconsin) with axial T2 fat-saturated imaging in all cases.
At 1.5 T, images were obtained with the following technical parameters: fast spin echo, repetition time (TR) of 3000 to 5000 milliseconds, echo time (TE) of 50 milliseconds, fat saturation, 3- to 4-mm thickness, approximately 4-minute scan time, 0.5-mm skip between slices, field of view (FOV) of 16, 384 × 256 matrix, number of excitations (NEX) of 2, and echo train length (ETL) of 8 to 10.
At 3.0 T, images were obtained with the following technical parameters: fast spin echo, TR of 4000 to 6000 milliseconds, TE of 45 milliseconds, fat saturation, 3-mm thickness, approximately 4-minute 30-second scan time, 0-mm skip between slices, FOV of 16, 384 × 256 matrix, NEX of 2, and ETL of 10 to 12.
CT Protocol
The patient was scanned in the supine position with the knee fully extended. The knee was positioned with the patella directed anteriorly or in slight external rotation as needed for comfort. Straps were placed over the thigh and lower leg to minimize motion. Scanning was performed in the helical mode. All patients were examined on a 64–detector row Siemens CT scanner (Siemens Medical Systems, Forchheim, Germany) using the following parameters: 512 × 512 matrix, 3- to 5-mm thickness, approximately 5- to 10-second scan time, 0-mm skip between slices, FOV of 15, and bone kernel.
Measurement Technique of TT-TG Distance
The TT-TG distance was then measured by both CT and MRI on each of these 59 patients by 2 fellowship-trained musculoskeletal radiologists with 25 and 14 years of experience (J.R.B. and M.S.C., respectively). All measurements were performed in a blinded fashion so that the radiologists were not aware of patient identity, details of presentation, surgical intervention, or measurements made by the other radiologist. The cases were randomized by both patient and examination type (CT vs MRI) to minimize fatigue bias and bias of repetitive measurement from a single modality. Given that there were a total of 59 patients, 2 tests per patient, and 2 raters, a total of 236 TT-TG distances were calculated. Because a TT-TG distance of ≥20 mm on CT was used as a general guideline for the need of surgical intervention in the form of tibial tubercle osteotomy (TTO), these values were also compared with those obtained by MRI on patients who received a TTO.
The TT-TG distance was measured using a technique very similar to that used by Schoettle et al. 16 Bony landmarks were used for the calculations. Cartilaginous landmarks were not taken into consideration; however, the patellar tendon was used to assist in determining the center of the tibial tubercle. Trochlear groove location was specified as the deepest point of the trochlear groove at the level on which the posterior cortices of the femoral condyles were well defined. The posterior condylar line was established tangential to the posterior condylar cortices. The trochlear line was established perpendicular to the posterior condylar line and passing through the deepest point of the trochlear groove.
Tibial tubercle location was specified at the level of the most cephalad image on which the patellar tendon was completely in contact with the tibial tubercle. The tibial tubercle was specifically marked at the center of the tendon on this image.
The trochlear line was transferred to the image showing the tibial tubercle location using a GE Advantage Windows workstation (GE Healthcare). The TT-TG distance was determined by the length of a line drawn perpendicular to the trochlear line and joining the tibial tubercle location and the trochlear line (Figure 1).
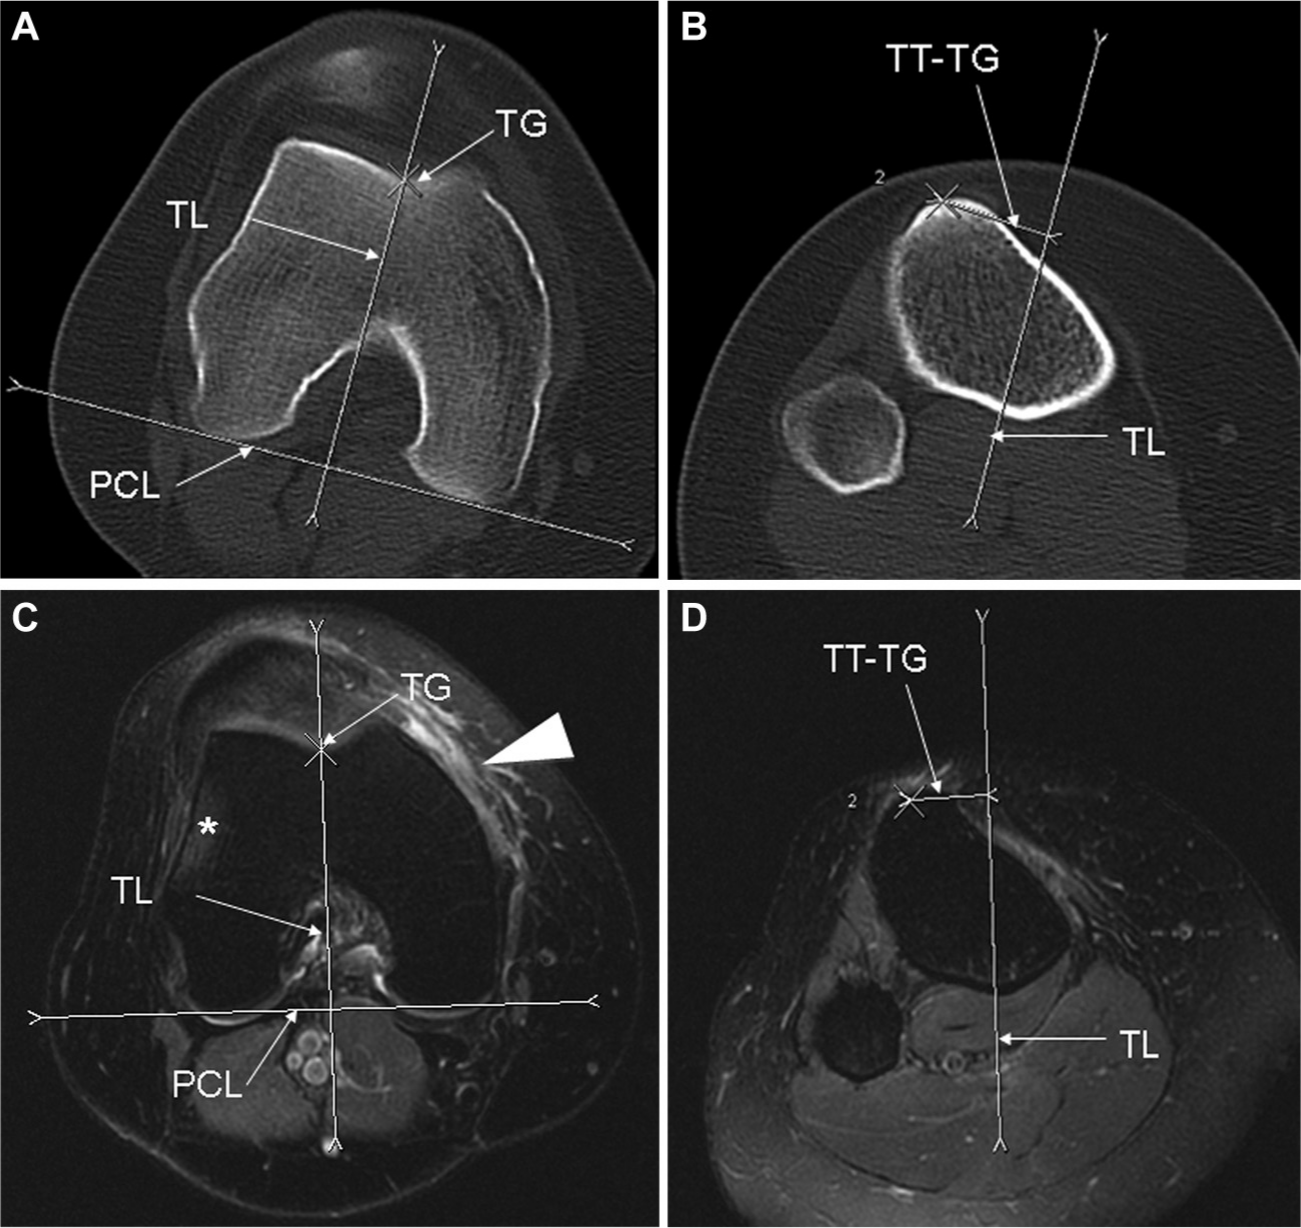
Technique for measuring TT-TG distance. Axial computed tomography (A, B) and magnetic resonance imaging (C, D) scans at the level of the TG (A, C) and TT (B, D). (C) Note the bone marrow edema (asterisk) along the lateral aspect of the lateral femoral condyle because of a recent lateral patellar dislocation. On the same image, note the soft tissue edema, with the arrowhead representing the associated tear of the medial patellofemoral ligament confirmed on adjacent images (not included). TG, trochlear groove; PCL, posterior condylar line; TL, trochlear line; TT, tibial tubercle; TT-TG, tibial tubercle–trochlear groove distance.
Statistical Analysis
Interrater reliability of each imaging method (CT and MRI) and agreement between the 2 methods were evaluated. This was accomplished by calculating 2 separate measures of agreement: the intraclass correlation coefficient (ICC) 18 and the Bland-Altman 95% limits of agreement (LOA). 3 Both of these measures were reported with their corresponding 95% confidence intervals (CIs). An ICC of >0.75 was considered excellent, 0.75 to 0.40 was considered fair, and <0.40 was considered poor. 11 When comparing TT-TG distances on CT and MRI in the subgroup analysis of 11 patients with a TT-TG distance of >20 mm on CT who received a TTO, a paired Student t test was used, and a P value <.05 was considered significant.
Results
The mean age of patients enrolled in the study was 24 years (range, 13-59 years). There were a total of 24 male and 30 female patients, and 5 of these patients demonstrated patellar instability of both knees (4 male and 1 female). The unstable knees involved were right sided in 28 patients and left sided in 31 patients. Regarding operative interventions, a total of 41 (69.4%) knees underwent surgical correction for their instability. Overall, 83 procedures were performed, with 28 (68%) knees undergoing multiple procedures at the time of their index surgery. Only 13 (32%) patients underwent a single procedure at the time of their initial surgery (Table 1).
Surgical Procedures Performed a
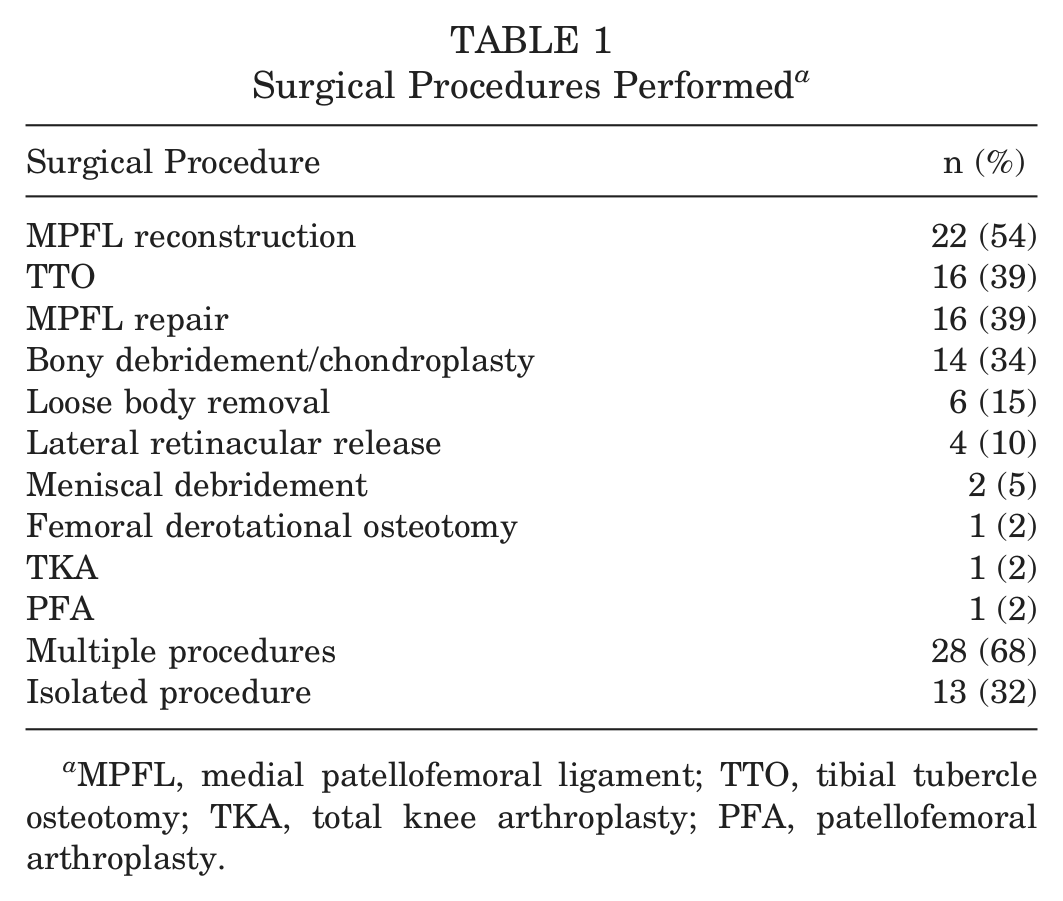
MPFL, medial patellofemoral ligament; TTO, tibial tubercle osteotomy; TKA, total knee arthroplasty; PFA, patellofemoral arthroplasty.
Of the 59 knees studied, the mean TT-TG distance was 16.9 mm (range, 8.3-25.8 mm) by CT and 14.7 mm (range, 1.5-25.1 mm) by MRI when averaging rater 1’s measurement with that of rater 2 for each patient for each modality. The mean TT-TG distance for rater 1 on CT was 17.5 mm (range, 9.0-26.5 mm) and that of rater 2 was 16.3 mm (range, 6.6-25 mm). Mean TT-TG distances on MRI for raters 1 and 2 were 14.7 mm (range, 0-24.9 mm) and 14.7 mm (range, 3-25.2 mm), respectively. When comparing the 2 raters to one another (interobserver reliability), the ICC was excellent for both CT (0.777; 95% CI, 0.611-0.872) and MRI (0.843; 95% CI, 0.743-0.906). Of note, the ICC between raters was slightly higher for MRI, indicating slightly improved agreement with this imaging modality (Table 2).
Results of Intraclass Reliability Calculations a
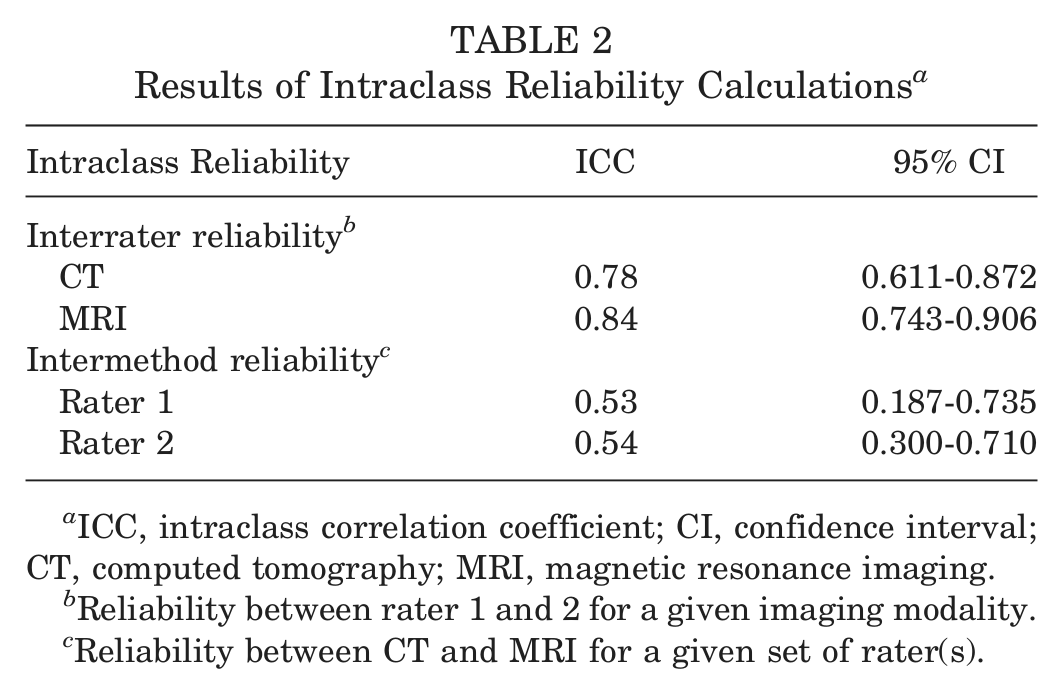
ICC, intraclass correlation coefficient; CI, confidence interval; CT, computed tomography; MRI, magnetic resonance imaging.
Reliability between rater 1 and 2 for a given imaging modality.
Reliability between CT and MRI for a given set of rater(s).
Bland-Altman analysis between raters demonstrated a mean difference of 1.14 mm between rater 1 and 2 for TT-TG distance when measured by CT, with 95% LOA of −2.77 to 5.05 mm. Bland-Altman analysis of the TT-TG distance when measured by MRI demonstrated a mean difference of 0.05 mm between the 2 raters, with 95% LOA of −3.3 to 3.4 mm (Figure 2 and Table 3).
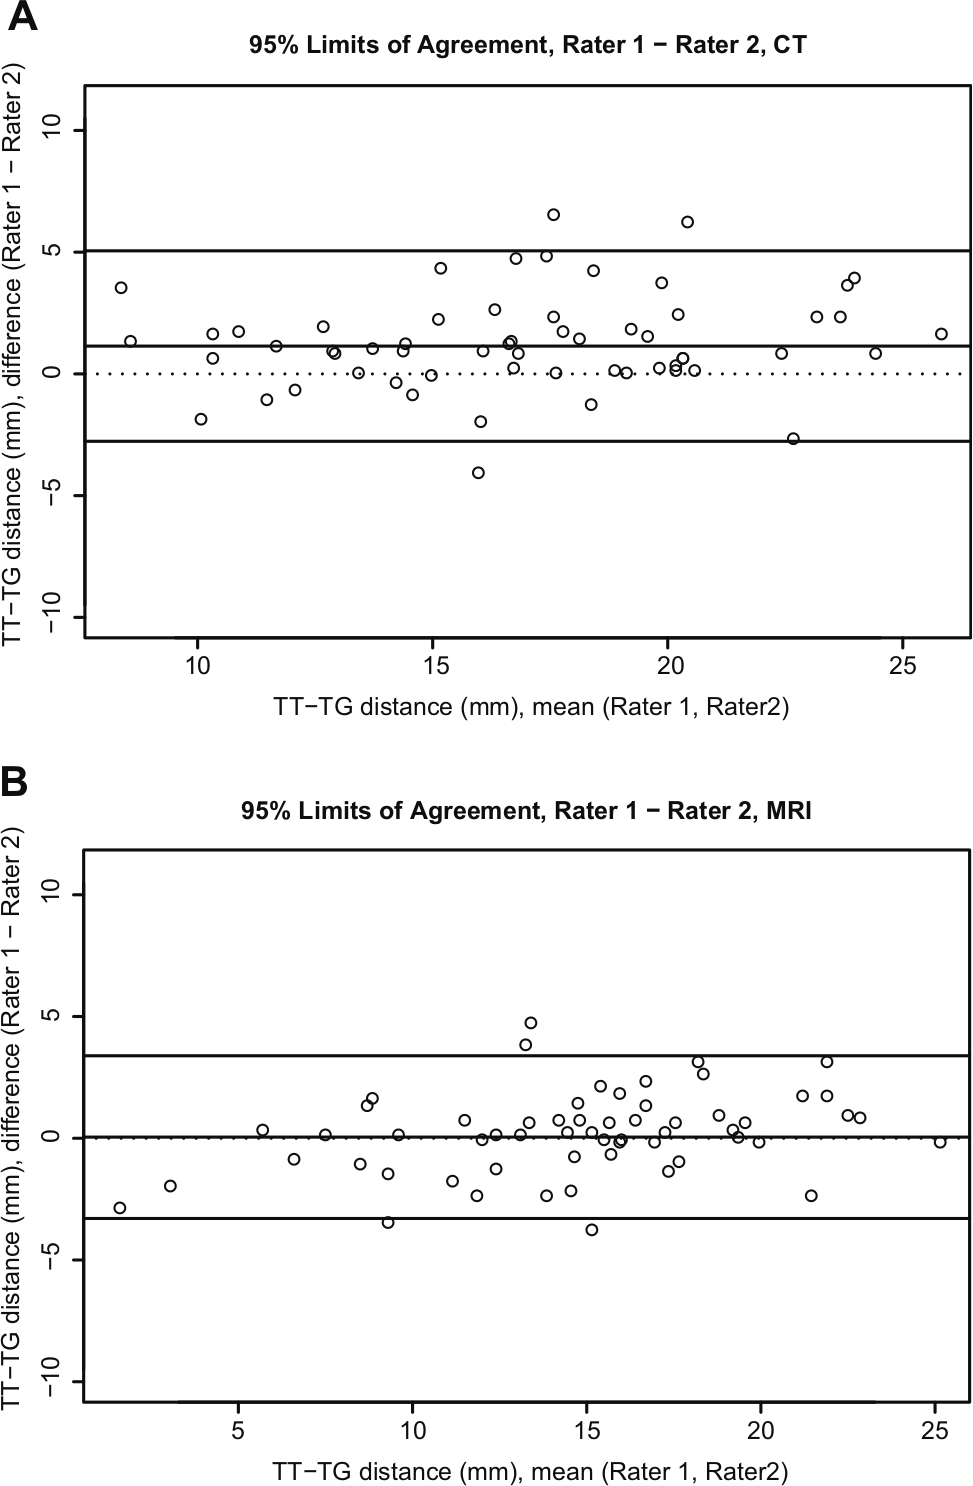
Bland-Altman analysis of interrater agreement between rater 1 and 2 for both computed tomography and magnetic resonance imaging.
Results of Bland-Altman Analysis a
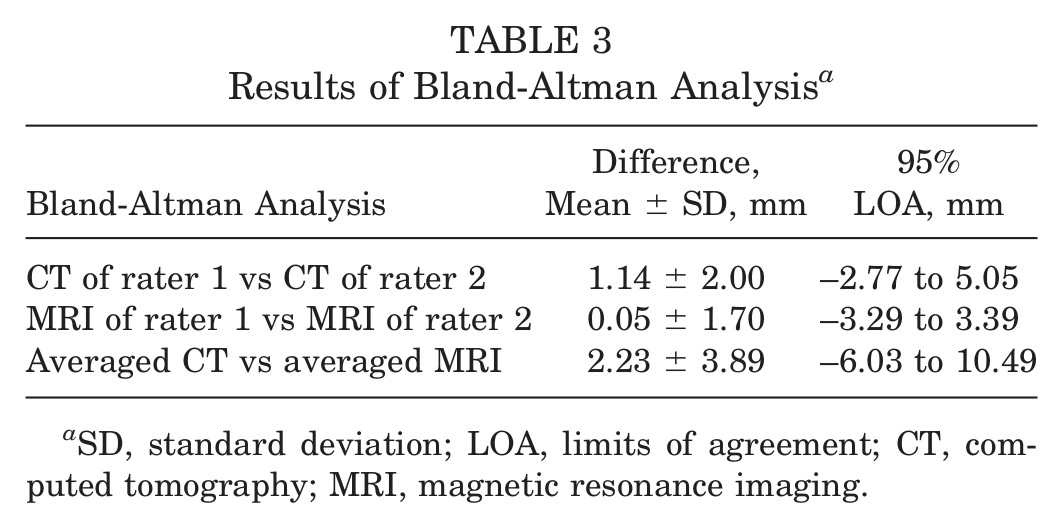
SD, standard deviation; LOA, limits of agreement; CT, computed tomography; MRI, magnetic resonance imaging.
When comparing the 2 imaging modalities to one another (CT vs MRI) within raters, the ICC of CT versus MRI was only fair for each of the 2 raters (rater 1: 0.532; 95% CI, 0.187-0.735 vs rater 2: 0.539; 95% CI, 0.300-0.710) (Table 2). Bland-Altman analysis comparing CT to MRI for raters 1 and 2 demonstrated a mean difference of 2.78 mm (95% LOA, –4.2 to 10.3 mm) and 1.68 mm (95% LOA, –6.0 to 9.4 mm), respectively. When combining the measurements of both raters, Bland-Altman analysis demonstrated a mean difference in TT-TG distance of 2.23 mm (95% LOA, –6.0 to 10.5 mm) between that measured by CT and MRI (Figure 3). In all of the above Bland-Altman analyses, the TT-TG distance on CT was greater than that on MRI (Table 3).
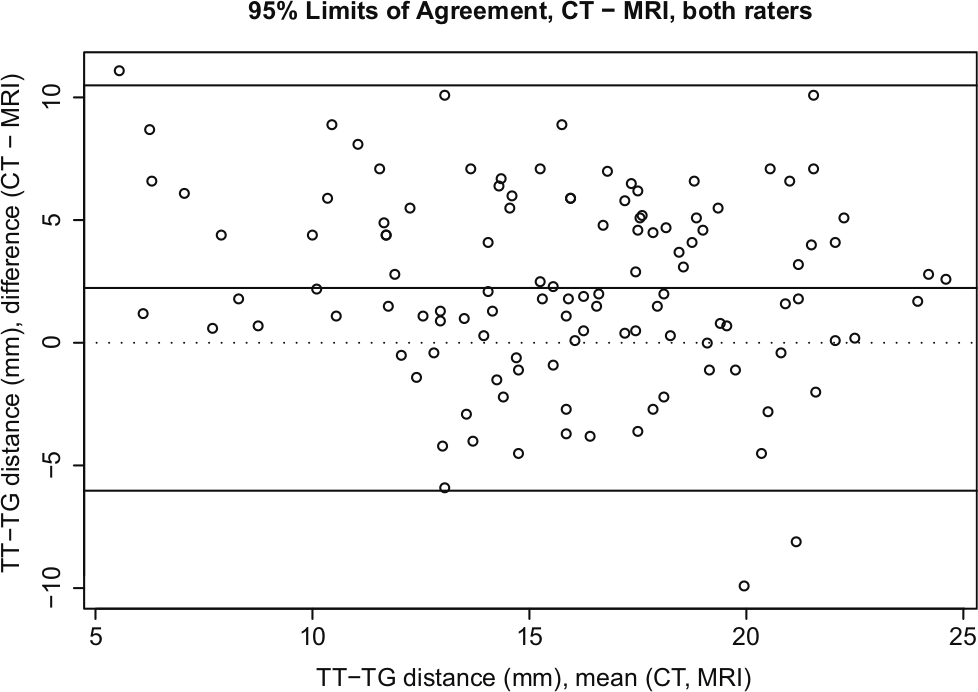
Bland-Altman analysis of intermethod agreement between computed tomography and magnetic resonance imaging.
Eighteen patients (31%) had a TT-TG distance of ≥20 mm by CT, and only 8 (14%) had a TT-TG distance of ≥20 mm by MRI. There were a total of 11 patients (19%) who underwent a TTO and had a TT-TG distance of ≥20 mm (rounded to the nearest whole mm) on CT. In this subgroup of patients, the mean TT-TG distance was 22.48 mm (range, 19.8-25.8 mm) by CT but was only 18.68 mm (range, 14.4-22.8 mm) on MRI. This resulted in a mean discrepancy of 3.80 mm (P < .001; 95% CI, 2.05-5.55) in this subgroup of surgical patients. Once again, the TT-TG distance on MRI consistently measured less than the TT-TG distance on CT.
Discussion
The evaluation and treatment of patellofemoral instability remain a challenging problem for patients as well as orthopaedic surgeons. The need for an extensive workup is caused by the multifactorial origin and the numerous therapeutic options that need to be considered to restore stability. Advanced imaging, including CT and MRI, has proven to be a very valuable component of the diagnostic workup. A CT scan is helpful to analyze patellar tilt and subluxation at various knee flexion angles and to calculate the TT-TG distance. An MRI scan allows for assessment of the soft tissues and articular cartilage. More recently, surgeons have used MRI to calculate the TT-TG distance, which if accurate, could potentially obviate the need for CT.1,4,16,19,20,23-25 This practice change will reduce medical costs, reduce radiation exposure to patients, and save time. Unfortunately, MRI is not yet fully validated as a reliable and accurate means of calculating TT-TG distance, resulting in uncertainty as to whether MRI is an adequate substitute for the “gold-standard” CT. 23 Other studies have attempted to compare various MRI examinations to those of CT and have found some variability between the 2 tests when quantifying bony architecture.13,15 The purpose of this study was to determine if MRI is a reliable means for radiologists to measure TT-TG distances, if the studies are equivalent, and if MRI can replace CT as the test of choice in this patient population.
One limitation of this study is the lack of intrarater validation of each testing modality. This was not undertaken for either MRI or CT in our study because the intrarater reliability of TT-TG distances on CT has been validated previously 19 and the interrater reliability on MRI in our study was higher than that for CT. An additional limitation is the potential for slight variability in knee positioning in the CT and MRI scanners. Attempts were made to place the knee in full extension with the patella directed anteriorly for both examinations; however, it was accomplished by 2 slightly different techniques. For MRI examinations, padding was placed between the knee and the coils to minimize motion, whereas for CT, the leg was strapped down at the thigh and lower leg. Also, no specific restraint was used to control rotation at the foot.
The excellent interrater ICC between raters for both CT and MRI suggests that each of these modalities tends to produce consistent results across raters for a given modality. Given the fact that bony landmarks were utilized, one may have suspected that these would be better delineated on CT as compared with MRI; however, MRI did demonstrate a slightly higher ICC and interrater reliability than CT did. Despite this observation, both modalities demonstrated excellent ICCs, and it can be concluded that TT-TG distance calculated by MRI can be accurately compared with another TT-TG distance calculated by MRI, with the same being true for CT. However, in light of the lower ICCs and higher discrepancy on Bland-Altman analysis for intermethod reliability between CT and MRI, this study suggests that the 2 testing modalities are not equivalent when calculating TT-TG distance. Therefore, we reject our hypothesis that the 2 tests would give equivalent results and could be used interchangeably. Accordingly, caution should be used when substituting MRI for CT if the same TT-TG distance values are used for clinical decision making. Given the high interrater reliability between our radiologists, the discrepancy in the intermethod reliability values likely represents differences in the imaging methods themselves rather than conflict between raters. Of note, the mean difference between CT and MRI was 2.3 mm for the entire cohort and was 3.8 mm (P < .001) in patients with a TT-TG distance of >20 mm who received a TTO, with MRI consistently measuring lower than CT for both groups. One possible way to improve the correlation of the 2 examinations may be to invert the grayscale of MRI to match that of CT, but further study is needed to know if this would improve results.
These data represent a contrast to the single study that has been previously published on the topic. 16 It is possible that this prior report may have been underpowered with only 12 patients. It is also potentially limited by a sex bias (10 female and 2 male patients), the inclusion of patients with patellofemoral pain syndrome in addition to those with patellar instability, and the absence of patients with a TT-TG distance of ≥20 mm.
Recently, a TT-TG distance of ≥20 mm by CT was suggested as the threshold for the performance of a TTO when treating patellar instability.4,5 In our study, the MRI results for TT-TG distance were routinely lower than those of CT. Although it is tempting to simply subtract the average calculated discrepancy on MRI (–2.3 mm) from the established CT value to achieve a new standard (17.7 mm), further research is required to determine if this value is a valid surgical criterion. Therefore, caution should be used when surgical decision making is based solely on TT-TG distance calculations on MRI. This study suggests that MRI is accurate and reproducible enough to measure TT-TG distances reliably; however, surgical cutoff values are likely to be lower than those that have been previously established for CT.
Conclusion
The TT-TG distance can be measured with excellent interrater reliability on both MRI and CT; however, the values derived from these 2 tests may not be interchangeable. This observation should be taken into consideration when MRI is used for surgical planning because MRI may underestimate TT-TG distance when compared with CT.
Footnotes
One or more of the authors has declared the following potential conflict of interest or source of funding: Dr Levy: consultant for Arthrex, royalties from Arthrex, and research support from VOT Solutions, National Institutes of Health, Biomet, and Arthrex. Dr Stuart: consultant for Arthrex, Fios, and Stryker. Dr Dahm’s spouse, Jay Smith, receives royalties from Tenex Health.