
Abstract
Background:
Achilles tendinopathy (AT) is initiated asymptomatically and is therefore often discovered at a very late stage.
Purpose:
To elucidate whether the microvascular volume (MV) of the Achilles tendon is elevated in patients with AT compared with healthy controls during pre-exercise rest, after acute exercise, and 24 hours after exercise. Additionally, this study investigated the muscle activation pattern of the gastrocnemius muscle and the relative elasticity of the Achilles tendon during a 1-hour treadmill run in healthy patients and in patients with AT.
Study Design:
Controlled laboratory study.
Methods:
Real-time harmonic contrast-enhanced ultrasound (CEU) measurements of the MV of the Achilles tendon were taken in 18 volunteers (9 patients with AT, 9 healthy controls). The CEU analyses were conducted before exercise, immediately after a 1-hour treadmill run, and 24 hours after exercise. Surface electromyography (EMG) signals of the gastrocnemius were recorded continuously during the 1-hour treadmill run.
Results:
In both the controls and the patients with AT, the MV of the Achilles tendon was increased after exercise as compared with before exercise (P < .005). Additionally, the MV signal was significantly larger in the patients with AT before, immediately after, and 24 hours after the running exercise compared with values in healthy controls (P < .0001). The muscle activation pattern differed in patients with AT compared with controls in that controls had increased EMG amplitudes at the end of the 1-hour treadmill run in the medial and lateral gastrocnemius (P < .0001). Moreover, patients with AT had approximately 15% less elastic Achilles tendons at the beginning of the 1-hour treadmill run, a condition that did not change because of exercise.
Conclusion:
Acute exercise increases the MV of the Achilles tendon in healthy patients and patients with AT in a similar manner. However, patients with AT have a significantly larger MV at all time points compared with healthy patients, supporting the hypothesis that microvascular changes may be involved in the pathogenesis of tendinopathy.
Clinical Relevance:
This study underlines that tendon flexibility is altered in patients with AT and that CEU is a promising tool to establish the early diagnosis of this condition.
An injury to human tendons is a major problem at work as well as in the sporting community. It is estimated that up to 50% of all sports injuries result from overuse of connective tissue, among other tendon structures.27,35 Indeed, overuse injuries such as tendinopathy have been found to be associated with increased intratendinous blood flow determined by Doppler ultrasonography.29,45,47 However, the use of ultrasound Doppler activity as a diagnostic tool in the evaluation of chronic tendon injuries is currently debated, particularly because newly published findings are inconsistent. A study by Alfredson and colleagues 2 demonstrated that Doppler activity was present in a group of painful Achilles tendons, whereas none of the 20 healthy control tendons in the same study showed any sign of neovascularization. However, another study found no relationship between tendon symptoms and the presence of neovascularization. 51 Moreover, recent studies have confirmed that blood flow within the tendons can increase markedly after exercise in athletes with nonsymptomatic tendons. 7 Such findings therefore serve to underline that an increased blood flow determined by ultrasound Doppler per se is not a valid marker for tendon disorders. However, the recent development of ultrasound investigations combined with injections of contrast medium have resulted in a promising diagnostic tool that is much more sensitive than the conventional ultrasound Doppler method. Indeed, this technique is now enabling the detection of even the smallest vessels in tissues and thereby identifying even minute changes in the microvascular volume (MV) of the Achilles tendon with physical activity. 18 It has been shown that the MV increased significantly in healthy patients after a 1-hour treadmill run, while no changes could be detected by Doppler ultrasonography activity in the same patients. 42 How the MV is affected at rest and during physical activity in patients with Achilles tendinopathy (AT) is, however, still unclear. Other parameters that might be affected by tendinopathy during exercise are the mechanical properties of the tendon tissue. Previous findings have shown that tendinopathy decreases tendon stiffness and weakens the mechanical properties of tendons. 3 Additionally, it has been shown that long-term habitual loading increases tendon stiffness and strengthens the mechanical properties of the patellar tendon. 9 Interestingly, a 6-week period of eccentric training increased Achilles tendon stiffness, while concentric training did not have a similar positive effect. 38 Previous studies have been conducted using B-mode ultrasound measurements before and after exercise sessions, or during isometric contractions,9,34 but real-time recordings of tendon stiffness during running have never been investigated in tendinopathic tendons.
The primary aim of the present study was to investigate how the MV is affected by acute loading in chronically overloaded painful tendons. Furthermore, this study was directed at elucidating the relative tendon elasticity and muscle activation pattern in the gastrocnemius during running. The hypotheses to be tested were (1) that the MV parameter is elevated in patients with AT compared with healthy controls, (2) that increased pain levels are linked to an increased MV the day after loading, and further (3) that physical activity results in lower relative tendon elasticity and greater lower leg muscle weakness in patients with AT compared with healthy patients.
Materials and Methods
The present study was performed in accordance with the Declaration of Helsinki and was approved by the local ethical committee of the Capital Region of Denmark (H-2-2010-121). All patients gave their informed written consent before participating in the study.
Eighteen volunteers were recruited for the present study: 9 patients with unilateral tendinopathy of the Achilles tendon as well as 9 healthy controls. Patient characteristics are shown in Table 1. The inclusion criteria for the patients were men and women older than 18 years with unilateral chronic irritation of the Achilles midtendon (>6 months) and ability to run/walk on a treadmill for 1 hour. The patients were recruited by the same rheumatologist, who examined both Achilles tendons with conventional ultrasound using grayscale and ultrasound Doppler evaluations. All included patients had pain during palpation, had swollen Achilles midtendons, and showed some Doppler activity. The exclusion criteria for the patients were those treated with corticosteroids in or around the Achilles tendon within the past 6 months and those with diseases such as peripheral vascular disease, diabetes mellitus, arthritis, or a similar disease. The healthy controls did not have any history of subjective or objective AT and were matched for age, sex, and body mass index (BMI) to the patients.
Patient Characteristics a
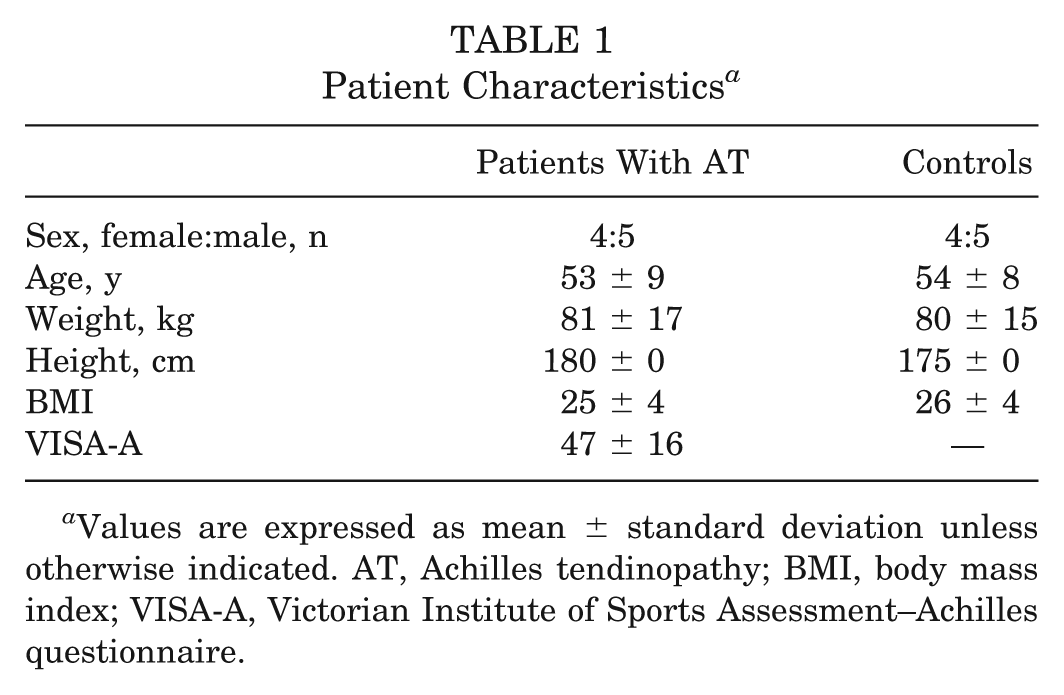
Values are expressed as mean ± standard deviation unless otherwise indicated. AT, Achilles tendinopathy; BMI, body mass index; VISA-A, Victorian Institute of Sports Assessment–Achilles questionnaire.
Experimental Procedure
Day 0
In both groups, the patients filled out an activity sheet by Aadahl and Jorgensen, 1 and the exercise activities from the past hour and the previous day were recorded. Additionally, ultrasound of both Achilles tendons was performed to determine the health status of the tendons. Finally, a strength test of the calf muscles was conducted to familiarize the patients with the equipment.
Day 1
All patients arrived in the morning. The electromyography (EMG) electrodes were placed on the medial and lateral heads of the gastrocnemius muscle. The EMG measurements were made on lower leg muscles in one leg during a strength test of plantar flexion. For the patients with AT, the EMG measurements were taken on the tendinopathic leg. After the strength test, a medial cubital vein was catheterized (BD Venflon Pro, Becton Dickinson Infusion Therapy AB, Helsingborg, Sweden), and a blood sample was obtained for analyses of creatine kinase (CK) and C-reactive protein (CRP) (Table 2). Further, a real-time harmonic contrast-enhanced ultrasound (CEU) examination of the Achilles tendon was performed, and ultrasound power and color Doppler images were taken. Finally, the EMG electrodes were placed on the gastrocnemius muscle and the adjacent Achilles tendon. To avoid disturbances from artifacts in the EMG signal due to swinging cables during activity, all patients wore net stockings during the run. Immediately after the 1-hour treadmill run, a new CEU examination and color Doppler imaging were performed. Thereafter, blood samples were taken, followed by a strength test.
Results of VISA-A, Strength Testing, and Blood Samples a
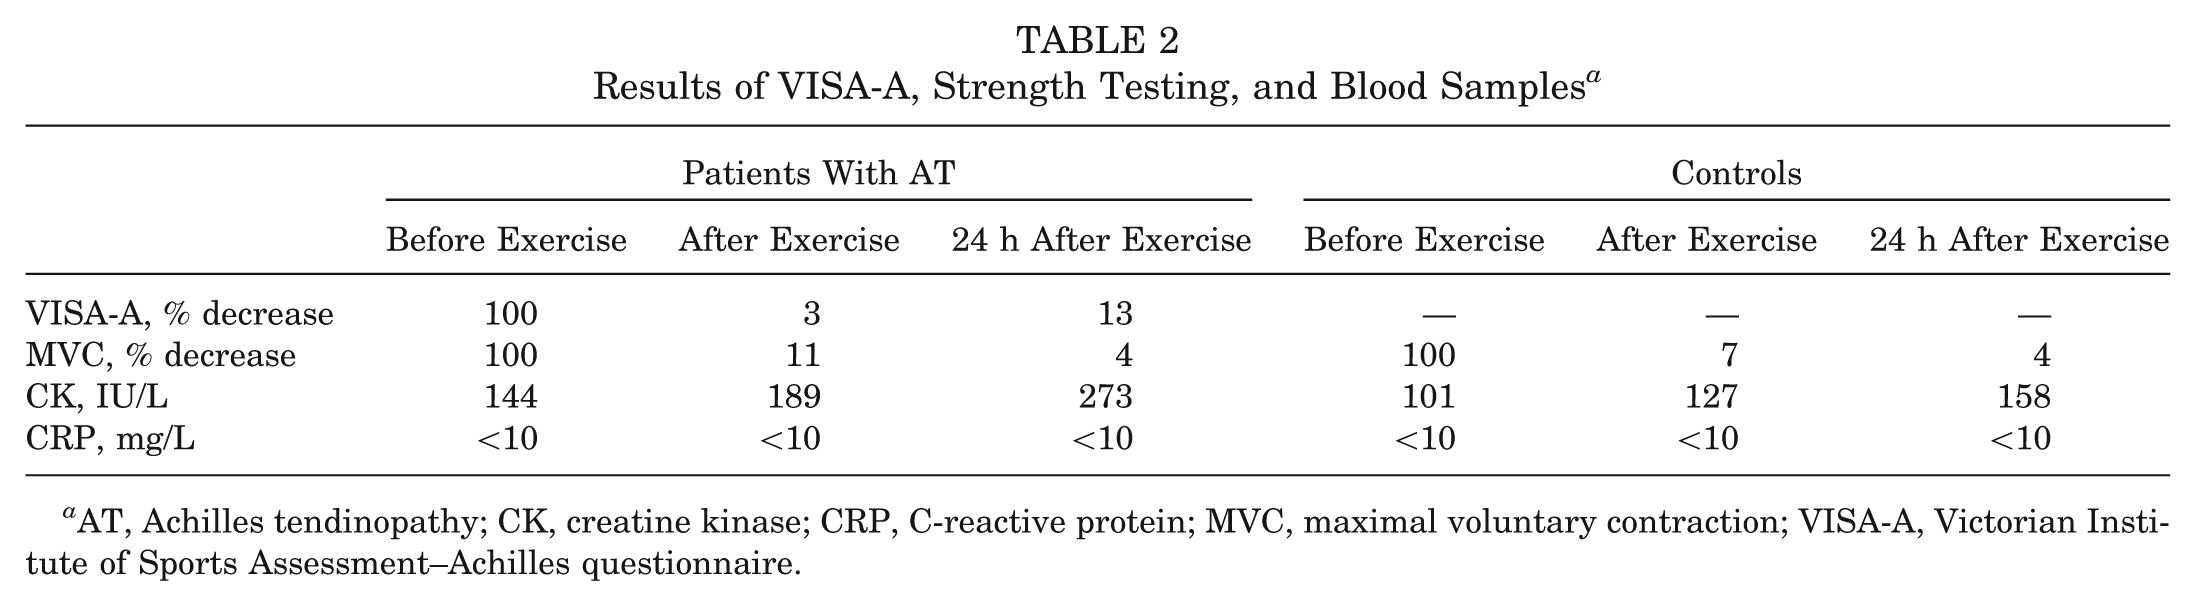
AT, Achilles tendinopathy; CK, creatine kinase; CRP, C-reactive protein; MVC, maximal voluntary contraction; VISA-A, Victorian Institute of Sports Assessment–Achilles questionnaire.
Day 2
At 24 hours after exercise, we performed a CEU examination of the same Achilles tendon as the day before and obtained both ultrasound power and color Doppler images, followed by a blood sample and a subsequent strength test. Furthermore, the patients filled out a Victorian Institute of Sports Assessment–Achilles (VISA-A) questionnaire10,26 at all 3 time points.
Real-Time Harmonic Contrast-Enhanced Ultrasound
Patients were placed comfortably in the supine position, while the left medial cubital vein was catheterized (18 G Venflon). Once this was achieved, the patients lay on a bed in a prone position, with both feet hanging over the end of the bed and the ankle hanging free with a small degree of plantar flexion. The ultrasound transducer was placed vertically above the most swollen and painful part of the Achilles tendon and fixed in a holder to prevent its displacement/movement during recordings. Moreover, the patients were instructed not to move throughout the recordings. The precise placement of the transducer was marked on the skin of the patients to ensure that exactly the same tissue volume was analyzed in subsequent measurements. The thickness of the layer of ultrasound gel that was applied avoided any pressure of the transducer on the underlying tissue. A bolus injection of 2.0 mL of the ultrasound contrast agent SonoVue (Bracco SpA, Milan, Italy) was injected intravenously, followed by an immediate flush of 20 mL of 0.9% saline solution. SonoVue is a suspension of phospholipid-stabilized microbubbles filled with hexafluoride and was diluted in 4.5 mL of 0.9% saline solution before injection (8 μL microbubbles/mL). Ultrasound was performed using a linear array transducer (L9-3 MHz) and an iU22 ultrasound scanner (Phillips Medical Systems, Bothell, Washington). Contrast-first harmonic signals were received at 8 MHz with a mechanical index of 0.06. The depth was set to 3 cm, allowing for measurements of the Achilles tendon and the peritendinous tissue. The focus and gain were optimized and standardized in each recording. Sequential image recordings of 20-millisecond duration were captured over a 2-minute period once the bolus had been injected (Figure 1). Immediately afterward, the power and color Doppler images were obtained using the same probe and the same machine throughout the study. Color Doppler was set up with an individually optimized scale range and hertz pulse repetition frequency, but the individual setting was always the same before, immediately after, and 24 hours after exercise. The color or power gain was set to cancel any noise signal.
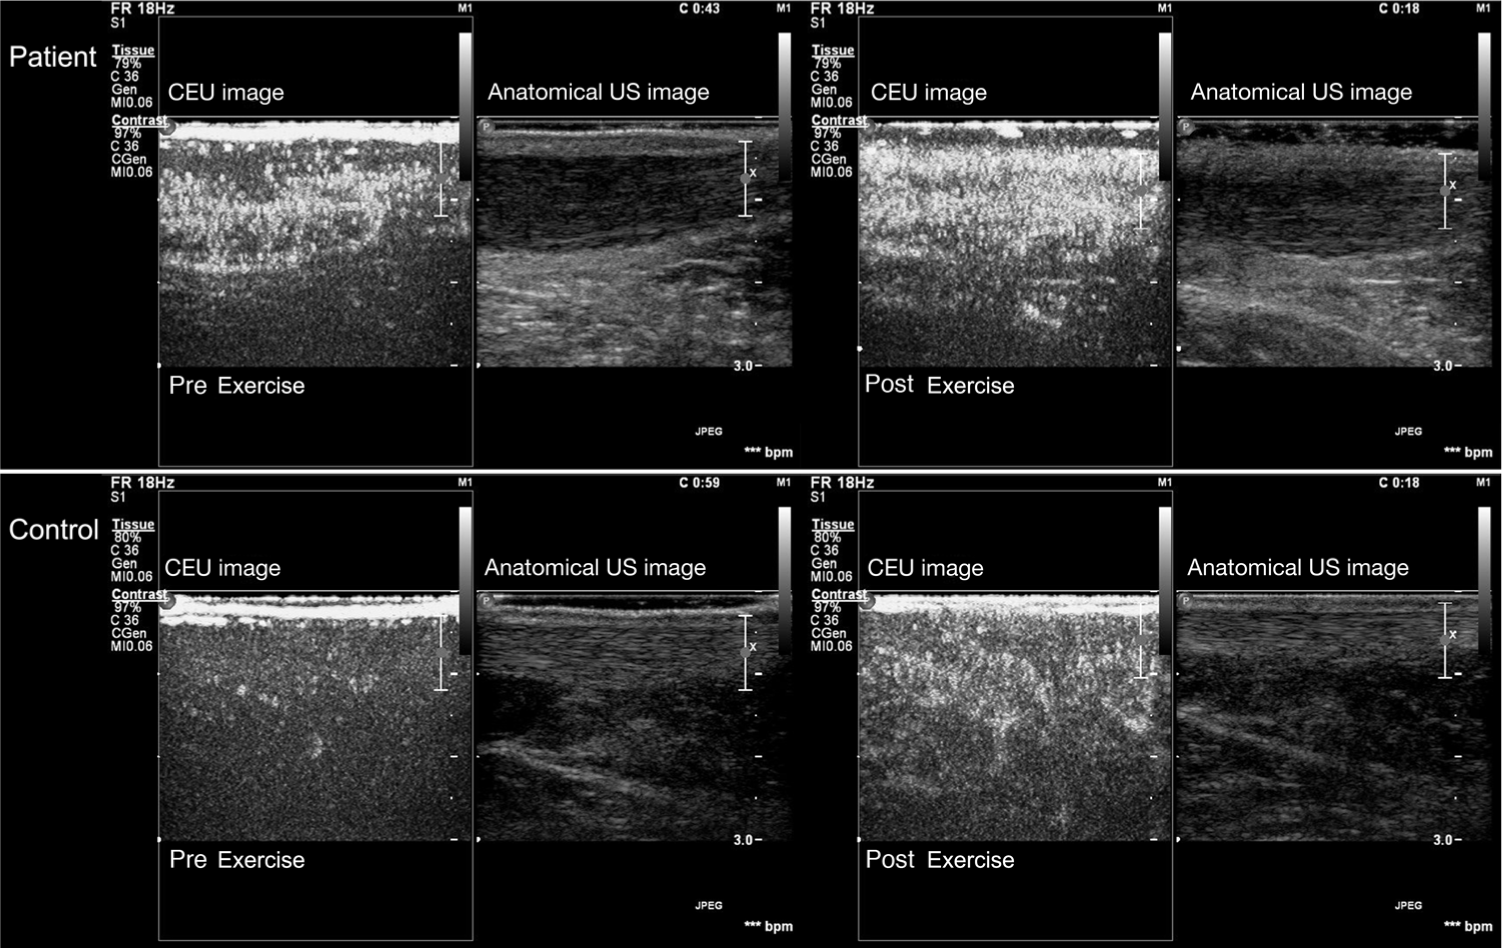
The patients show a significantly increased amount of microbubbles before exercise, while no microbubbles were observed in the tendons of the healthy controls. Both the patients with Achilles tendinopathy and the controls showed an increased amount of microbubbles in the Achilles tendon after 1 hour of running exercise.
CEU Image Analysis
Image analyses were performed offline using ultrasound quantification and analysis software (QLAB version 7, Phillips Medical Systems). The analysis consisted of an examination of a region of interest (ROI) in the medial portion of the Achilles tendon. The ROIs were placed in areas that excluded larger vessels. Within an ROI, the relative MV of blood in the tissue was determined as the mean signal intensity in decibels (dB) during the first plateau phase after subtraction of the baseline levels (the mean signal intensity registered before the bolus injection of contrast). All the analyses were conducted by the same researcher to avoid interindividual variations in the results, and each assessment was analyzed 3 times, with the mean values being used for further statistical calculations. The intraobserver agreement was calculated according to the statistical methods proposed by Bland and Altman. 6 All the MV assessments were transformed into an equivalent percentage scale of intraobserver agreement and were calculated to be 99.2% using the following formula:

EMG Recordings, Measurements, and Analyses
The study used a double differential electrode configuration, with electrodes (N-00-S and R-00-S, Blue Sensor R, Medicotest A/S, Ølstykke, Denmark) configured as described previously. 22 The EMG recordings were taken via a PowerLab 4/25T analog/digital converter (AD Instruments, Chalgrove, United Kingdom) with a further connection to a Mac PowerBook Air (Apple, Cupertino, California) with Chart v.5.5.6 Software (AD Instruments), Peak Parameters, and Spike Histogram extensions (AD Instruments). Input impedance was a 200-MΩ differential, and a high- and low-pass filter of 3 Hz and 500 Hz, respectively, were used. Sampling speed was set to 40,000 per second.
Recordings were taken from the gastrocnemius muscle of the right leg in the healthy patients and the leg with the most pain in the patients with AT, following the guidelines laid out in the European Recommendations for Surface Electromyography as detailed by the SENIAM project. 25 Differential recordings of EMG signals were made via surface electrodes from the medial and lateral heads of the gastrocnemius muscle. Information from any expected EMG results was not divulged to the patients, and participants were not allowed to follow their EMG recordings on the computer screen in real time. The recordings were carried out during a 1-hour treadmill run at a self-controlled speed. The recorded EMG signal was assessed as described previously 22 in terms of signal frequency (Hz) and peak-to-peak amplitude (V), using Chart analysis software. Unfortunately, as the result of sweating, the EMG electrodes on 1 control patient became displaced and failed to record during the latter half of the run.
An artifact, referred to as the Achilles tendon artifact (ATA), was also recorded using the EMG electrodes and equipment by simply placing 2 recording electrodes on the skin at the region of the Achilles tendon. 21 This recording artifact, which is nothing more than a baseline shift, represents the movement of the tendon under tension as the muscle contracts relative to the fixed electrodes on the skin. We have chosen to use this artifact as a means of understanding the active participation of tendons in the tension transfer from muscle to bone. This being an artifact, it cannot be seen as a direct measurement of tendon stiffness or loading. However, the time delay between the EMG signal and the peak of the ATA (in ms) can be used as a relative assessment of the elasticity of the tendon, with a longer time interval being indicative of a more elastic tendon and a shorter time interval being indicative of an inflamed and stiff tendon. 21
Muscle Strength Test (Maximal Voluntary Contraction Force)
The patients were seated in a custom-made rigid steel frame as previously described. 37 One leg at a time was tested, and the right leg was always tested first. The testing position of the leg was with fully extended knees, with the foot resting in a neutral position on the middle of the steel plate and the hip in 90° of flexion. The position of the heel was adjusted to ensure that the mechanical axis of rotation corresponded to the lateral malleolus. Plantarflexion force was measured with a strain gauge load cell attached between the footplate and the steel frame. Two sets of 5 contractions were performed (3 force ramp contractions and 2 maximum isometric plantarflexion movements). The first set was used as a warm-up and the second set sampled at 50 Hz by an analog-to-digital converter. Each contraction lasted 5 seconds, and there was a resting period of 1 minute between each contraction. Data were analyzed for maximum isometric plantarflexion force defined as the highest effort out of the 2 maximum isometric plantarflexion movements.
Statistical Analysis
A power calculation based on the variances, which we found in our previous studies42,50 with a significance level of .05 and a power of 80%, demonstrates that a significant change of 10% in the MV and EMG recordings can be shown with 9 patients in each group. The patient characteristics are shown as mean ± standard deviation; all other data are shown as mean ± standard error of the mean. A 2-way anaylsis of variance (ANOVA) was performed to compare the MV levels between patients with AT and controls and between results before, immediately after, and 24 hours after a 1-hour treadmill run and also to compare the amplitude and frequency of the gastrocnemius muscle (lateral and medial), the tendon artifact during the 1-hour treadmill run in both groups, and finally the maximal voluntary contraction (MVC), CK levels, and CRP levels before, immediately after, and 24 hours after the treadmill run. All statistics and graphs were made with the statistics software GraphPad Prism 4 (GraphPad Software, San Diego, California). The level of significance was P < .05 in all analyses.
Results
Basic patient characteristics are shown in Table 1.
Microvascular Volume
The mean MV of the patients with AT was significantly higher before, after, and 24 hours after a 1-hour treadmill run, as compared with the healthy control group (patients with AT: before, 1.45 ± 0.43 dB; immediately after, 2.56 ± 0.53 dB; 24 h after, 1.18 ± 0.41 dB; controls: before, 0.25 ± 0.08 dB; immediately after, 1.10 ± 0.17 dB; 24 h after, 0.44 ± 0.10 dB) (P < .0001) (Figure 2). In both groups, the MV increased significantly after exercise (P < .005). Furthermore, 24 hours after the 1-hour treadmill run, the MV had decreased and was back at baseline levels.
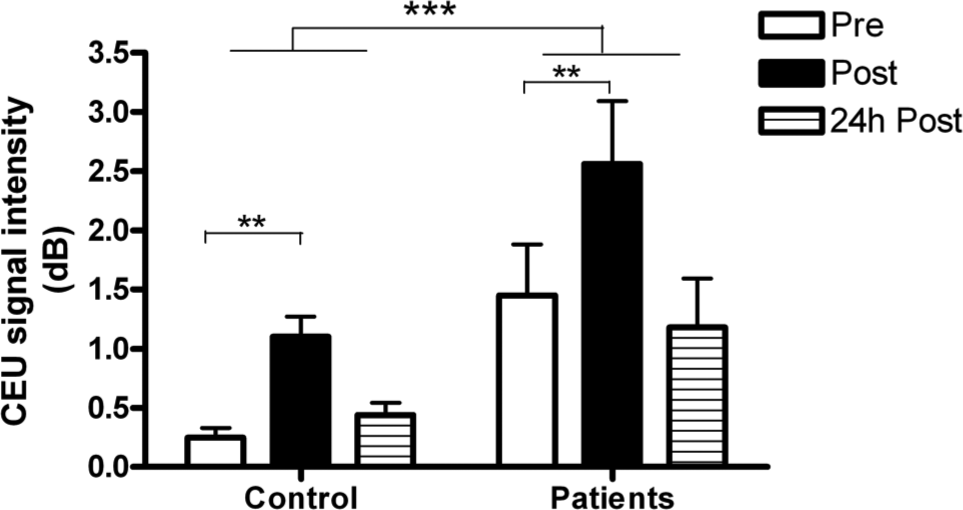
The microvascular volume (MV; in dB) of Achilles tendinopathy (AT) in patients with AT and controls before a 1-hour treadmill run, after exercise, and 24 hours after exercise. Values are shown as mean ± standard error of the mean. The MV of the patients with AT was significantly higher before, after, and 24 hours after exercise compared with the healthy control group. The MV in both groups increased significantly after exercise. **P < .005, ***P < .0001.
Surface Electromyography
Medial Gastrocnemius
A significant difference in the EMG amplitude signal in the medial gastrocnemius was observed between the groups and over time (P < .0001). While the controls showed a significant increase in the amplitude of the EMG at the end of the run (P < .0001), the patients with AT showed no significant change (Figure 3). In contrast, the patients with AT started with a higher frequency, as compared with the controls (P < .0001), in the medial gastrocnemius.
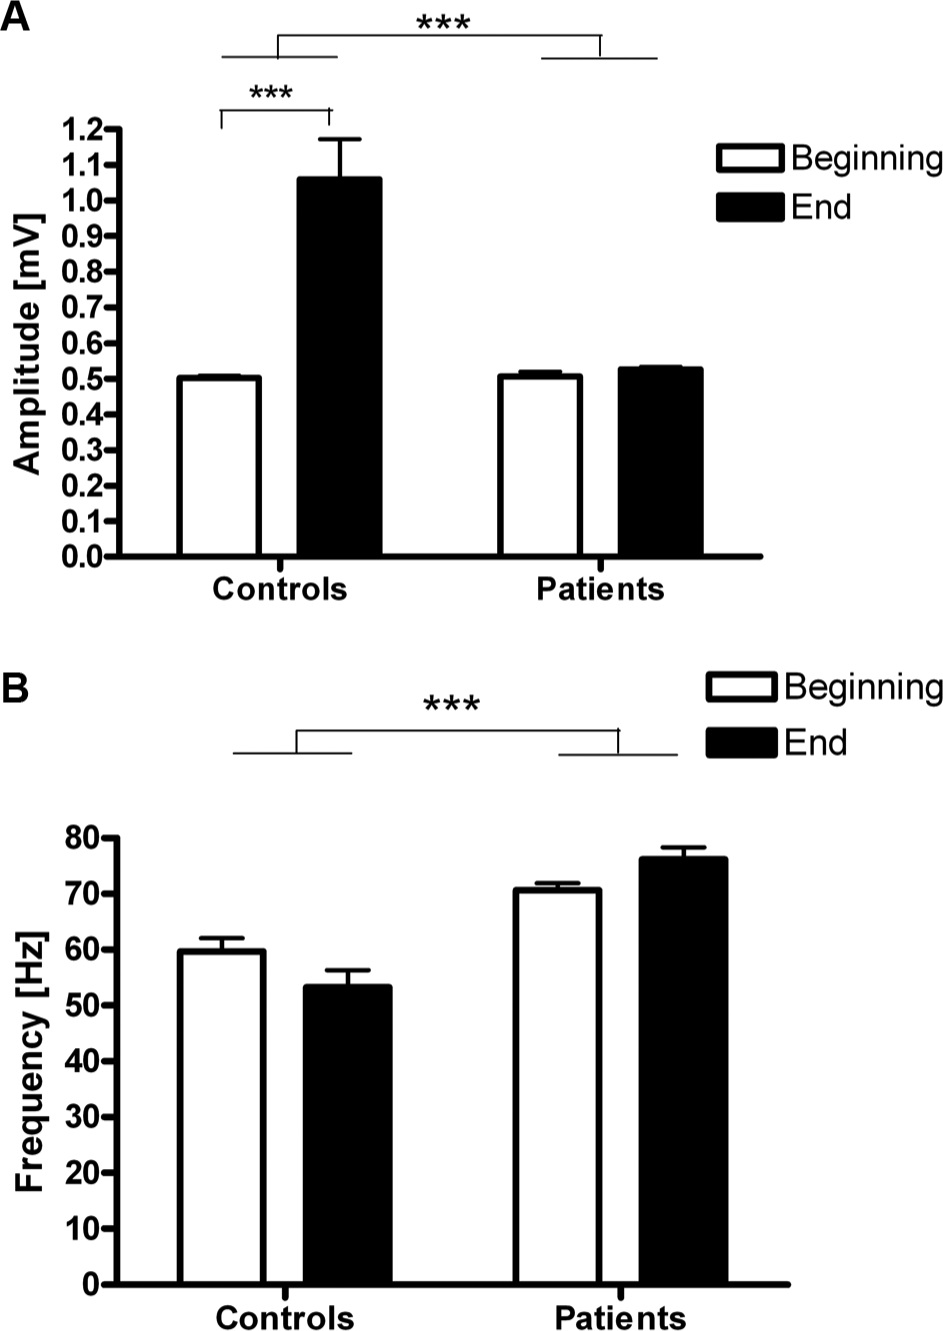
Recordings of the electromyography signal (A) amplitude (mV) and (B) frequency (Hz) for the medial head of the gastrocnemius muscle in controls and patients with Achilles tendinopathy (AT) at the start and end of a 1-hour treadmill run (mean values of the first 10 minutes of the run and from the last 10 minutes of the run). A significant difference in the amplitude was observed between the groups. While the patients with AT remained unchanged, the controls showed a significant increase in the amplitude toward the end of the run, indicative of fiber recruitment. A significant difference in the frequency was observed between the groups, indicating that the patients with AT “selected” to contract existing fibers at a faster rate rather than recruit extra fibers, as did the controls. Values are mean ± standard error of the mean of 8 controls and 9 patients with AT, respectively. Because of sweating, the electrodes on 1 control patient became detached, and the signal was lost during the run. ***P < .0001.
Lateral Gastrocnemius
In terms of the lateral head of the gastrocnemius muscle, the controls showed a very similar level of fiber recruitment (frequency and amplitude) throughout the 1-hour treadmill run (P < .2906) (Figure 4). However, the patients with AT exhibited a larger EMG signal amplitude in the lateral head of the gastrocnemius, as compared with the controls (P < .0001) (Figure 4).
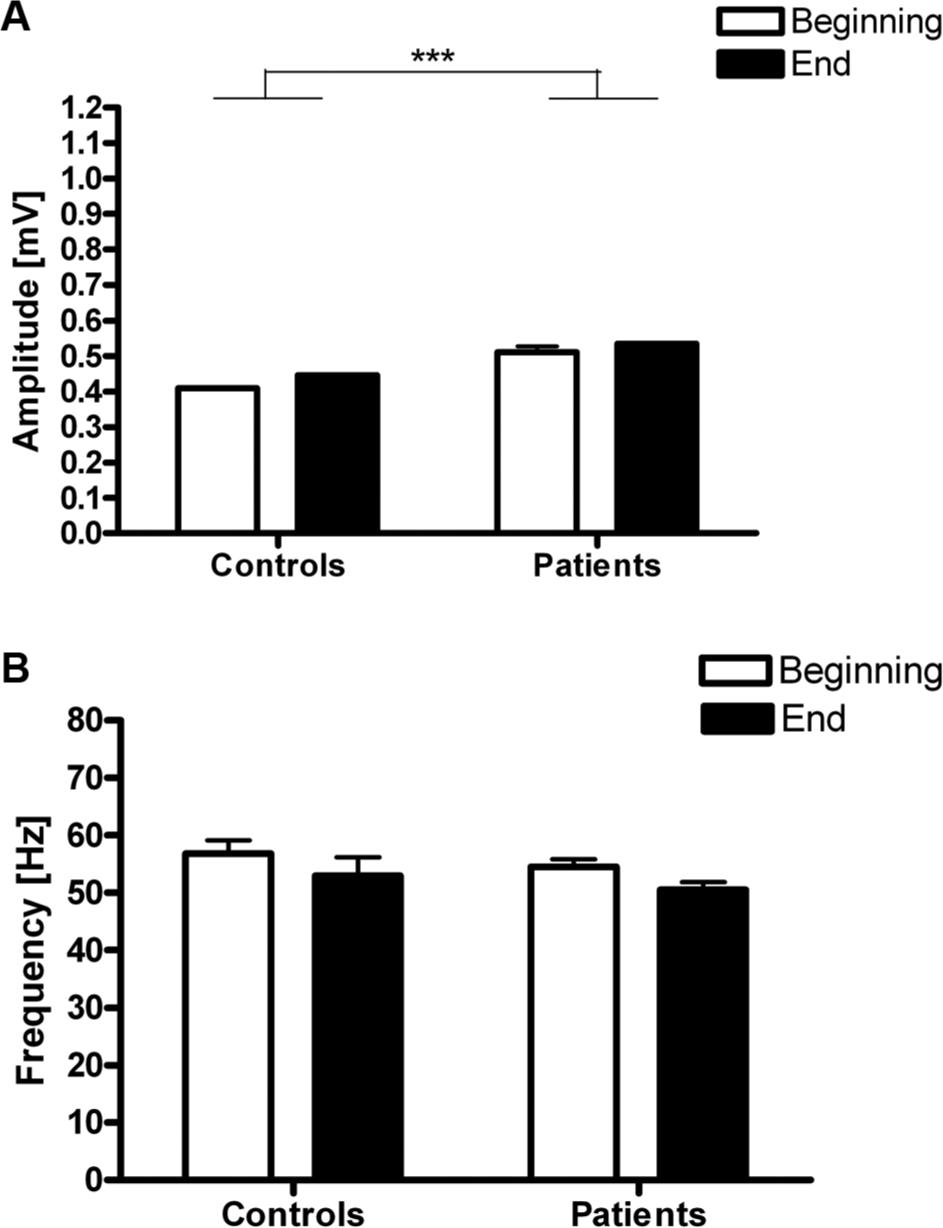
Recordings of the electromyography signal (A) amplitude (mV) and (B) frequency (Hz) for the lateral head of the gastrocnemius muscle of controls and patients with Achilles tendinopathy (AT) at the start and end of a 1-hour treadmill run (mean values of the first 10 minutes of the run and from the last 10 minutes of the run). The patients with AT exhibited a small, yet significantly greater, EMG signal amplitude in the lateral head of the gastrocnemius compared with the controls, indicative of increased fiber recruitment in this muscle. The frequency remained unchanged in both groups during the run (P < .29). Values are mean ± standard error of the mean of 8 controls and 9 patients with AT, respectively. Because of sweating, the electrodes on 1 control patient became detached, and the signal was lost during the run. ***P < .0001.
Achilles Tendon Artifact
The measurement of Achilles tendon elasticity, as assessed in terms of the ATA (ms), was approximately 15% lower in the controls than in the patients with AT (P < .0001) (Figure 5).
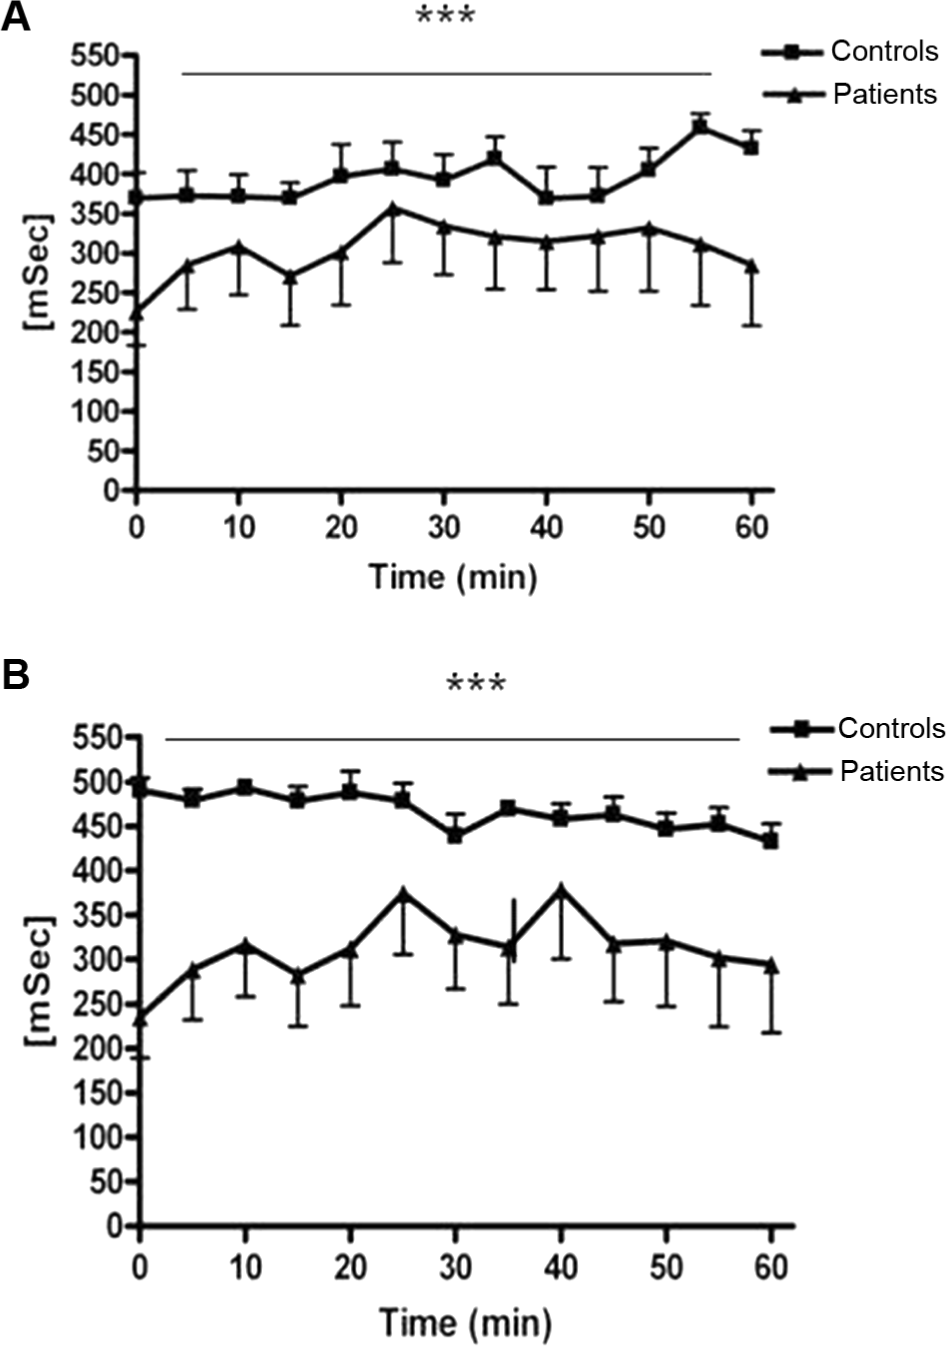
An example of the recorded signal of the tendon artifact for the patients with Achilles tendinopathy (AT) and controls during the 1-hour treadmill run as well as the electromyography signal for both the (A) medial and (B) lateral heads of the gastrocnemius muscle. Illustrated by mean ± standard error of the mean values for the patients with AT (n = 9) and controls (n = 8). Because of sweating, the electrodes on 1 control patient became detached, and the signal was lost during the run. There was a significant difference between the groups. ***P < .0001.
Heart Rate and Visual Analog Scale Score
The mean maximal heart rate during the 1-hour treadmill run of the patients with AT was 166 ± 7 beats per minute (bpm) and 135 ± 6 bpm for the healthy control group. The mean heart rate during the 1-hour treadmill run was 135 ± 6 in the patients with AT and 116 ± 6 bpm for the healthy patients. No pain was experienced in the tendons in the healthy patients during the entire run (visual analog scale [VAS] score = 0). In the patients with AT, the VAS score increased during the 1-hour treadmill run from a mean of 0.4 to 1.9 (arbitrary units).
Blood Parameters and Activity Level
The CK values in the blood increased significantly after exercise in both groups (patients with AT: P < .003; controls: P < .001). The patients with AT showed significantly higher CK values compared with the controls (P < .03). The CRP results were <10 mg/L in both groups and at all time points (Table 2). The mean activity level was estimated to be 47 ± 3 metabolic equivalents of task (METs) per day in the patients with AT and 51 ± 3 METs per day in the controls.
MVC Force
The MVC of the patients with AT decreased 11% after the 1-hour treadmill run and was still decreased by 4% at 24 hours after the 1-hour treadmill run (before, 400 ± 45 N; immediately after, 355 ± 58 N; 24 h after, 384 ± 56 N). The MVC of the controls decreased by 7% after the 1-hour treadmill run and was still decreased by 4% at 24 hours after the 1-hour treadmill run (before, 493 ± 68 N; immediately after, 456 ± 73 N; 24 h after, 472 ± 74 N). There was no significant difference between the groups (P = .07).
Discussion
The major finding of the present study is that the MV in the Achilles tendon is increased at rest, after exercise, and 24 hours after exercise in patients with AT compared with values recorded for healthy control patients. In addition, this study showed that the MV increased after a 1-hour treadmill run in both healthy patients and patients with AT. Tendon injuries have previously been associated with low or reduced vascular perfusion in tendons.46,53,54 However, in contradiction to these findings, chronic tendon injuries often show an increase in cellularity and vascularity28,31,45 and, furthermore, an increase in the tendon blood flow.4,5 Whether this is a healing response to the initial injury is still not clarified.
Previous studies have mainly investigated the MV of tendons at rest in both healthy patients and in patients with tendon injuries.17,32 One study has shown that 1 to 2 sets of 20 repetitions of forward shoulder elevations increase blood flow to the rotator cuff tendons, as measured using CEU. 8 However, the present study is the first to measure the MV in the Achilles tendon of patients with AT before and after a 1-hour treadmill run. Running was used as a model, as it often causes AT because of its repetitive loading nature. 33 Ultrasound has previously been described as being the most valuable tool of all instruments used in the prevention, diagnostics, and rehabilitation of sports injuries14,44,49 and has widely been used to show changes in blood flow in the tendon.15,16,52 However, research in more recent years has uncovered several limitations of this method. 19 One of the major limitations of this method is that it can detect neovascularization only in quite severe cases because its detection of small vessels is limited. 13 Furthermore, it has been observed that the level of pain is not always related to increased Doppler activity. 51 One study observed a very poor relation between symptoms and ultrasound-detected abnormalities in the Achilles tendon when 40 elite gymnasts were compared with 40 healthy controls. 11
It has previously been reported that CEU has higher sensitivity as compared with ultrasound Doppler, and as a consequence, its use may improve the detection of intratendinous and peritendinous vascularity. 32 Indeed, in support of which, a similar observation has been made in patients with rheumatoid arthritis 39 and various other diseases.20,24,48 The inclusion criteria for the present study were chronic tendon pain for more than 6 months and increased ultrasound Doppler activity. In fact, several participants were excluded because of the lack of Doppler activity in their tendon despite their having reported pain in the Achilles tendon for more than 6 months. This underlines the notion that ultrasound Doppler is not sufficiently sensitive, at least in some cases, to detect all forms of pathological changes in tendons. Furthermore, CEU is used in several other clinical conditions, for example, gestational trophoblastic diseases, arthritis, and cancer, because of greater sensitivity, as compared with ultrasound Doppler alone.12,30,36 In this respect, one could envisage CEU as a technical enhancement of an existing tool (ultrasound) that provides an additional means of assessment to the existing lines of investigation, for example, ultrasound and ultrasound Doppler. Indeed, it may even facilitate the earlier clinical detection of tendinopathy than has hitherto been possible.
Compared with a conventional ultrasound Doppler examination, CEU is slightly more resource demanding. In addition, ultrasound contrast media may, in rare cases, induce side effects (eg, headache and nausea in 1%-10% of the patients). However, the increased diagnostic sensitivity, especially in patients complaining of pain in the tendon without showing any Doppler activity justifies the use of this technique.
The present study shows that pathological tendon tissue yields a more pronounced response to loading compared with healthy tendon tissue. The patients with AT often report that their increase in pain was more pronounced the day after loading than during loading. It was therefore hypothesized that the increased pain levels might be linked to an increased MV the day after loading. Because the MV in the present study drops to baseline levels at 24 hours after exercise, this hypothesis was rejected. In a previous study using the same design as the present, the MV levels were still a bit elevated at 24 hours after a 1-hour treadmill run in healthy patients. 42 However, the variation was very high at that particular time point because of a single person who still showed a very elevated MV. A 7% decrease in MVC after a 1-hour treadmill run was found in the healthy controls and in the healthy control leg of the patients with AT. However, the muscle strength of the tendinopathic leg decreased by 11% after the 1-hour treadmill run. It has been suggested previously that muscle fatigue predisposes to tendon injuries.23,40,43,53 It is difficult to distinguish between cause and effect in this case. The increase in amplitude of the EMG signal in the medial head of the gastrocnemius muscle with running in the controls is indicative of the recruitment of additional muscle fibers. 41 Interestingly, such a recruitment is not seen in the patients with AT (Figure 3). Additionally, the controls presented a very constant EMG frequency throughout the 1-hour treadmill run, which is in line with the findings of increased amplitude: the only way the central nervous system then has to increase muscle force is to increase fiber recruitment and synchrony. Thus, it seems that the controls run with a lower frequency of muscle fiber activation and increase the number of fibers involved as the initially active fibers begin to fatigue. In contrast, the patients with AT start at the onset of running with a higher EMG frequency compared with the controls. The EMG amplitude and frequency results obtained from the lateral gastrocnemius lead us to suggest that the patients with AT were using their lateral gastrocnemius more to produce force than was the case in the controls. This finding further leads us to suggest that the pattern of increased use of the lateral gastrocnemius in patients with AT perhaps might be the result of a shift in ankle and foot placement during the 1-hour treadmill run arising from tendon pain (Figure 4). Regarding tendon elasticity, the present results indicate that the controls start with a tendon that is relatively more elastic (~15%) than the patients with AT and that the tendon becomes marginally more elastic during the 1-hour treadmill run in the controls (~15%). The tendon elasticity was systematically lower in the patients with AT (ie, more stiff) compared with the healthy controls and changed very little during the 1-hour treadmill run (Figure 5). This is in line with previous observations, showing that habitual loading increased patellar tendon stiffness. 9 The participants in the present study were allowed to run at an individual pace and were allowed to walk, if necessary. Walking affected the activation pattern of the gastrocnemius and thus also the stiffness of the Achilles tendon. For this reason, the present results unfortunately do not enable us to make any conclusions with regard to the effect of loading on stiffness during the run for patients with AT.
Conclusion
The present data reveal that a 1-hour treadmill run increases the MV of the Achilles tendon in both healthy patients and in patients with AT. Moreover, the data indicate that patients with AT have significantly larger MVs in their diseased Achilles tendons, at rest as well as directly after running and 24 hours after a 1-hour treadmill run, when compared with healthy patients. This finding supports the hypothesis that microvascular changes may play a role in the pathogenesis of tendinopathy. It is furthermore concluded that CEU represents a very sensitive means of detecting even very small microvascular changes, and thus, this method may provide researchers with a promising tool for both tendinopathy research as well as the clinical detection of tendinopathy at earlier stages of development than has hitherto been possible.
Footnotes
Acknowledgements
The authors are grateful to Mr A. Witten for his help with this experiment.
One or more of the authors has declared the following potential conflict of interest or source of funding: The present study was supported by the Danish Rheumatism Association, the Novo Nordic Foundation, the Danish Ministry of Culture Committee for Sports Research, the Danish Medical Research Counsel (22-04-0191), and the Nordea Foundation (Healthy Aging grant).