
Abstract
Background:
Graft hypertrophy is a common occurrence after periosteal, collagen-covered and matrix-induced autologous chondrocyte implantation (MACI).
Purpose/Hypothesis:
The purpose of this study was to investigate the incidence, development, and degree of graft hypertrophy at 24 months after MACI. The hypothesis was that graft hypertrophy would not be associated with clinical outcome at 24 months.
Study Design:
Case series, Level of evidence, 4.
Methods:
This study was undertaken in 180 consecutive patients (113 male, 67 female) after MACI in the knee. All patients were assessed clinically using the Knee injury and Osteoarthritis Outcome Score (KOOS) and underwent magnetic resonance imaging (MRI) at 3, 12, and 24 months after surgery. The incidence of hypertrophy relevant to anatomic graft site was investigated, as was the progressive change in hypertrophic studies postoperatively. The degree of tissue overgrowth in hypertrophic cases was investigated, as was its association with patient clinical outcome at 24 months after surgery.
Results:
Of the 180 patients, 50 demonstrated a hypertrophic graft at 1 or more postoperative time points. This included 9 grafts (5.0%) at 3 months and 32 grafts (18.7%) at 12 months. At 24 months, 47 grafts (26.1%)—43 (32.1%) tibiofemoral and 4 (8.7%) patellofemoral—were hypertrophic. Patients with hypertrophic grafts at 24 months (n = 47) were younger (P = .051), they had a lower body mass index (BMI; P = .069), and significantly fewer of them had patellofemoral grafts (P = .007) compared with patients who had grafts with full (100%) tissue infill (n = 61). There were no significant differences in any of the KOOS subscales between patients with graft hypertrophy or full (100%) tissue infill at 24 months after surgery, while the severity of graft hypertrophy was not associated with KOOS subscales at 24 months.
Conclusion:
Hypertrophic grafts after MACI were common and continued to develop through to 24 months after surgery. Hypertrophic growth was associated with being younger and having a lower BMI, was more common on the femoral condyles, and overall was not associated with clinical outcome at 24 months after surgery. However, further research with longer term follow-up is required to evaluate the effect of persistent hypertrophy on graft stability and to assess the use of early surgical intervention to prevent such failure.
Keywords
Autologous chondrocyte implantation (ACI) has become an established technique for the repair of full-thickness chondral defects in the knee. 24 It is a 2-stage procedure with an initial harvest of healthy cartilage, isolation and expansion of chondrocytes ex vivo, and subsequent reimplantation of cells into the chondral defect. Traditional ACI techniques required the injection of cells under a periosteal 6 or biodegradable collagen 5 membrane that was sutured to the adjacent healthy cartilage walls. The most common postoperative complication occurring with periosteal-covered ACI, primarily the result of the periosteal cover, is tissue overgrowth above the height of the adjacent native cartilage thickness, also referred to as graft hypertrophy or protuberance.1,14,16,21 A pertinent issue with a hypertrophic graft is the persistence of postoperative clinical symptoms, which may result in subsequent debridement surgery of the hypertrophic tissue. 21 More recently, the use of a collagen membrane cover has demonstrated a reduced hypertrophic incidence and rate of reoperation as a result of graft hypertrophy, when compared with periosteal-covered ACI. 11
Matrix-induced ACI (MACI) has attempted to overcome these drawbacks by seeding chondrocytes directly onto a type I/III collagen membrane and fixing it to the underlying subchondral bone with fibrin glue. MACI has also demonstrated encouraging postoperative clinical outcomes and evidence of tissue regeneration in the treatment of knee chondral defects.2,8,9 However, it was recently demonstrated that the incidence of graft hypertrophy may be similar to that reported previously for periosteal-covered ACI. 26 This study also demonstrated that the incidence of hypertrophy was not associated with clinical outcome at 2 years, although the investigation was undertaken in a small patient sample. 26
The overall aims of the current study were to investigate (1) the overall incidence and degree of graft hypertrophy, and incidence via anatomic graft location site, at 3, 12, and 24 months after MACI; (2) the progression of graft hypertrophy throughout the postoperative timeline to 24 months; and (3) the association between graft hypertrophy and clinical outcome at 24 months after surgery. Our primary hypothesis was that the incidence and degree of graft hypertrophy at 24 months after surgery are not associated with patient clinical outcome.
Methods
Patients
This analysis consisted of 180 consecutive patients (113 male, 67 female) recruited into our clinical and research program between June 2004 and June 2010 after undergoing MACI to address full thickness cartilage defects. The mean age of the patient cohort was 37.6 years (range, 13-67 years), the mean body mass index (BMI) was 26.4 (range, 16.6-39.4), and the mean graft size was 3.12 cm2 (range, 1.0-12.0 cm2). Overall patient information and demographics stratified by anatomic graft location are provided in Table 1. Of the 180 grafts, anatomic distribution was medial femoral condyle (MFC) (n = 94), lateral femoral condyle (LFC) (n = 34), medial tibial plateau (MTP) (n = 2), lateral tibial plateau (LTP) (n = 4), patella (n = 23), and trochlea (n = 23). Ethics approval was obtained from the appropriate hospital and university human research ethics committees.
Patient Demographics of the Overall Cohort and Stratified by Anatomic Grafting Location a
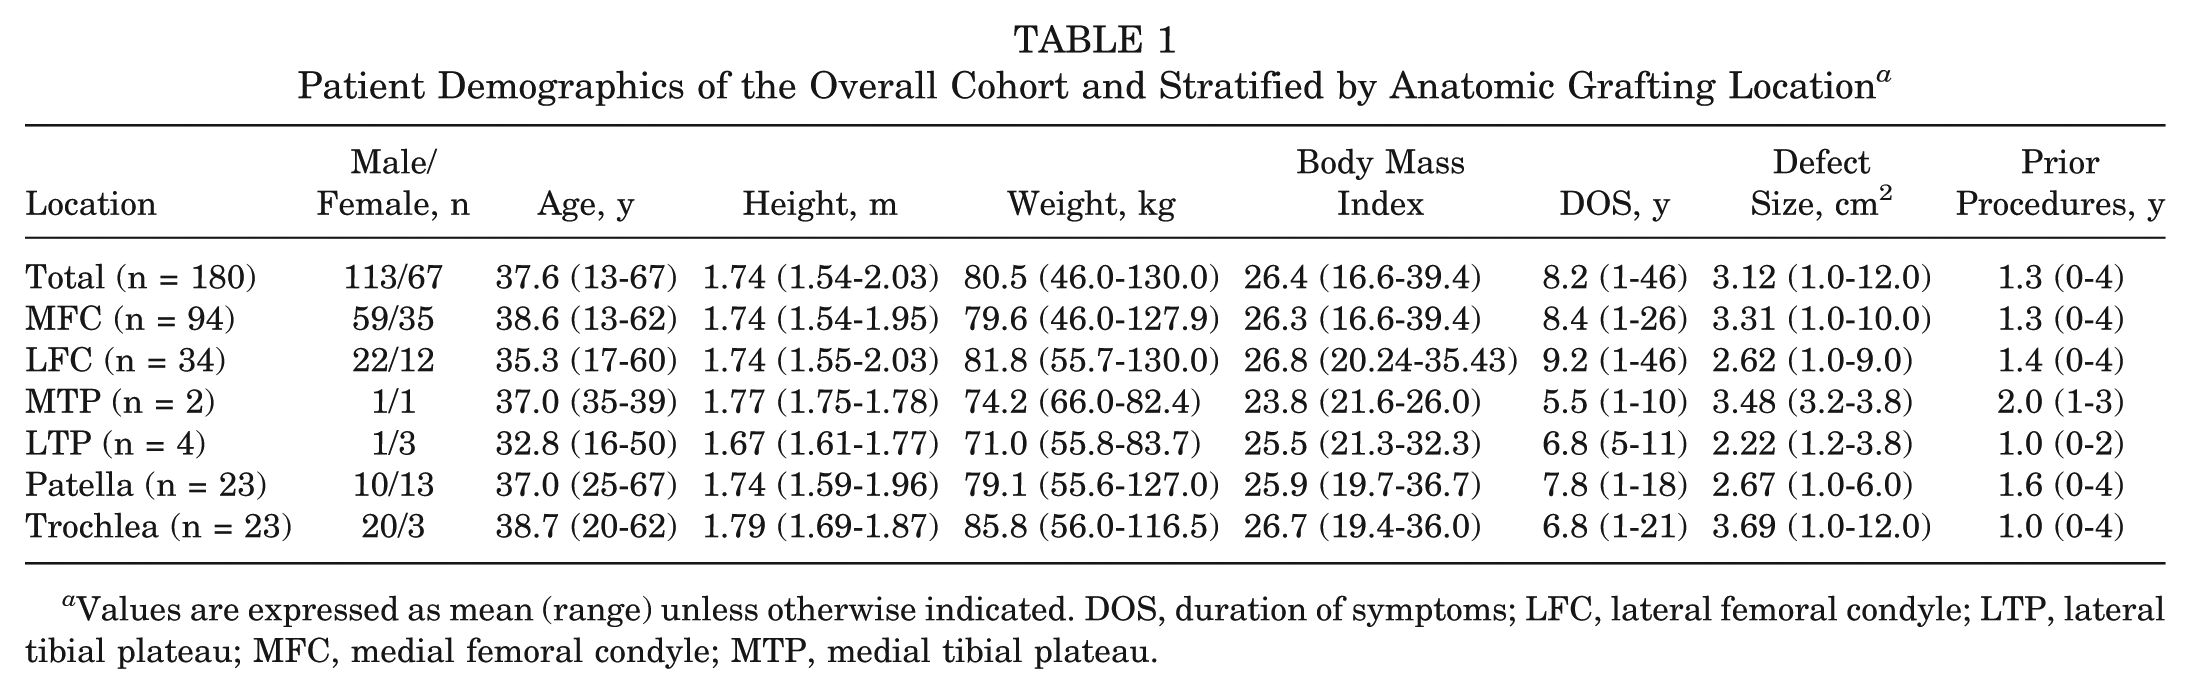
Values are expressed as mean (range) unless otherwise indicated. DOS, duration of symptoms; LFC, lateral femoral condyle; LTP, lateral tibial plateau; MFC, medial femoral condyle; MTP, medial tibial plateau.
Surgical Technique
MACI is a 2-stage surgical technique that has been previously described. 9 Arthroscopic surgery was initially performed to harvest a sample of normal articular cartilage from a nonweightbearing area of the knee. The cartilage biopsy specimen was then sent to the laboratory (Genzyme), whereby chondrocytes were isolated, cultured, and seeded onto a type I/III collagen membrane (ACI-Maix, Matricel GmbH) ex vivo over a 6- to 8-week period. At the time of second-stage implantation, the chondral defect was prepared via an open mini-arthrotomy by removing all damaged cartilage down to, but not through, the subchondral bone plate. The defect was measured and used to shape the membrane, which was secured to the bone using fibrin glue.
Outcome Measures
Clinical Assessment
All 180 patients completed the Knee injury and Osteoarthritis Outcome Score (KOOS) at 3 months (±2 weeks), 12 months (±1 month), and 24 months (±2 months) after surgery. The KOOS is a knee-specific questionnaire that includes 42 questions in 5 individual subscales: Pain, Symptoms, Activities of Daily Living (ADL), Sport and Recreation (Sport/Rec), and Knee-Related Quality of Life (QOL). 29 The KOOS has been recommended for use with cartilage repair patients 28 and, more recently, has demonstrated validity and reliability in patients after the surgical treatment of focal cartilage lesions. 4 It has been used extensively in patients after ACI. 
Radiological Assessment
Patients underwent magnetic resonance imaging (MRI) scans on their operated knee at 3 months (±2 weeks), 12 months (±1 month), and 24 months (±2 months) after MACI, by use of a 1.5- or 3-T clinical scanner (Siemens, Philips, or General Electric). Standardized proton density and T2-weighted fat-saturated images were obtained in coronal and sagittal planes (slice thickness, 3 mm; field of view, 14-15 cm; 512 matrix in at least 1 axis for proton density images with a minimum 256 matrix in 1 axis for T2-weighted images). Additional axial proton density fat-saturated images were obtained (slice thickness, 3-4 mm; field of view, 14-15 cm; minimum 224 matrix in at least 1 axis). These sequences form part of the routine knee MRI protocol at the authors’ institution.
Initially, the MOCART (magnetic resonance observation of cartilage repair tissue) scoring system17,18 was used to evaluate the degree of repair tissue infill in all grafts on MRI at 3, 12, and 24 months after surgery, including (1) poor, subchondral bone exposed; (2) fair, <50% height of adjacent cartilage; (3) good, >50% height of adjacent cartilage; (3.5) very good, graft hypertrophy; and (4) excellent, complete 100% infill. After this, those studies with grafts deemed to be hypertrophic via the MOCART scoring method were further graded based on the degree of hypertrophic graft tissue infill to that of the surrounding native cartilage, as per the scoring method explained below. All hypertrophic studies were scored by 2 experienced musculoskeletal radiologists.
The hypertrophic grading windows were based on 10% overgrowth increments and included the following: 110% ± 5% (ie, 105%-114%), 120% ± 5% (ie, 115%-124%), 130% ± 5% (ie, 125%-134%), 140% ± 5% (ie, 135%-144%), 150% ± 5% (ie, 145%-154%), and 160% ± 5% (ie, 155%-164%) (Figure 1). As previously reported, femoral-tibial grafts were measured in the sagittal plane and patella-trochlea grafts in the axial plane. 26 The ratio between the thickest area of the graft and the native cartilage thickness was calculated. 16 The thickness of the graft and surrounding native cartilage was measured in Inteleviewer software (Intelerad Medical Systems Inc) using DICOM (Digital Imaging and Communications in Medicine) data sets. The images demonstrating the chondral graft were magnified as required before measurement of graft height to improve the accuracy of the measurement.
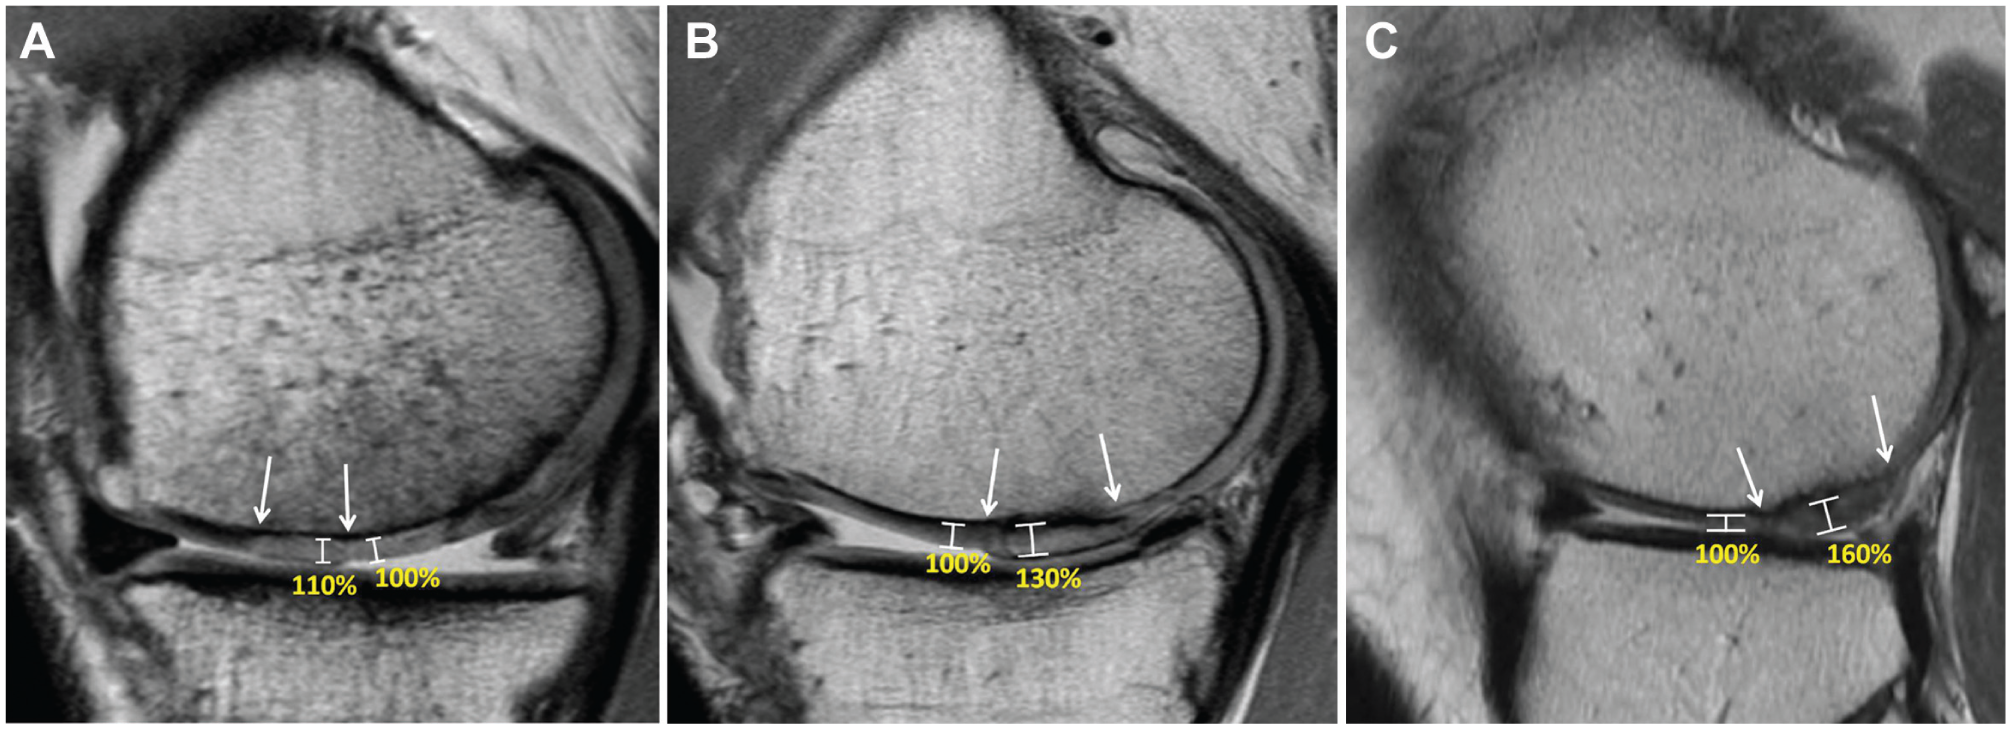
Proton density fast spin-echo magnetic resonance images demonstrating 3 hypertrophic grafts, each on the medial femoral condyle, measuring (A) 10% (105%-114%), (B) 30% (125%-134%), and (C) 60% (155%-164%) overgrowth, in comparison with the adjacent native cartilage. All 3 femoral grafts are demonstrated between the arrows.
Statistical Analysis
Initially, the kappa coefficient (κ) was used to determine intraobserver reliability for assessment of the variable “repair tissue infill” from the MOCART scoring system. This was achieved by rescoring 20 randomly selected MRI images filtered through a second time to the radiologist. Second, interobserver reliability for the hypertrophic grading system was evaluated using weighted κ for multiple raters, and intrarater reliability was assessed using weighted κ (Stata kappa2). As outlined later, a total of 88 MRI scans in this cohort demonstrated a hypertrophic MACI graft as per the variable “repair tissue infill” from the MOCART scoring system (n = 9 at 3 months; n = 32 at 12 months; n = 47 at 24 months). Therefore, interrater reliability was calculated by a second radiologist additionally scoring the degree of graft hypertrophy for all 88 MRI scans. Intrarater reliability was achieved by the second radiologist rescoring a random sample of 25 MRI scans that spanned the 3-, 12-, and 24-month time points.
Summary statistics for patient demographics and incidence of graft hypertrophy were calculated for the total cohort and by graft anatomic distribution sites. For those patients with graft hypertrophy at 1 or more time points (3, 12, and/or 24 months), the postoperative progression of MOCART grading of tissue infill was summarized. Scores for the degree of hypertrophy, as per the aforementioned scoring method, were tabulated for those grafts deemed hypertrophic at each time point. Comparison of patient demographics, graft characteristics, and KOOS results between MOCART infill grading categories “hypertrophic” and “full tissue infill” at 24 months was performed via analysis of variance or chi-square tests. A comparison of KOOS results between MOCART infill grading categories “hypertrophic” and “full tissue infill” at 24 months was also performed by use of multivariable linear regression, with adjustment for factors associated with graft hypertrophy at P < .100 in the previous univariable analyses. In those patients exhibiting graft hypertrophy at 24 months, Spearman correlation coefficient was used to assess the association between the degree of hypertrophy and KOOS subscales at 24 months. Statistical analysis was performed using Stata/IC 13.1 for Windows (StataCorp LP), with statistical significance set at α = .05.
Results
All 180 patients underwent clinical assessment and MRI assessment at 3 and 24 months after surgery. While all patients underwent clinical evaluation at 12 months after surgery, only 171 (of 180) underwent MRI evaluation at 12 months; however, none of the 9 patients who missed their 12-month MRI were graded as hypertrophic at 3 or 24 months.
Evaluation of intraobserver reliability indicated perfect agreement (1.00) for the MOCART scoring variable “repair tissue infill” for the 20 randomly selected image pairs. Interrater reliability for the grading of severity of hypertrophy was high (weighted κ = 0.830), as was intrarater reliability (weighted κ = 0.903).
At 3 months after surgery, the degree of graft infill as indicated by the MOCART scoring system was excellent in 25 of the 180 patients (complete 100% infill); good in 90 patients (>50% height of adjacent cartilage); fair in 48 patients (<50% height of adjacent cartilage); and poor in 8 patients (subchondral bone exposed). A total of 9 grafts (5.0%) were hypertrophic at 3 months after surgery, which included 7 (5.2%) tibiofemoral and 2 (4.3%) patellofemoral grafts (Table 2). The degree of tissue overgrowth of these 9 hypertrophic grafts, in comparison to the adjacent native articular cartilage, is shown in Table 3.
Incidence of Graft Hypertrophy at 3, 12, and 24 Months After Surgery According to Overall Patient Group and Anatomic Knee Grafting Location a
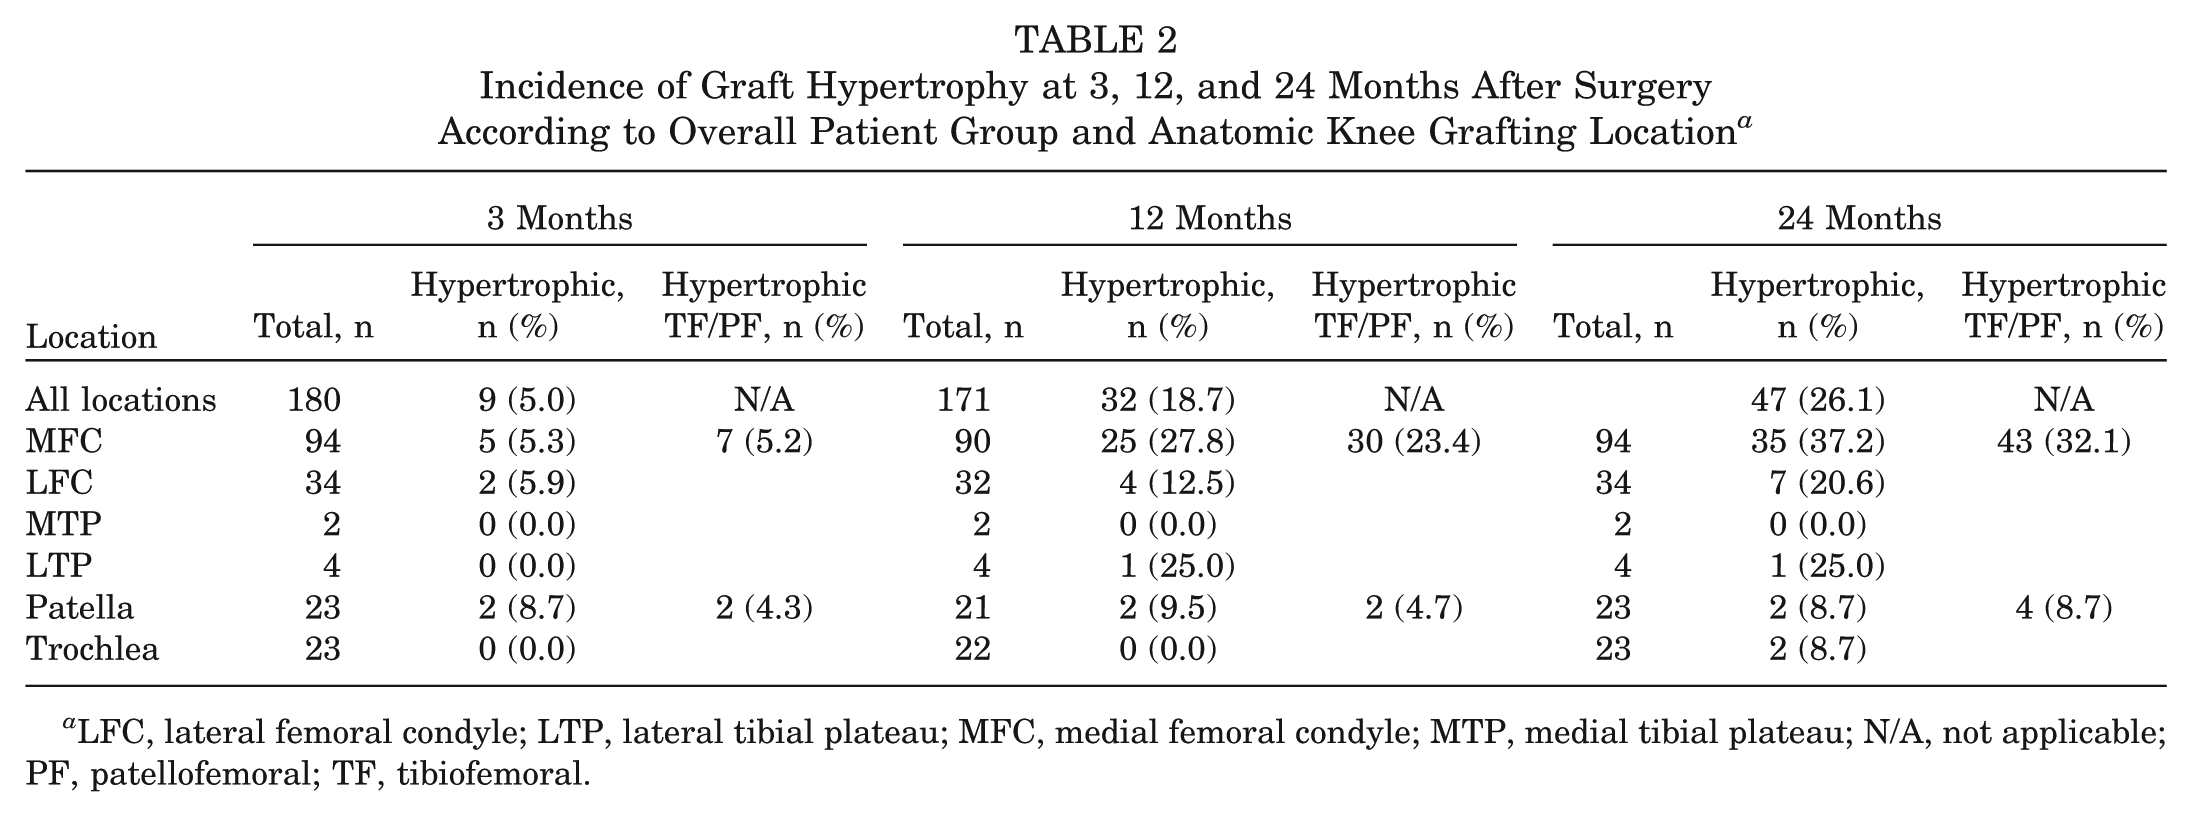
LFC, lateral femoral condyle; LTP, lateral tibial plateau; MFC, medial femoral condyle; MTP, medial tibial plateau; N/A, not applicable; PF, patellofemoral; TF, tibiofemoral.
Degree of Graft Overgrowth in Hypertrophic Grafts at 3, 12, and 24 Months After Surgery Compared With the Adjacent Native Articular Cartilage a
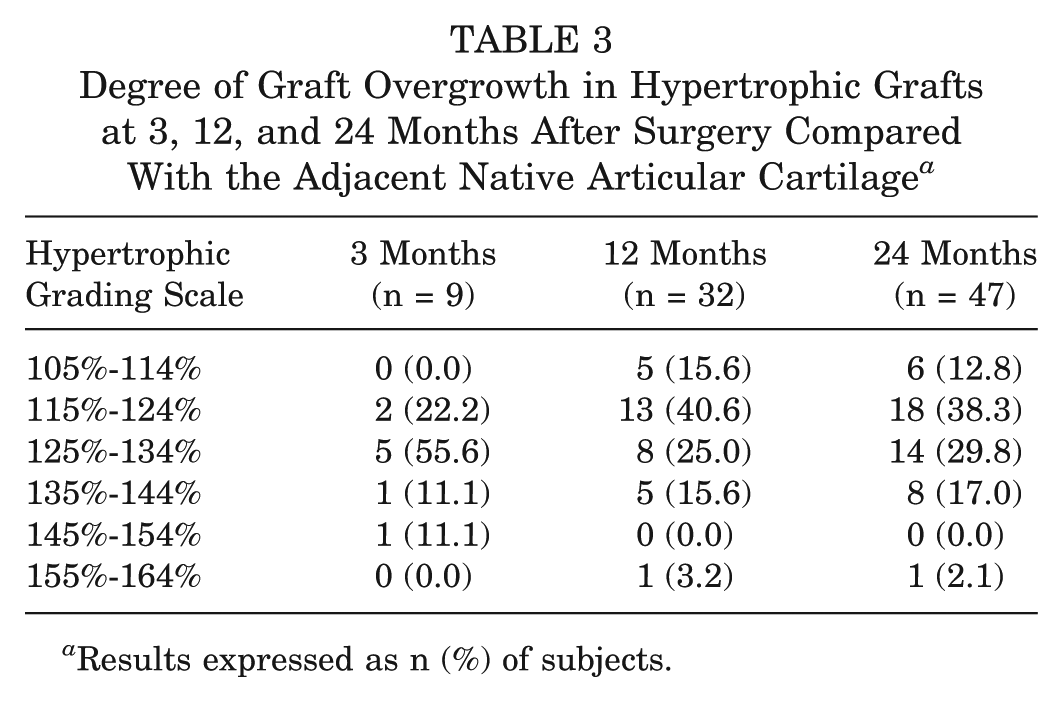
Results expressed as n (%) of subjects.
At 12 months after surgery, the degree of graft infill in 61 of the 171 patients who underwent MRI was now classified as excellent (complete 100% infill), 55 were good (>50% height of adjacent cartilage), 14 were fair (<50% height of adjacent cartilage), and 9 were poor (subchondral bone exposed). A total of 32 grafts (18.7%) were hypertrophic at 12 months after surgery, which included 30 (23.4%) tibiofemoral and 2 (4.7%) patellofemoral grafts (Table 2). The degree of tissue overgrowth of these 32 hypertrophic grafts, compared with the adjacent native articular cartilage, is shown in Table 3.
At 24 months after surgery, the degree of graft infill in 61 of the 180 patients was excellent (complete 100% infill), 43 were good (>50% height of adjacent cartilage), 12 were fair (<50% height of adjacent cartilage), and 17 were poor (subchondral bone exposed). A total of 47 grafts (26.1%) were hypertrophic at 24 months after surgery, which included 43 (32.1%) tibiofemoral and 4 (8.7%) patellofemoral grafts (Table 2). The degree of tissue hypertrophy of these 47 hypertrophic grafts, compared with the adjacent native articular cartilage, is shown in Table 3. This included 6 (12.8%) patients with 105%-114% overgrowth, 18 (38.3%) with 115%-124%, 14 (29.8%) with 115%-134%, 8 (17.0%) with 135%-144%, and 1 (2.1%) with 155%-164%.
Of the 180 patients evaluated over the nominated study period, 50 patients (27.8%) demonstrated graft hypertrophy at 3, 12, and/or 24 months after surgery. Examination of individual patterns of hypertrophy grading in these patients showed that although hypertrophy had developed at 12 months in 22 (44%) patients, it did not develop until 24 months in 17 (34%) patients. Eight (16%) patients developed hypertrophy at 3 months, which continued through to 24 months. Interestingly, in only 3 (6%) patients did early hypertrophy resolve by 24 months, and in 1 case this became graft failure (Table 4).
Postoperative Progression of Graft Hypertrophy in the 50 Patients Who Demonstrated a Hypertrophic Graft on MRI at 3, 12, and/or 24 Months MACI a
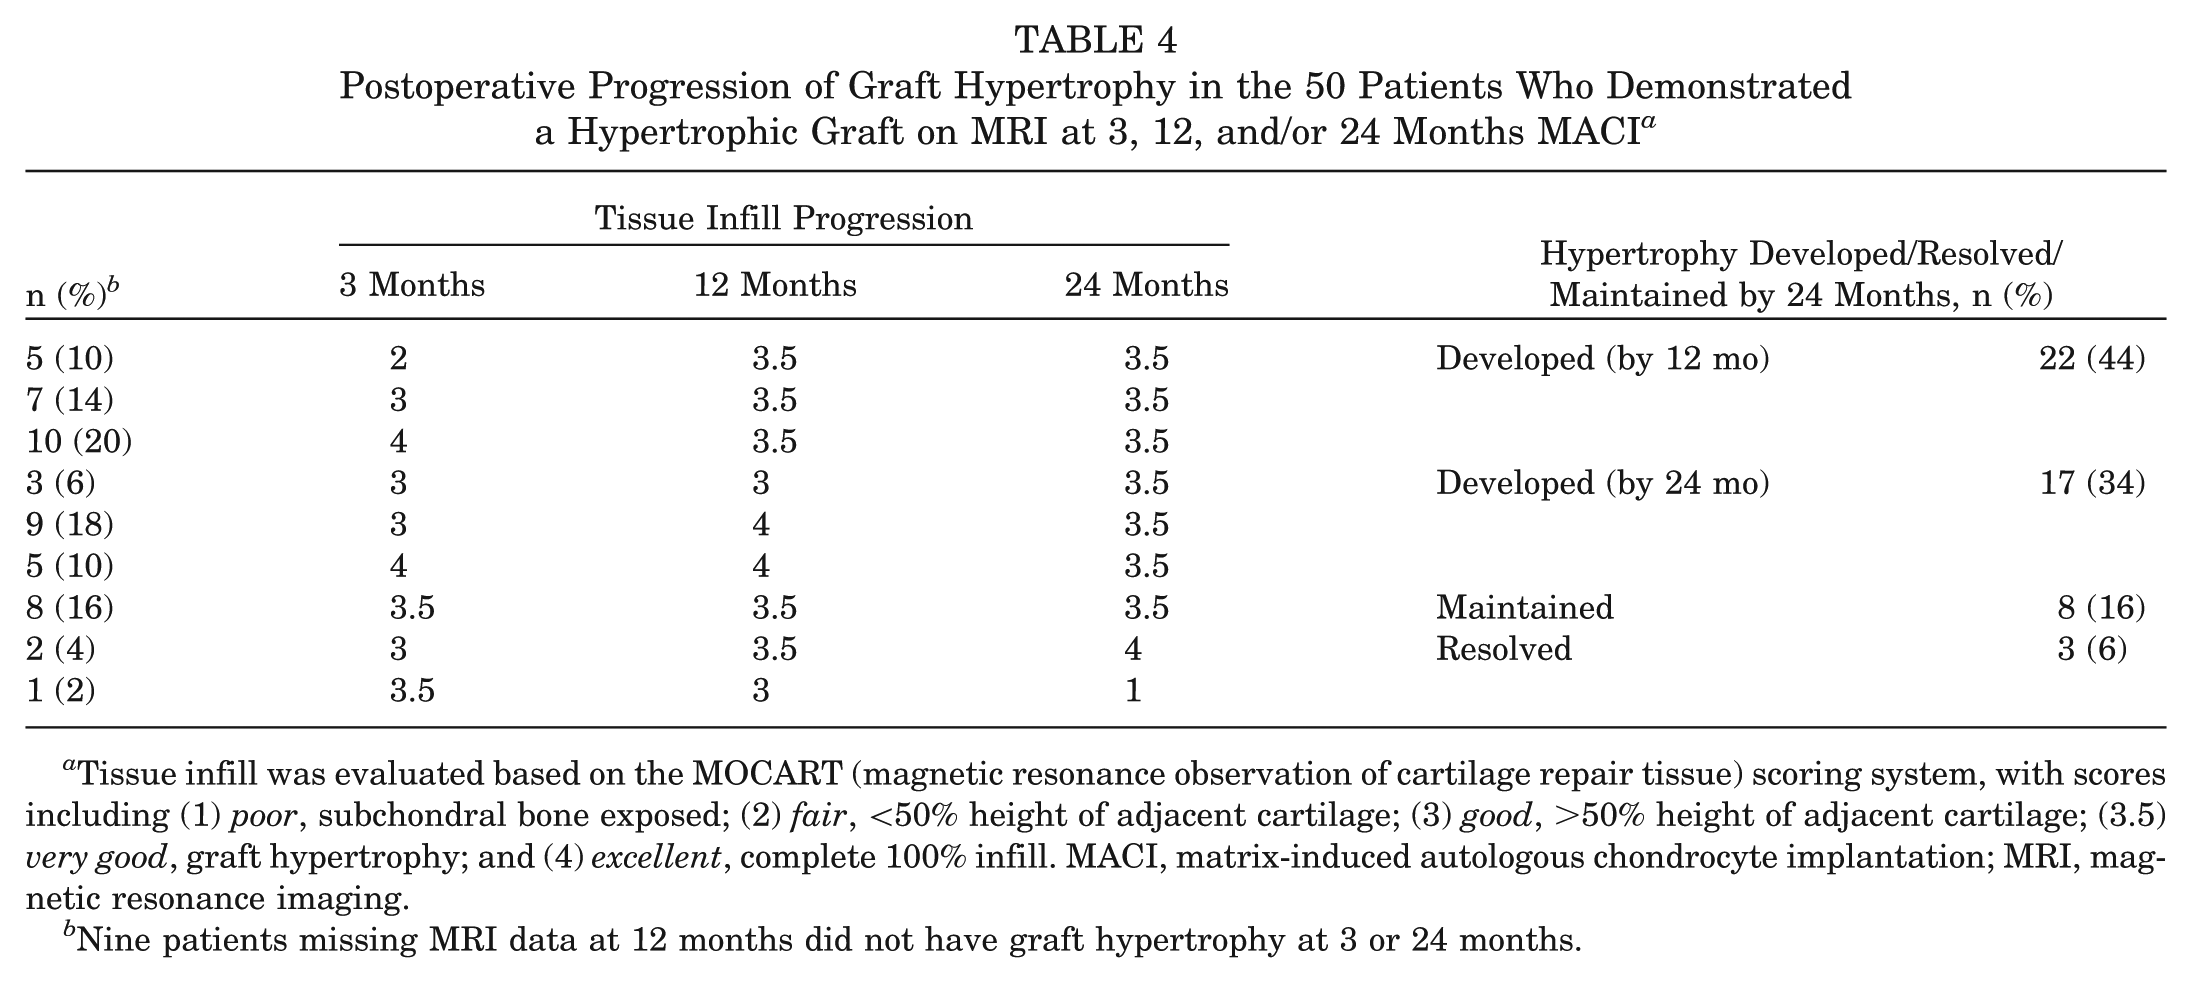
Tissue infill was evaluated based on the MOCART (magnetic resonance observation of cartilage repair tissue) scoring system, with scores including (1) poor, subchondral bone exposed; (2) fair, <50% height of adjacent cartilage; (3) good, >50% height of adjacent cartilage; (3.5) very good, graft hypertrophy; and (4) excellent, complete 100% infill. MACI, matrix-induced autologous chondrocyte implantation; MRI, magnetic resonance imaging.
Nine patients missing MRI data at 12 months did not have graft hypertrophy at 3 or 24 months.
Patients with hypertrophic grafts at 24 months (n = 47) were younger (P = .051), they had lower BMI (P = .069), and significantly fewer of them had patellofemoral grafts (P = .007), when compared with grafts that were considered to have full (100%) tissue infill (n = 61) (Table 5). There were no differences in any of the KOOS subscales between the 2 groups at 24 months on univariable analysis (Table 5). After adjustment for age, BMI, and defect location, ADL and QOL KOOS subscales were slightly poorer, but these differences were not statistically significant (Table 6).
Comparison of Patient Demographics and Postoperative Patient Clinical Outcome in Patients Who Demonstrated Complete (n = 61) and Hypertrophic (n = 47) Tissue Infill at 24 Months After Surgery a
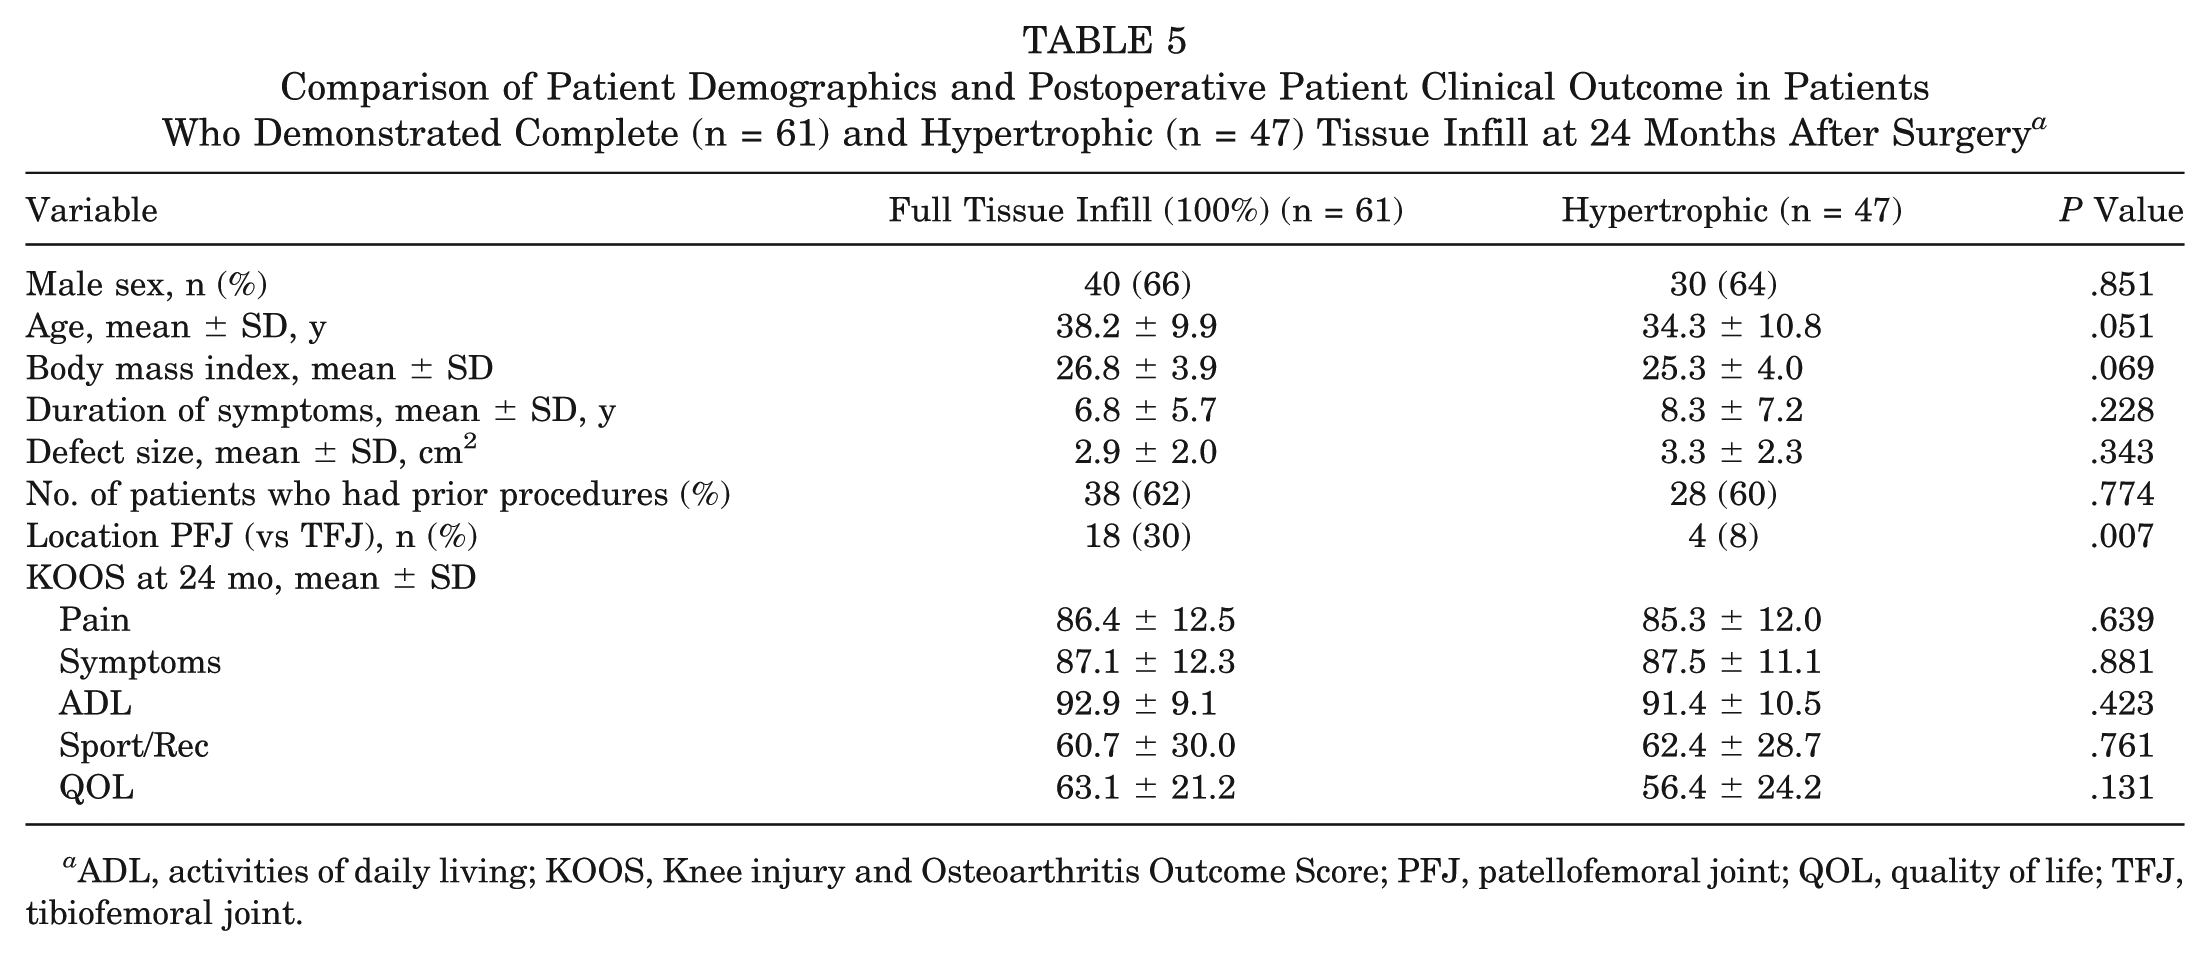
ADL, activities of daily living; KOOS, Knee injury and Osteoarthritis Outcome Score; PFJ, patellofemoral joint; QOL, quality of life; TFJ, tibiofemoral joint.
Differences in KOOS Subscales Between Categories “Full Tissue Infill” (n = 61) and “Hypertrophic” (n = 47) at 24 Months After Surgery, With Adjustment for Potential Confounders Age, BMI, and Graft Location a
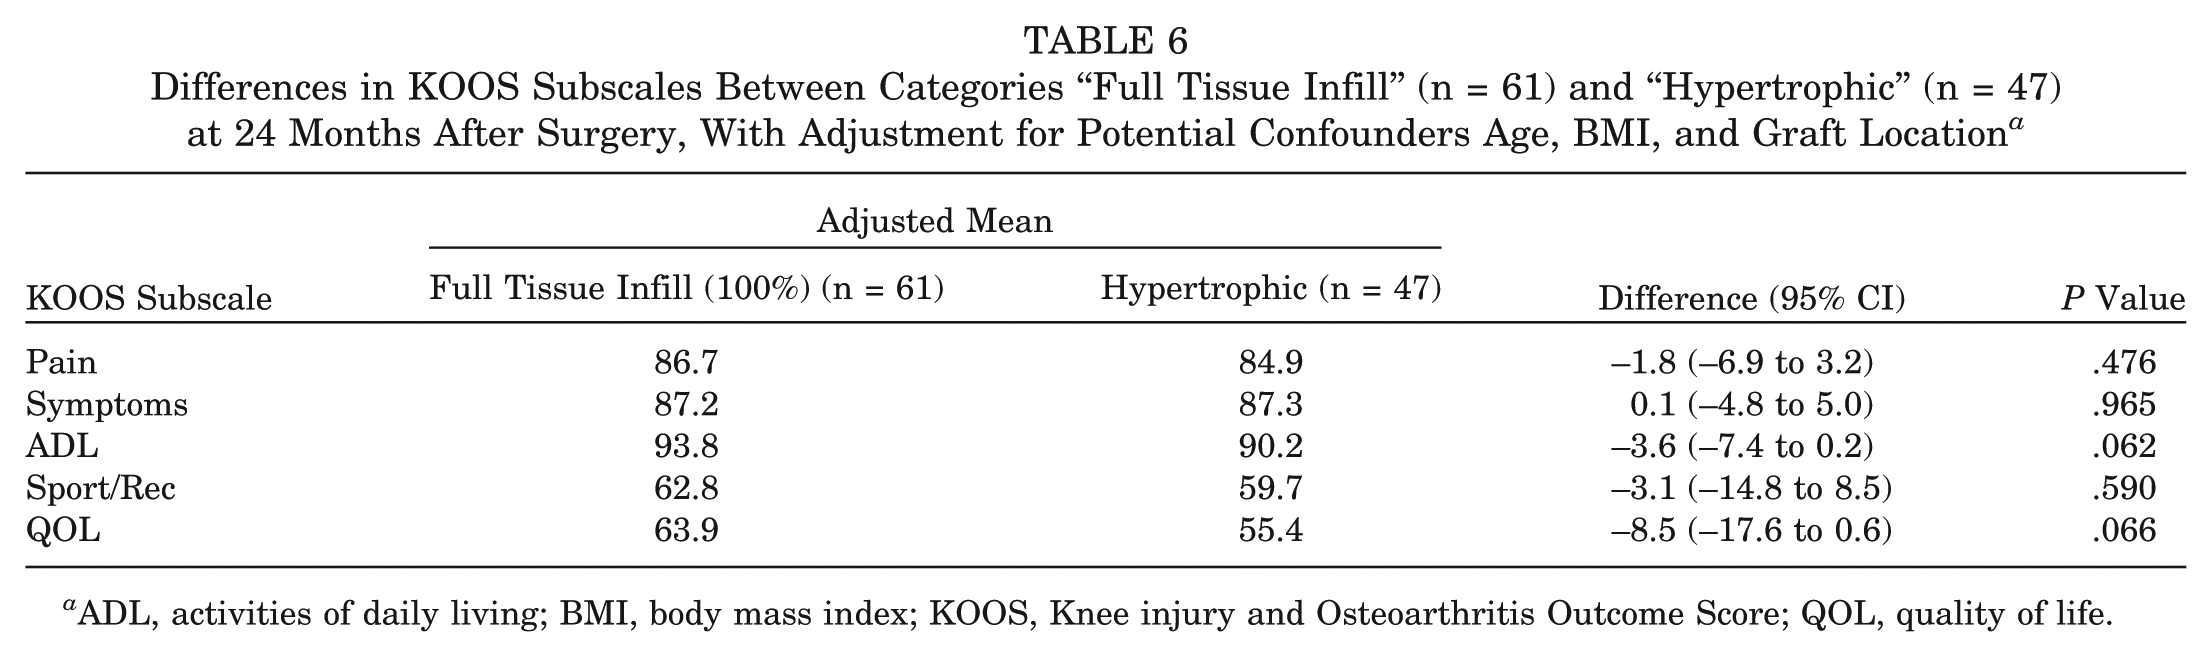
ADL, activities of daily living; BMI, body mass index; KOOS, Knee injury and Osteoarthritis Outcome Score; QOL, quality of life.
In those patients exhibiting graft hypertrophy at 24 months, the hypertrophy score was not associated with KOOS subscales Pain (rho [ρ] = −0.02, P = .908), Symptoms (ρ = 0.03, P = .866), ADL (ρ = −0.12, P = .415) Sport/Rec (ρ = 0.00, P = .996), or QOL (ρ = 0.05, P = .750).
Of the 180 patients evaluated, 8 patients were devoid of any tissue infill with exposed subchondral bone on MRI at 3 months; an additional patient was devoid of infill at 12 months (this patient had a score of “fair” [<50% height of adjacent cartilage] at 3 months after surgery). By 24 months, a further 8 patients had failed, 7 of whom scored either “fair” or “good” at 3 and/or 12 months after surgery, and 1 patient who was hypertrophic at 3 months after surgery although progressed to a score of “good” at 12 months and had failed by 24 months (Table 4). Therefore, a total of 17 patients had failed on MRI by 24 months after surgery, none of whom scored “excellent” (full tissue infill comparable with the adjacent native cartilage) at any time point and only 1 of whom demonstrated a hypertrophic graft at any time point (3 months after surgery only).
Discussion
MACI has demonstrated encouraging postoperative clinical outcomes and evidence of tissue regeneration in the treatment of knee chondral defects.2,8,9 A common postoperative complication reported after periosteal-covered ACI is the development of graft hypertrophy,1,14,16,21 although only limited research exists specifically reporting on hypertrophy after MACI. 26 This study aimed to investigate the incidence, development, and degree of graft hypertrophy in a consecutive series of 180 patients through to 24 months after surgery and to investigate its association with patient-reported clinical outcome.
In this study, 27.8% (n = 50) of grafts demonstrated hypertrophy on MRI at 3, 12, and/or 24 months, with 47 patients demonstrating hypertrophic tissue growth specifically at 24 months. The reported incidence of graft hypertrophy after ACI in the literature ranges from 9% to 40%.1,12,14,16,19-21,34 As reported by Kreuz et al, 16 the incidence of graft hypertrophy after periosteal-covered ACI was 50% of patellar grafts, 25.3% of femoral grafts, and 11.1% of trochlear grafts. Niethammer et al 22 demonstrated that after matrix-based ACI, 25% of patients developed hypertrophy. Pietschmann et al 26 also showed that 25% of patients developed graft hypertrophy after matrix-based ACI, although only 12% of grafts assessed at 24 months remained hypertrophic. At 24 months, hypertrophic grafts in our study were primarily on the weightbearing tibiofemoral joint (n = 43, 32.1%), whereas only 4 (8.7%) patellofemoral grafts were considered hypertrophic. This is contrary to the aforementioned research, as well as a study by Niemeyer et al 21 that reported a statistical trend toward an increased rate of hypertrophy for patellar grafts. Pietschmann et al 26 demonstrated a similar incidence of hypertrophy for femoral and retropatellar grafts across all postoperative time points to 24 months, although their study consisted of only 41 patients.
Interestingly, the incidence of hypertrophy throughout the postoperative period in this study revealed that numbers progressively increased, with 5.0% (n = 9) of cases hypertrophic at 3 months, 18.7% (n = 32) at 12 months, and 26.1% (n = 47) by 24 months. Therefore, while the majority of cases are hypertrophic by 12 months, it would appear that tissue growth continues beyond this point. This is in contrary to the findings of Pietschmann et al, 26 who showed that while 25% of patients developed graft hypertrophy after matrix-based ACI, only 12% of grafts remained hypertrophic by 24 months. In their study, all patients classified with a grade 1 (100%-125% overgrowth) hypertrophic graft at 12 months underwent tissue regression, postulated to be the result of the biomechanical strain placed upon the newly developing cartilage tissue. The reason for the lack of regression (and increase in hypertrophic cases) in this study remains unknown. Of the 3 patients in this study who were hypertrophic and demonstrated tissue “regression” over time, 2 hypertrophic cases at 12 months “regressed” to show 100% infill at 24 months, and 1 case was hypertrophic at 3 months and then proceeded to fail by 24 months.
We also demonstrated that patients with hypertrophic grafts were younger and had lower BMI than patients with grafts that were considered to have full (100%) tissue infill. While Niethammer et al 22 observed no correlation between age or BMI with the development of graft hypertrophy, an association between younger patients and a higher incidence of hypertrophy has been observed after periosteal-covered ACI. 16 The origin of the cartilage defect may also play a role, 22 while it has been suggested that graft hypertrophy may have a cellular origin. 13 Henderson et al 13 noted an increased rate of graft hypertrophy in small-sized repairs with periosteal-covered ACI and proposed that the increased cell density in a smaller repair may lead to increased cellularity and matrix deposition within the repair. This may result in an outward force on the periosteum and subsequent hypertrophy as the cells grow and matrix is laid down. This was not demonstrated by our findings.
We observed no association between severity of hypertrophy and patient clinical outcome at 24 months after surgery. Furthermore, we found no difference in clinical scores at 24 months after surgery between patients with hypertrophic grafts and those with full (100%) tissue infill. This was also reported by Pietschmann et al, 26 albeit in a smaller patient sample. This is of no surprise, since graft hypertrophy can be asymptomatic. 13 Kreuz et al 16 found that patients classified with grade 1 (100%-125% overgrowth) hypertrophy in their study reported no clinical symptoms. However, it has been reported that the primary issue of graft hypertrophy is the persistence of postoperative clinical symptoms that may result in subsequent debridement surgery of the hypertrophic tissue.13,21 Subsequent surgery is also associated with a less satisfying outcome, while debridement of a hypertrophic graft appears detrimental to longer term patient outcome. 13 It has been documented that most cases of reoperation to address symptoms associated with graft hypertrophy are seen within the first 12 months after implantation.13,19,20,24 While 1 patient in this study who demonstrated graft hypertrophy at 3 months had failed by 24 months, none of the other 49 patients who demonstrated hypertrophic growth for at least 1 of the postoperative time points (including 47 who were still hypertrophic on MRI at 24 months) had sought specialist consultation or surgical treatment before, or including, 24 months after surgery. All patients in this cohort need to be continually followed up at designated mid-term and longer term time points to determine whether persistent hypertrophy does indeed contribute to graft failure, at least in comparison with those patients who demonstrate tissue infill comparable with the adjacent native cartilage.
A number of limitations existed within this study. First, we used the KOOS as our primary method of clinical assessment. While a number of other clinically important patient-reported outcome measures have been used to assess ACI, 31 the KOOS has been shown to be very responsive to improvement after MACI surgery. 10 Second, the MRI studies were obtained using both 1.5-T and 3-T clinical scanners. The studies obtained using a 3-T magnet were of higher resolution compared with images obtained at 1.5 T. Chemical shift artifact on the 3-T images was minimized by selection of a higher receiver bandwidth for image acquisition. Graft hypertrophy was assessed as a ratio of articular cartilage at the graft site compared with adjacent native cartilage on the same image. Therefore, the effect of scanning some knees on a 1.5-T system and others at 3-T should be nullified.
Third, other graft hypertrophy grading systems have been used,16,22,26 although we chose to develop, use, and validate a separate scale. These other grading systems also compare the degree of hypertrophic graft tissue infill to that of the surrounding native cartilage, with grades assigned as follows: grade 0 (no hypertrophy), grade 1 (100%-125%), grade 2 (125%-150%), grade 3 (150%-200%), and grade 4 (>200%). However, these systems contain large evaluation windows (ie, grade 1 would similarly group grafts of size 101% and 125%), and we felt we could reduce the size of these windows given the clarity of the MRI images without jeopardizing the accuracy of the scoring system, which was reflected in the intra- and interobserver reliability scores presented. Finally, we are yet unable to compare the natural progression of graft status after 24 months in hypertrophic grafts versus those with 100% (complete) infill. The patients in this study require long-term follow-up to investigate the time course of graft maintenance due to the underlying presence of graft hypertrophy.
Research specifically investigating the incidence and degree of graft hypertrophy after ACI is scarce, as is the association it has with patient-reported clinical outcome. The results of this study indicate that hypertrophic grafts after MACI are common; they continue to progress up to 24 months after surgery, which is contrary to prior research 26 ; and they appear more common in the tibiofemoral joint (particularly on the femoral condyles), which is also in contrary to previously published research.16,21 The presence and severity of graft hypertrophy in this study were not associated with clinical outcome at 24 months after surgery. Furthermore, while 1 patient in this study who demonstrated graft hypertrophy at 3 months had failed by 24 months, none of the other 49 patients who demonstrated hypertrophic growth for at least 1 of the postoperative time points (including 47 who were still hypertrophic on MRI at 24 months) had sought specialist consultation or surgical treatment by 24 months after surgery. However, further research with longer term follow-up is required to evaluate the effect of persistent hypertrophy on the development of later stage knee pain and symptoms as well as subsequent graft stability or failure. Further research is also required to investigate the use of early surgical intervention to prevent such failure (through graft debridement) or reoperation with the same or alternative cartilage repair method, should it be found that persistent hypertrophy predisposes to eventual graft failure.
Footnotes
One or more of the authors has declared the following potential conflict of interest or source of funding: This research has received funding from the National Health and Medical Research Council (ID254622 and ID1003452) and the Hollywood Private Hospital Research Foundation (RF31 and RF050). This research was approved by the University of Western Australia (RA/4/3/0464) and the Hollywood Private Hospital (HPH145) Human Research Ethics Committees (HREC).