
Abstract
Background:
The inherent risk of any time loss from physical injury in football has been extensively discussed, with many such injuries having a profound effect on the lives of National Collegiate Athletic Association (NCAA) football players. However, the incidence of fractures in collegiate football has not been well established.
Purpose:
To examine the epidemiology of fractures in NCAA football.
Study Design:
Descriptive epidemiology study.
Methods:
Fracture data reported in college football during the 2004-2005 to 2013-2014 academic years were analyzed from the NCAA Injury Surveillance Program (NCAA-ISP). Fracture rates per 1000 athlete-exposures, surgery and time loss distributions, injury rate ratios, injury proportion ratios (IPRs), and 95% CIs were reported.
Results:
Overall, 986 fractures were reported. The rate of competition fractures was larger than the rate of practice fractures (1.80 vs 0.17 per 1000 athlete-exposures; injury rate ratio = 10.56; 95% CI, 9.32-11.96). Fractures of the hand/fingers represented 34.6% of all injuries, while fibula fractures (17.2%) were also common. A majority (62.5%) of all fractures resulted in time loss >21 days. Altogether, 34.4% of all fractures required surgery, and 6.3% were recurrent. The proportion of fractures resulting in time loss >21 days was higher for fractures requiring surgery than fractures not requiring surgery (85.0% vs 50.7%; IPR = 1.68; 95% CI, 1.53-1.83). The proportion of recurrent and nonrecurrent fractures requiring surgery did not differ (35.5% vs 34.3%; IPR = 1.03; 95% CI, 0.73-1.46); however, recurrent fractures were more likely to require surgery than nonrecurrent fractures when restricted to the hand/fingers (66.7% vs 27.2%; IPR = 2.45; 95% CI, 1.36-4.44).
Conclusion:
Fractures in collegiate football were sustained at a higher rate in competition than practice and frequently required extended time lost from participation, particularly among those requiring surgery. Prevention strategies are warranted to reduce incidence and severity of fractures.
The risk of physical injury in the game of football is well documented4,13,23 and has been reported to be higher than other sports, such as basketball. 19 Specifically, the rate of syndesmotic, 9 foot and ankle,10,15 and anterior cruciate ligament 6 injuries have all been extensively documented. Recently, the incidence and management of concussions in football have been a major focus.5,7 Despite the extensive information regarding injuries sustained in collegiate football, there is little information specifically describing the incidence and outcomes of fractures.
In an epidemiologic study of collegiate football from the 2004-2005 to 2008-2009 seasons, Kerr et al 13 reported that 5.7% of all injuries sustained in competition were fractures. Although fractures are not the most common injury, they can have a disastrous effect on a player’s season and/or career. In fact, 44% of season-ending injuries in high school football players were fractures. 21 Furthermore, the requirement for surgical fixation of fractures contributes to extensive time lost from participation. Despite some reports on the incidence of surgical fixation for specific fracture types, 14 the overall incidence and effect of surgical fixation for fractures are not well established. The purpose of this study was to analyze the epidemiology of fractures among National Collegiate Athletic Association (NCAA) football players from the 2004-2005 to 2013-2014 seasons with the NCAA Injury Surveillance Program (ISP).
Methods
The methodology of the NCAA-ISP during the 2004-2005 through 2013-2014 academic years has been previously described 11 and is briefly summarized here. The NCAA-ISP was initiated in 1982 as a paper-based data collection system to obtain information from colleges on sports-related injuries among their athletes. Since 2004, data collection has been conducted via electronic medical records from an average of 43 schools per year. Currently, information regarding type of injury, location, activity during injury, and resulting time lost from participation based on injury is collected from athletes participating in 25 sports. The number of programs providing data varies by sport and year. Data during the 2004-2005 to 2013-2014 academic years were limited to injuries with a reported injury diagnosis of “fracture.”
Data Collection
Athletic trainers (ATs) who worked with participating teams attended school-sanctioned practices and competitions. Data were reported in real time through the electronic health record application used by the team medical staff throughout the academic year. The ATs logged the number of student-athletes participating in each practice and competition. When injuries occurred, ATs completed a detailed event report on the injury or condition. After initially inputting injury data, the ATs could return to view and update the data as needed over the course of a season—for example, when the student-athlete returned to sports participation. Data were de-identified and encrypted before upload to the central aggregate database. Quality control staff reviewed the data, and ATs were contacted and queried about invalid values. Verified data were included in the aggregate research data set.
Operational Definitions
Injury
In this study, a reportable injury (1) occurred as a result of participation in a school-sanctioned practice or competition, (2) required the attention from an AT or physician, (3) resulted in time loss of at least 24 hours, and (4) had a reported diagnosis of fracture. As with previous research,3,20 we relied on the expertise of team medical staff to properly diagnose fractures.
Athlete-Exposure
A reportable athlete-exposure (AE) was defined as 1 student-athlete participating in 1 NCAA-sanctioned practice or competition in which he or she was exposed to the possibility of athletic injury regardless of the time associated with that participation. Only athletes with actual playing time in a competition, including warm-ups, were included in competition exposures.
Time Loss
Injuries were categorized by the number of days of participation restriction (ie, date of return subtracted by the date of injury). Participation restriction time was categorized as 1-7 days, 7-21 days, and >21 days, which included fractures that caused student-athletes to prematurely end their season.
Recurrence
ATs identified those injuries that were recurrent (ie, a recurrence of the injury that was sustained either earlier in the current academic year or prior). As with initial diagnosis, we relied on the expertise of team medical staff to properly diagnose fractures as recurrent.
Surgery
ATs also identified those injuries that required surgery. The specific type of surgery was not collected.
Statistical Analysis
Data were analyzed to assess rates and distribution of fractures in collegiate football during the 2004-2005 to 2013-2014 academic years. Fracture injury rates were calculated overall and by sport and event type. Injury rate ratios (IRRs) compared rates by event type. The following is an example of an IRR comparing fracture rates in competitions versus practices:

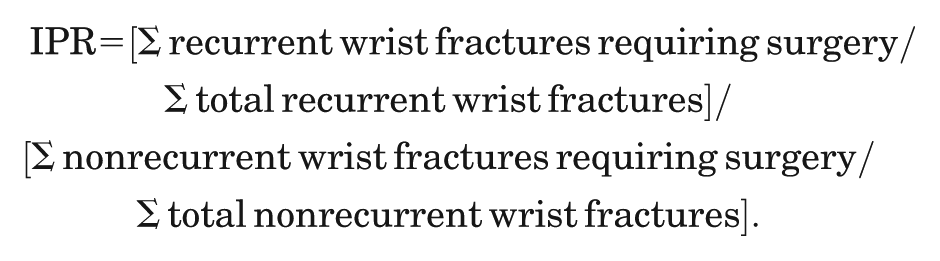
Distributions of injuries by body part, time loss, recurrence, and surgery were examined. Injury proportion ratios (IPRs) compared (1) distributions of surgery and time loss by recurrence and (2) distributions of time loss by surgery. The following is an example of an IPR comparing the proportions of recurrent and nonrecurrent wrist fractures that required surgery:
All 95% CIs that did not include 1.0 were considered statistically significant. Data were analyzed with SAS Enterprise Guide software (v 5.4; SAS Institute Inc).
Results
Overall, 986 individual fractures were reported during the 2004-2005 through 2013-2014 academic years, including 500 (50.7%) sustained during competition and 486 (49.3%) during practice. This represented 4.4% of all reported injuries during this period and an overall rate of 0.32 per 1000 AEs (Table 1). The competition fracture rate was 10.56 times the practice fracture rate (1.80 vs 0.17 per 1000 AEs; IRR = 10.56; 95% CI, 9.32-11.96). Fractures of the hand/fingers represented 34.6% (n = 341) of all fractures reported, with 22.9% (n = 226) of fractures specifically affecting the metacarpals (fingers and thumb). Altogether, 17.2% of all fractures (136 fibular + 31 lateral malleolus + 3 fibular head fractures) affected the fibula (Table 2).
Fracture Counts and Rates Among Student-Athletes in Football by Event Type: NCAA-ISP, Academic Years 2004-2005 to 2013-2014 a
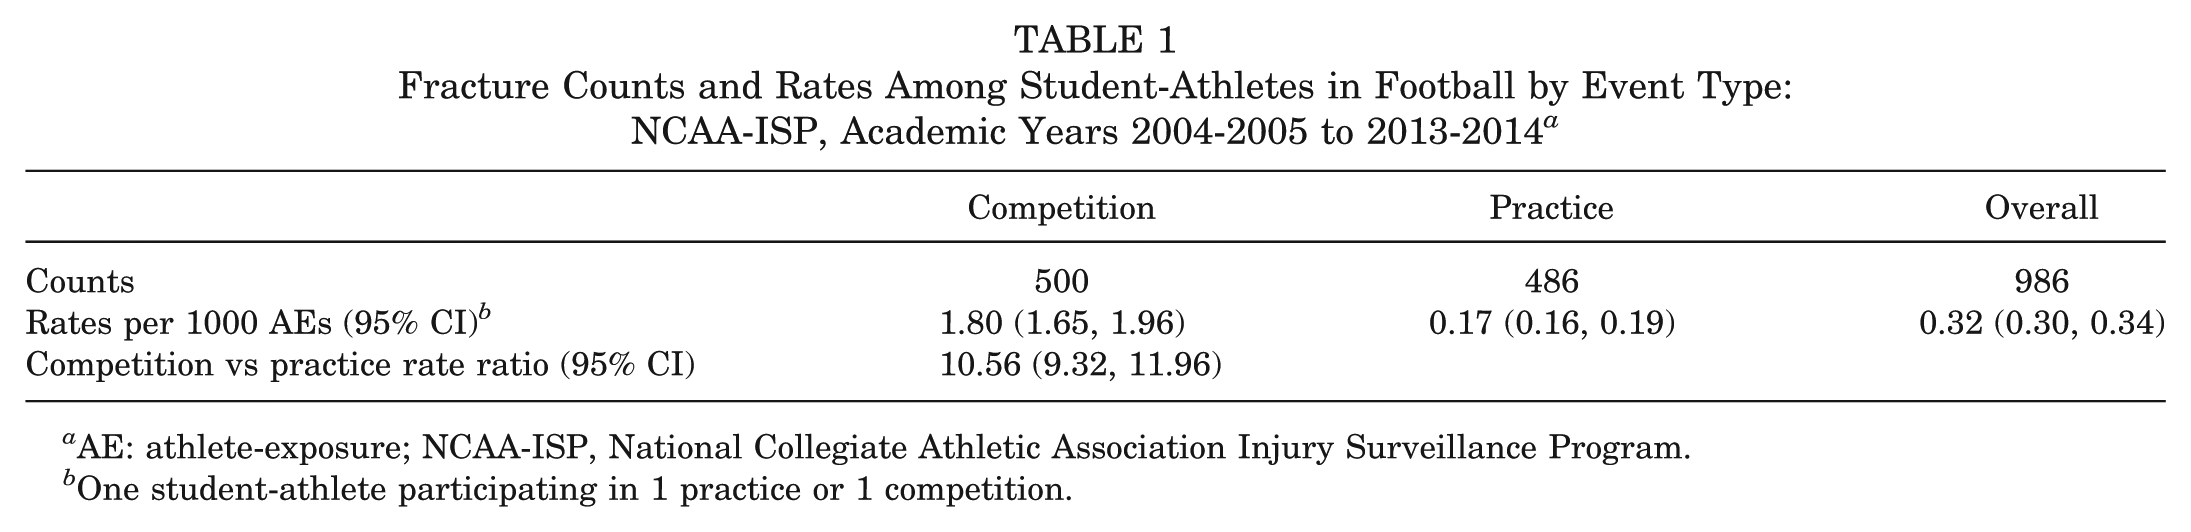
AE: athlete-exposure; NCAA-ISP, National Collegiate Athletic Association Injury Surveillance Program.
One student-athlete participating in 1 practice or 1 competition.
Fracture Counts Among Student-Athletes in Football by Body Part: NCAA-ISP, Academic Years 2004-2005 to 2013-2014 a
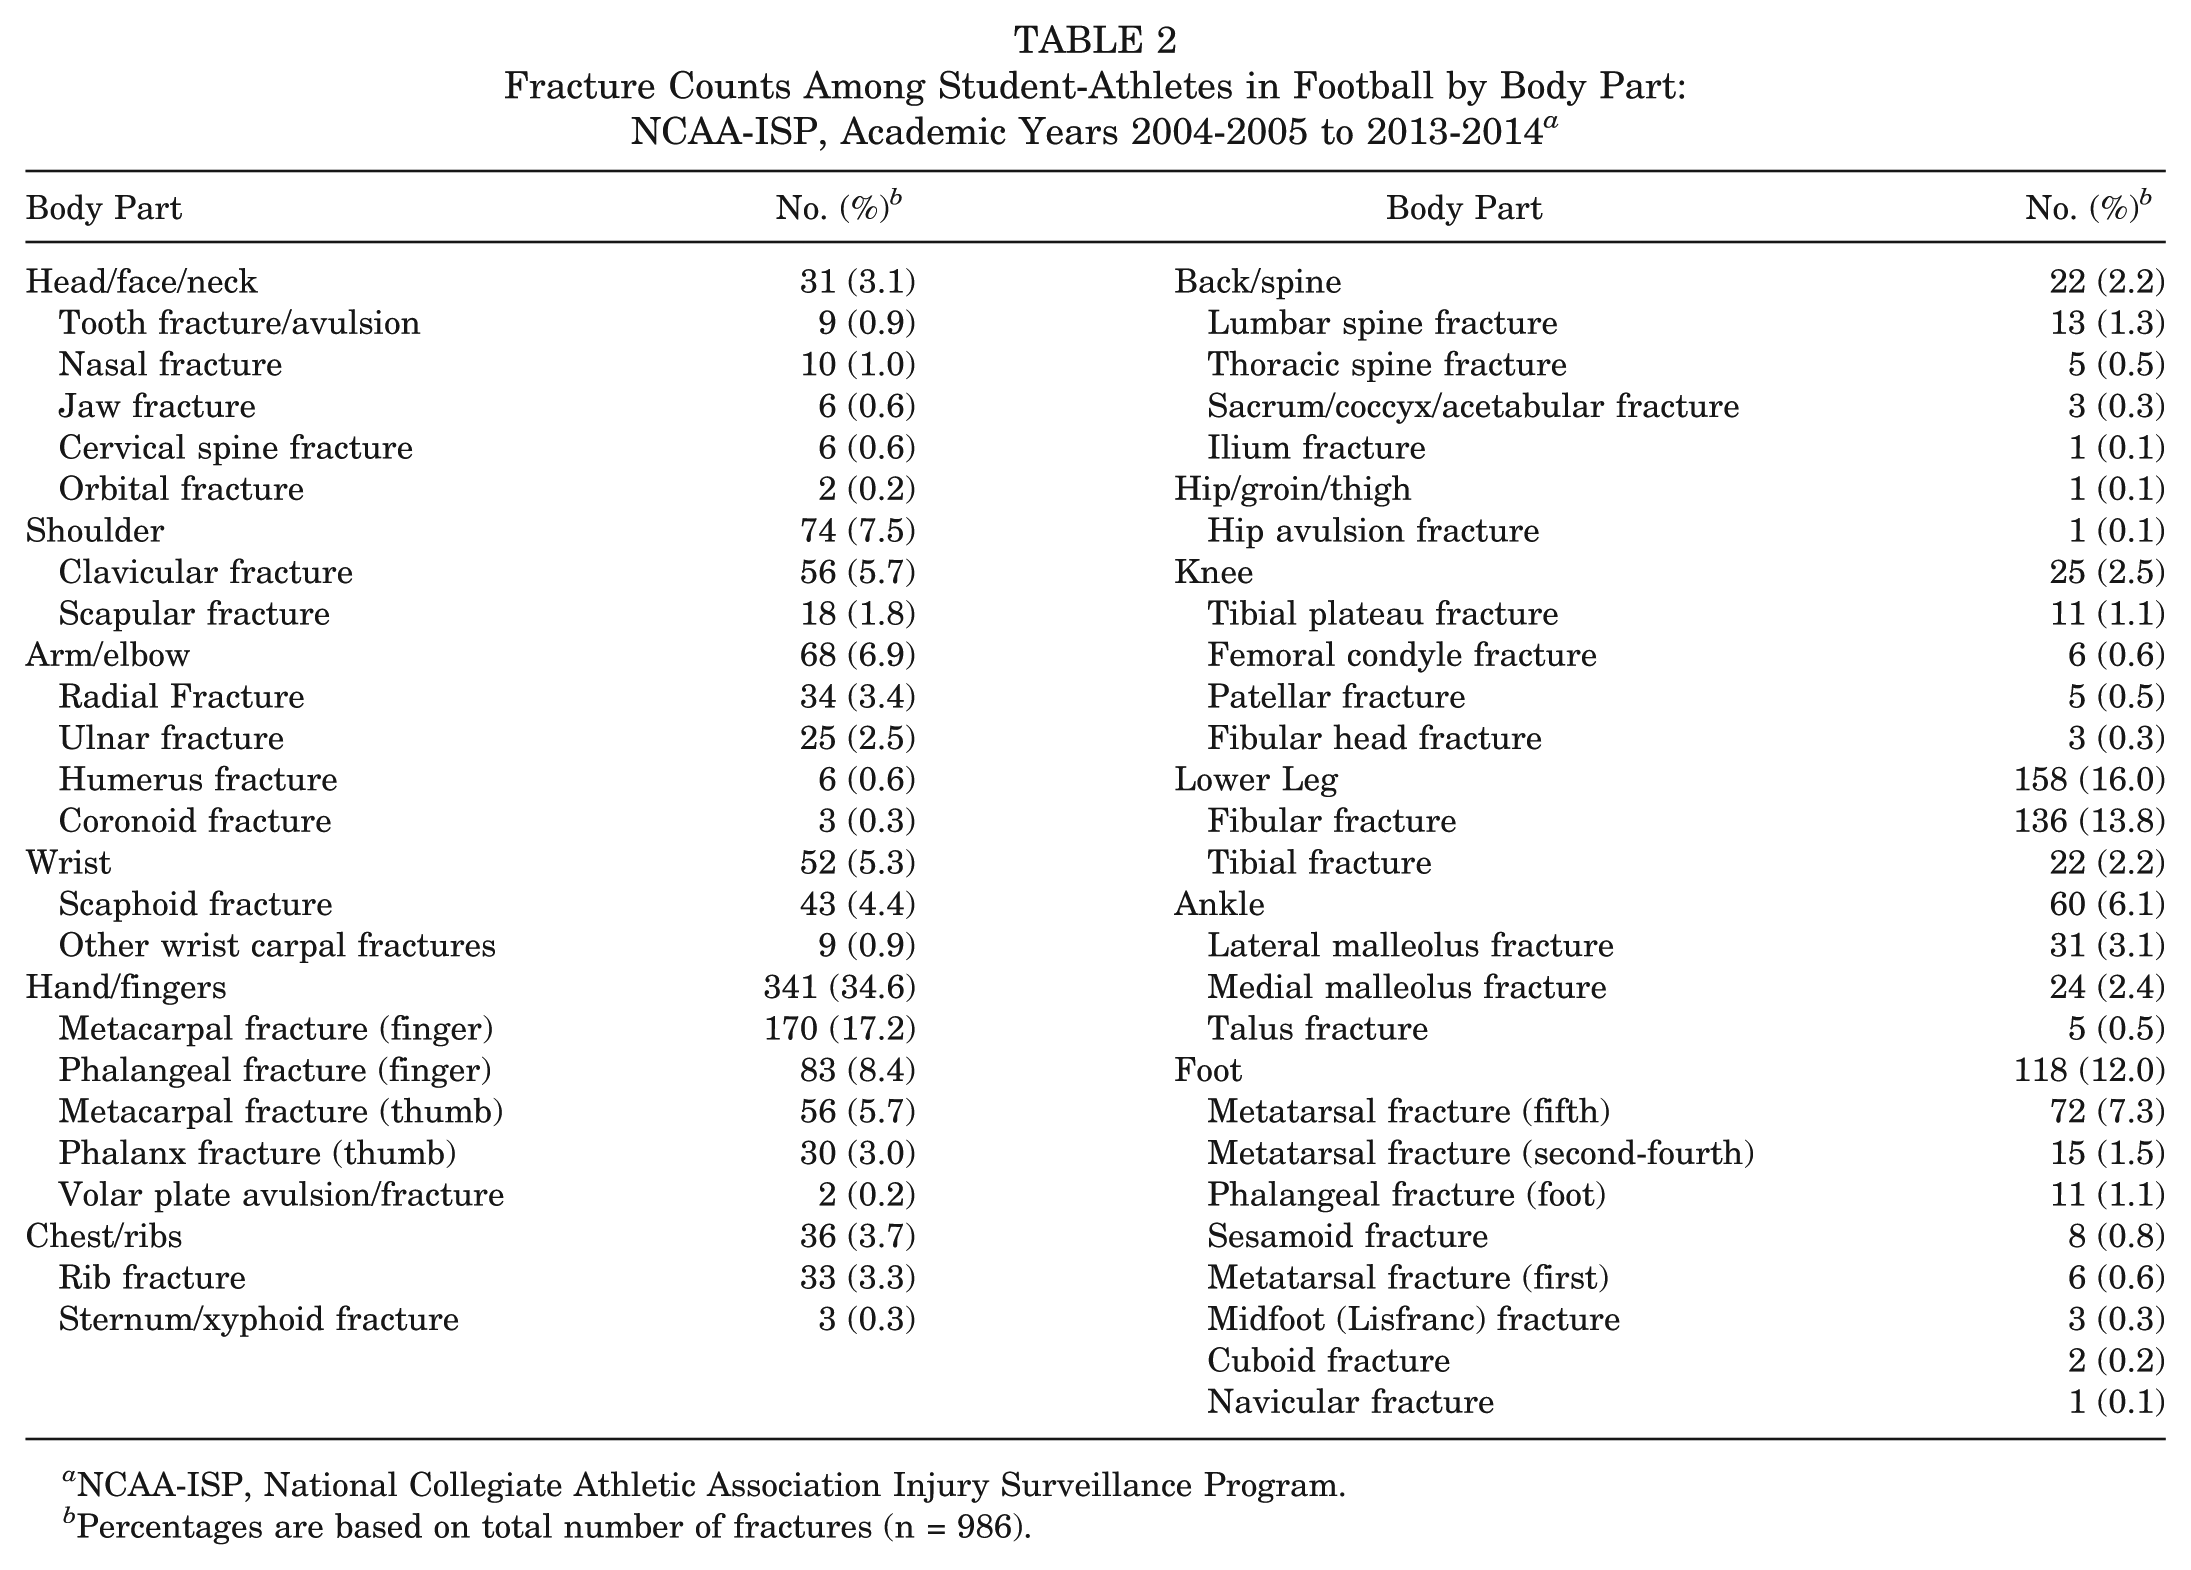
NCAA-ISP, National Collegiate Athletic Association Injury Surveillance Program.
Percentages are based on total number of fractures (n = 986).
Of all fractures, 616 (62.5%) resulted in time loss >21 days. This included 91.9% (n = 68) and 77.9% (n = 53) of all shoulder and arm/elbow fractures, respectively. In addition, 85.3% of all fractures of the lower extremity (18 knee + 150 lower leg + 51 ankle + 89 foot) resulted in time loss >21 days. In comparison, 32.7% of wrist (n = 17) and 34.6% of hand/fingers (n = 118) injuries resulted in a return to play within 1 to 6 days (Table 3).
Distributions of Time Loss Among Student-Athletes in Football by Body Part and Fracture Type: NCAA-ISP, Academic Years 2004-2005 to 2013-2014 a
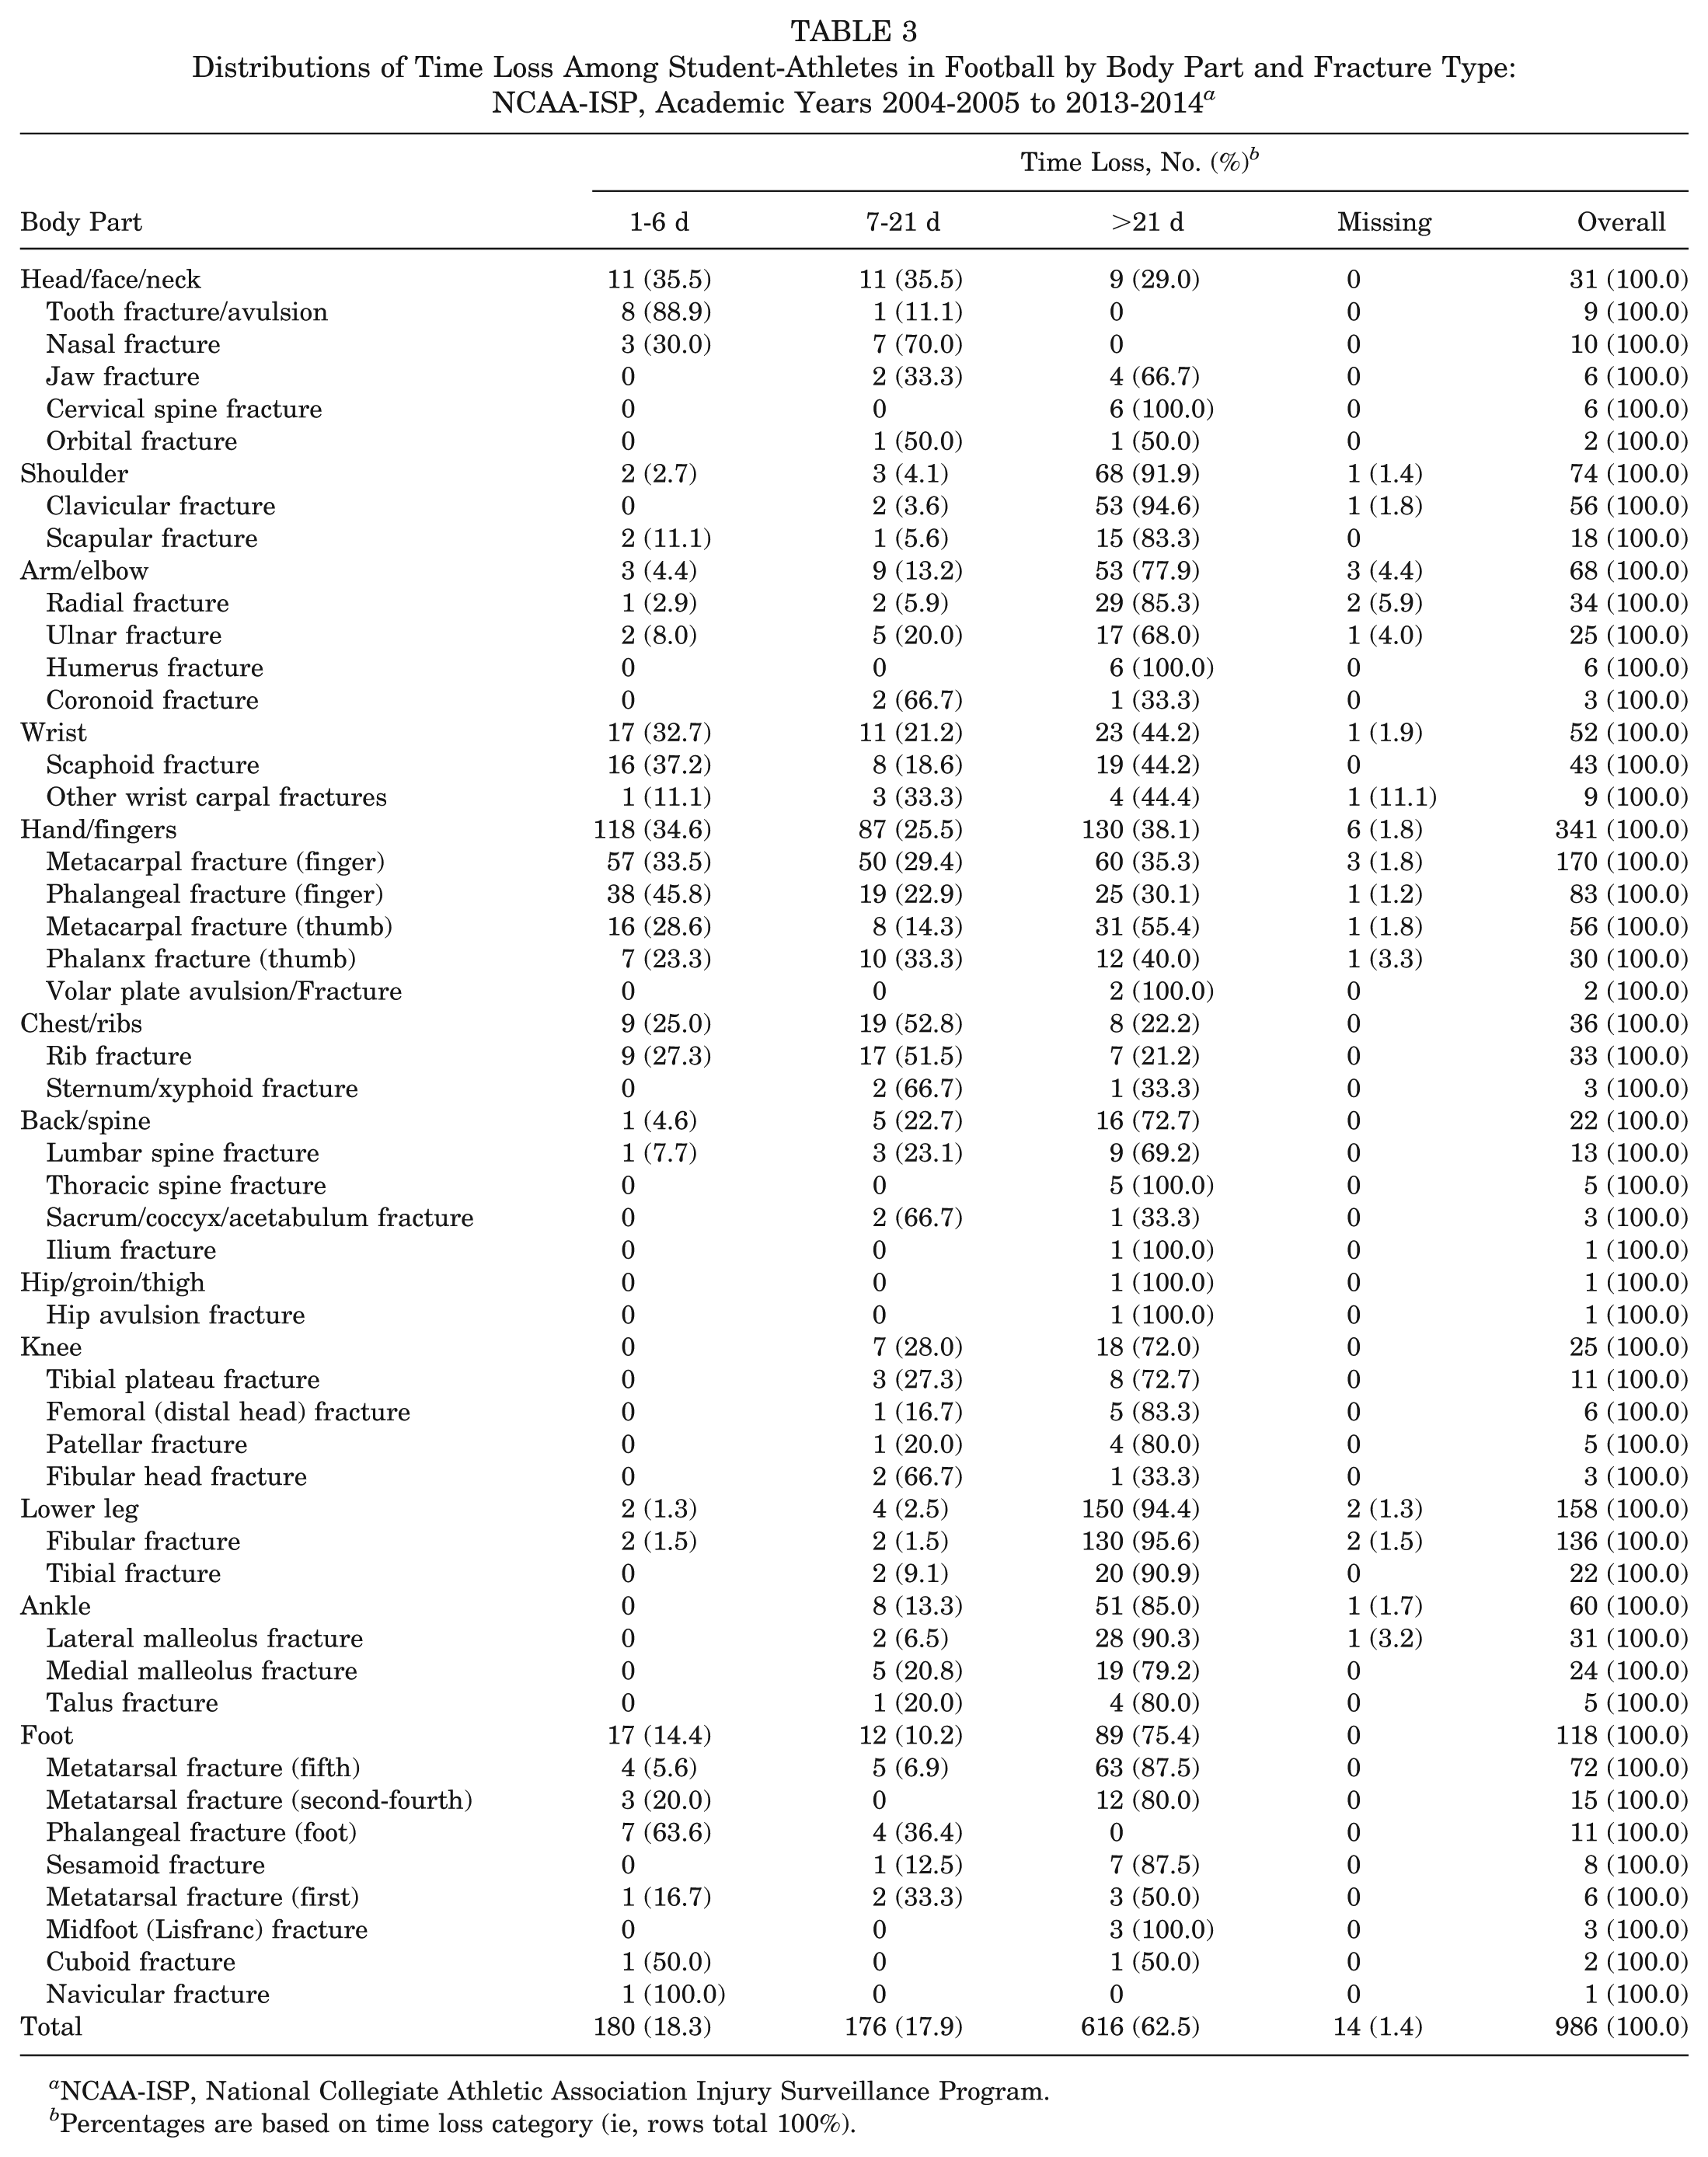
NCAA-ISP, National Collegiate Athletic Association Injury Surveillance Program.
Percentages are based on time loss category (ie, rows total 100%).
In total, 34.4% of all fractures required surgery (n = 339), including 50.0% (n = 34) of all arm/elbow and 53.8% (n = 85) of all lower leg fractures (Table 4). Of note, 44.4% (n = 32) of all fifth metatarsal fractures required surgery. A large proportion of fractures that resulted in >21 days lost required surgery, including 100% of operative shoulder, knee, and lower leg fractures (Table 5). The proportion of fractures resulting in time loss >21 days was higher in fractures requiring surgery than in fractures not requiring surgery (85.0% vs 50.7%; IPR = 1.68; 95% CI, 1.53-1.83).
Distributions of Surgery Among Student-Athletes in Football by Body Part and Fracture Type: NCAA-ISP, Academic Years 2004-2005 to 2013-2014 a
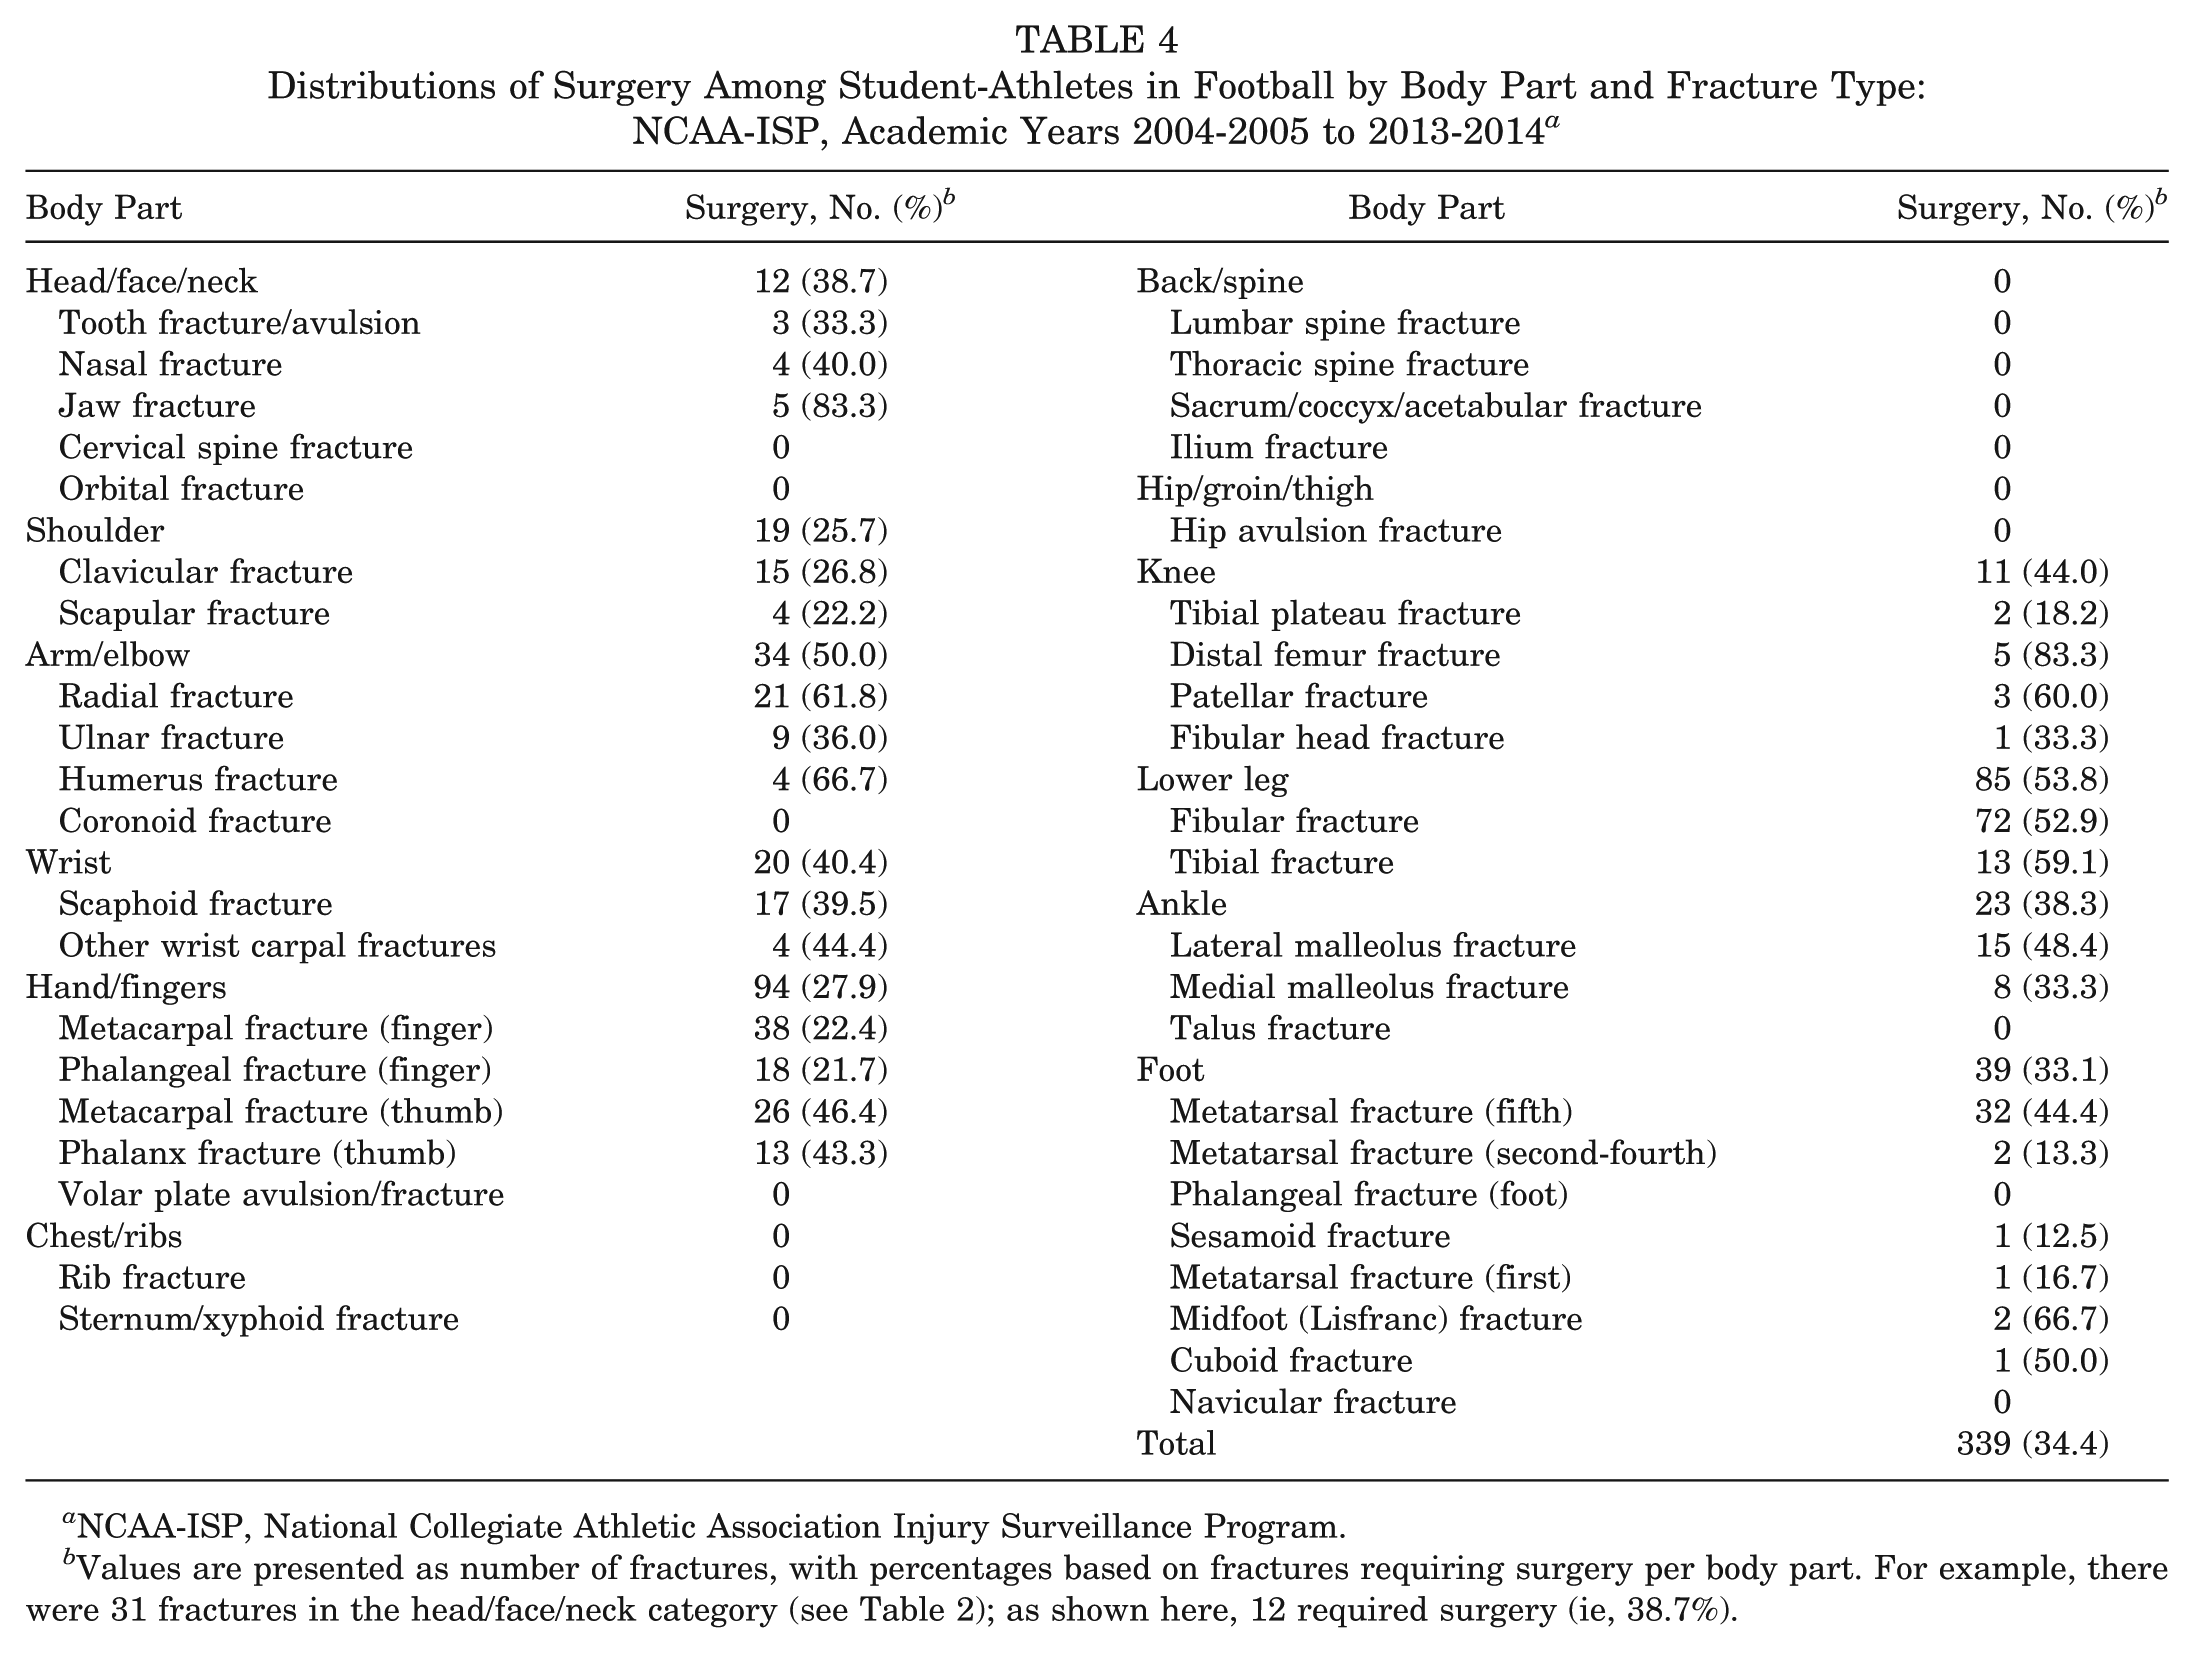
NCAA-ISP, National Collegiate Athletic Association Injury Surveillance Program.
Values are presented as number of fractures, with percentages based on fractures requiring surgery per body part. For example, there were 31 fractures in the head/face/neck category (see Table 2); as shown here, 12 required surgery (ie, 38.7%).
Comparisons of Time Loss Distributions in Fractures by Surgery: NCAA-ISP, Academic Years 2004-2005 to 2013-2014 a
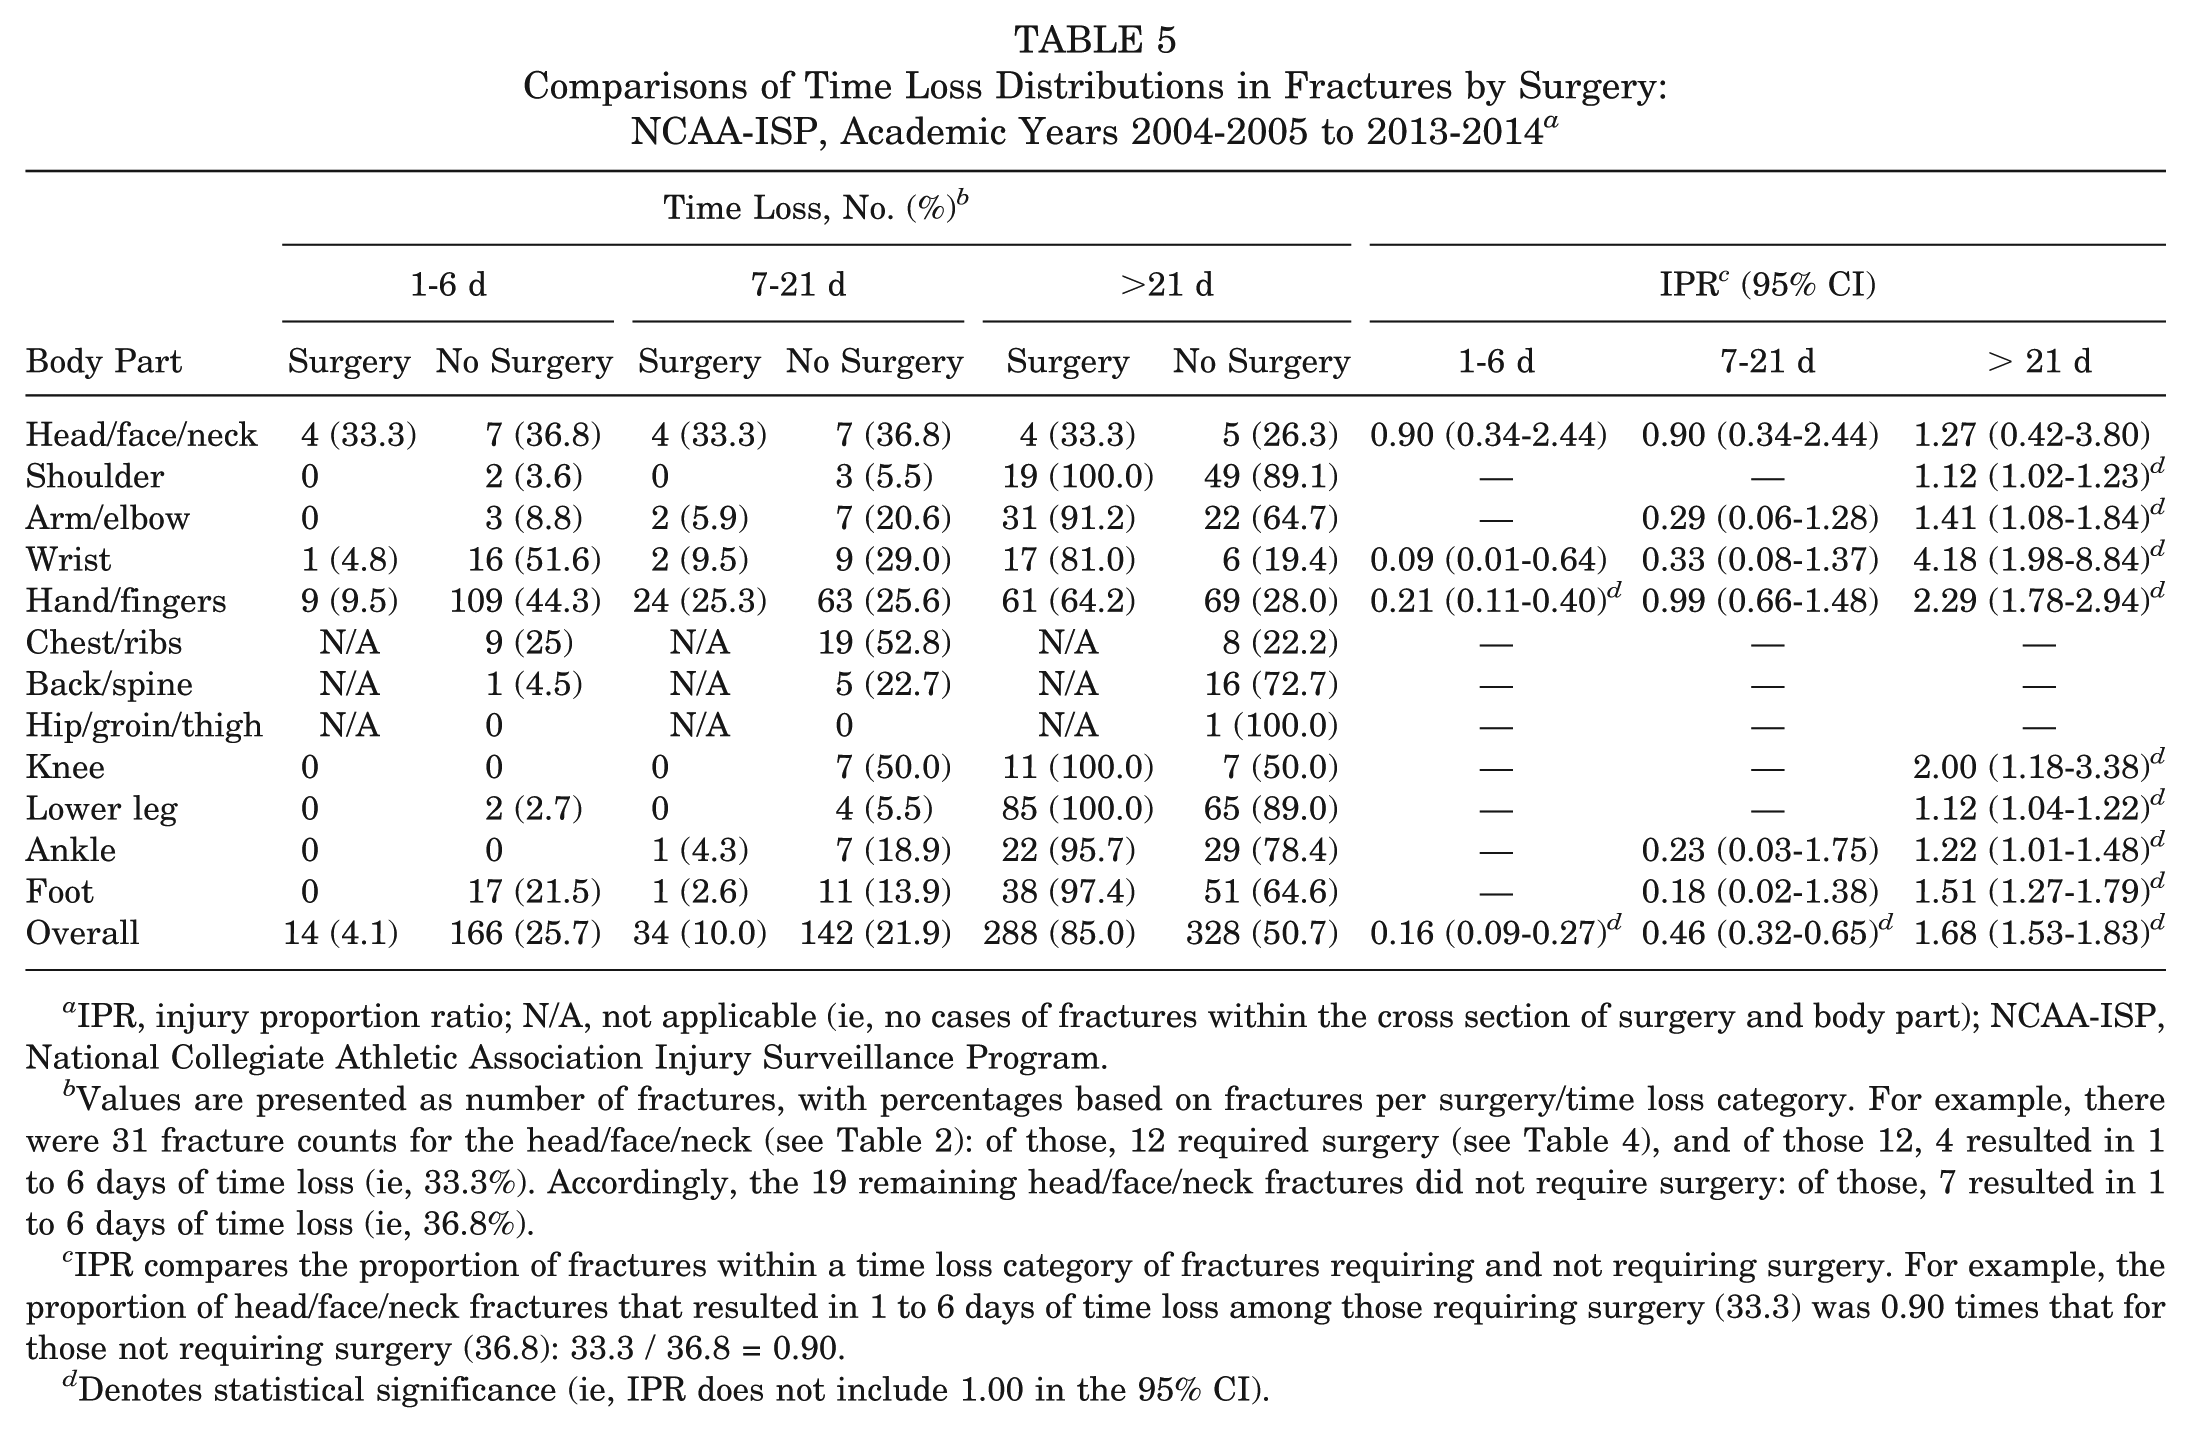
IPR, injury proportion ratio; N/A, not applicable (ie, no cases of fractures within the cross section of surgery and body part); NCAA-ISP, National Collegiate Athletic Association Injury Surveillance Program.
Values are presented as number of fractures, with percentages based on fractures per surgery/time loss category. For example, there were 31 fracture counts for the head/face/neck (see Table 2): of those, 12 required surgery (see Table 4), and of those 12, 4 resulted in 1 to 6 days of time loss (ie, 33.3%). Accordingly, the 19 remaining head/face/neck fractures did not require surgery: of those, 7 resulted in 1 to 6 days of time loss (ie, 36.8%).
IPR compares the proportion of fractures within a time loss category of fractures requiring and not requiring surgery. For example, the proportion of head/face/neck fractures that resulted in 1 to 6 days of time loss among those requiring surgery (33.3) was 0.90 times that for those not requiring surgery (36.8): 33.3 / 36.8 = 0.90.
Denotes statistical significance (ie, IPR does not include 1.00 in the 95% CI).
Also, 6.3% (n = 62) of all reported fractures were recurrent, including 20.8% (n = 15) of fifth metatarsal fractures (Appendix Table A1, available in the online version of this article). Of the recurrent fractures, 35.5% (n = 22) of all recurrent fractures required surgery (Appendix Table A2). The proportion of recurrent and nonrecurrent fractures requiring surgery did not differ (35.5% vs 34.3%; IPR = 1.03; 95% CI, 0.73-1.46); however, recurrent fractures were more likely to require surgery than nonrecurrent fractures when restricted to the hand/fingers (66.7% vs 27.2%; IPR = 2.45; 95% CI, 1.36-4.44).
Discussion
It is well established that football is associated with injury risk. Overall, 986 total fractures were reported in this study, which included a 10-fold increase in the rate of fractures sustained during competition as compared with practice. The most common fractures involved the hand/fingers, representing 34.6% of all fractures, with metacarpal fractures alone constituting 17.2% of all reported fractures. Of the total number of fractures, 34.4% required surgery. Similarly, 62 total fractures were considered recurrent, and 35.5% of these required surgery. In addition, 62.5% of all fractures resulted in time loss >21 days. Given that a typical NCAA football season lasts from 4 to 5 months (including preseason and bowl season), missing >21 days represents a significant portion of the season. Fractures requiring surgery were also associated with a higher likelihood of time loss >21 days. Altogether, this information highlights the severity of injuries sustained while playing collegiate football and demonstrates the effect that such an injury can have on a student-athlete’s season.
The incidence of fractures in football far exceeds all other NCAA sports combined (unpublished data, Datalys Center). Interestingly, the 10-fold increase in fracture occurrence in competition versus practice was higher than the overall IRRs published in previous reports.4,12 However, note that the proportion of fractures occurring in practice as compared with competition was approximately equal (~50%). While the proportion is equal, football players participate in more practice events than competition, and fractures typically require greater force, which is more likely to occur during competition than practice. 1 Subsequently, the rate of injury is much higher in competition than practice.
Despite the fact that we observed nearly 1000 fractures in this study, the total number of fractures ranks low when considering all other injuries. In an analysis of the NCAA-ISP, hand fractures were reported as the most common fracture yet represented only 1% of the total number of injuries reported. 4 Moreover, in an analysis of high school sports, football injuries requiring surgery represented 28.5% of all injuries, which included soft tissue injuries, 18 while 40.2% of football fractures required surgery for all injury types. 12 Our findings suggest that despite the relatively low incidence when compared with other injuries, the severity of outcomes associated with fractures merits continued examination of prevention strategies that aim to reduce injury incidence and severity.
The most common fractures reported in our study involved the hand/fingers, and our results are consistent with previous literature suggesting that 5% to 10% of metacarpal fractures require closed reduction and percutaneous pinning and that an additional 5% to 10% necessitate open reduction and internal fixation. 22 Our study found that >64.2% of operative hand/finger fractures resulted in time loss >21 days, which is higher than that of published reports among National Football League players, where only thumb fractures resulted in time loss >21 days and all other reported fractures of the hand/finger caused ≤21 days of time loss. 16 Furthermore, only a small proportion of hand/finger fractures in our study (1.8%) were considered recurrent injuries, although note that the proportion of injuries requiring surgery was significantly higher in recurrent than nonrecurrent hand/fingers fractures, despite the overall numbers being low.
Fractures of the lower leg were also common, accounting for 16.0% of all fractures and leading to substantial recovery time. Despite the severity of these injuries, there remains a paucity of information regarding the incidence of surgery and time lost after ankle fractures in collegiate football. Our study begins to address this gap in the literature, and our results suggest that 94.4% of lower leg fractures resulted in time loss >21 days, with 53.8% requiring surgery. Of the injuries that required surgery, 100% resulted in time loss >21 days. These findings are similar to the results of a study of tibial fractures among soccer players, where 54.2% were treated with surgery, 2 but they are much higher than a report on high school football players where only 5.8% of lower leg fractures required surgery. 18 The disparity in previous reports on operative lower leg fractures could be related to age, severity of fracture, or level of play and so represents a limitation with the inability to consider associated injuries in relation to the incidence of surgery and time lost.
Foot fractures accounted for 12.0% of all reported fractures, including fifth metatarsal fractures, which represents a slightly higher injury prevalence than that cited among elite-level collegiate football players and a slightly lower prevalence of surgery.10,15 According to an earlier review, these injuries are common among football players, 17 and operative fixation of fifth metatarsal fractures was among the most common orthopaedic procedure performed over a 10-year period for 1 collegiate program. Among 25 NFL patients who had surgery for a fifth metatarsal fracture, return to play occurred 8.7 weeks after surgery, and only 2 patients sustained a recurrent fracture. 14 In comparison, the current study had 15 total recurrent fractures of the fifth metatarsal, with 35.0% of all recurrent foot fractures requiring surgery. Unfortunately, we were not able to determine the prevalence of recurrent fifth metatarsal fractures requiring surgery.
It is important to recognize the effect that a fracture can have on collegiate football players. An estimated 47,199 injuries occur annually in NCAA football, with 26.2% requiring >7 days before full return to sport. 12 As such, for a student-athlete, injury not only disrupts competition but can have a profound effect on education as well. Researchers have determined that injury has a negative affect on the health-related quality of life of injured collegiate athletes. 8 Injuries requiring surgery had a further affect related to decreased mobility, the need for narcotic medications, and the inability to focus on academics. Thus, not only did the 62.5% of student-athletes who missed >21 days have their season irreversibly changed (and possibly their future in football), but their ability to focus on academics may have also been compromised. It is very difficult to fully quantify the effect of injuries such as fractures, but the current study clearly demonstrates that these injuries are common and that for student-athletes the effect can be substantial. Thus, injury prevention initiatives should be focused toward this area to reduce the burden of fractures and associated morbidity among athletes.
Despite the importance of this study reporting on the incidence of fractures in football, the frequency of surgery, and the associated time lost, there are several limitations. Inherent to all database studies, the information contained is reliant on the accuracy of reporting by the football team medical staff (eg, ATs, physicians). As a result, overall numbers can be skewed if the information is recorded incorrectly. Moreover, this report does not include any information on player position, which could influence the incidence of surgery and/or the length of time out of competition. Regarding the length of time loss, the database does not further stratify beyond 21 days. In addition, time lost from participation may be affected by timing of injury within the season. Surgical information is also limited in that indications and specific procedures performed are not reported. Furthermore, there is potential for underreporting of injuries that required surgery if the athlete had surgery after completion of his collegiate career. Nonetheless, the information provides important insight into the effect of these injuries in the game of football, with the possibility of implementing additional safety measures to protect the student-athletes.
In conclusion, collegiate football is a physical game that results in a high rate of injury. Although fractures represent 4.4% of all injuries sustained during this period, the effect in the form of time lost from participation is noteworthy. Based on the number of fractures requiring surgery and the associated time loss, further research is necessary to mitigate the effect and allow injured athletes to return to sport sooner. It is the goal of the current study, in conjunction with other published reports, to provide the impetus to improve safety and advance rehabilitation protocols.
Footnotes
Acknowledgements
The authors thank the many ATs who have volunteered their time and efforts to submit data to the NCAA-ISP. Their efforts are greatly appreciated and have had a tremendously positive effect on the safety of collegiate athletes.
The content of this manuscript is solely the responsibility of the authors and does not necessarily represent the official views of the NCAA.
One or more of the authors has declared the following potential conflict of interest or source of funding: The National Collegiate Athletic Association (NCAA) Injury Surveillance Program data were provided by the Datalys Center for Sports Injury Research and Prevention. The Injury Surveillance Program was funded by the NCAA.
References
Supplementary Material
Please find the following supplemental material available below.
For Open Access articles published under a Creative Commons License, all supplemental material carries the same license as the article it is associated with.
For non-Open Access articles published, all supplemental material carries a non-exclusive license, and permission requests for re-use of supplemental material or any part of supplemental material shall be sent directly to the copyright owner as specified in the copyright notice associated with the article.