
Abstract
Background:
Although batters are frequently hit by pitch (HBP) in baseball, the effect of HBP injuries remains undefined in the literature.
Purpose:
To determine the effect of HBP injuries in terms of time out of play, injury patterns resulting in the greatest time out of play, and the value of protective gear such as helmets and elbow pads.
Study Design:
Descriptive laboratory study.
Methods:
Based on the Major League Baseball (MLB) Health and Injury Tracking System, all injuries to batters HBP during the 2011-2015 MLB and Minor League Baseball (MiLB) seasons were identified and analyzed. Video analysis was performed on all HBP events from the 2015 MLB season. Multivariate stepwise regression analysis was utilized to determine the predictive capacity of multiple variables (velocity, pitch type, location, etc) on injury status and severity.
Results:
A total of 2920 HBP injuries resulted in 24,624 days missed (DM) over the 5 seasons. MLB HBP injuries occurred at a rate of 1 per 2554 plate appearances (1 per 9780 pitches thrown). Mean DM per injury were 8.4 (11.7 for MLB vs 8.0 for MiLB, P < .001). Surgery was required for 3.1% of MLB injuries and 1.2% of MiLB injuries (P = .005). The most common body regions injured were the hand/fingers (n = 638, 21.8%), head/face (n = 497, 17.0%), and elbow (n = 440, 15.7%), and there were 146 (5.0%) concussions. Injury rates and mean DM correlated with velocity in a near linear fashion. Players hit in the head/face (odds ratio, 28.7) or distal upper extremity (odds ratio, 6.4) were more likely to be injured than players HBP in other locations. Players with an unprotected elbow missed 1.7 more days (95% CI, –4.1 to 7.6) than those with an elbow protector (P = .554) when injured after being HBP.
Conclusion/Clinical Relevance:
Although HBP injuries occur infrequently in the course of normal play, they collectively represent a significant source of time out of play. The most common body regions injured include the hands/fingers and head/face, and batters hit in these locations are significantly more likely to be injured. After contusions, concussions were the most common injury diagnosis.
Baseball is a unique game in that, unlike most sports, it is the defense that predominantly controls the action and pace of play. Accordingly, offensive players (batters) have little to no influence over pitchers in terms of pitch type, ball velocity, and pitch location. This establishes a dynamic in which batters may have difficulty escaping being hit by pitch (HBP). These HBP events can cause considerable discomfort, injury, and time out of play for these batsmen. On August 17, 1920, shortstop Ray Chapman was hit in the head by a pitch from Carl Mays. 2 Chapman was the first and only known Major League Baseball (MLB) player to die as a result of being hit by a pitch. Since that time, a multitude of rule changes have been implemented to better protect hitters: replacing the ball when dirty and difficult to see, utilization of more sophisticated helmets with ear protection, and negative consequences for pitchers who are thought to have intentionally thrown at batters. The use of accessory protective gear, such as elbow pads and facemasks, has also been on the rise in recent years.
Despite these efforts, HBP injuries still occur in baseball. Although new studies are reporting the incidences of injuries to pitchers, position players, base runners, and catchers, little is known about the effect of batters being hit by ptiches.1,4-6,9,12 In 2012, Athiviraham and colleagues 2 studied the effect of baseball-to-helmet injuries in MLB. They identified a few risk factors that increased the likelihood of the batter’s sustaining a more significant injury or concussion. These included increased pitch velocity and location of impact.
Although each of these works represents a significant contribution to our understanding of injuries sustained by hit batsmen, each focuses on a small portion of the actual injuries that occur. Many of these studies are also limited by their reliance on disabled lists and publicly accessible online injury reports. Despite these efforts, the incidence, rate, effect, and types of HBP injuries in baseball remain undefined in the current literature, and a more comprehensive analysis is warranted. Based on the recently implemented MLB Health and Injury Tracking System (HITS) database, 11 the purposes of this work were to better understand the epidemiology of injuries occurring among MLB and Minor League Baseball (MiLB) players who are HBP. Specifically, we sought to (1) quantify the effect of these injuries in terms of time out of play, (2) determine the most common body regions injured, (3) identify injury patterns and risk factors that result in the greatest time out of play, and (4) better understand the effect of protective gear such as helmets and elbow pads. We hypothesized that getting hit by a pitch is a significant source of injury and morbidity for professional batters and that injury severity would correlate with body region injured, pitch type, and velocity but would be reduced for players hit in locations shielded by protective gear.
Methods
This work was approved by the institutional review board of the Hospital for Special Surgery and the MLB Research Committee. After approval, all professional baseball players (MLB and MiLB) were identified who sustained an HBP injury during the 2011-2015 seasons. For this work, the term “HBP events” describes any time that a player is HBP (regardless of whether it results in an injury). “HBP injuries” were defined as the HBP events that required the player to miss at least 1 day of play, and these were identified with the HITS surveillance system. The HITS medical record system captures injuries reported by athletic trainers that result in time out of play for all professional baseball players from 30 MLB clubs and their 230 minor league affiliates. Additional details of HITS were previously published.1,7,8,11
Variables analyzed for all injuries included region of the body injured, diagnosis (Sports Medicine Diagnostic Coding System), 10 date of injury, date of return to play, days missed (DM), player position, level of play (MLB vs MiLB), activity leading to injury, and treatment (surgical or nonoperative). Injuries were excluded if they occurred during the off-season. Similarly, injury events classified as “season ending” were excluded from the analysis of DM since many of these players may not have officially “returned to play” until the beginning of the following season. These injuries were not excluded from the descriptions of injury type, body region injured, diagnosis, and so on.
To determine injury rates and the effect of specific variables on injury severity, detailed video analysis was performed on HBP injuries occurring in MLB during the 2015 season. For this year, video analysis was performed for every HBP event in MLB, regardless of whether the event resulted in an injury. Data extracted from the 2015 HBP videos included body location in which the batter was hit, pitch type, and pitch velocity. Overall injury rates were calculated by dividing the number of HBP injuries by the total number of HBP events for that season. Additional analysis was performed to determine the injury rates and mean DM based on pitch type and pitch velocity. The independent risk for injury and increasing severity of injury (defined by increasing number of DM) was assessed for a number of variables (pitch velocity, pitch type, body region HBP, and time of season) via multivariate stepwise linear and logistic regression analysis.
Finally, to determine the effect of protective equipment (helmets and elbow pads) worn while batting, video analysis was performed for every MLB HBP injury to the head/face/neck and elbow across the entire study period (2011-2015). In this analysis, mean DM were compared between injured players hit in the elbow while wearing a pad and injured players hit in the unprotected elbow. Similarly, mean DM for players hit in the helmet were compared with those hit in an area of the head or face that was not protected by the helmet. Video footage was not reliably available for all MiLB HBP injuries, so these were not included in the HBP analysis.
Statistics
Epidemiologic data are presented with descriptive statistics, such as mean, median, frequency, and percentage where appropriate. Pairwise comparisons between normally distributed continuous variables (mean DM between MLB and MiLB players) were performed with a Student t test. Proportions (frequency of surgery) were compared between groups with the Fisher exact test. Linear regression was used to determine the significance of trends over time or increasing pitch velocity. These results are reported with their corresponding R2 and P values. To determine the predictive capacity of variables (body region HBP, velocity, pitch type, time of year, etc) on injury status and DM, multivariate analysis was performed with a backward stepwise logistic and linear regression for all variables where P < .10. These results are reported in odds ratios (ORs) with corresponding 95% CIs and P values. For all analyses, only P values <.05 were considered to represent statistically significant differences.
Results
During the 2011-2015 seasons, there were a total of 2920 HBP injuries in professional baseball that resulted in at least 1 day out of play. Of these, 361 (12%) occurred among MLB batters and 2559 (88%) among MiLB batters (Table 1). There were a total of 9783 and 62,184 HBP events in MLB and MiLB, respectively. HBP injuries occurred once for every 21.7 HBP events, 2554 plate appearances, and 9780 pitches thrown. In MiLB, they occurred once for every 24.3 HBP events and 1791 plate appearances. These injuries resulted in a total of 24,624 days out of play, and the mean DM per injury were 8.4. MLB players missed a mean of 11.7 days per injury, as opposed to 8.0 for MiLB players (P < .001). The percentage of injuries requiring surgery was low (1.4%), and surgical treatment was more commonly required at the MLB versus MiLB level (3.1% vs 1.2%, P = .005). Overall, the annual number of HBP injuries remained steady (R2 = 0.241, P = .401) with an average of 584 injuries per season and 4925 DM per season (Table 2, Figure 1). In MLB, the annual number of HBP injuries was highest in 2011 (n = 107). Although this declined to 48 HBP injuries the following year (2012), there was a steady increase in HBP injuries from 2012 to 2015 at the MLB level alone (R2 = 0.980, P = .010).
HBP Injuries in Major and Minor League Baseball a
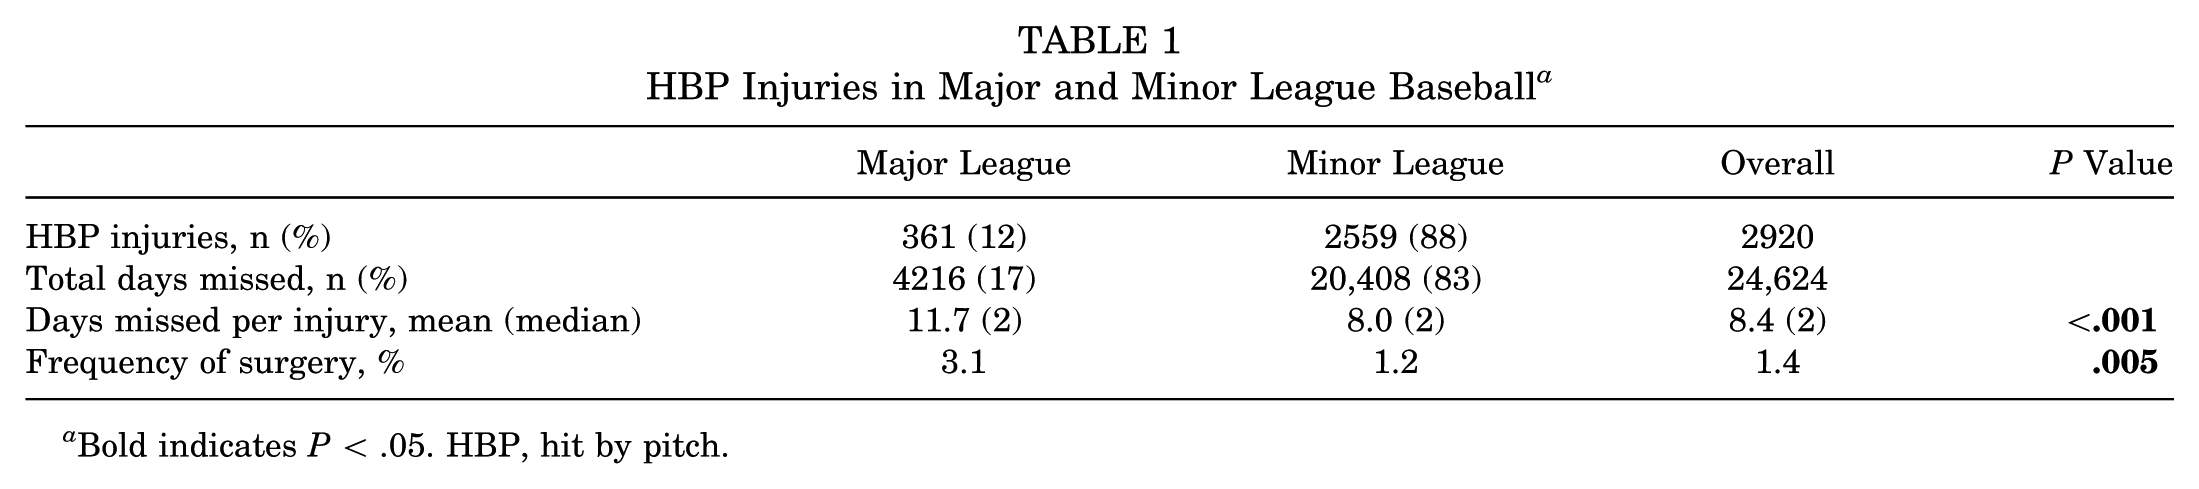
Bold indicates P < .05. HBP, hit by pitch.
Comparison of Hit-by-Pitch Injuries by Season in Professional Baseball a
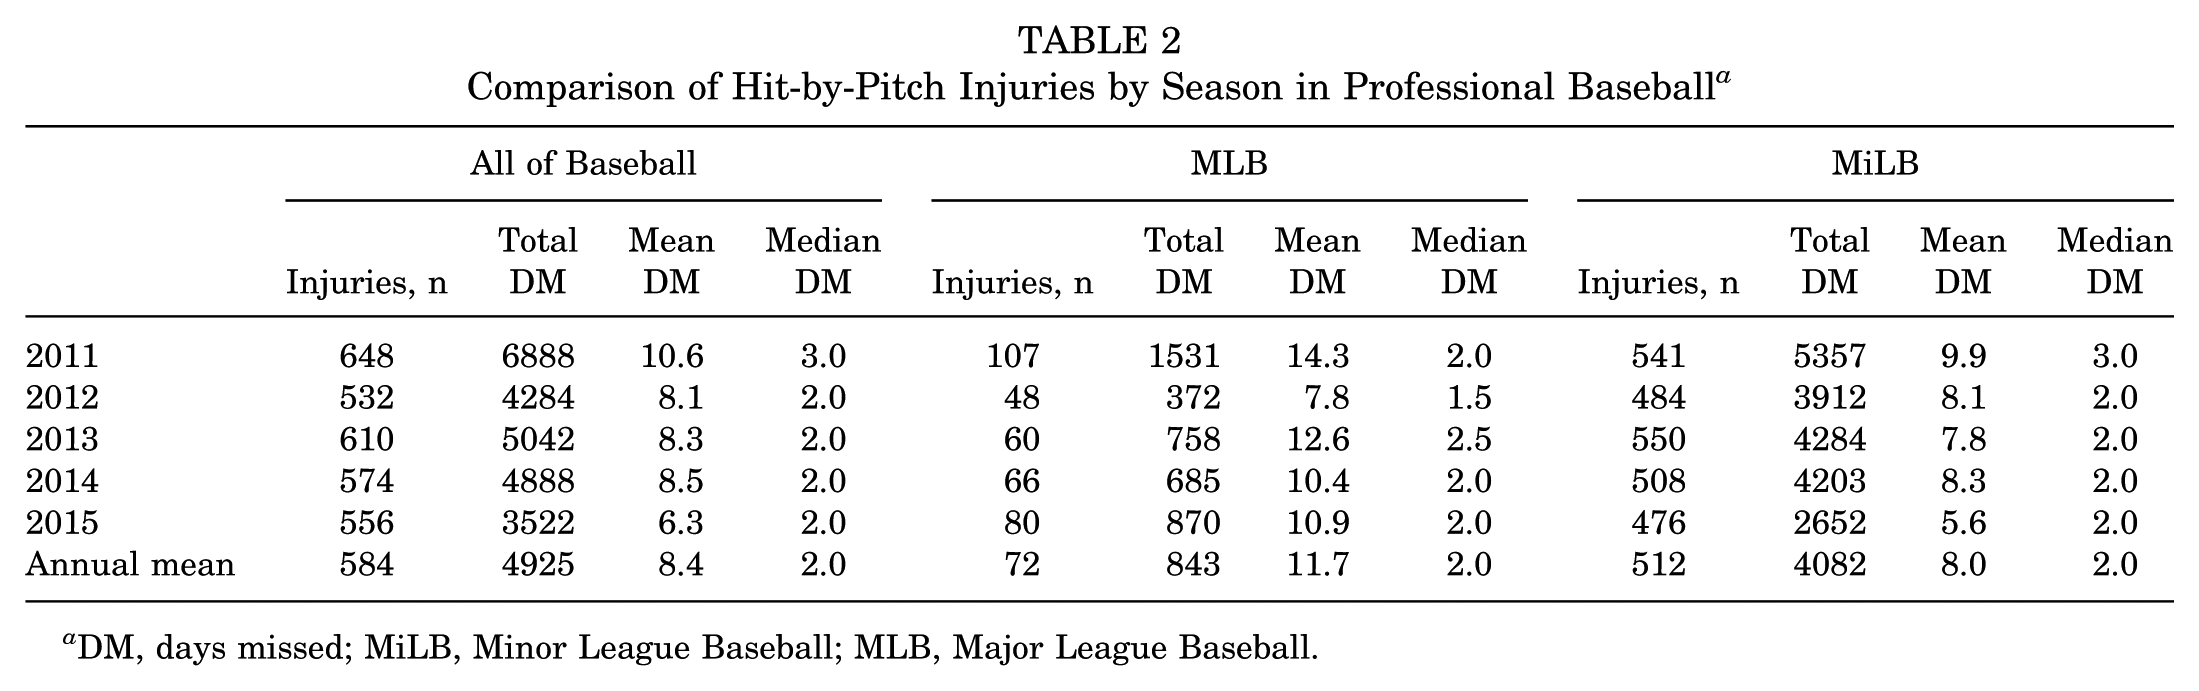
DM, days missed; MiLB, Minor League Baseball; MLB, Major League Baseball.
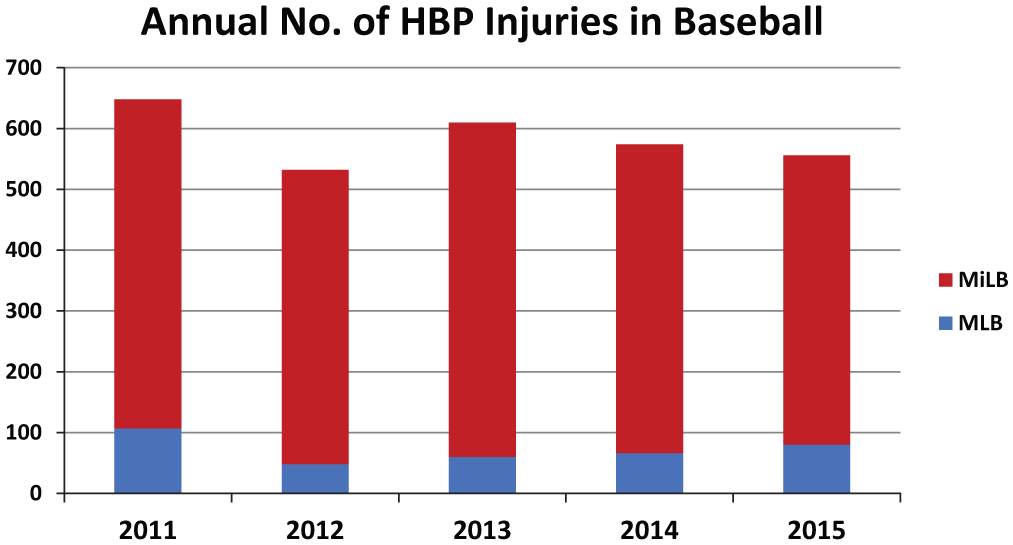
Overall annual number of hit by pitch (HBP) injuries remained steady (R2 = 0.241, P = .401). This was the case at the Minor League Baseball (MiLB) level (R2 = 0.257, P = .384) and the Major League Baseball (MLB) level (R2 = 0.063, P = .683) for the entire study period. However, when limited to MLB from 2012 to 2015 (excluding the outlying year of 2011), the annual number of injuries actually increased (R2 = 0.980, P = .010).
The most commonly injured body region was the hand/finger/thumb, which accounted for 638 (21.8%) of all HBP injuries (Table 3). This was closely followed by the head/face (n = 497, 17.0%), elbow (n = 440, 15.7%), forearm (n = 265, 9.1%), and wrist (n = 205, 7.0%). Table 3 lists the most common diagnoses. After contusions, the next-most common diagnoses were concussion (n = 146, 5.0%), other head injury (n = 132, 4.5%), and facial contusion (n = 130, 4.5%).
Body Region Injured and Diagnosis for the Most Commonly Occurring Hit-by-Pitch Injuries in Professional Baseball Players a
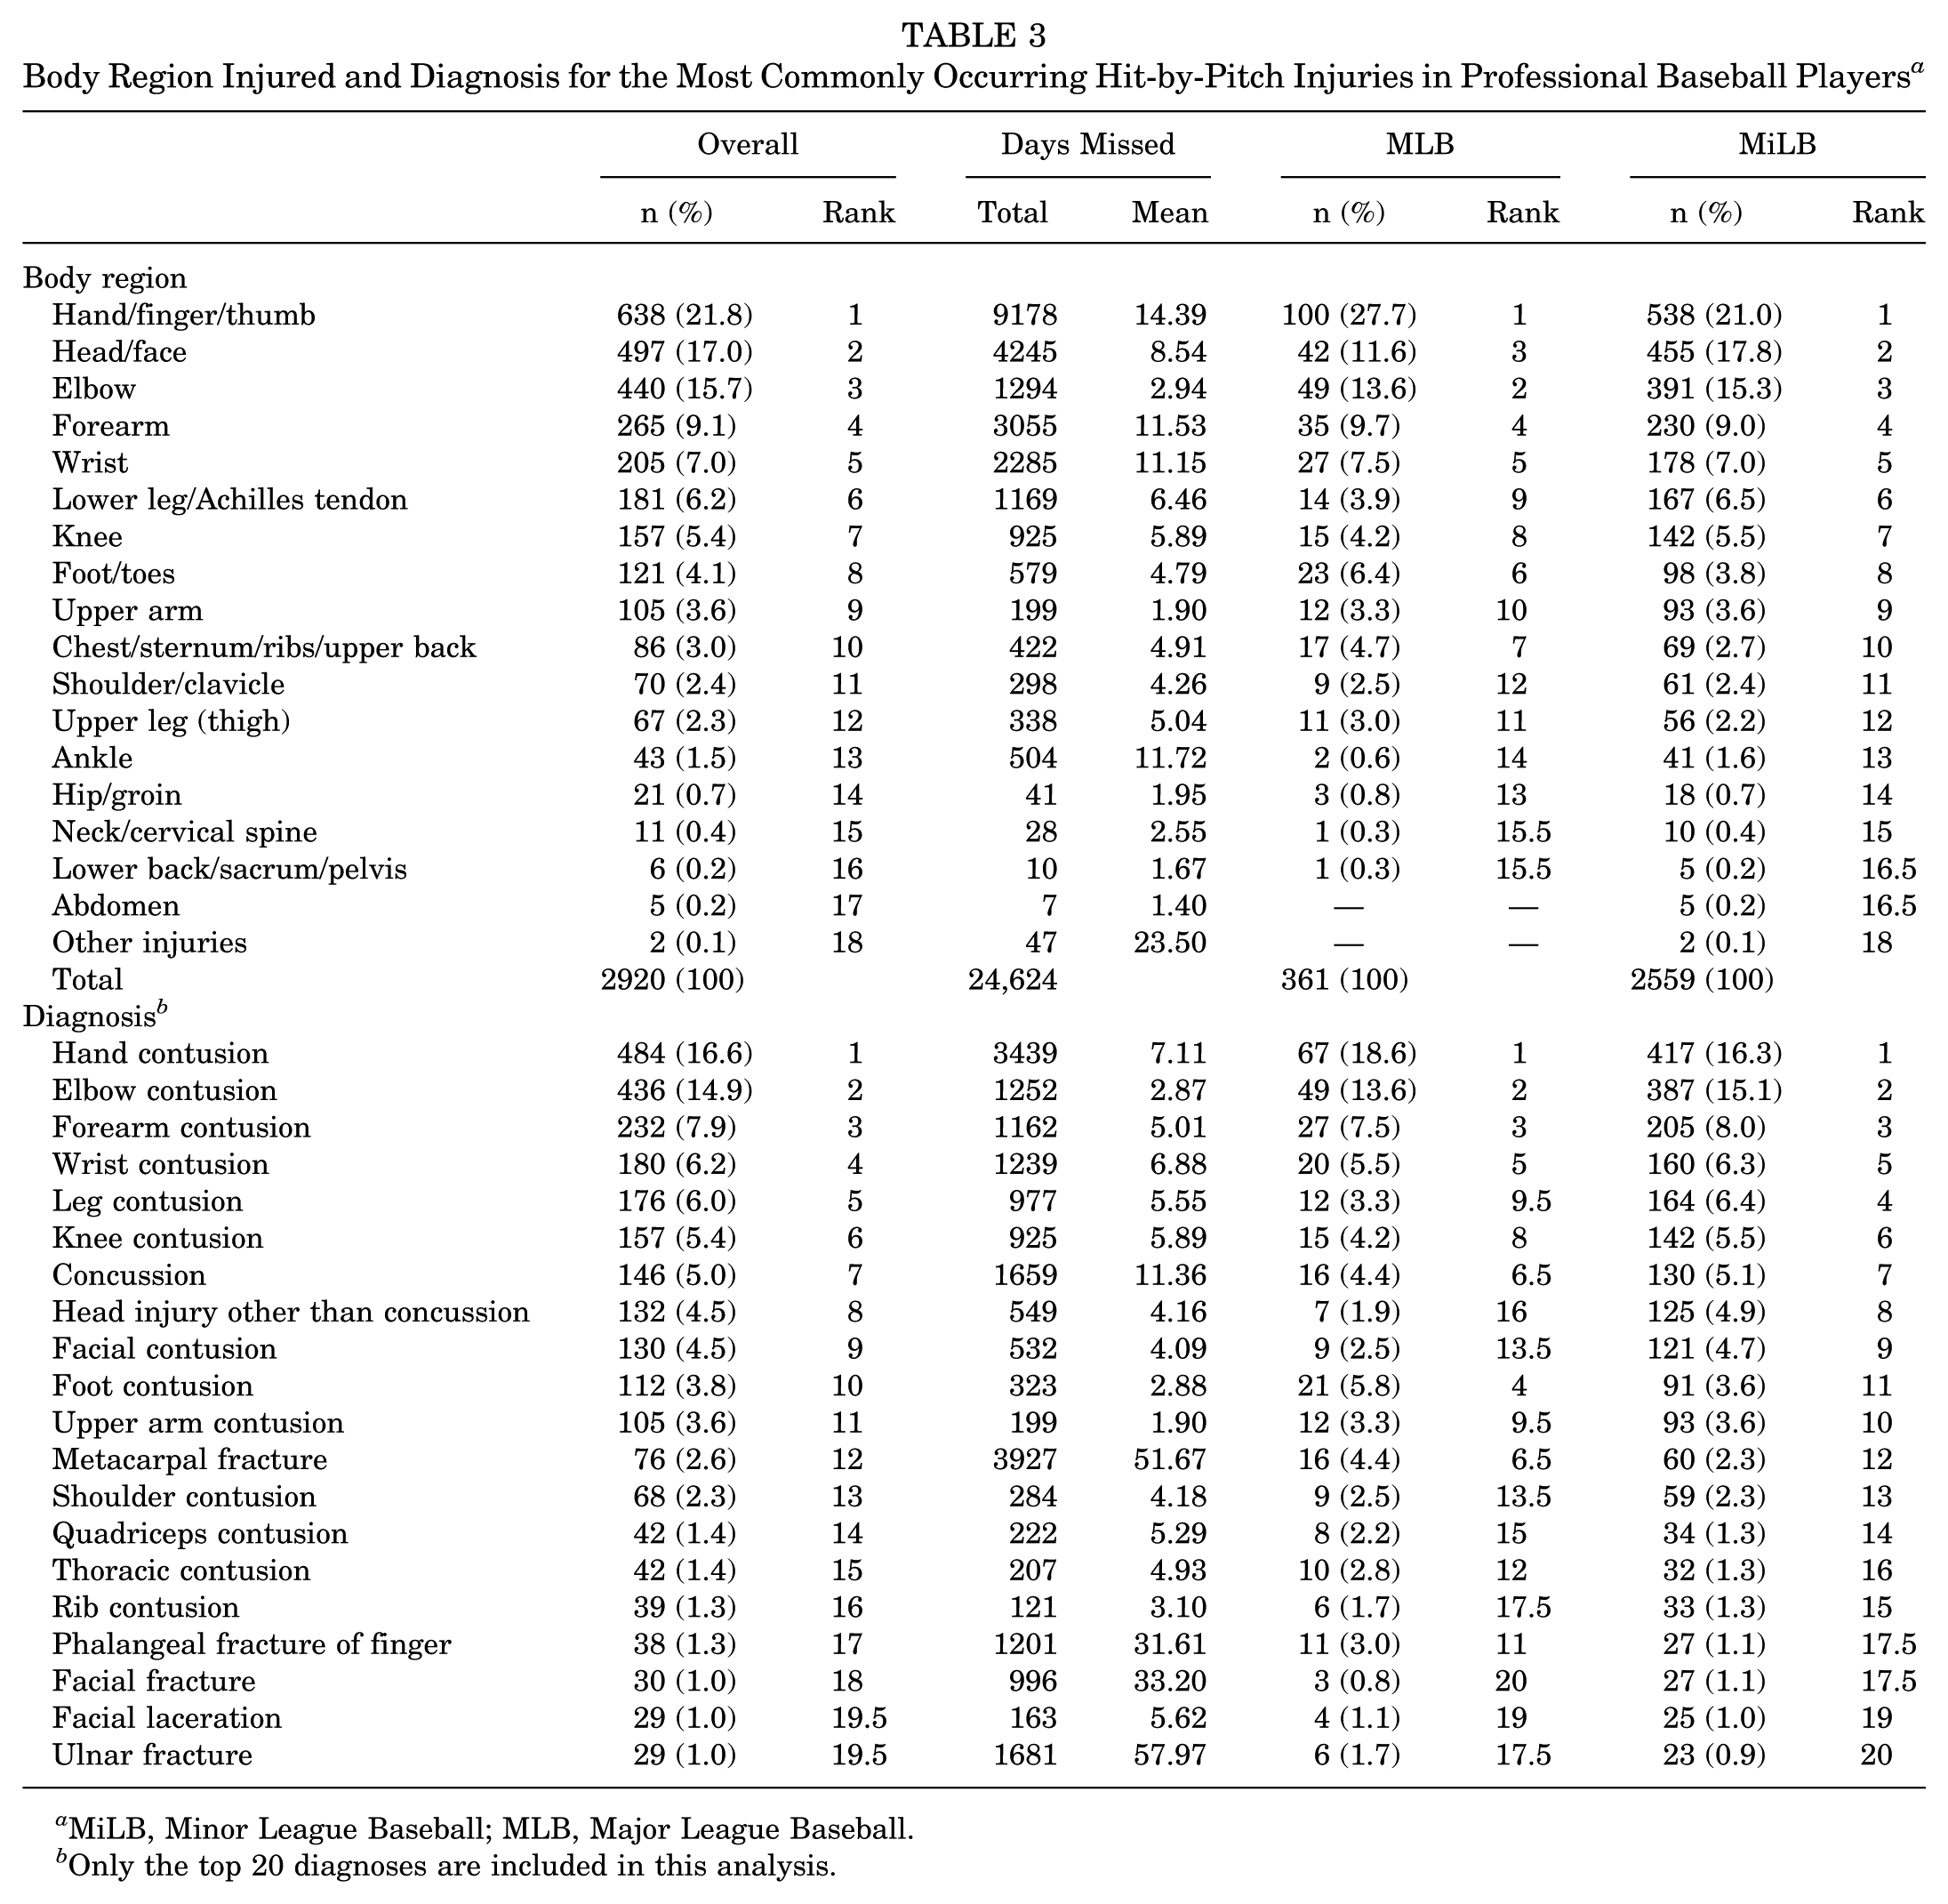
MiLB, Minor League Baseball; MLB, Major League Baseball.
Only the top 20 diagnoses are included in this analysis.
Based on the video analysis of all HBP events from the 2015 MLB season, injury rates were calculated and are provided in Figure 2. Although the overall injury rate (number of HBP injuries / number of HBP events) was 2.9%, the injury rate for players HBP in the head/neck was >10 times greater at 31%. This was followed by the forearm (9%) and hand (9%), while all other body regions demonstrated injury rates ≤2%. Based on pitch type, fastballs resulted in the highest rate of injury (3.7%) (Table 4). As pitch velocity increased, injury rates increased in a near linear fashion (R2 = 0.938, P = .002), and the same was noted for mean DM per injury (R2 = 0.863, P = .007) (Figure 3). In the multivariate analyses, the only significant predictor of injury was body region injured. Players hit in the head/neck demonstrated an OR of 28.68 (P < .001), while those hit in the distal upper extremity demonstrated an OR of 6.36 (P < .001) as compared with all other body regions (Table 5). Players hit in the distal upper extremity (OR, 1.96; P = .004) were more likely to miss an increased number of days.
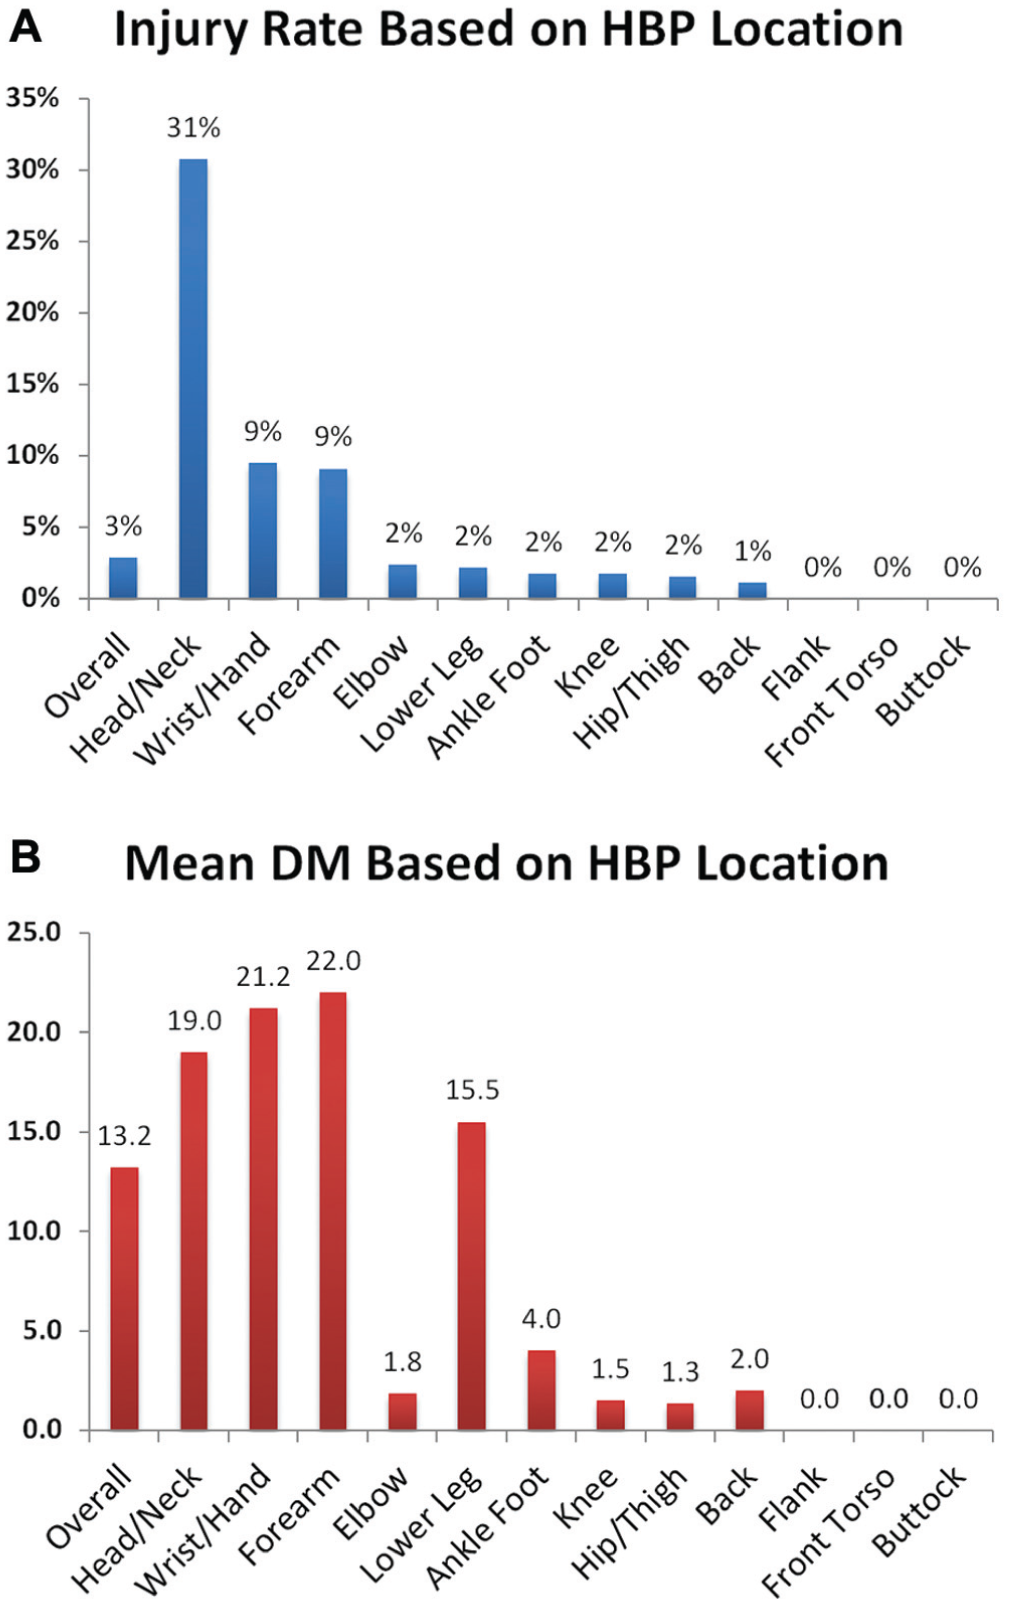
(A) Injury rates and (B) mean days missed (DM) for injuries during the 2015 Major League Baseball season, based on body region in which the batter was hit by pitch (HBP).
HBP Injury Rates Based on Type of Pitch and Velocity for Major League Baseball in 2015 a
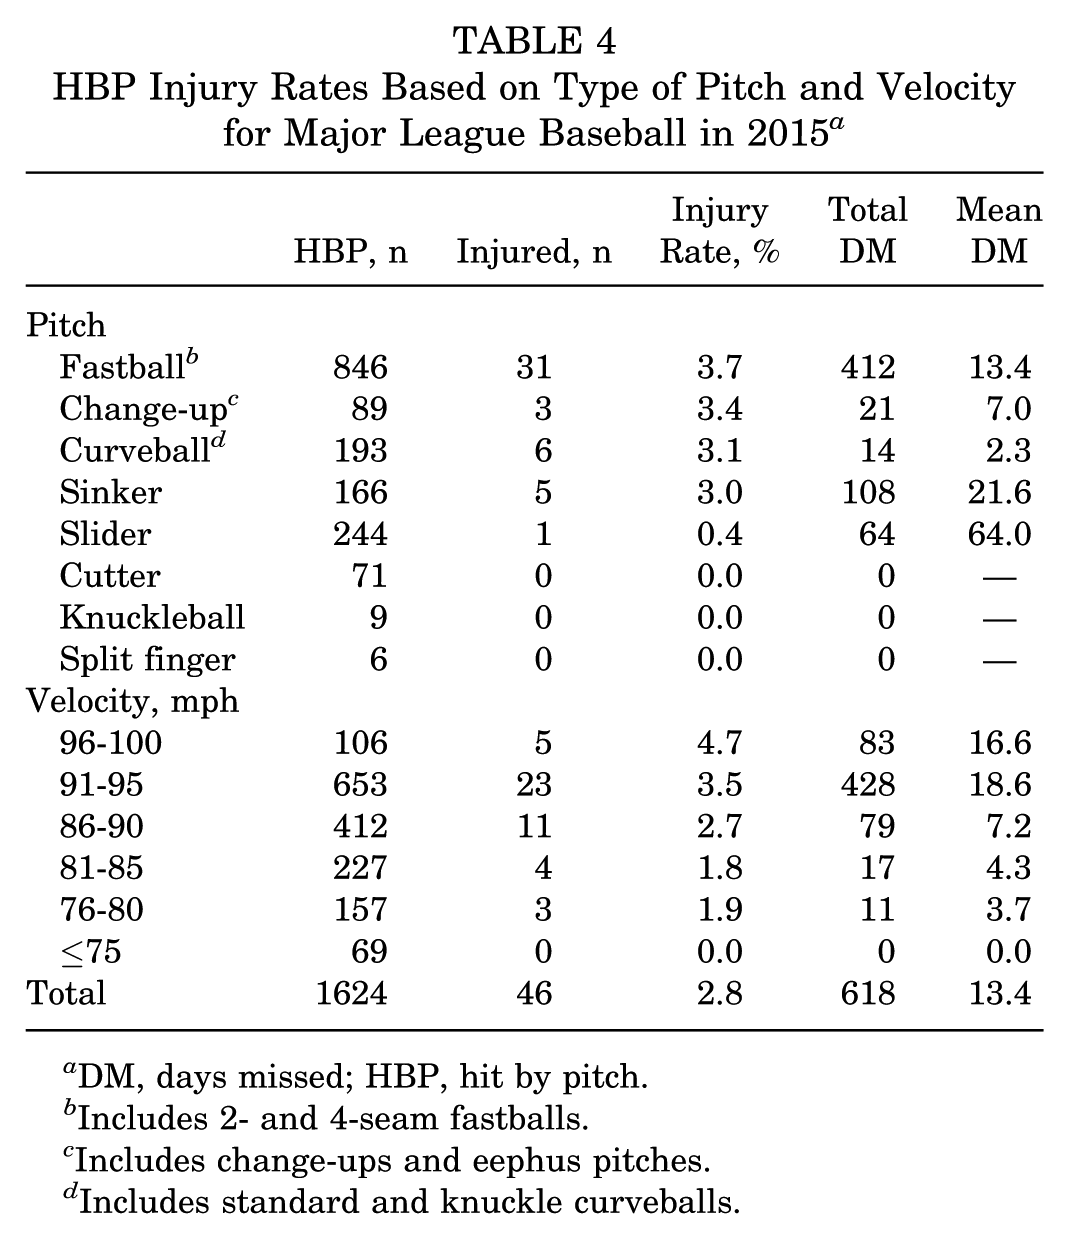
DM, days missed; HBP, hit by pitch.
Includes 2- and 4-seam fastballs.
Includes change-ups and eephus pitches.
Includes standard and knuckle curveballs.
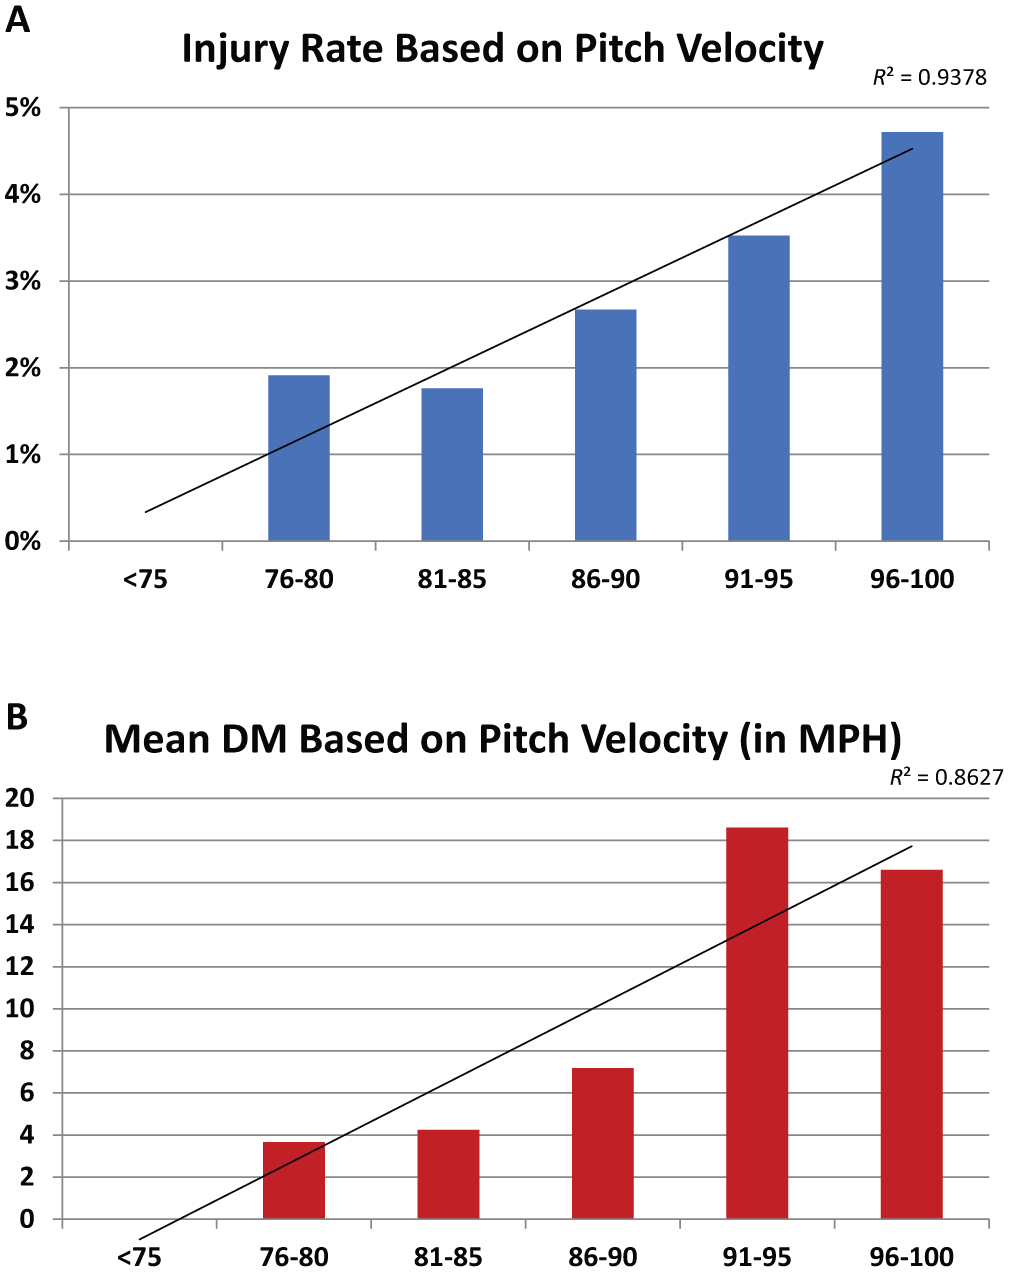
For the 2015 Major League Baseball season, (A) the injury rate (defined as number of HBP injuries per HBP occurrence) increased in a near linear fashion with increasing velocity of the pitch (R2 = 0.938, P = .002). (B) A similar trend is noted for the mean number of days missed (DM) based on pitch velocity in miles per hour (R2 = 0.863, P = .007). HBP, hit by pitch.
Significant Risk Factors for Injury and Increased Days Missed After HBP Events a
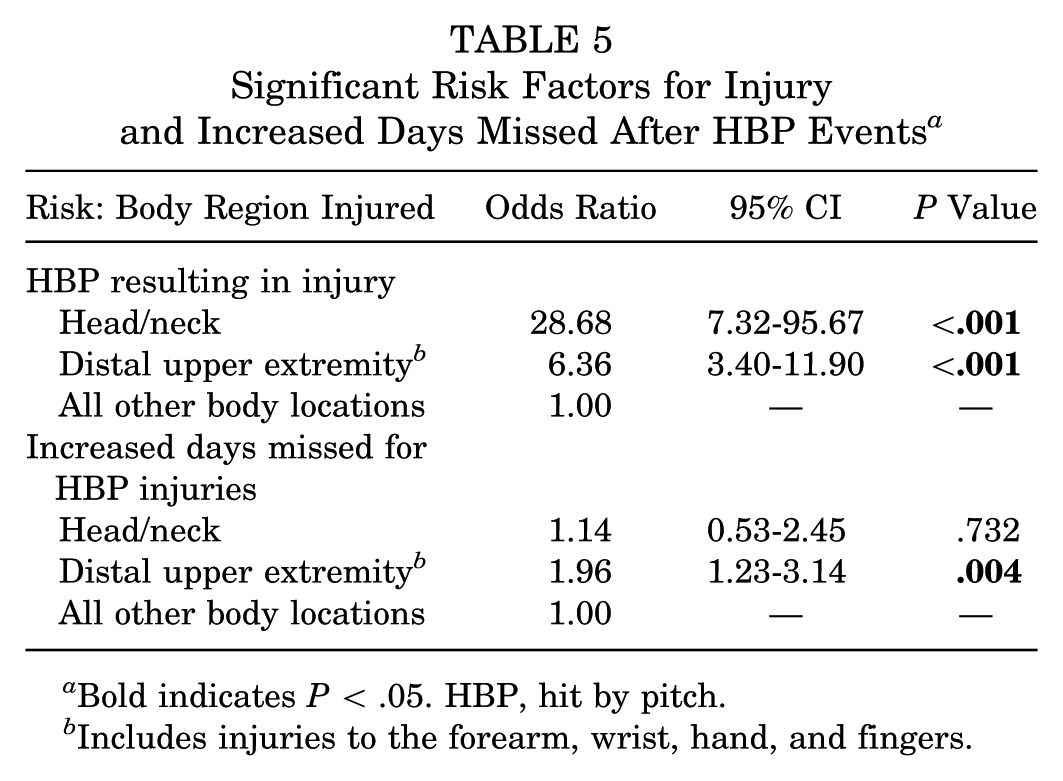
Bold indicates P < .05. HBP, hit by pitch.
Includes injuries to the forearm, wrist, hand, and fingers.
In the analysis of protective gear, a total of 44 players were injured after an HBP to the elbow. Of these, 9 were hit on a protective elbow pad while 35 were not. Mean DM per injury were 1.8 days for the group wearing a pad versus 3.5 days for those without a pad (mean difference, 1.7 days; 95% CI, –4.1 to 7.6; P = .554). Similarly, 35 MLB players were injured after being HBP in the head/face/neck. Of these, 24 were hit in the helmet, while 11 were hit elsewhere in the head/face/neck. The DM missed for those hit in the helmet were 7.3, as opposed to 12.7 for those hit outside the helmet (mean difference, 5.4 days; 95% CI, –4.5 to 15.4; P = .275).
Discussion
While it is well established that injuries are on the rise for professional baseball players, very little is known about injuries to batters, and even less is understood about injuries secondary to batters being HBP. Accordingly, the purposes of this work were to utilize HITS data to understand the epidemiology and effect of these injuries, determine the most common body regions injured, identify the most significant injury patterns and risk factors, and determine the benefit of protective gear worn by batters. Ultimately, an average of 584 hit batsmen missed 4925 days of play in professional baseball each year studied, and 3.1% of these required surgical treatment for their injuries. Although the overall rate of annual HBP injuries remained steady, the annual incidence increased from 2012 to 2015 in MLB. The overall injury rate was low (3%), but it was >10 times higher (31%) for players hit in the head/neck. Both injury rate and mean DM correlated with pitch velocity in a near linear fashion, and the greatest independent predictors for injury and increased DM were being hit in the head/neck or the distal upper extremity.
Based on this analysis, MLB HBP injuries occurred only once for every 21.7 HBP events, 2554 plate appearances, and 9780 pitches thrown; however, a total of 24,624 days were missed owing to HBP injuries during the study period across all of MLB and MiLB. This equates to approximately 27 full baseball seasons (4925 days) worth of missed time each year. Although the mean number of DM per injury was 8.4, the median is much lower at 2.0 DM per injury. This indicates that the mean may be inflated because of outlying injuries that lead to very prolonged periods of missed time (many of which may have required surgery). It is also worth noting that the mean DM and percentage of injuries requiring surgery were significantly higher for MLB versus MiLB players. These findings are similar to those published by Dahm et al 7 in a recent study on knee injuries in professional baseball. For HBP injuries, this discrepancy between MLB and MiLB may be related to increased pitch velocity or improved access to medical care at the MLB level. Another potential reason could be reticence of MiLB players to undergo surgery because of a strong desire to minimize time out of play as they attempt to move forward in the system.
In contrast to many previous reports on rising injuries in baseball,3,5,7,12 the overall burden of HBP injuries has remained fairly steady across all of baseball. The greatest number of injuries was reported in 2011 (n = 648), and the lowest occurred the following year (n = 532). This discrepancy between 2011 and 2012 is particularly pronounced for MLB. While there were 107 HBP injuries and 1531 DM in 2011 for MLB, these numbers sharply fell to 48 injuries and 372 DM in 2012. Since that time, there has been a steady increase in the annual number of HBP injuries and total DM in MLB alone, which is more consistent with other epidemiologic reports on baseball-related injuries.6,7,12 The cause of these findings regarding the fall and rise of HBP injuries in MLB is not immediately apparent, but 2011 appears to be an outlier as compared with more recent years.
Perhaps it is not surprising that the most commonly injured body region is the upper extremity. After all, the hands are the part of the batter that is nearest to the strike zone for most hitters. Ultimately, upper extremity injuries accounted for 1723 (59%) of all HBP injuries and 16,309 (66%) DM. It is also worth noting that players hit in the elbow, forearm, wrist, hands, or fingers were 6 times more likely to miss time from play than those hit in other body locations (excluding the head/neck). Because batters are so commonly hit in the upper extremity, many now wear protective elbow pads while batting. In this work, the mean difference in DM was 1.7 days between players with and without an elbow pad who were injured after being hit in the elbow. This difference, however, did not reach statistical significance (P = .554), which was likely due to insufficient power. Note that only injured players (those actually missing time) were included in this analysis. This study was not designed to detect differences in injury rates between players with and without elbow pads, but this may prove an interesting topic for future study.
After hand injuries, the most common body region injured was the head/face (n = 497, 17.0%). Other than contusion, the most common overall diagnoses were concussion (n = 146, 5.0%) and “head injury other than concussion” (n = 132, 4.5%), the reason for which is twofold: (1) nearly one-third (31%) of players HBP in the head/neck are forced to miss time from play, and (2) batters are 29 times more likely to miss time when hit in the head/face as compared with all other body regions (excluding distal upper extremity). Similar to the present study, Athiviraham et al 2 demonstrated that increased pitch velocity was correlated with more severe injury and increased likelihood of concussion when HBP in the helmet. In their work, 50% (9/18) of players hit in the helmet were diagnosed with a concussion. Despite the tremendous advancements that have been made as hitters have progressed from wearing wool caps to leather-padded hats to modern plastic helmets, this remains an important issue for professional baseball batters. It is also worth noting that batters injured when hit in the head/face missed a mean 8.5 days (Table 3), which is less than the mean DM for injuries to the hand (14.4 days), ankle (11.7 days), forearm (11.5 days), and wrist (11.2 days). These data suggest that usage of helmets has been successful in preventing catastrophic head injuries that may have been more common in the early days of baseball.
Although these results represent a number of novel findings, this work is certainly not without its limitations. As with all injury surveillance systems, the accuracy of data depends on those entering injuries into the system. Although the data are primarily entered by athletic trainers who are familiar with their players’ health and are well versed with the medical record system, some injuries may have been missed. The video analysis portion of this study is limited in that only MLB events could be included, as MiLB video data are not consistently available. Despite this limitation, >1600 HBP videos were reviewed for this work. Another limitation of this work was that the study was likely underpowered to determine the true efficacy of protective gear such as elbow pads. A number of strengths to this work merit mention. These include its comprehensive nature of including every HBP injury occurring at every level of professional baseball over 5 seasons, inclusion of video analysis, utilization of multivariate analysis to account for confounding variables, the focused nature on a specific injury mechanism that is responsible for a significant amount of disability in the sport of baseball, and report on a topic that was not previously discussed in the medical literature.
Conclusion
Injuries rarely occur as a result of batters being HBP; however, these injuries collectively represent a significant source of disability and time out of play from professional baseball. Although the annual rate of HBP injuries remained steady in MiLB, the number of injuries significantly increased from 2012 to 2015 in MLB. The 2 most common body regions injured were the hand and the head, and both these areas demonstrated significantly higher injury rates as compared with all other body regions. HBP injuries to the head were responsible for 146 concussions during the study period. Injury severity (in terms of injury rate and mean DM per injury) correlated with pitch velocity in a near linear fashion. Accordingly, these high-velocity injuries to the hands and head may represent a potential target for injury prevention programs in the future.
Footnotes
Acknowledgements
The authors acknowledge and thank the Office of the Commissioner of MLB for its support in this work. Similarly, they thank the MLB Players Association for its collaborative assistance, as this work would not have been possible otherwise. Finally, they acknowledge the athletic trainers and medical professionals of MLB and MiLB for their dedication to patient care and continual data collection and entry into the HITS database.
One or more of the authors has declared the following potential conflict of interest or source of funding: C.L.C. reports education and hospitality payments from Arthrex and hospitality payments from Zimmer Biomet and Stryker Corp. S.H.C. reports intellectual property royalties from Blue Belt Technologies; stock or stock options from Blue Belt Technologies and Cymedica Orthopedics; consulting fees from StrykerPivot Medical, Biomet Sports Medicine, and MAKO Surgical; and education payments from Smith & Nephew. J.S.D. reports consulting fees from Arthrex, Trice, Wright Medical, Linvatec, and DePuy; research support from Arthrex; and intellectual property royalties from Linvatec. S.F. reports intellectual property royalties from DJ Orthopaedics and other payments from Enocre.
References
Supplementary Material
Please find the following supplemental material available below.
For Open Access articles published under a Creative Commons License, all supplemental material carries the same license as the article it is associated with.
For non-Open Access articles published, all supplemental material carries a non-exclusive license, and permission requests for re-use of supplemental material or any part of supplemental material shall be sent directly to the copyright owner as specified in the copyright notice associated with the article.