
Abstract
Background:
Given the high prevalence of patients with hip deformities and no ongoing hip dysfunction, understanding the anatomic factors predicting the symptomatic state is critical. One such variable is how the spinopelvic parameters (SPPs) may interplay with hip anatomic factors.
Hypothesis/Purpose:
SPPs and femoral- and acetabular-specific parameters may predict which patients will become symptomatic. The purpose was to determine which anatomic characteristics with specific cutoffs were associated with hip symptom development and how these parameters relate to each other.
Study Design:
Cohort study (Diagnosis); Level of evidence, 2.
Methods:
548 participants were designated either symptomatic patients (n = 176, scheduled for surgery with hip pain and/or functional limitation) or asymptomatic volunteers (n = 372, no pain) and underwent 3-dimensional magnetic resonance imaging. Multiple femoral (α angle, Ω angle, neck angle, torsion), acetabular (version, coverage), and spinopelvic (pelvic tilt, sacral slope [SS], pelvic incidence) parameters were measured semiautomatically. Normative values, optimal differentiating thresholds, and a logistic regression analysis were computed.
Results:
Symptomatic patients had larger cam deformities (defined by increased Ω angle and α angle), smaller acetabular coverage, and larger pelvic incidence and SS angles compared with the asymptomatic volunteers. Discriminant receiver operating characteristic analysis confirmed that radial 2-o’clock α angle (threshold 58°-60°, sensitivity 75%-60%, specificity 80%-84%; area under the curve [AUC] = 0.831), Ω angle (threshold 43°, sensitivity 72%, specificity 70%; AUC = 0.830), acetabular inclination (threshold 6°, sensitivity 65%, specificity 70%; AUC = 0.709), and SS (threshold 44°, sensitivity 72%, specificity 75%; AUC = 0.801) (P < .005) were the best parameters to classify participants. When parameters were entered into a logistic regression, significant positive predictors for the symptomatic patients were achieved for SS, acetabular inclination, Ω angle, and α angle at 2-o’clock, correctly classifying 85% of cases (model sensitivity 72%, specificity 91%; AUC = 0.919).
Conclusion:
Complex dynamic interplay exists between the hip and SPPs. A cam deformity, acetabular undercoverage, and increased SPP angles are predictive of a hip symptomatic state. SPPs were significant to discriminate between participants and were important in combination with other hip deformities. Symptomatic patients can be effectively differentiated from asymptomatic volunteers based on predictive anatomic factors.
Femoroacetabular impingement (FAI) syndrome, a motion-related hip disorder with specific symptoms, clinical signs, and imaging findings, 19 originates from contact between the acetabulum and the proximal femur. Because not all hips with cam or pincer morphology are symptomatic32,33 or develop degenerative changes, 2 it is critical to distinguish between patients with FAI syndrome and healthy subjects whose osseous structure is merely abnormal. The hip joints are part of the bony pelvis that moves around the bicoxofemoral axis, leading to dynamic tilting in different functional situations. 47 This suggests the need to consider the relationship between hip disease or injury and individual spinopelvic interactions.
Early diagnosis and imaging of the relevant bony structure with adequate guidance for treatment are essential, because FAI syndrome has been associated with functional impairment, irreversible cartilage damage, and premature osteoarthritis (OA). 1 High-priority issues to define the natural history of FAI syndrome include establishing morphological factors to predict who will develop hip symptoms and establishing a precise definition of FAI syndrome. 19 Concurrently, other factors are increasingly recognized as contributors to the dynamic pathological process, among which spinopelvic parameters (SPPs) are considered to be fundamental indicators of pelvic alignment and sagittal function. 47
Several quantitative measurements for cam and pincer morphology have been proposed,34,45,52,53 but the α angle 42 and lateral center edge angle (LCEA) 53 are most commonly used. 2 For pelvic radiographs and other modalities, an α-angle threshold of 55° to 60° is generally used,3,42,49 although with important limitations,32,50 underlining the need for more research to validate the presence and interchangeability of a cam deformity diagnosis between different modalities. This is particularly challenging for the acetabulum, which has many variations on its hemispherical size, shape, and structure, as well as rim contour irregularities and orientation abnormalities.27,52 Again, the most appropriate measurements and accompanying threshold values remain to be defined. 32
SPPs such as pelvic incidence 29 (PI) have recently been associated with specific hip morphologic features13,23,35 and OA. 14 PI is a fixed individual angle regarded as a primary axis of spinopelvic sagittal balance. 47 Decreased PI has been associated with FAI morphology13,47; however, other studies reported opposite observations, namely that increased PI is associated with cam morphology.18,39 Interestingly, increased prevalence of OA has also been linked with higher PI. 14 Therefore, it is still unknown whether and how SPPs influence hip disease and injury.
Regarding diagnostic methods, it is accepted that further research is needed to provide insight on the utility of imaging in this setting. 19 Conventional radiographs have been tested in different views9,53; however, characterization of the hip is more accurate with computed tomography (CT) and magnetic resonance imaging (MRI). 32 In fact, cross-sectional imaging provides a 3-dimensional (3D) perspective of the hip bone,6,59,60 which allows for a more precise definition of the nature, location, and extent of morphological abnormalities.6,50 Accurate assessment of the hip with quantitative imaging is critical for early diagnosis, providing a means for standardization and reducing variability.19,34
This study’s purpose is to evaluate the morphological distinction between patients with hip pain and asymptomatic volunteers 50 by using semiautomated 3D MRI. Additionally, our study focuses on the application of this morphometric analysis for evaluating FAI and spinopelvic relations, which has not been previously described.
Using a 3D MRI technique, this study aims to (A) provide hip and spinopelvic normative measurements in asymptomatic volunteers and symptomatic patients, (B) objectively compare pathoanatomic characteristics in these populations, and (C) develop potential distinguishing threshold values to differentiate these populations by ascertaining which parameters are most useful and how they should be used to achieve best results.
Methods
Study Population
This prospective case-control study was approved by the institutional review board (nr.61/2014/CEFCM). All individuals signed informed consent. Consecutive asymptomatic volunteers and symptomatic patients undergoing hip surgery were enrolled. All symptomatic patients were identified and matched for age and sex in a 1:2 enrollment ratio with a group of asymptomatic volunteers (Figure 1).
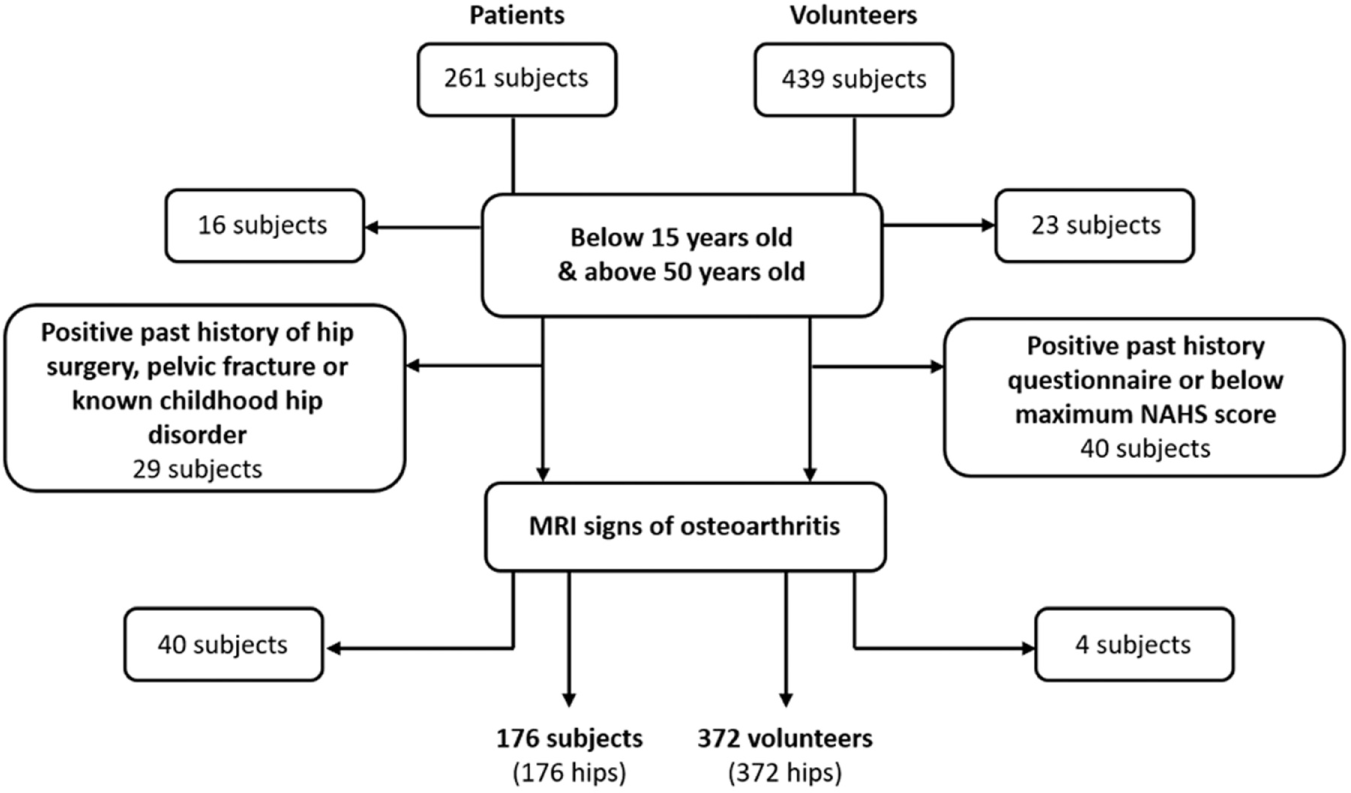
Flow of subjects from cohort inclusion to the final study population.
The asymptomatic volunteer group was recruited among consecutive adult patients undergoing MRI at multiple centers from our health group for abdominal or urogenital indications. All eligible participants completed the nonarthritic hip score questionnaire 8 and another questionnaire regarding demographics and clinical history (including current or past hip or groin pain, orthopaedic conditions, childhood hip disease and/or hip trauma). Exclusion criteria included (1) subjects older than 50 and younger than 15 years; (2) all subjects with less than the maximum possible nonarthritic hip score (100); (3) positive answer to 1 or more of the other hip-related questions; (4) MRI signs of OA or other hip pathologies (defined as the presence of at least 1 of the following findings: joint-space narrowing, osteophytes, subchondral bone changes [including sclerosis or cysts], fracture, posttraumatic deformity, Perthes disease, osteonecrosis, slipped femoral epiphysis).
The symptomatic patient group consisted of individuals who were referred for MRI of the hip by orthopaedic surgeons between 2012 and 2017 and with preliminary surgical indication. Inclusion criteria were age from 15 to 50 years, typical symptoms (persistent groin pain for >3 months in duration), and clinical signs (positive impingement test) 19 of FAI. Exclusion criteria were the same as for the asymptomatic group concerning criteria 1 and 4.
MRI and 3D Model
MRI was performed with the patients in standard supine position with legs parallel in neutral rotation. The pelvis was reconstructed with 1-mm-thick slices from the anterosuperior iliac spine to the lesser trochanters.
The assessment used a 3-T system (Magnetom Verio; Siemens Healthcare); an 8-channel, body matrix, phased-array surface coil (which was placed over the hip of the patient); and a 6-channel, spine matrix coil (which was integrated in the patient examination table). As part of the routine MRI protocol in patients, a 3D data set of the whole pelvis was obtained with a sequence consisting of axial water excitation true fast imaging with steady-state precession (this was the only sequence performed in the asymptomatic volunteer group).
Image Analysis
Images were uploaded for analysis and semiautomatically segmented by use of Articulis (Clinical Graphics), which was previously validated for reliability and accuracy. 48 One musculoskeletal radiologist (V.V.M., 10 years of experience) certified that each segmentation contained all osseous contours and accurate MRI measurements.
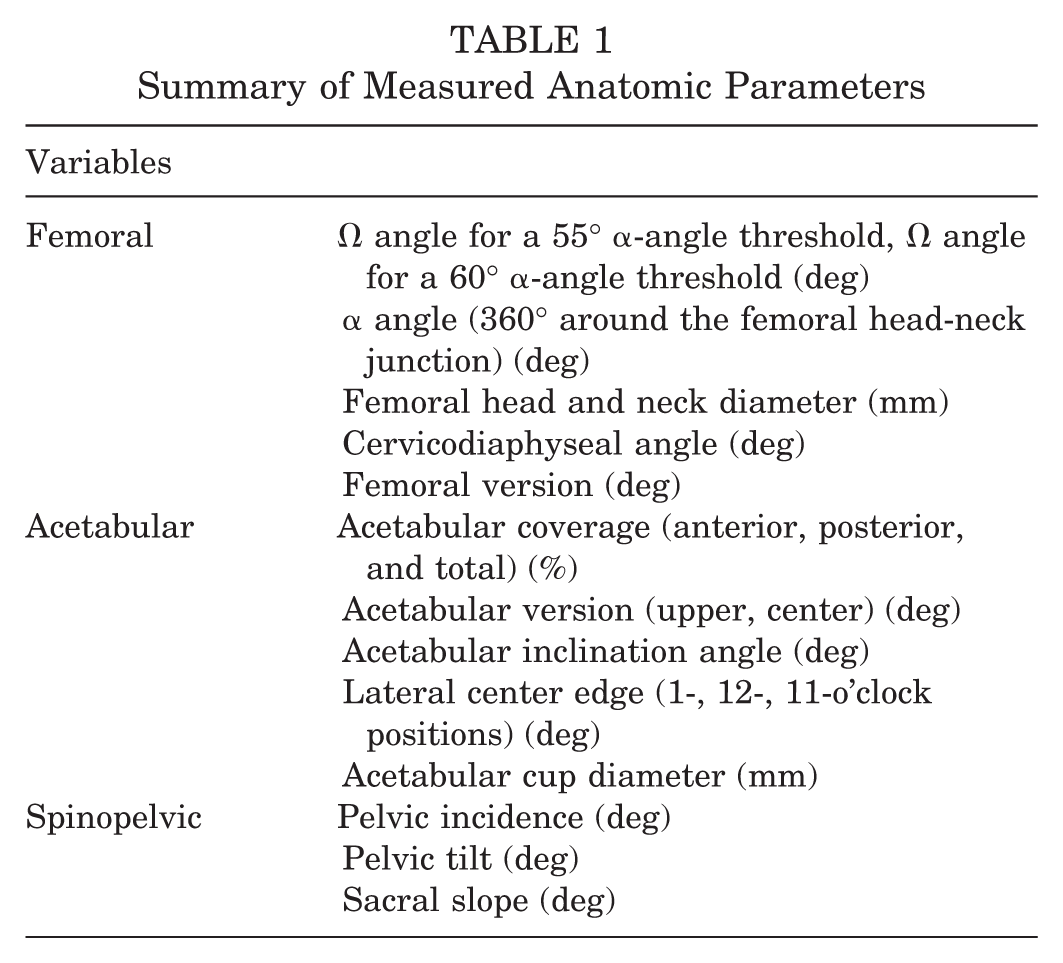
The full workflow diagram for automated extraction of the 3D bone morphology of the hip and measurements involved (1) an active shape, model-based, bone segmentation pipeline 59 construction of a 3D local coordinate system; (2) automatic MRI reformation; and (3) variable measurements according to a previously published protocol 32 (Table 1).
Summary of Measured Anatomic Parameters
Femoral Parameters
To determine the Ω angle, we calculated the clockwise 360° α angle (according to Nötzli et al 42 ) by using a regression sphere fit of the femoral head-neck (FHN) junction. Next, projecting the 360° α angle in a polar plot, we determined the Ω angle34,45 (Figure 2). The Ω angle is formed by 2 lines intersecting the center of the femoral neck at the level of the head-neck junction. The most posterior line posteriorly intersects the point at which the α angle begins to be abnormal beyond a best-fitting circle and the anterior line at the point where the α angle returns to normal. Femoral version, head-neck femoral diameters, and the cervicodiaphyseal angle were measured semiautomatically. Malversion was defined as abnormal if less than 10° or more than 25°. 30
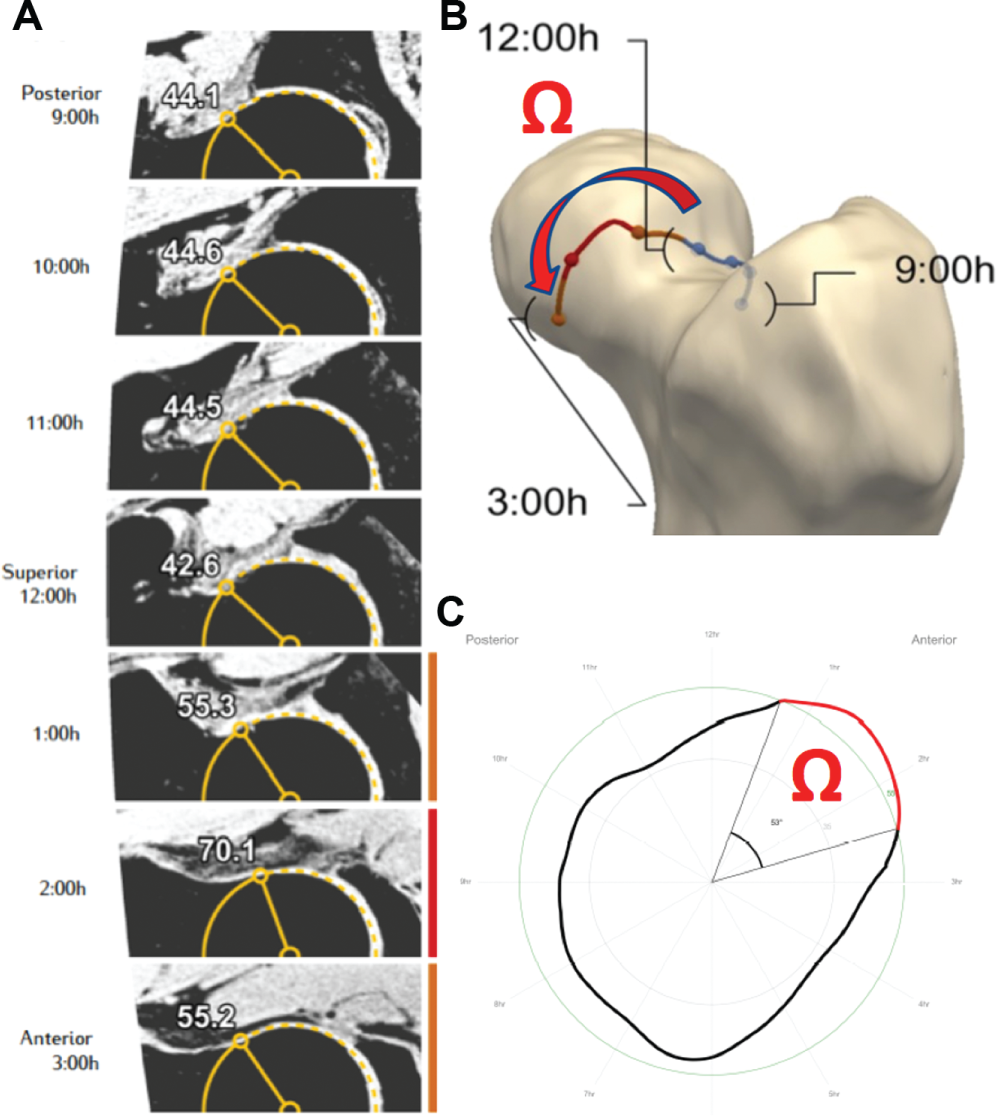
(A) α-angle measurements made at different points around the femoral head-neck junction starting at 9-o’clock (posterior); 10-, 11-, and 12-o’clock (superior); and 1-, 2-, and 3-o’clock (anterior). (B) 3D model representing the radial extension of the cam deformity (curved arrow corresponding to the Ω angle). (C) Polar plot of the 360° α angle, representing the Ω angle (red symbol) for an α-angle threshold of 55°. The red line represents increased α angles for a given threshold.
Cam-type morphology was defined as an α angle greater than 55° at any location around the femoral neck, 42 although we considered additional thresholds (namely 65° and 60°).3,49
Acetabular Parameters
Acetabular inclination or sourcil angle (ACinc) and version at the center and upper hemisphere (center and upper ACvers) were derived from the coordinate frame by the software comparing it with the anterior pelvic plane (APP). 30 Acetabular craniocaudal coverage (ACcov) was calculated and determined as a percentage of the femoral head surface. 32
The LCEA was measured between the plane of the y-axis of the pelvis and a line from the center of a regression sphere in the acetabulum to the osseous acetabular rim, performed in 30° steps from the 1- to 11-o’clock positions. 32
Global pincer-type morphology was considered positive when we observed any of the following: (1) acetabular depth 3 mm or more (coxa profunda), (2) LCEA greater than 39°, (3) center ACvers less than 10°, (4) upper ACvers less than 0° (acetabular retroversion, which also defined the focal pincer subgroup). Acetabular dysplasia was defined as LCEA 20° or less; borderline dysplasia was defined as LCEA more than 20° and less than or equal to 25°.31,40,52
Pelvic Parameters
The measurements of interest included PI, sacral slope (SS), and spinopelvic tilt (SPT) according to a previously described method. 29 After the APP was established, the left and right hip joint centers were identified in all planes and aligned by tilting the pelvis in multiplanar reformats (a line was traced to join the 2 centers and establish the bicoxofemoral axis). PI and SS were determined, and SPT was calculated as PI minus SS (Figure 3).
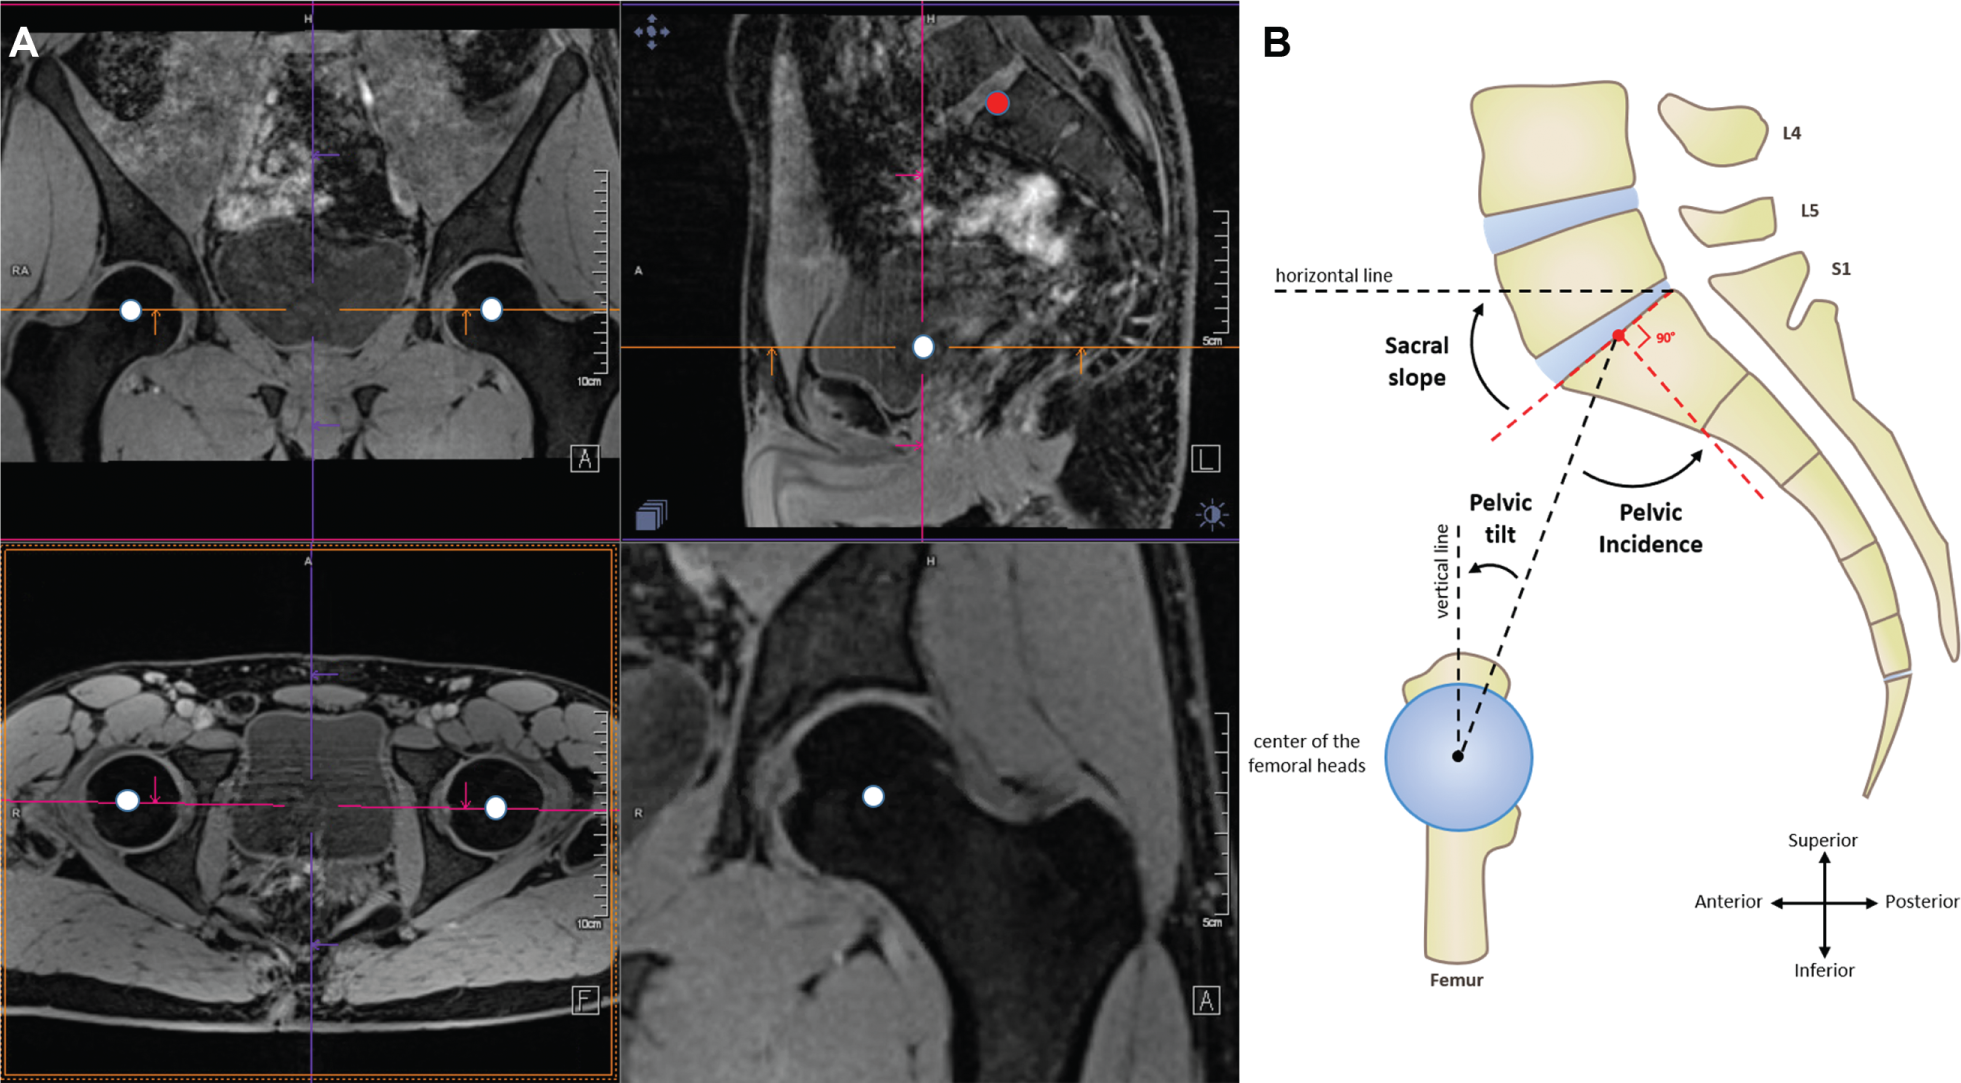
(A) The left hip joint center and right hip joint center (white dots) were located and aligned to determine the bicoxofemoral axis as a single point in the sagittal plane (upper right image; white dot). This point (representing the bicoxofemoral axis) was then connected to the center of the sacral endplate (shaded dot), and additional lines were joined to measure the spinopelvic tilt, sacral slope, and pelvic incidence. (B) Schematic drawing of measurements of spinopelvic parameters.
Statistical Analysis
For all parameters, descriptive statistics were calculated. Quantitative parameters are described by their mean and standard deviation (SD). Qualitative parameters are described in numbers and percentages. For the mean comparisons, the Student t test was implemented to compare quantitative variables (if test conditions were not met, a nonparametric method was used, namely Mann-Whitney or Wilcoxon test). To evaluate correlation between 2 quantitative parameters, Pearson or Spearman coefficients were computed. All morphological measurements associated with the symptomatic state in the receiver operating characteristic (ROC) curve analysis and univariate analysis with P < .1 were included in a multivariate logistic regression, with backward selection using the likelihood ratio test to evaluate associations linking the symptomatic state to other variables.
Intertechnique (manual measurements and semiautomated analysis), interobserver, and intraobserver coefficients were identified. The data were concealed, and some anatomic parameters (SS, SPT, PI, LCEA at 12-o’clock, sourcil angle, and α angle 1:30-o’clock) were measured by 2 observers in a subset of 50 symptomatic patients, with 1 observer performing a second set of readings 2 weeks after the first. A P value of .05 was considered statistically significant for all analyses. Statistical analyses were performed by use of dedicated software (SPSS Statistics Version 24; IBM).
Results
Population and Overall Morphologic Findings
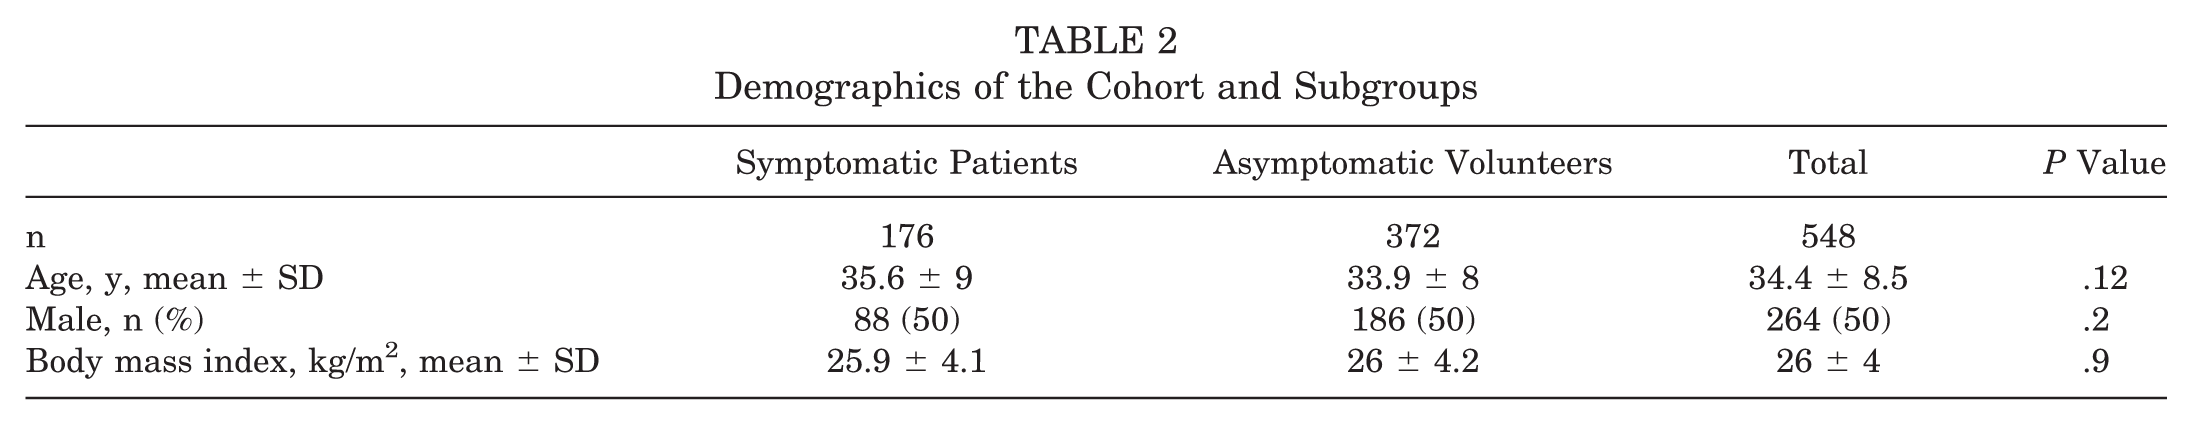
The study population consisted of 548 individuals (Table 2): 176 symptomatic patients and 372 weight-, age-, and sex-matched asymptomatic volunteers (P = .5). The patient group contained 88 men (mean age, 34.5 years; range, 18-50 years) and 88 women (mean age, 36.9 years; range, 19-50 years). The volunteer group contained 186 men (mean age, 33.8 years; range, 17-50 years) and 186 women (mean age, 34.0 years; range, 16-50 years).
Demographics of the Cohort and Subgroups
Cam morphology prevalence varied between 17% and 71% in asymptomatic volunteers and between 47% and 100% in symptomatic patients according to different α-angle thresholds (65° and 55°, respectively). Conversely, 20% of all asymptomatic volunteers and 32% of symptomatic patients had pincer-type morphology (coxa profunda, 19% vs 27%; LCEA >39°, 12% vs 29%; acetabular retroversion, 3% vs 8%, respectively). About one-third of symptomatic patients had some degree of acetabular undercoverage (borderline dysplasia in 74% of those patients) in contrast to 2.6% in asymptomatic volunteers (Figure 4).
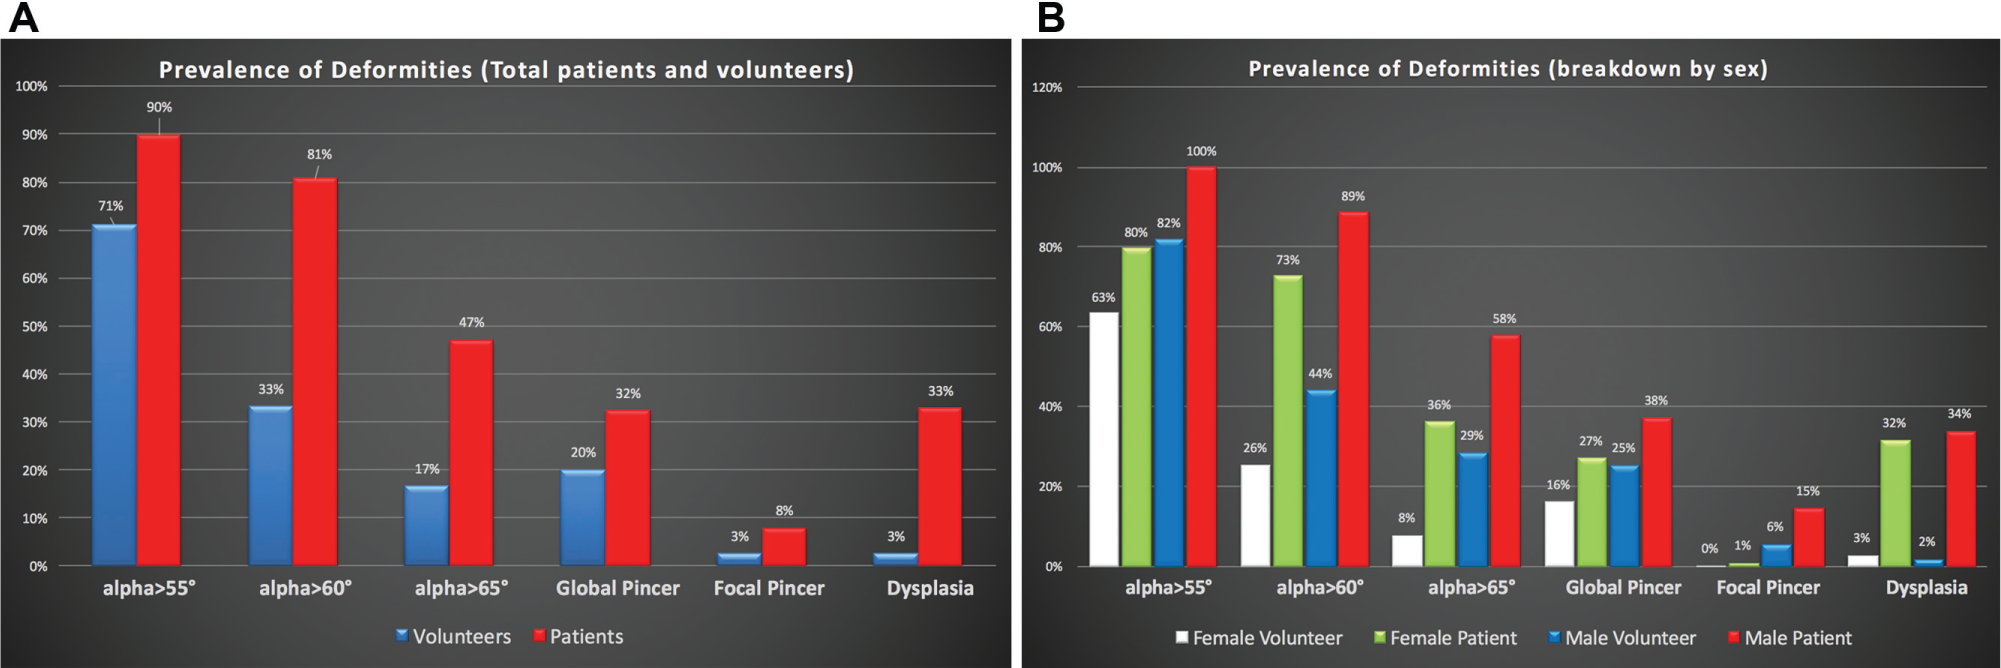
(A) Prevalence of cam morphology (considering α-angle thresholds of 55°, 60°, and 65°) and pincer morphology (global and focal). Breakdown by categories of abnormality (percentage of total asymptomatic volunteers or symptomatic patients). (B) Prevalence of cam morphology (considering α-angle thresholds of 55°, 60°, and 65°), pincer morphology (global and focal), and dysplasia. Breakdown by sex and categories of abnormality (percentage of total symptomatic patients and asymptomatic volunteers).
Very good intertechnique, interobserver, and intraobserver coefficients were identified (0.9-0.95, P < .001).
Femoral Parameters
Mean α angles were largest at the anterosuperior position (Table 3, Figure 5). The highest mean values of α angle in symptomatic patients were 66° ± 10° at 1:30-o’clock and 63.4° ± 9.6° at 2-o’clock; the highest mean value for the Ω angle was 66.4° ± 32.2° (considering a 55° threshold of the α angle). At the superior quadrants, α angles were significantly larger in symptomatic patients than in asymptomatic volunteers (Figure 5). The α angles in asymptomatic volunteers were 56.6° ± 7.1° at 1:30-o’clock and 53.8° ± 5.7° at 2-o’clock (P = .001, symptomatic patients vs asymptomatic volunteers). The magnitude of the mean differences of α angle was higher between 1- and 2-o’clock (symptomatic patients’ α angles were 8° to 10° higher than those in asymptomatic volunteers). Significant positive correlations (rho = 0.5-0.8; P < .05) were seen between Ω-angle and α-angle measurements at the anterosuperior quadrants, both in symptomatic patients and in asymptomatic volunteers (increasing values of the α angle significantly corresponded to higher values of the Ω angle).
Femoral Side Morphometric Quantitative Measurements
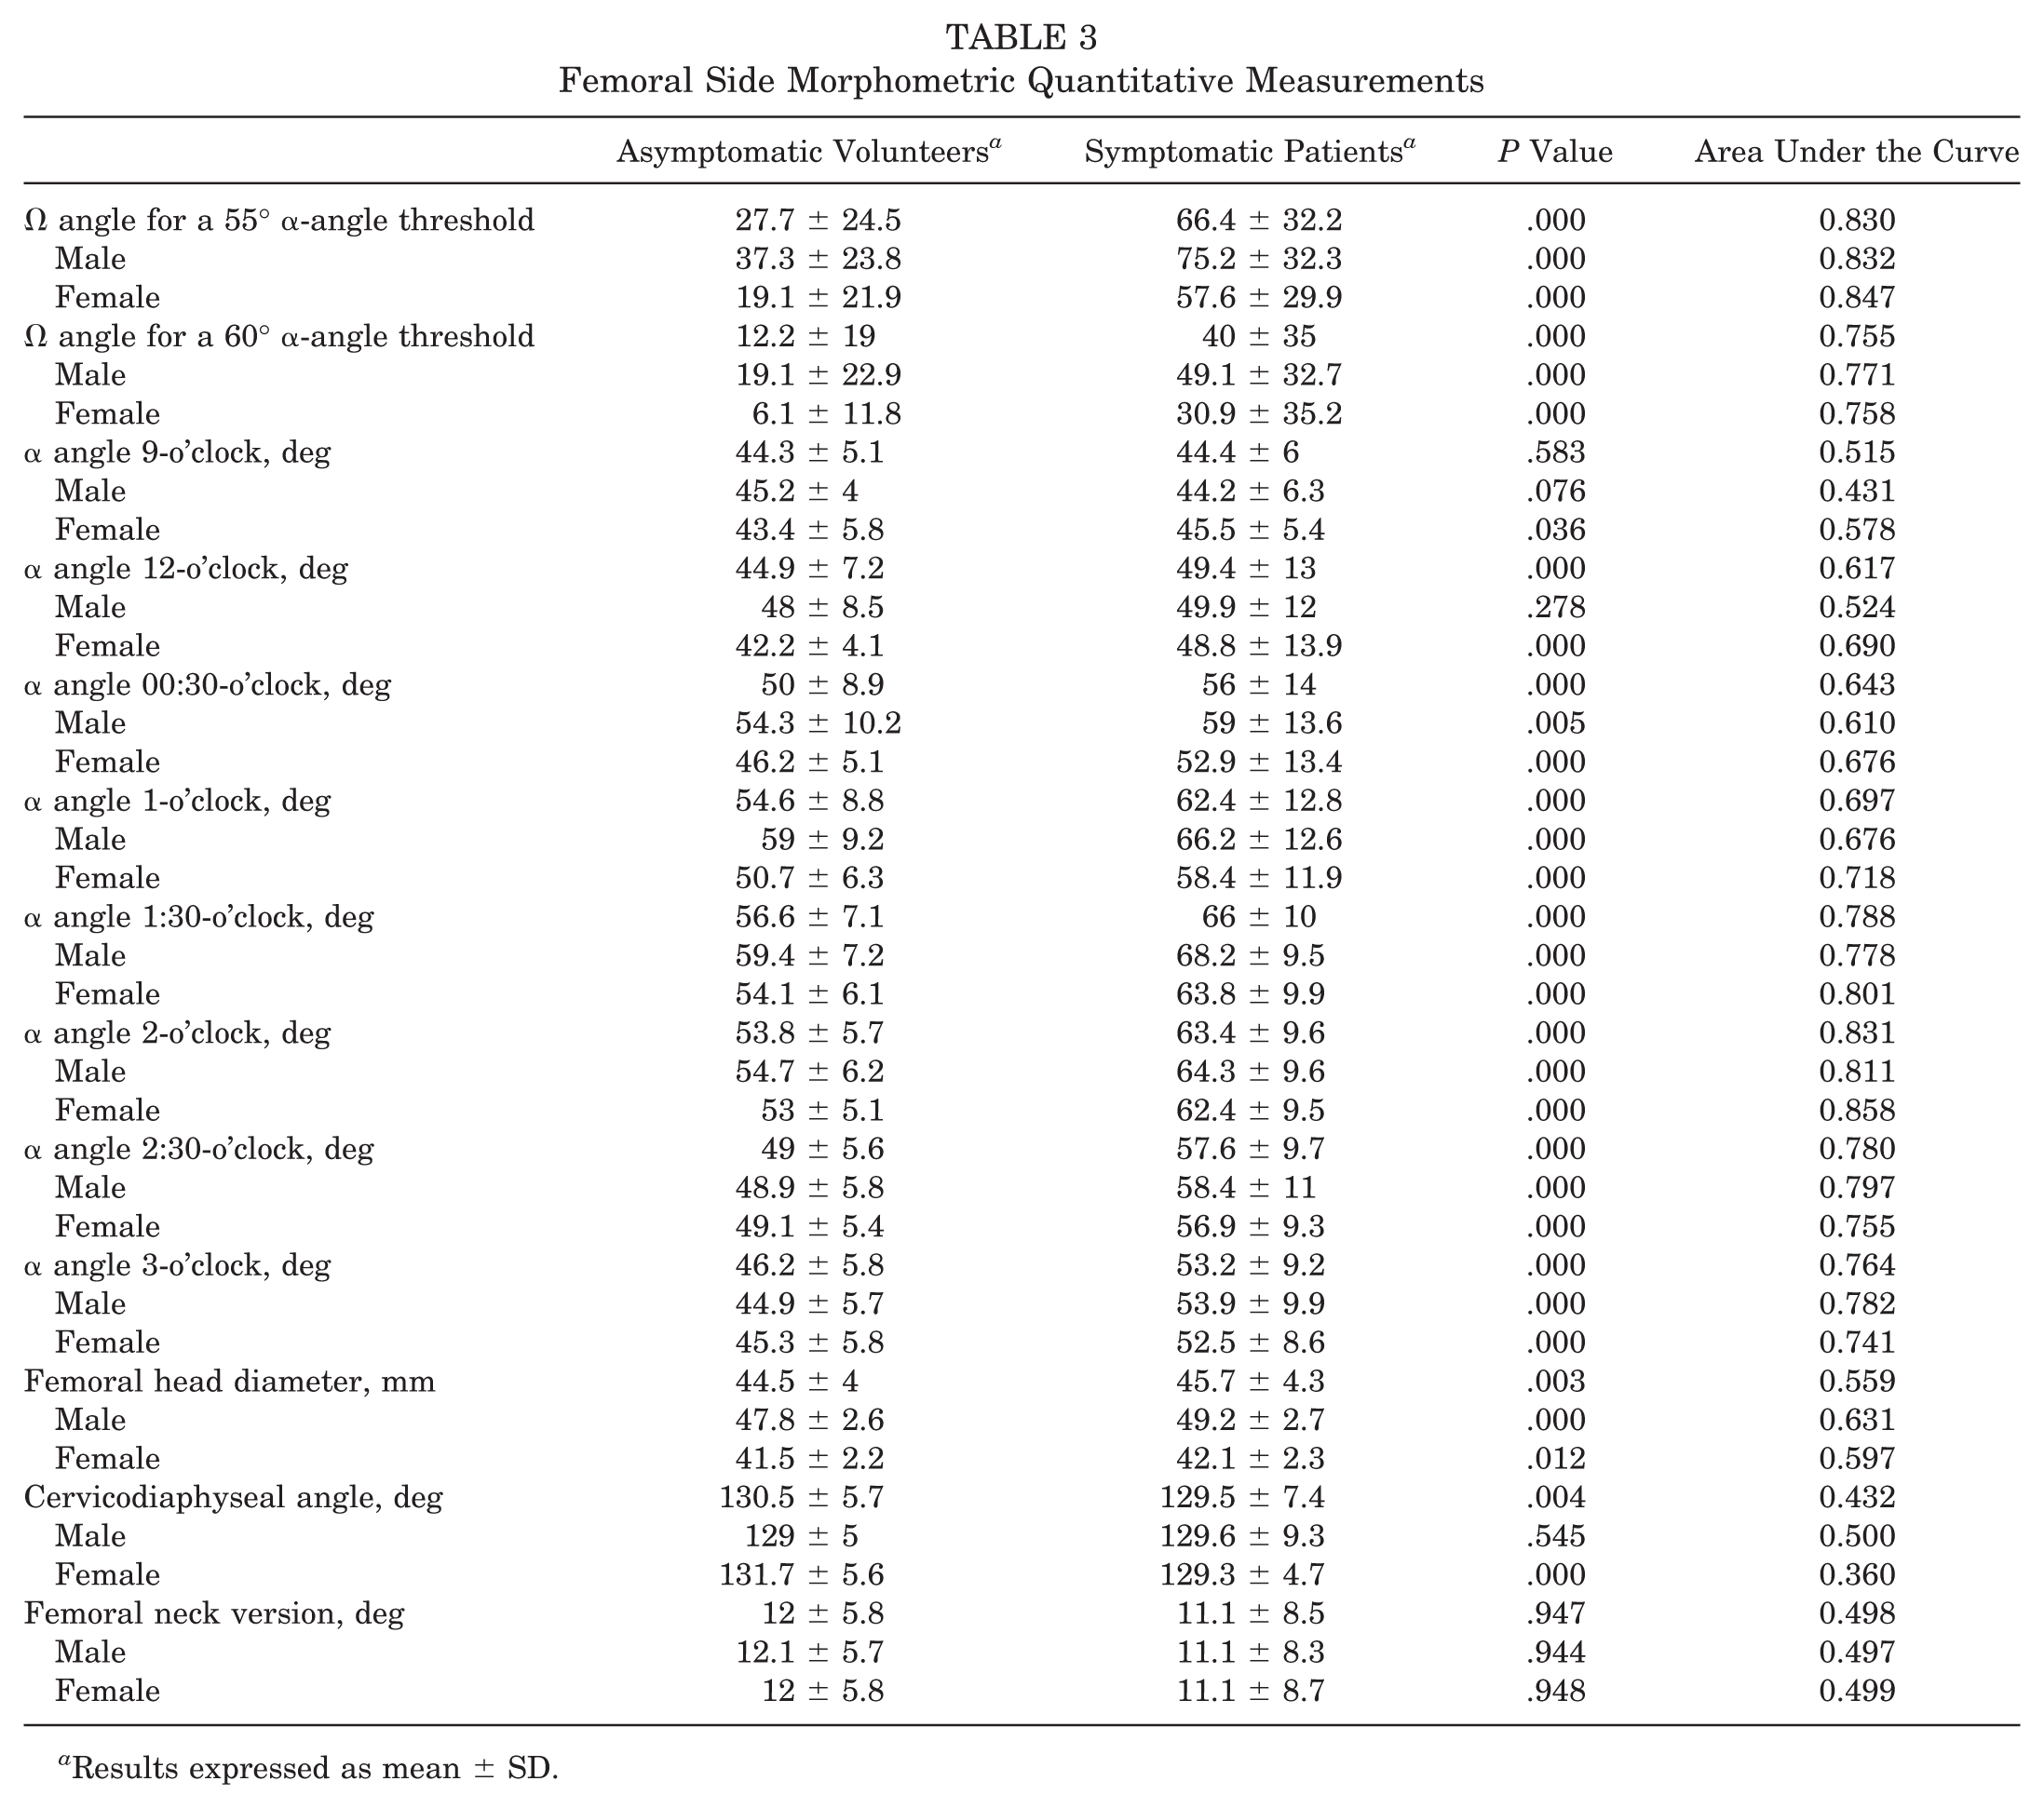
Results expressed as mean ± SD.
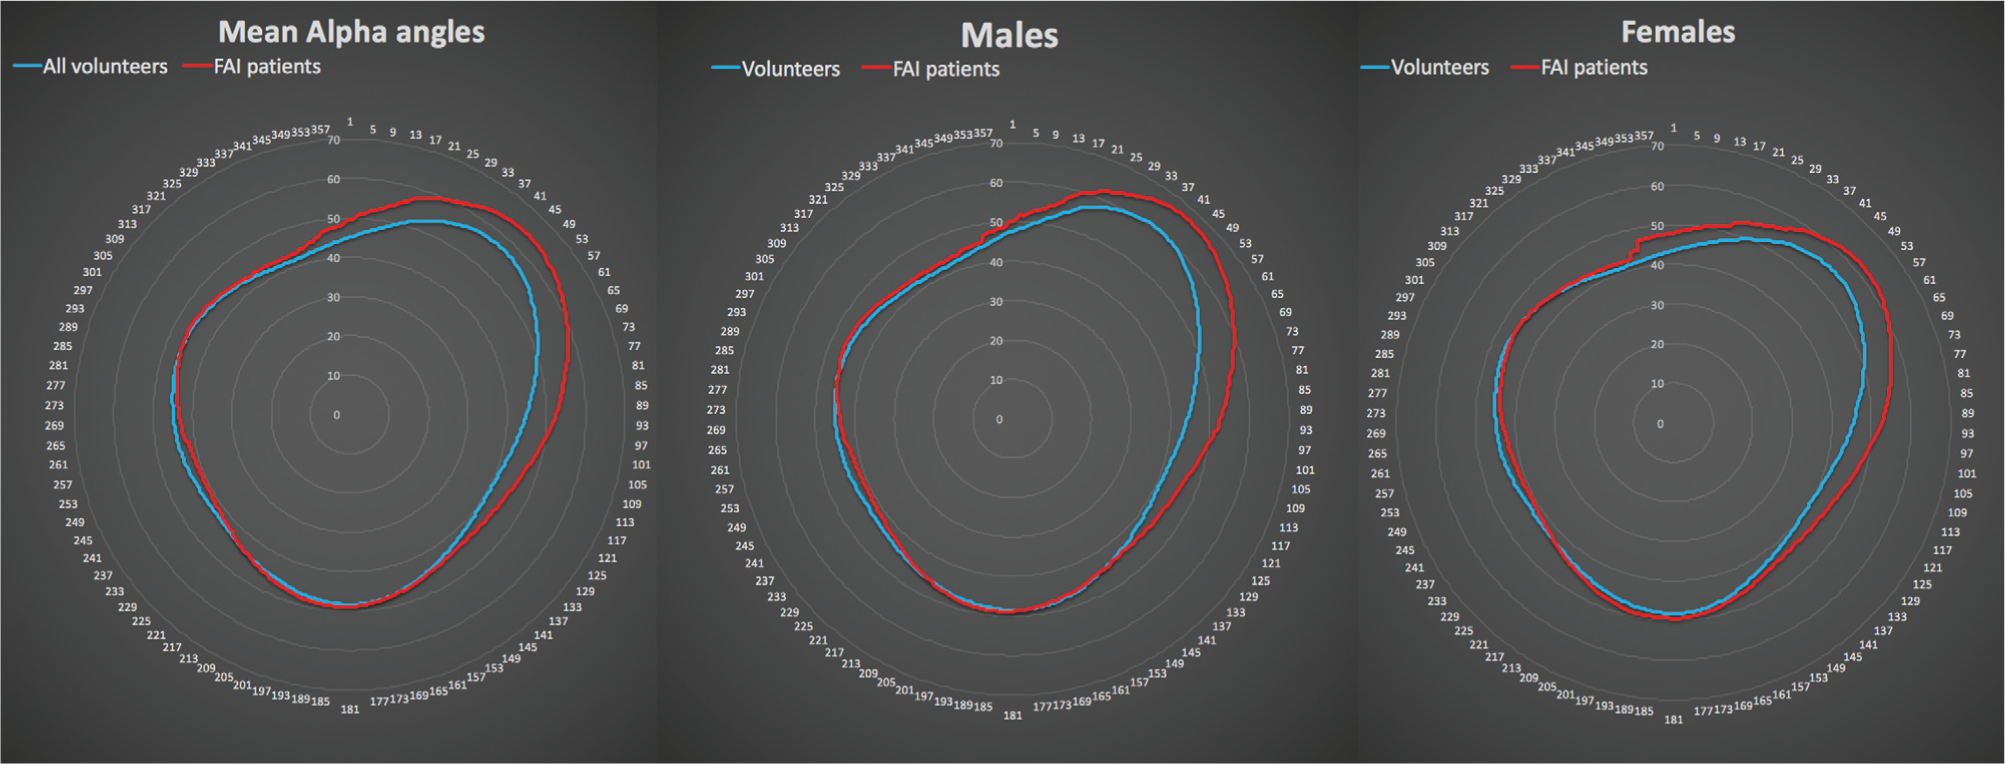
Radar map of mean circumferential α angles at every degree of the femoral head-neck junction. Left, all participants (blue line corresponds to asymptomatic volunteers; red line corresponds to symptomatic patients). Middle, male subjects only. Right, female subjects only. 1 corresponds to 12-o’clock position; 89 corresponds to 3-o’clock position.
Mean cam magnitude (Table 4), defined by the radial extension of the deformity, was significantly greater in symptomatic patients than in asymptomatic volunteers (from 0:30- to 2:40-o’clock vs from 0:56- to 1:52-o’clock, respectively; P = .01). The mean epicenter of the cam deformity was similarly located in symptomatic patients and asymptomatic volunteers (around 1:30-o’clock; P = .5); however, it was located significantly more superiorly in the anterosuperior quadrant for men compared with women, in both groups (1:24- vs 1:42-o’clock in symptomatic patients; P < .001). The mean angular range of radial extension of cam morphology was translated by a mean Ω angle. The Ω angle for a 55° α-angle threshold was 66° ± 25° and 27° ± 15° (P = .03) in symptomatic patients and asymptomatic volunteers, respectively.
Asymptomatic Volunteers’ and Symptomatic Patients’ Mean Epicenter Position and Mean α Angle at That Point a
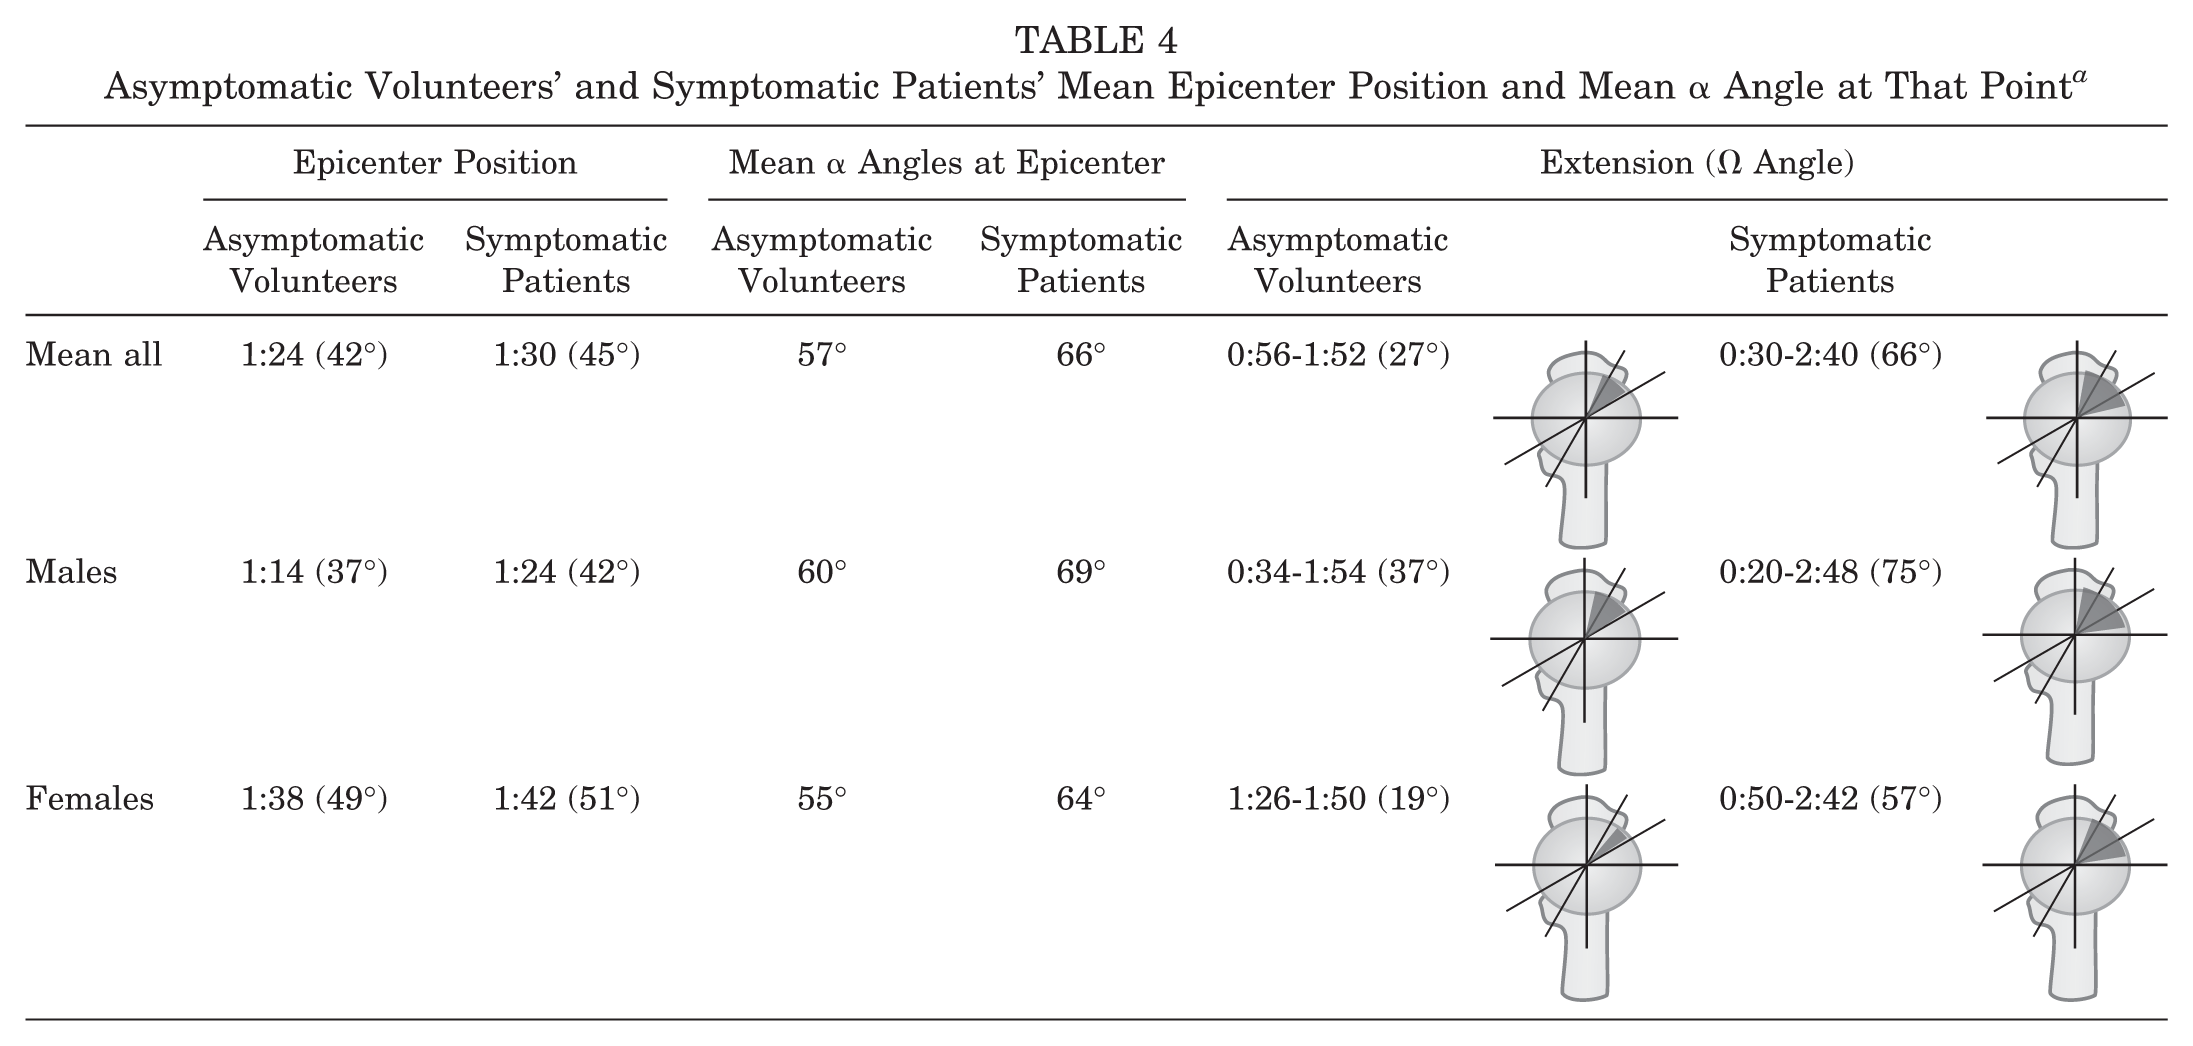
The mean epicenter position is the point of the highest α angle; the position is registered in clockface position and corresponding degree location in parentheses (considering 0° the 12-o’clock position and 90° the 3-o’clock position). The Extension column provides the total mean range of cam deformity (radial extension); the values represent range in clockface positions and corresponding angular extension (Ω angle in parentheses).
The prevalence of decreased femoral version and increased femoral version was 15% and 25%, respectively, in the symptomatic patient group, although it was not significantly different for asymptomatic volunteers (P = .1).
Acetabular and Spinopelvic Parameters
Symptomatic patients had significantly less total acetabular coverage than asymptomatic volunteers, resulting in lower mean total ACcov (70.6% ± 5.2% vs 74.5% ± 4.9%, respectively), higher ACinc (7.3° ± 5.1° vs 2.9° ± 5.4°), and lower LCEA at 12-o’clock (32.7° ± 5.7° vs 35.8° ± 6.8°). Other acetabular parameters revealed significant differences although with lower mean differences (Table 5).
Acetabular Side and Spinopelvic Morphometric Quantitative Measurements a
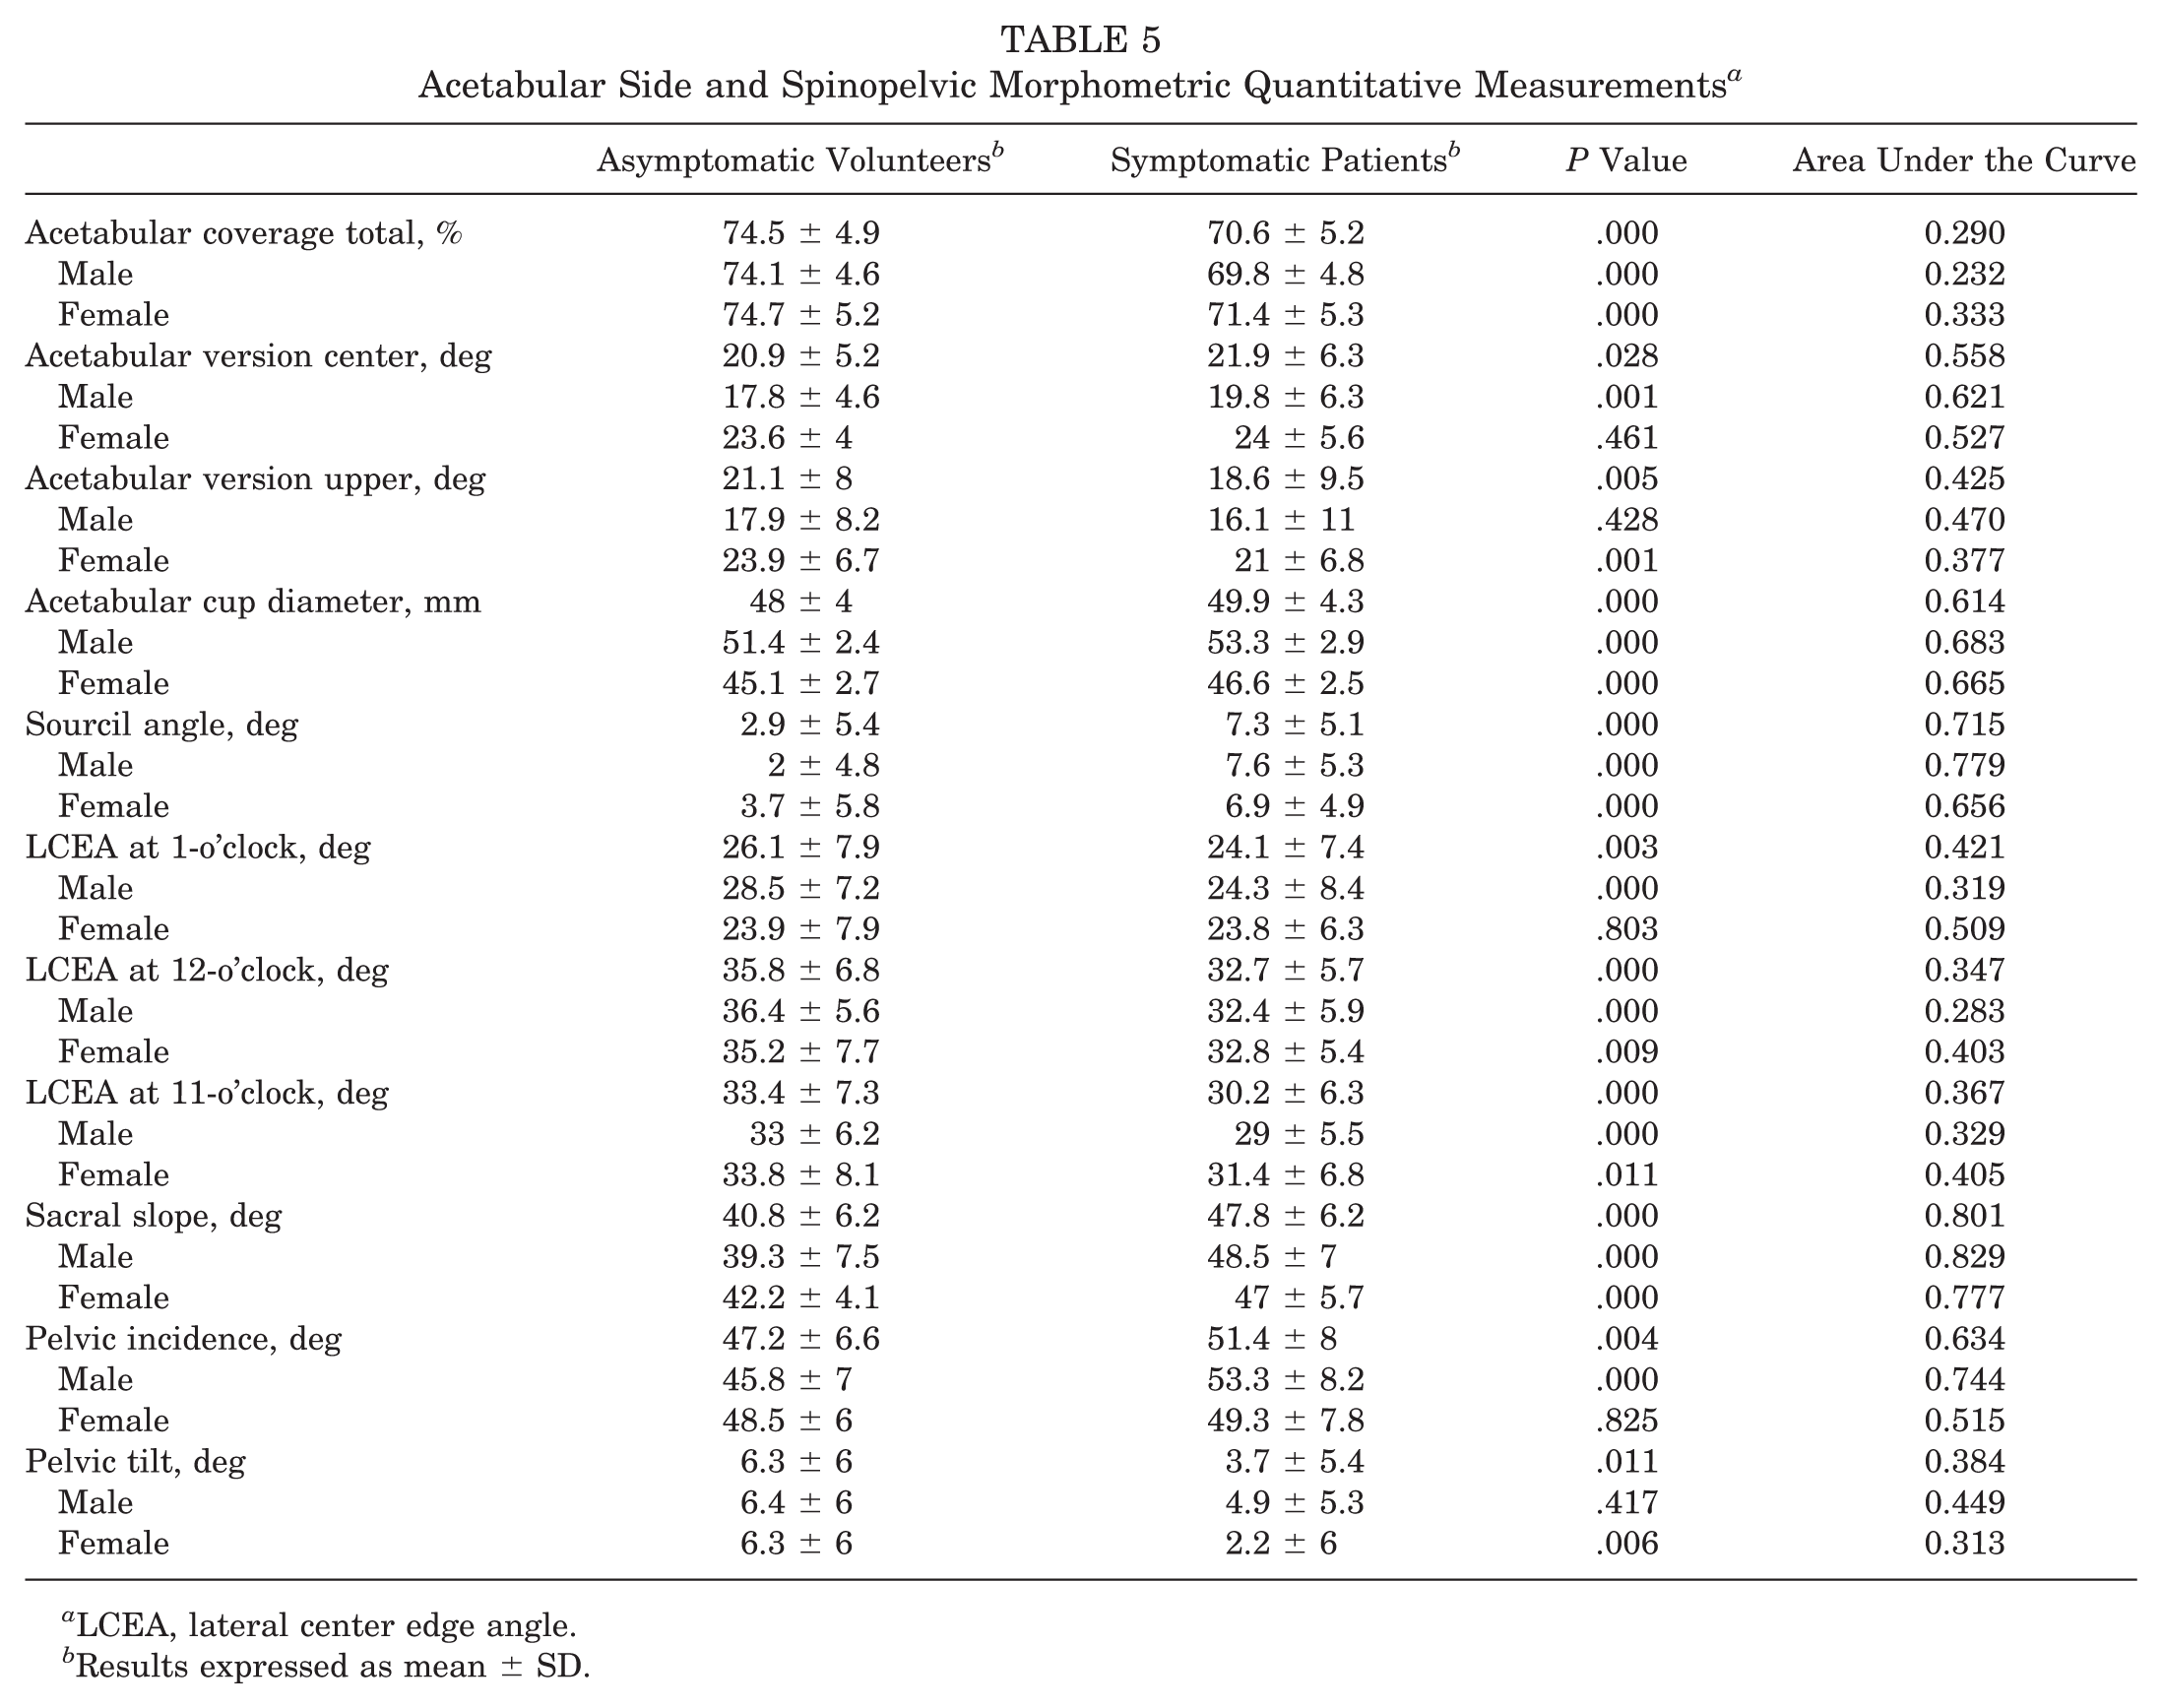
LCEA, lateral center edge angle.
Results expressed as mean ± SD.
Concerning SPPs, symptomatic patients had significantly more anterior pelvic tilt resulting in higher SS (40.8° ± 6.2° vs 47.8° ± 6.2°, respectively; P < .000) and higher PI (47.2° ± 6.6° vs 51.4° ± 8°, respectively; P = .004).
PI and SS weakly correlated with upper acetabular anteversion (rho = −0.3 and −0.25, respectively; P = .04) and also with α angle at 1:30- and 2-o’clock (rho = 0.3/0.35 and 0.25/0.3, respectively; P = .04).
On the subgroup analysis, symptomatic hips with cam morphology had a greater amount of PI and SS (52° ± 8° and 48° ± 6°; P = .000) compared with individuals with asymptomatic cam morphology (45° ± 6° and 41° ± 5°) and controls, defined as asymptomatic subjects without cam morphology (48° ± 6° and 41° ± 7°). Pelvic tilt was only different between the control and cam groups (Table 6).
Spinopelvic Parameters for the Whole Cohort and as Per Group
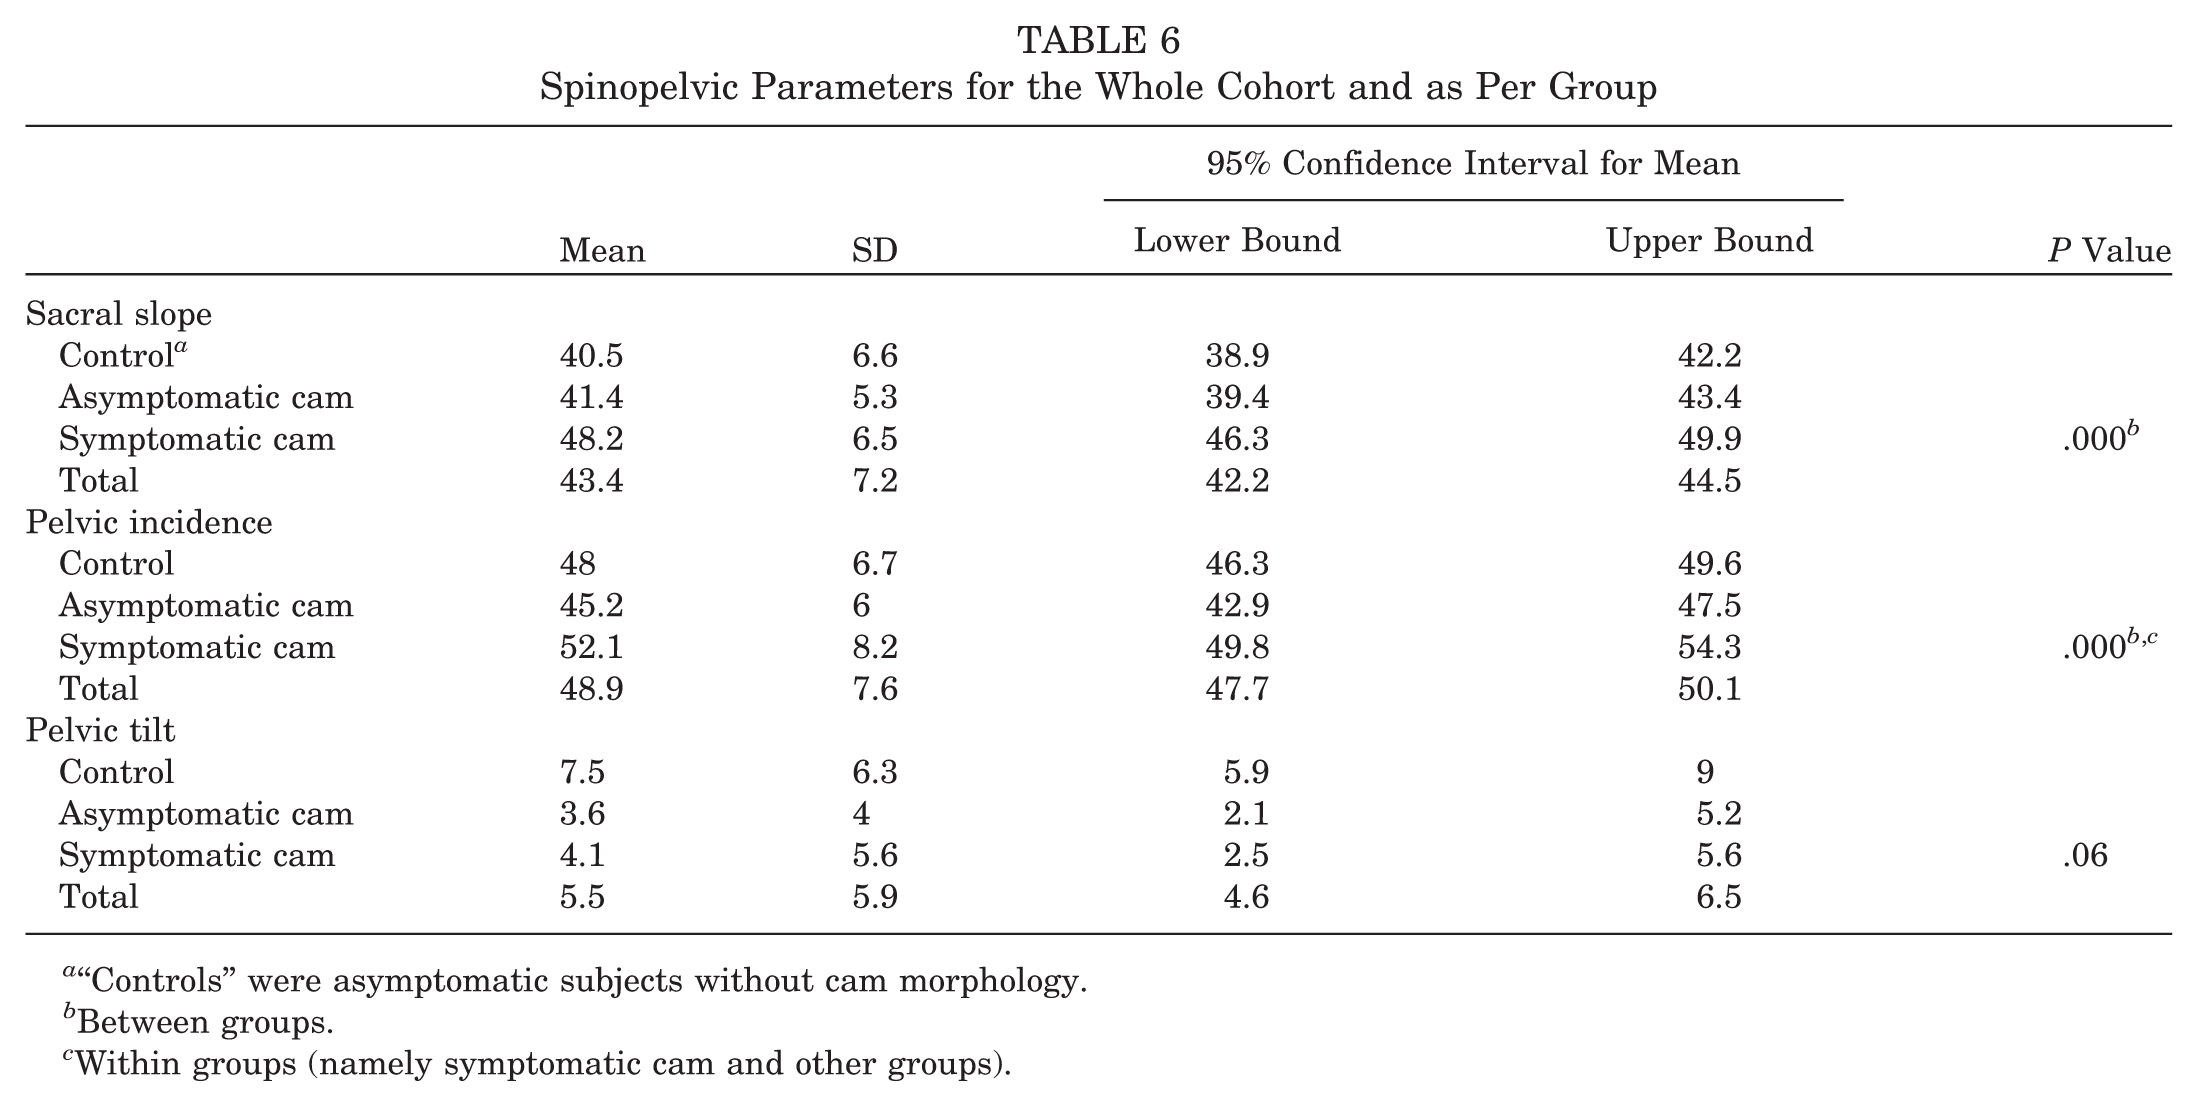
“Controls” were asymptomatic subjects without cam morphology.
Between groups.
Within groups (namely symptomatic cam and other groups).
ROC Curve Analysis
ROC curve analysis showed that discrimination between symptomatic patients and asymptomatic volunteers was better achieved with Ω angle, α angle at 2-o’clock, sacral slope, and, to a lesser extent, ACinc, α angle at 2:30-o’clock, and α angle at 3-o’clock (Tables 3 and 5, Figure 6). The largest area under the curve (AUC) was obtained for femoral variables, specifically for the α angle at 2-o’clock position and the Ω angle (AUC = 0.831 and 0.830, respectively) and also for sacral slope (AUC = 0.801). A 55° α-angle threshold at 2-o’clock resulted in a sensitivity of 88% and a specificity of 70%. When the α-angle threshold value was increased to 58° to 60°, a sensitivity of 75% to 60% and specificity of 80% to 84% were obtained.
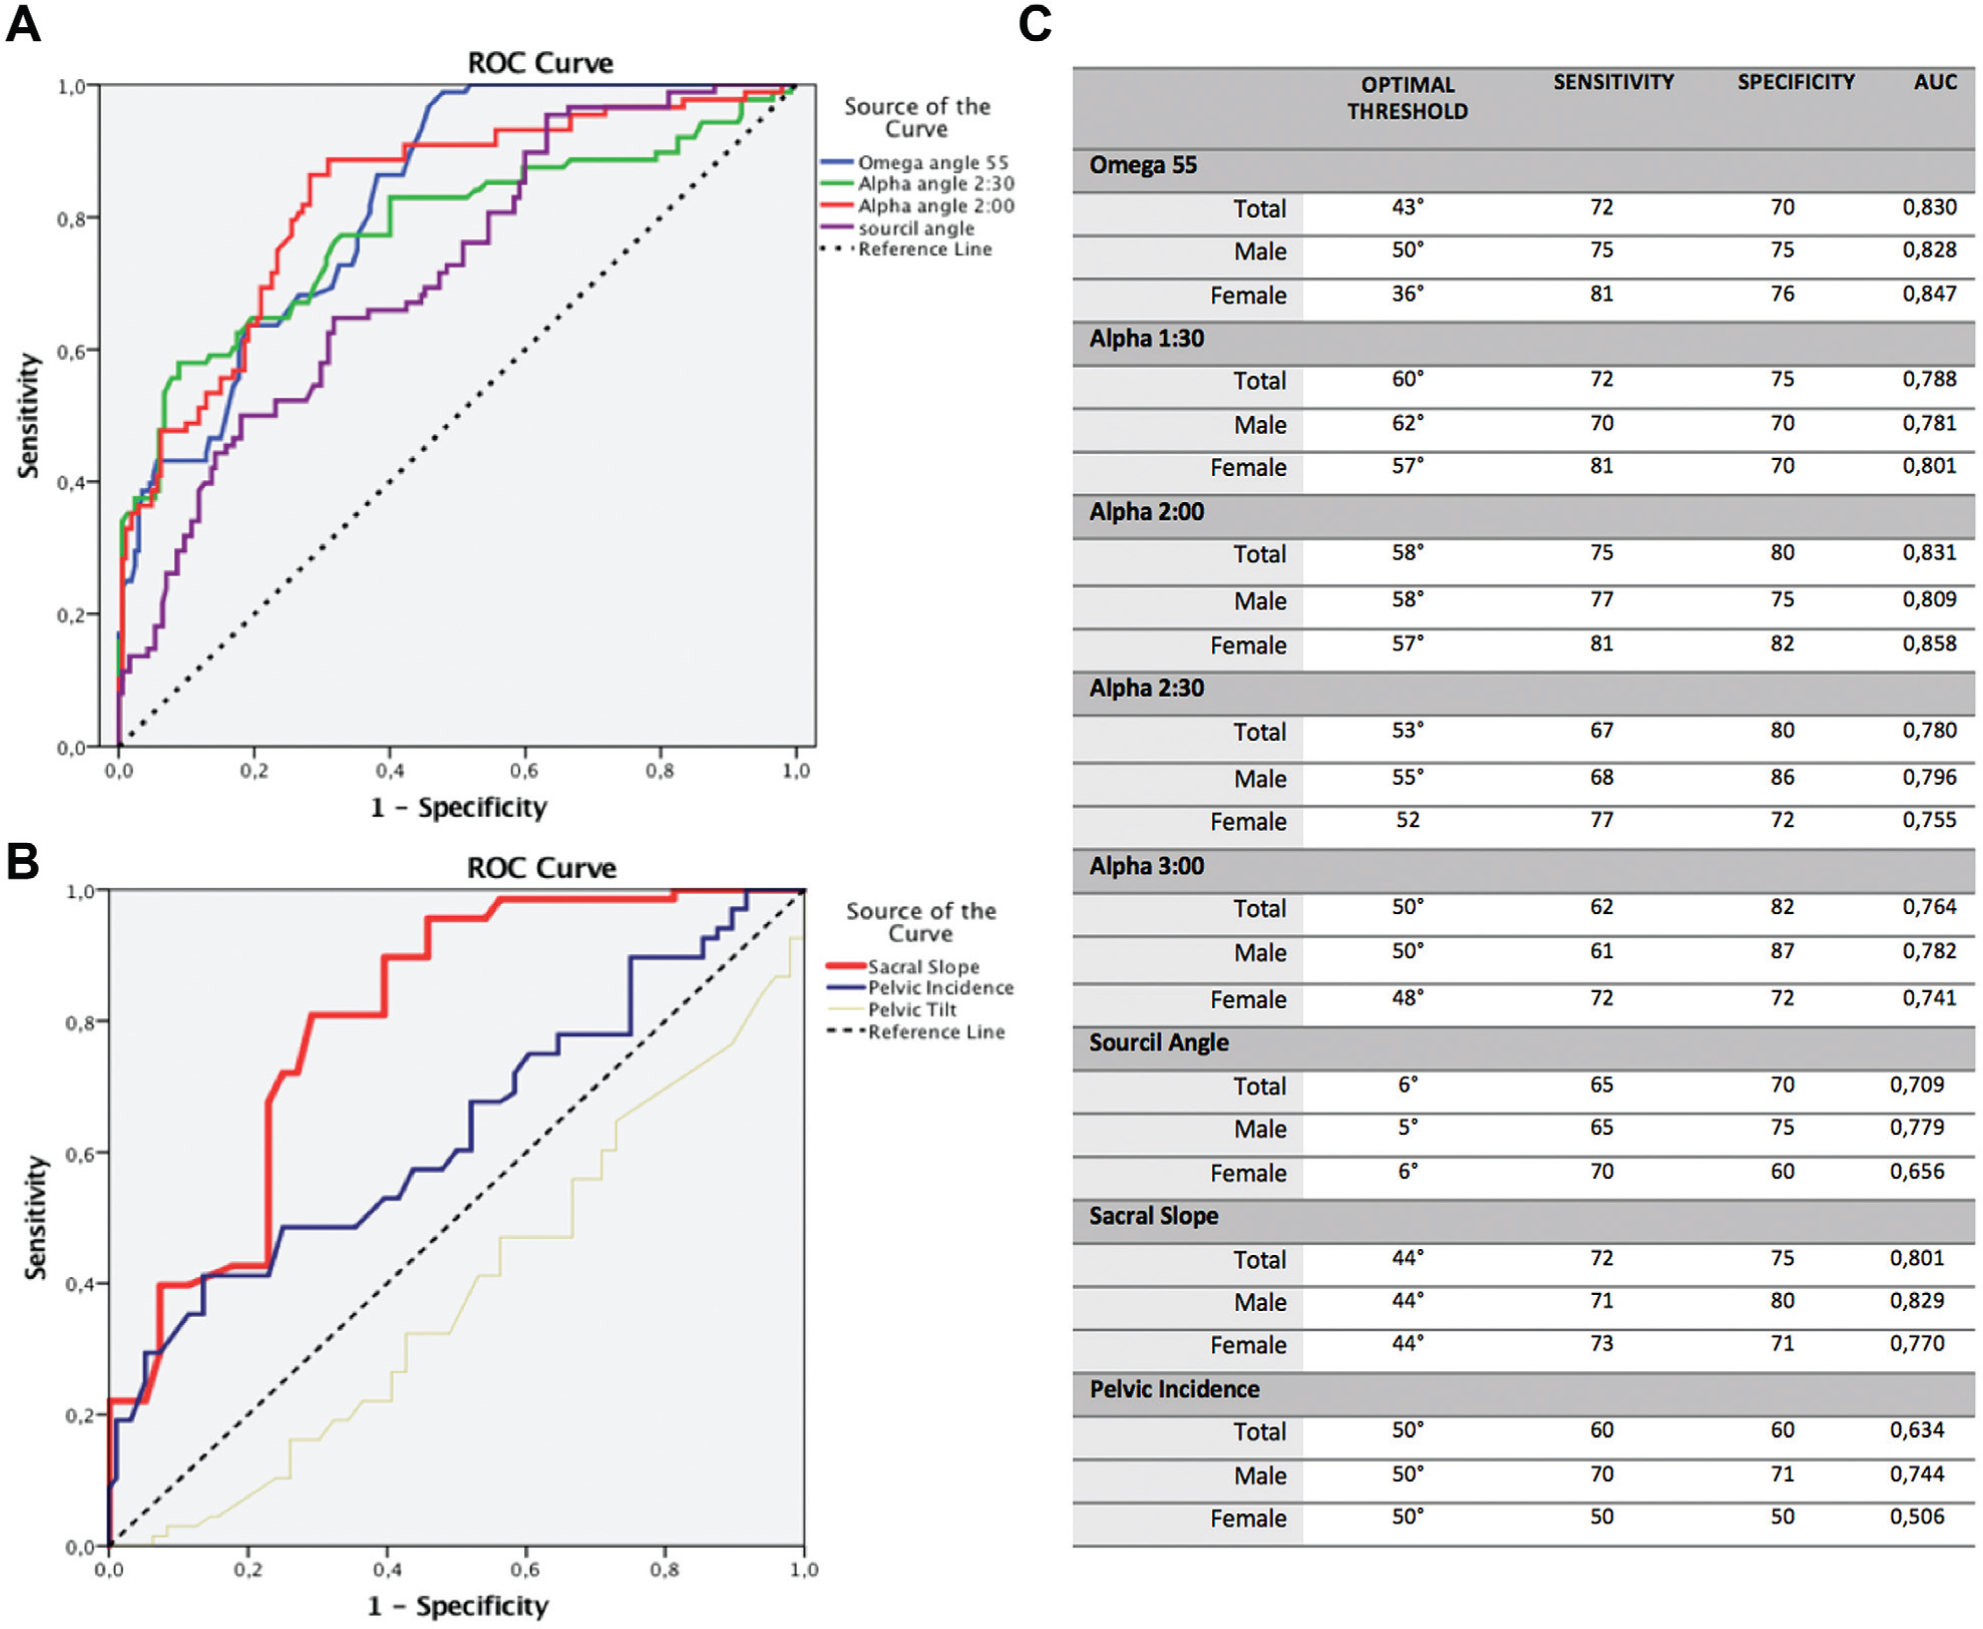
(A) Receiver operating characteristic (ROC) curve analysis of most significant femoral and acetabular parameters for discrimination between symptomatic patients and asymptomatic volunteers showed the largest area under the curve (AUC) for the α angle at the 2-o’clock position (red line). Discrimination power was smaller for the other positions and parameters, with decreasing AUC for the α angle at 2:30-o’clock position (green line), the Ω angle for a 55° α-angle threshold (blue line), and the sourcil angle (acetabular inclination) (purple line). (B) ROC curves for spinopelvic parameters for discrimination between symptomatic patients and asymptomatic volunteers showed the largest AUC for the sacral slope (red line). (C) Output of ROC curve analysis with AUC as an indication of predictive power. Optimum threshold is the level with highest combination of sensitivity and specificity.
On the acetabular side, the only acceptable discriminating factor was ACinc with 6° as the best discriminating value, favoring specificity (Figure 6).
In males, the best discriminating factor was Ω angle and sacral slope with an AUC of 0.828 and 0.829, respectively. An Ω-angle cutoff value of 50° achieved a sensitivity and specificity of 75%. In females, the best discriminating factor was α angle at 2-o’clock position with an AUC of 0.858. A cutoff value of 57° achieved a sensitivity and specificity of 82%.
Multivariate Logistic Regression
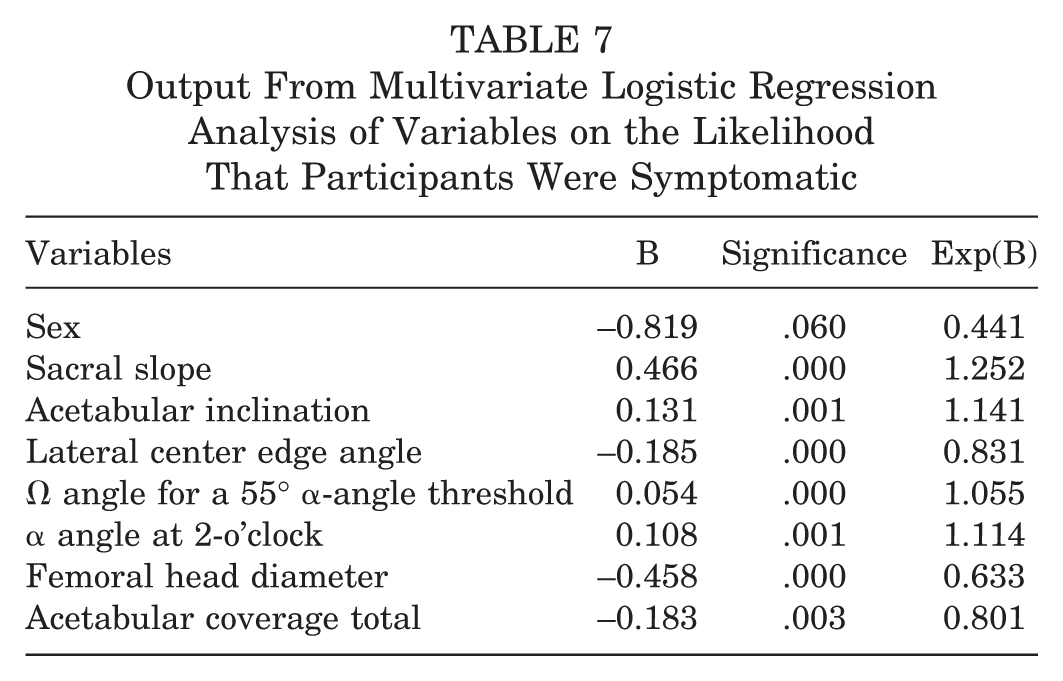
A logistic regression was performed to ascertain the effects of sex, acetabular factors (considering ACinc, ACcov total, LCEA at 12-o’clock), femoral variables (considering femoral head diameter, Ω angle for a 55° α-angle threshold, α angle at 2-o’clock), and SPPs (sacral slope) on the likelihood that participants were symptomatic (Table 7). The model was statistically significant (χ 2 = 327.27, P < .0005), explained 64.0% (Nagelkerke R2) of the variance in symptomatic status, and correctly classified 85% of cases. Sensitivity and specificity of the model were 72% and 91%, respectively, with an accuracy of 85% and AUC of 0.919 (range, 0.896-0.942), which accounts for an excellent discriminative model.
Output From Multivariate Logistic Regression Analysis of Variables on the Likelihood That Participants Were Symptomatic
Discussion
In this study, we assessed the usefulness of combined acetabular, femoral, and spinopelvic measurements based on 3D MRIs in distinguishing between patients with FAI syndrome and asymptomatic volunteers. Our data build on previously reported normative hip32-34 and spinopelvic data.18,39,47 To the best of our knowledge, our study included the largest cohort of asymptomatic volunteers and symptomatic hip patients with all FAI types and instability-related morphologies assessed by use of semiautomated 3D MRI.
Population, Method, and Controversies
Since the recent advances in knowledge regarding FAI syndrome, the real concern about overdiagnosing and overtreating of this entity closely relates to the discussion about the measurement techniques, diagnostic criteria, and case definitions. 19 A population model with a substantial overlap between the healthy and diseased group seems to be the case for FAI, 50 emphasizing that a thorough diagnostic integrated approach is critical. 19 It is paramount to recognize that the two basic mechanisms of FAI offer overly simplistic explanations of this hip condition. They often occur in addition to other complex conditions such as hip dysplasia, version abnormalities, 56 and other extra-articular factors (such as SPPs, extreme range of motion, and sports participation). 19 Thus, a comprehensive and combined analysis of hip pathomorphologic features is needed to help further our understanding of this complex 3-dimensional pathologic process.
Prior studies comparing asymptomatic volunteers and symptomatic hip patients have primarily used conventional radiographs to characterize the hip.4,28 However, several other studies reported poor reliability for defining hip pathomorphologic features with conventional radiographs and improved accuracy with CT and MRI.10,61 With recent developments of MRI and 3D imaging, attention has turned to the unique capability of determining bone and soft tissue abnormalities in one examination. Advantages of this specific method have been outlined in several studies,6,32,34,60 including improved diagnosis and monitoring, accurate spatial visualization of the joint, and reduced variability in clinical research.
Logistic Regression Model
The hip should not be studied in isolation, given the value of femoral and acetabular components as well as extra-articular contributors such as SPPs.18,23,47,57 Interestingly, our model clearly showed the complex interplay between these components. The likelihood of symptomatic disease doubled for an Ω-angle increase of 20° or an α-angle increase of 8° to 9° (measured at 2-o’clock). Accordingly, higher femoral diameters were somewhat protective against symptomatic disease, which demonstrates the importance of FHN morphologic characteristics rather than femoral head size in FAI disease.
The symptomatic state was also more associated with decreasing superior acetabular coverage (decreasing LCEA at 12-o’clock and increasing ACinc [>6°; AUC = 0.715]) than with pincer morphology (which paradoxically showed a tendency to protect against the development of the symptomatic state). Likelihood of symptomatic disease doubled with a 7° increase in ACinc in line with the findings of dysplasia as a major factor in OA development, 2 suggesting a delicate balance regarding impingement and instability.2,56 Undercoverage may cause higher joint contact pressures and subsequent degeneration of the articular cartilage resulting from static overload. 36 Acetabular overcoverage may lead to early pathological contact between the overcovering acetabulum and the FHN junction. This can lead to chondrolabral damage as a result of a more dynamic conflict at the acetabular rim. 51 Previous research showed an increased risk for OA with pincer morphology,15,17 whereas other epidemiological studies found no association or even suggested a protective effect for the development of OA.2,5,37,41,55 Conversely, recent prospective epidemiological studies have supported that even mild acetabular dysplasia is in fact associated with increased risk of OA,2,55 concordant with our findings. Nevertheless, further prospective research with larger samples is important to further address this issue.
Concerning SPPs, a role in symptomatic hip disease is suggested by the increasing likelihood of symptomatic state with increasing SS (which is a dynamic parameter), consistent with recent reports.18,39
Femoral Parameters
The large prevalence (71%) of cam-type deformities in our asymptomatic population is in accordance with the previous literature12,32-34 using an α angle greater than 55° measured with different imaging techniques (cam-type deformities were detected with CT 24 in 74% of asymptomatic volunteers and with MRI in 24% 46 to 34% 20 ). This further stresses that although cam morphology is a known risk factor for OA, 1 it is not the exception but the rule in both populations.
Regarding cam morphology, distinguishing between symptomatic patients and asymptomatic volunteers was best done by measuring the α angle at 2-o’clock position (58°) and the Ω angle (43°). ROC curve analysis results also showed that the maximal α angle from 1- to 3-o’clock can be used for patient identification, with an AUC greater than 0.750. Although patient identification was also possible at other femoral positions, the AUC was less favorable at these positions.
Published reference intervals of hip morphometric measurements, in both symptomatic patients and asymptomatic volunteers, raise concerns about normal thresholds, as it becomes clear that reference standards should incorporate both higher sensitivity and specificity. 50 The use of α angle is controversial due to its moderate reproducibility, its moderate discriminative ability,49,50 and the lack of conclusive data on ideal threshold values.3,32,49 Reference intervals usually derive from mean values (±1 SD or ±2 SD3,44) and assume a normal distribution of a certain variable, often lacking specificity, which further increases the natural overlap between populations.
Examples of a conservative approach include the recently proposed α-angle upper-limit reference intervals of 60° for the 12- and 3-o’clock positions and 65° to 70° for the 1- and 1:30-o'clock positions. 32 This is in agreement with Agricola et al, 3 who used conventional radiographs (and also measured α angle at the 12-o'clock position), and Golfam et al, 16 who used MRI (and suggested increasing the thresholds to 63° at 3-o'clock and 66° at 1:30-o'clock). These results are certainly adequate for identifying a definitive pathological α angle, although with considerable loss of sensitivity. Our results show that a cam deformity extending over half the anterosuperior quadrant (corresponding to an Ω angle of 45°, AUC = 0.830) or with α-angle measurements of 57° to 60° (at the 1:30- to 2-o’clock positions; AUC = 0.788-0.831) is probably symptomatic. Sutter et al 49 found a similar AUC (0.790-0.820) for the best α-angle measurement point.
Increasing the threshold for an abnormal α angle while considering its discriminative ability would improve its value as a diagnostic test. Therefore, we suggest reconsidering the threshold of abnormal α angle in the setting of a diagnostic test to incorporate higher discriminative power. An α angle of 57° to 60° measured at 1:00-, 1:30-, and 2-o’clock and 50° at 3-o’clock would optimize discriminative power while favoring specificity (Table 6).
Femoral malversion was similar to previous reported prevalence, which ranged from 13% 11 to 24% 25 for diminished version (<5°) and from 15% 25 to 34% 7 for increased version (>20°).
These results underline that (a) analyzing deformities of the femoral head with 3D imaging or at least radial images is paramount, rather than only measuring the α angle at the anterior position 32 ; and (b) the α angle should be set according to specific location and sex 34 (Figure 6).
Acetabular and Spinopelvic Parameters
Dysplasia and pincer morphology are 2 distinct pathologic forms resulting in clinically different pathomechanisms, static overload or dynamic conflict. 52
The goal of arthroscopy for pincer FAI is generally accepted as correcting the impingement while not causing iatrogenic dysplasia or acute instability. 26 However, there are no agreed-upon measurements to assess the location and extent of correction. LCEA is the only measurement thoroughly researched for perioperative value, 22 although pincer morphology often extends more medially and posterolaterally. 22
The relatively high reported prevalence of pincer morphology in asymptomatic (57%-67%) and symptomatic (28%-54%) individuals may be confounded in several ways,12,33 given that radiographic parameters such as the crossover sign and posterior wall sign have shown poor diagnostic reliability.21,38 We observed that approximately 33% of symptomatic patients and 20% of asymptomatic volunteers had pincer morphology, which we believe is a more accurate estimate of the real prevalence given the method used.
Cranial retroversion was uncommon although significantly more prevalent in symptomatic patients (8% vs 2.6%), in agreement with radiographic differences seen in previous studies 15 although with different frequencies noted (20% among patients with hip OA vs 5% among the general population). Symptomatic males more often had cranial retroversion than did females (7% vs 1%), consistent with a previous study 27 but divergent from the report by Tannenbaum et al 54 (no sex differences noted). Males in both groups had a clear tendency for a more prominent anterosuperior wall (anteversion angles were on average 5° lower in males) in line with previous reports.43,54
Concerning SPPs, a definitive contribution of these parameters for a symptomatic hip is suggested by our data. Briefly, pelvic tilt and SS depend on posture (higher SS when supine and reduced when standing) and conjointly compose PI, which is an individual, position-independent angle. This dynamic “unit” may change in response to postural changes to maintain the sagittal lumbopelvic balance. 47 Decreasing values of SS may allow greater impingement-free hip flexion by effectively reducing femoral coverage anteriorly. Notably, subjects with small PI have less range to compensate through pelvic movement, as the ability to alter spinopelvic relation is reduced. 47
The symptomatic group showed larger PI and SS angles. Recent reports with smaller cohorts examined via CT18,39 (<70 subjects) found similar results when comparing symptomatic and asymptomatic groups (PI, 53° vs 48°; SS, 47° vs 43° 18 ). Interestingly, in our study SS demonstrated higher discriminative power than PI (SS, 48° vs 41°, AUC = 0.801; PI, 51° vs 47°, AUC = 0.634). Paradoxically, these results are divergent from initial studies that reported PI to be smaller in hips with deformities (studies using lateral scout radiographs, 23 CT, 58 and cadaveric studies13,35). Notably, the PI and SS values in our symptomatic patients' group are similar to those studies, but our control group values are divergent (the reported average “pathological” PI of 51.4° 58 is within the range of 44°-60° reported in earlier studies13,29,35,47). Our control group had a 2:1 enrollment ratio, which further increases the comparative strength of our study. Furthermore, two related cadaveric studies included hips from the beginning of the previous century and with unknown symptomatic status.13,35 Last, none of the divergent studies report body mass index, which is a critical parameter in sacral development. 39 Although it is beyond the scope of our study to prove causation between cam or pincer morphology and increased SPPs, the association can be established as a basis for prospective evaluation. Additionally, our findings are more consistent with published data on the association of higher PI and OA. 14
A larger SS is by definition associated with both an increased anterosuperior acetabular coverage and an anteroposterior distance between hip joint centers and the sacral endplate (presumably resulting in a tighter core pelvic and iliopsoas musculature). 39 These findings have clinical significance as femoral and acetabular parameters are static parameters that are not amenable to nonoperative treatment. Conversely, SPPs may be subject to nonsurgical treatment, as increasing SPT conceptually increases posterior pelvic tilt and increases the superoanterior femoral head collision-free range of motion (manageable by nonoperative pelvic muscular-focused treatment).18,39
Limitations
This study has limitations. First, selecting a protocol for this study may have been subject to bias as our controls were not selected from healthy volunteers and we used patient survey information to exclude hip abnormality but did not perform a clinical hip examination. However, we prospectively included controls evaluated for nonorthopaedic disease and excluded all controls with any reported history of hip abnormality or symptoms. Additionally, we excluded any controls with signs of hip abnormality on MRI so that our cohort comprised asymptomatic individuals only. Second, this study included only partial correlation of semiautomated measurements with traditional manual measurements; such comparison between 2D and 3D MRI methods would be useful but was not an objective of our study, apart from the fact that the software used had already been validated for this purpose.
Conclusion and Future Directions
These study’s findings may allow clinicians to
(a) acknowledge that a cam deformity extending over half of the anterosuperior quadrant (Ω angle ranging from more than 43° to 45°), α-angle measurements of 57° to 60° (at the 1:30- to 2-o’clock positions), and undercoverage tendency (acetabular inclination >6°) are predictive factors of a symptomatic hip;
(b) identify asymptomatic populations with high PI and high SS as subjects prone to develop symptoms and conceptually benefiting from muscular strengthening (as increasing SPT may attempt to tilt the pelvis to reduce anterior acetabular coverage); and
(c) select adequate surgical indications for symptomatic hip patients by identifying the most suitable candidates who would initially benefit from nonoperative management.
Imaging-based evaluation for hip pain should include the entire pelvis to allow for determination of these parameters. Nevertheless, we acknowledge that morphologic features alone do not account for the full gamut of hip symptoms or signs. Intra-articular factors are not the only factors that lead to FAI. Extra-articular factors such as femoral torsion, pelvic morphologic features, and nonanatomic factors such as ligamentous laxity need to be considered as well.
Future research may investigate integrated risk profiling for FAI including key anatomic parameters (Ω angle, α angle, SPPs) combined with other specific biomarkers. Conceptually, patient-based imaging data can be cross-linked to population-based data available in biobanks, enabling a personalized approach.
Footnotes
Acknowledgements
The authors thank José Roquette, João Sá, Isabel Vaz, and Pedro Patrício for their continuing and enthusiastic support of clinical research at Hospital da Luz, and Rúben Teixeira, Ana Filipa Graça, João Novo, Sara Gonçalves, and Tiago Castela for their efforts to optimize technical issues and provide patient care.
The authors declared that they have no conflicts of interest in the authorship and publication of this contribution. AOSSM checks author disclosures against the Open Payments Database (OPD). AOSSM has not conducted an independent investigation on the OPD and disclaims any liability or responsibility relating thereto.
References
Supplementary Material
Please find the following supplemental material available below.
For Open Access articles published under a Creative Commons License, all supplemental material carries the same license as the article it is associated with.
For non-Open Access articles published, all supplemental material carries a non-exclusive license, and permission requests for re-use of supplemental material or any part of supplemental material shall be sent directly to the copyright owner as specified in the copyright notice associated with the article.