
Abstract
Background:
Ankle sprains are one of the most common injuries in basketball. Despite this, the incidence and setting of ankle sprains among elite basketball players are not well described.
Purpose:
To describe the epidemiology of ankle sprains among National Basketball Association (NBA) players.
Study Design:
Cohort study; Level of evidence, 3.
Methods:
All players on an NBA roster for ≥1 NBA game (preseason, regular season, or playoffs) during the 2013-14 through 2016-17 seasons were included. Data were collected with the NBA electronic medical record system. All NBA teams used the electronic medical record continuously throughout the study period to record comprehensive injury data, including onset, mechanism, setting, type, and time lost. Game incidence rates were calculated per 1000 player-games and per 10,000 player-minutes of participation, stratified by demographic and playing characteristics.
Results:
There were 796 ankle sprains among 389 players and 2341 unique NBA player-seasons reported in the league from 2013-14 through 2016-17. The overall single-season risk of ankle sprain was 25.8% (95% CI, 23.9%-28.0%). The majority of ankle sprains occurred in games (n = 565, 71.0%) and involved a contact mechanism of injury (n = 567, 71.2%). Most ankle sprains were lateral (n = 638, 80.2%). The incidence of ankle sprain among players with a history of prior ankle sprain in the past year was 1.41 times (95% CI, 1.13-1.74) the incidence of those without a history of ankle sprain in the past year (P = .002). Fifty-six percent of ankle sprains did not result in any NBA games missed (n = 443); among those that did, players missed a median of 2 games (interquartile range, 1-4) resulting in a cumulative total of 1467 missed player-games over the 4-season study period.
Conclusion:
Ankle sprains affect approximately 26% of NBA players on average each season and account for a large number of missed NBA games in aggregate. Younger players and players with a history of ankle sprain have elevated rates of incident ankle sprains in games, highlighting the potential benefit for integrating injury prevention programs into the management of initial sprains. Research on basketball- and ankle-specific injury prevention strategies could provide benefits.
Basketball is one of the most popular sports in the United States, with 980,673 high school participants 15 and 2192 teams in the National Collegiate Athletic Association (NCAA) 14 in 2016-2017. In addition, basketball is played by an estimated 450 million individuals throughout the world in recreational and professional settings10,19 and by 1 in 13 people in the United States at least once in a calendar year.16,18
Ankle sprains are the most common injury across all levels of basketball participation for both sexes.4,5,9-11,13,17,20,22 Previous studies estimated an incidence rate of 1.0 to 5.2 ankle injuries per 1000 person-hours in basketball, with sprains accounting for approximately 90% of these basketball-related ankle injuries. 9
Despite the high rates of ankle sprain among basketball players, there is little current information on incidence and outcomes of ankle sprains at the elite levels of the sport. The purpose of this study was to describe the epidemiology of ankle sprains among National Basketball Association (NBA) players from 2013-2014 through 2016-2017.
Methods
We conducted a retrospective cohort study of all players on an NBA roster for ≥1 preseason, regular season, or playoff games during the 2013-14 through 2016-17 seasons. Approval was obtained from the University of North Carolina at Chapel Hill Institutional Review Board, the NBA, the National Basketball Players Association, and the Research Committee of the NBA Physicians Association.
Ankle Sprain Definition
Incident ankle sprains were defined as acute-onset injury to any ligamentous structure of the ankle as diagnosed by the team medical staff. Ankle sprains with no identifiable injury event (eg, exacerbations of chronic ankle instability), those that occurred while the player was on G League assignment, or other sprains not directly related to basketball participation were excluded from the analysis. Sprain type (lateral, medial, or high) was based on the injured ligamentous structure that was entered in the electronic medical record (EMR) by the certified athletic trainer (AT): injuries to the anterior talofibular ligament, posterior talofibular ligament, calcaneofibular ligament, or “general lateral ligaments” were considered “lateral”; injuries to the deltoid ligament or tibionavicular ligament were considered “medial”; and injuries to the distal tibiofibular syndesmosis, anterior tibiofibular ligament, or posterior tibiofibular ligament were considered “high.”
Data Source
Data were obtained from the NBA EMR database, a centralized data collection system that was integrated with the clinical management of player health for all NBA teams continuously throughout the study period. 12 In addition to the player health information available through the NBA EMR, player and team participation information was integrated in the database, including minutes played per game. Injury data, including onset, mechanism, setting, type, and time lost, were recorded by ATs. Uniform definitions were used and accompanied by a detailed quality control and audit process. ATs were also required to enter player-game participation data for each player across the entire study period, including associating each missed game with a particular injury record if the player was unable to participate because of injury. Entry of practice participation information in the EMR was not required before the 2016-17 season, and practice participation entry was not audited across the study period. Thus, incidence rate calculations focused on game injuries and game participation. Playing time exposure was assessed with several metrics: player-season (1 player participating in 1 NBA season), player-game (1 player participating in 1 NBA game), and player-minute (individual player minutes of participation in NBA games).
Time-Dependent Risk Factors
We examined age, body mass index, history of ankle sprain in the past year, and NBA game minutes played as possible risk factors. When game incidence rates stratified by demographic and playing characteristics were calculated, these covariates were assessed in a time-dynamic manner at the time of the player-game. Age was determined on the date of the player-game, and body mass index was calculated with the most recent height and weight before the player-game, as recorded in the EMR or the player’s NBA preseason profile. Similarly, history of ankle sprain was based on ankle sprains (whether or not they were basketball related and those that occurred before 2013-14) reported in the EMR cumulative from 365 days before the point in time immediately preceding each player-game. Average game minutes played was calculated as the average number of minutes played in NBA games in the 365 days before the player-game of interest (ie, game of injury for incident ankle sprains). Players who were in their rookie season were excluded from these calculations.
Playing Time Missed
Time missed attributed to ankle sprain was calculated in 2 ways: (1) the number of NBA games missed after the game, practice, or other activity in which the injury occurred and (2) the number of days between the date of injury and the date of the first NBA game in which the player participated after injury. The number of NBA games missed after injury was assessed per the player participation data that ATs entered in the NBA EMR. For our outcome metric of games missed because of injury, we included preseason, regular season, and playoff games missed to give the full picture of the effect of these injuries to the player.
Statistical Analysis
Descriptive statistics were calculated for all variables of interest, including counts, percentages, means, SDs, medians, and interquartile ranges where appropriate. The single-season risk of ankle sprain was calculated as the number of injured players in a season divided by the total population at risk for injury in that season, which was defined as the total number of players on an NBA roster for ≥1 preseason, regular season, or playoff games in each season. Game incidence rates were calculated per 1000 player-games and per 10,000 player-minutes of participation. Incidence rates per 1000 player-games included all games in which the player participated irrespective of duration of participation. Incidence rates per 10,000 player-minutes included the total number of minutes in which each player participated during each game. Models were created to calculate risks and rates with 95% CIs, with log-link/binomial-residual regression and Poisson regression, respectively.
Stratification was used to assess the risk and rate of ankle sprain among subgroups of players with cut points defined by the median value of the variable. Comparisons between subgroups were performed with the models described earlier with a robust standard error estimator to stabilize the variance in the log-link/binomial-residual models. We examined the overdispersion parameter (Pearson chi-square divided by its degrees of freedom) to ensure appropriateness of the Poisson regression models.
Results
There were 796 ankle sprains among 389 players reported across 2341 unique NBA player-seasons among the 30 teams from 2013-14 through 2016-17 (Table 1).
Ankle Sprains, Injured Players, Teams, and Players in the NBA by Year, 2013-14 Through 2016-17 a
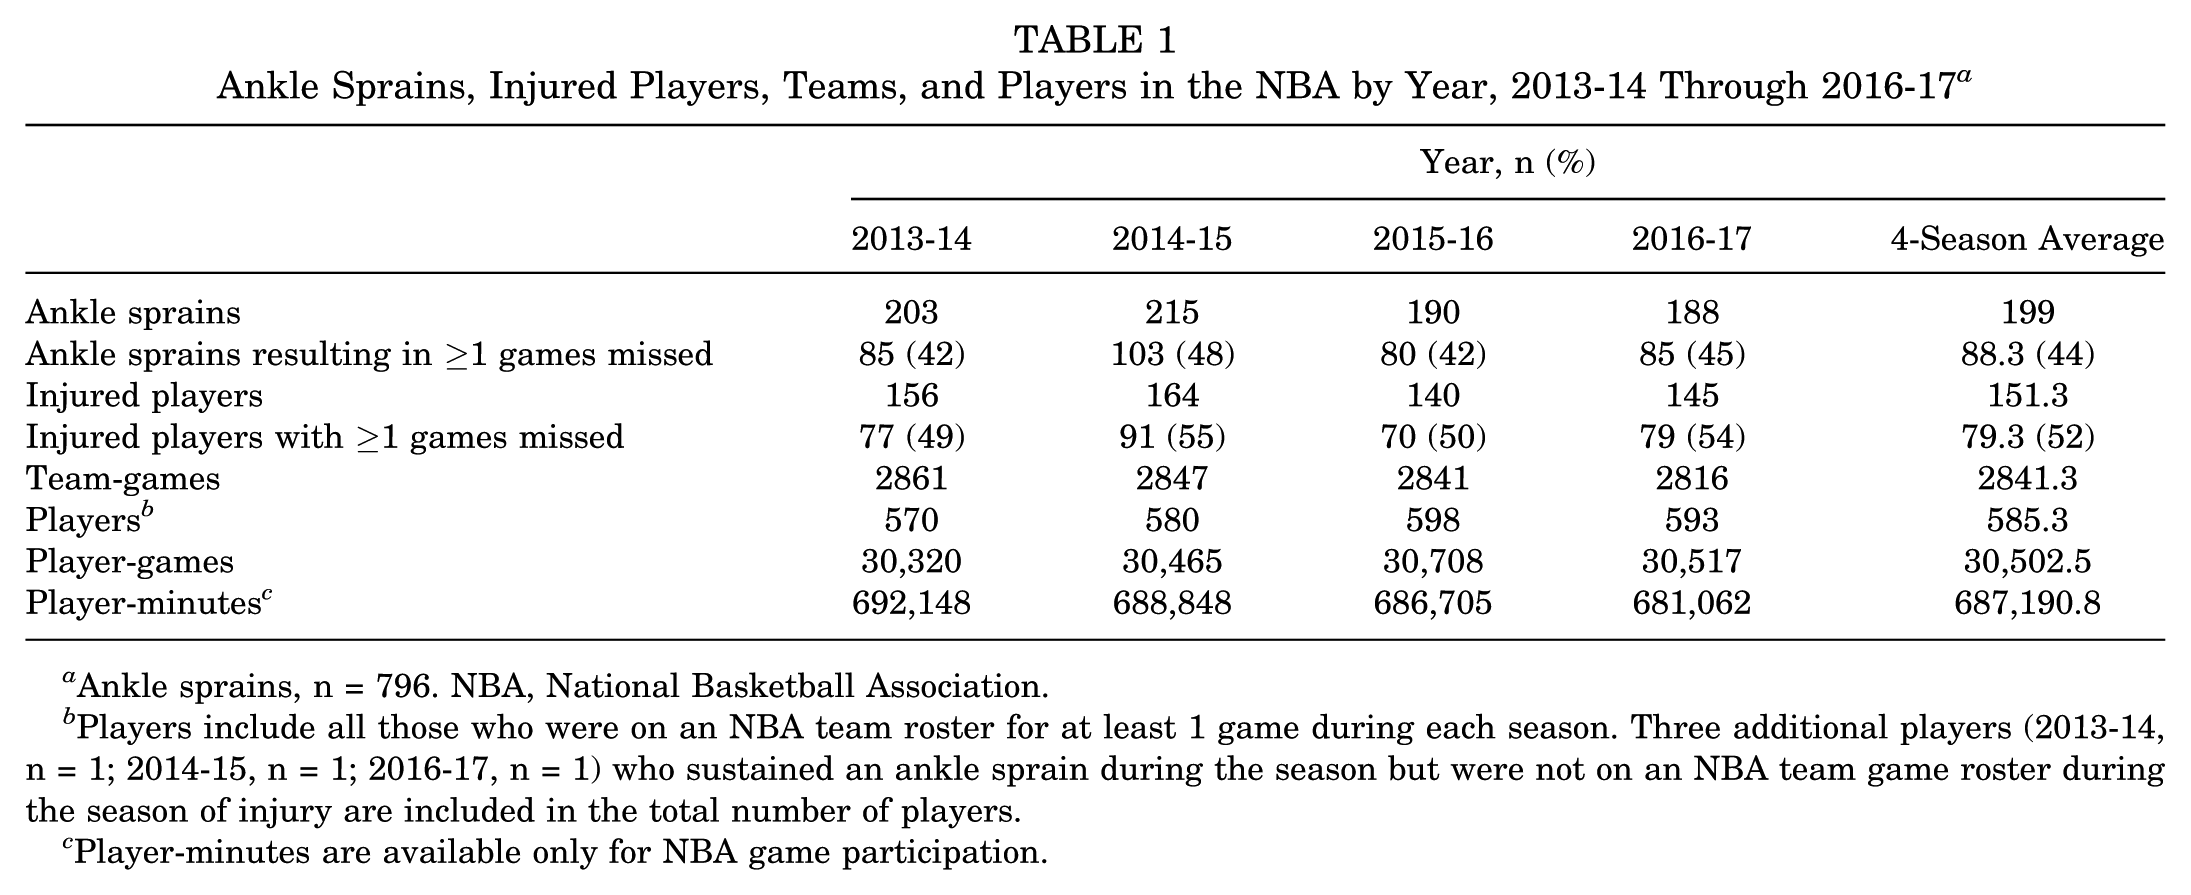
Ankle sprains, n = 796. NBA, National Basketball Association.
Players include all those who were on an NBA team roster for at least 1 game during each season. Three additional players (2013-14, n = 1; 2014-15, n = 1; 2016-17, n = 1) who sustained an ankle sprain during the season but were not on an NBA team game roster during the season of injury are included in the total number of players.
Player-minutes are available only for NBA game participation.
Risk, Rate, and Injury Characteristics
The overall single-season risk of ankle sprain was 25.8% (95% CI, 23.9%-28.0%). The single-season risk of an ankle sprain resulting in ≥1 NBA game missed for injury was 13.6% (95% CI, 12.1%-15.2%). Both the single-season risk and the game incidence rate of ankle sprain remained relatively stable across the study period (Tables 1 and 2).
Incidence of Ankle Sprain in NBA Games by Year, 2013-14 Through 2016-17 a
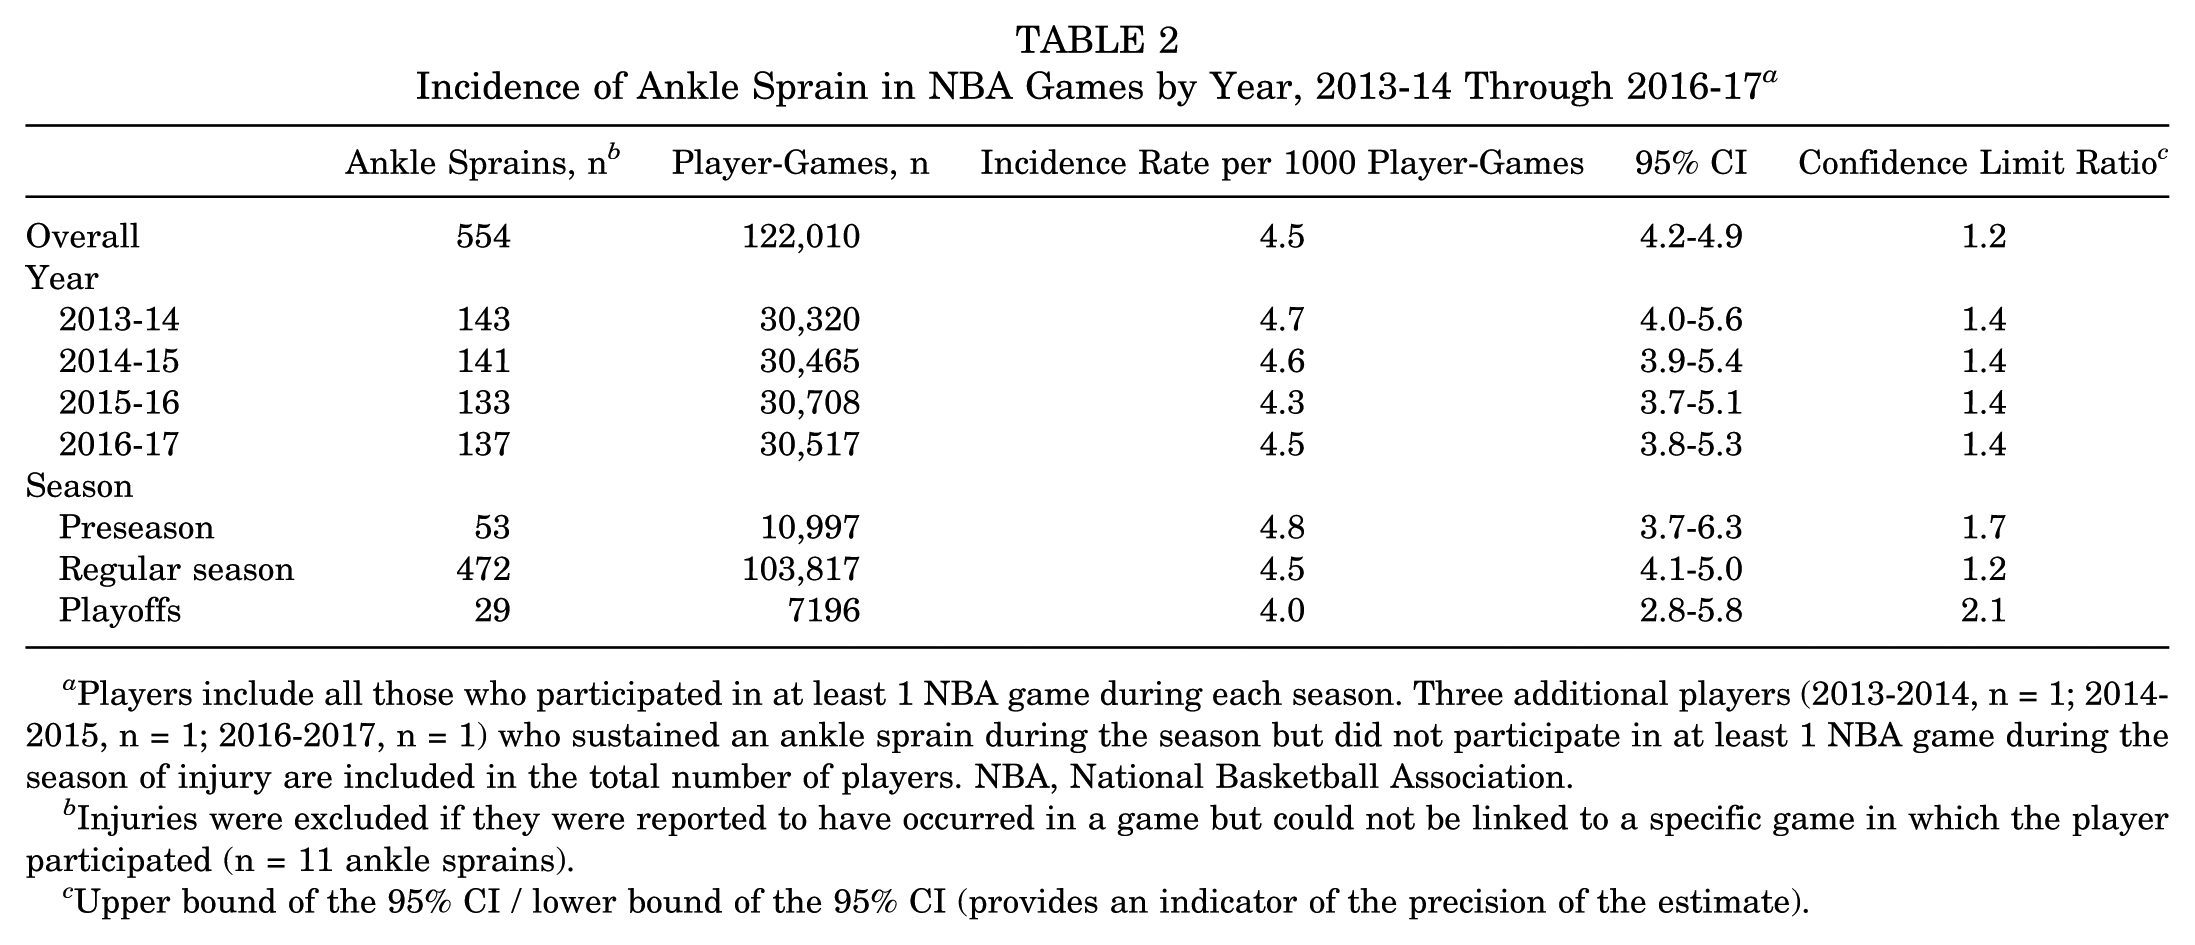
Players include all those who participated in at least 1 NBA game during each season. Three additional players (2013-2014, n = 1; 2014-2015, n = 1; 2016-2017, n = 1) who sustained an ankle sprain during the season but did not participate in at least 1 NBA game during the season of injury are included in the total number of players. NBA, National Basketball Association.
Injuries were excluded if they were reported to have occurred in a game but could not be linked to a specific game in which the player participated (n = 11 ankle sprains).
Upper bound of the 95% CI / lower bound of the 95% CI (provides an indicator of the precision of the estimate).
Among all ankle sprains reported, a majority were lateral sprains (n = 638, 80.2%) and involved a contact mechanism of injury (n = 567, 71.2%) (Table 3). Medial ankle sprains were slightly more likely to occur because of a noncontact mechanism than lateral or high sprains (37.1% vs 28.8% and 33.3%, respectively). Of the sprains that occurred because of contact, most were reported as general contact with another player (n = 240, 42.3%) or from stepping on an opponent’s foot (n = 189, 33.3%). The most common mechanism of noncontact sprains was inversion (n = 141, 61.6%). Most ankle sprains occurred in games (n = 565, 71.0%) or practices (n = 158, 19.9%). The remaining 73 ankle sprains occurred during training (eg, conditioning, weight lifting) or other basketball-related events (eg, charity game, exhibition game). Common activities reported at the time of the ankle sprain were general defense (n = 150, 18.8%), layup driving (n = 115, 14.5%), and rebounding (n = 97, 12.2%).
Player Characteristics at Time of Ankle Sprain by Sprain Type, 2013-14 Through 2016-17
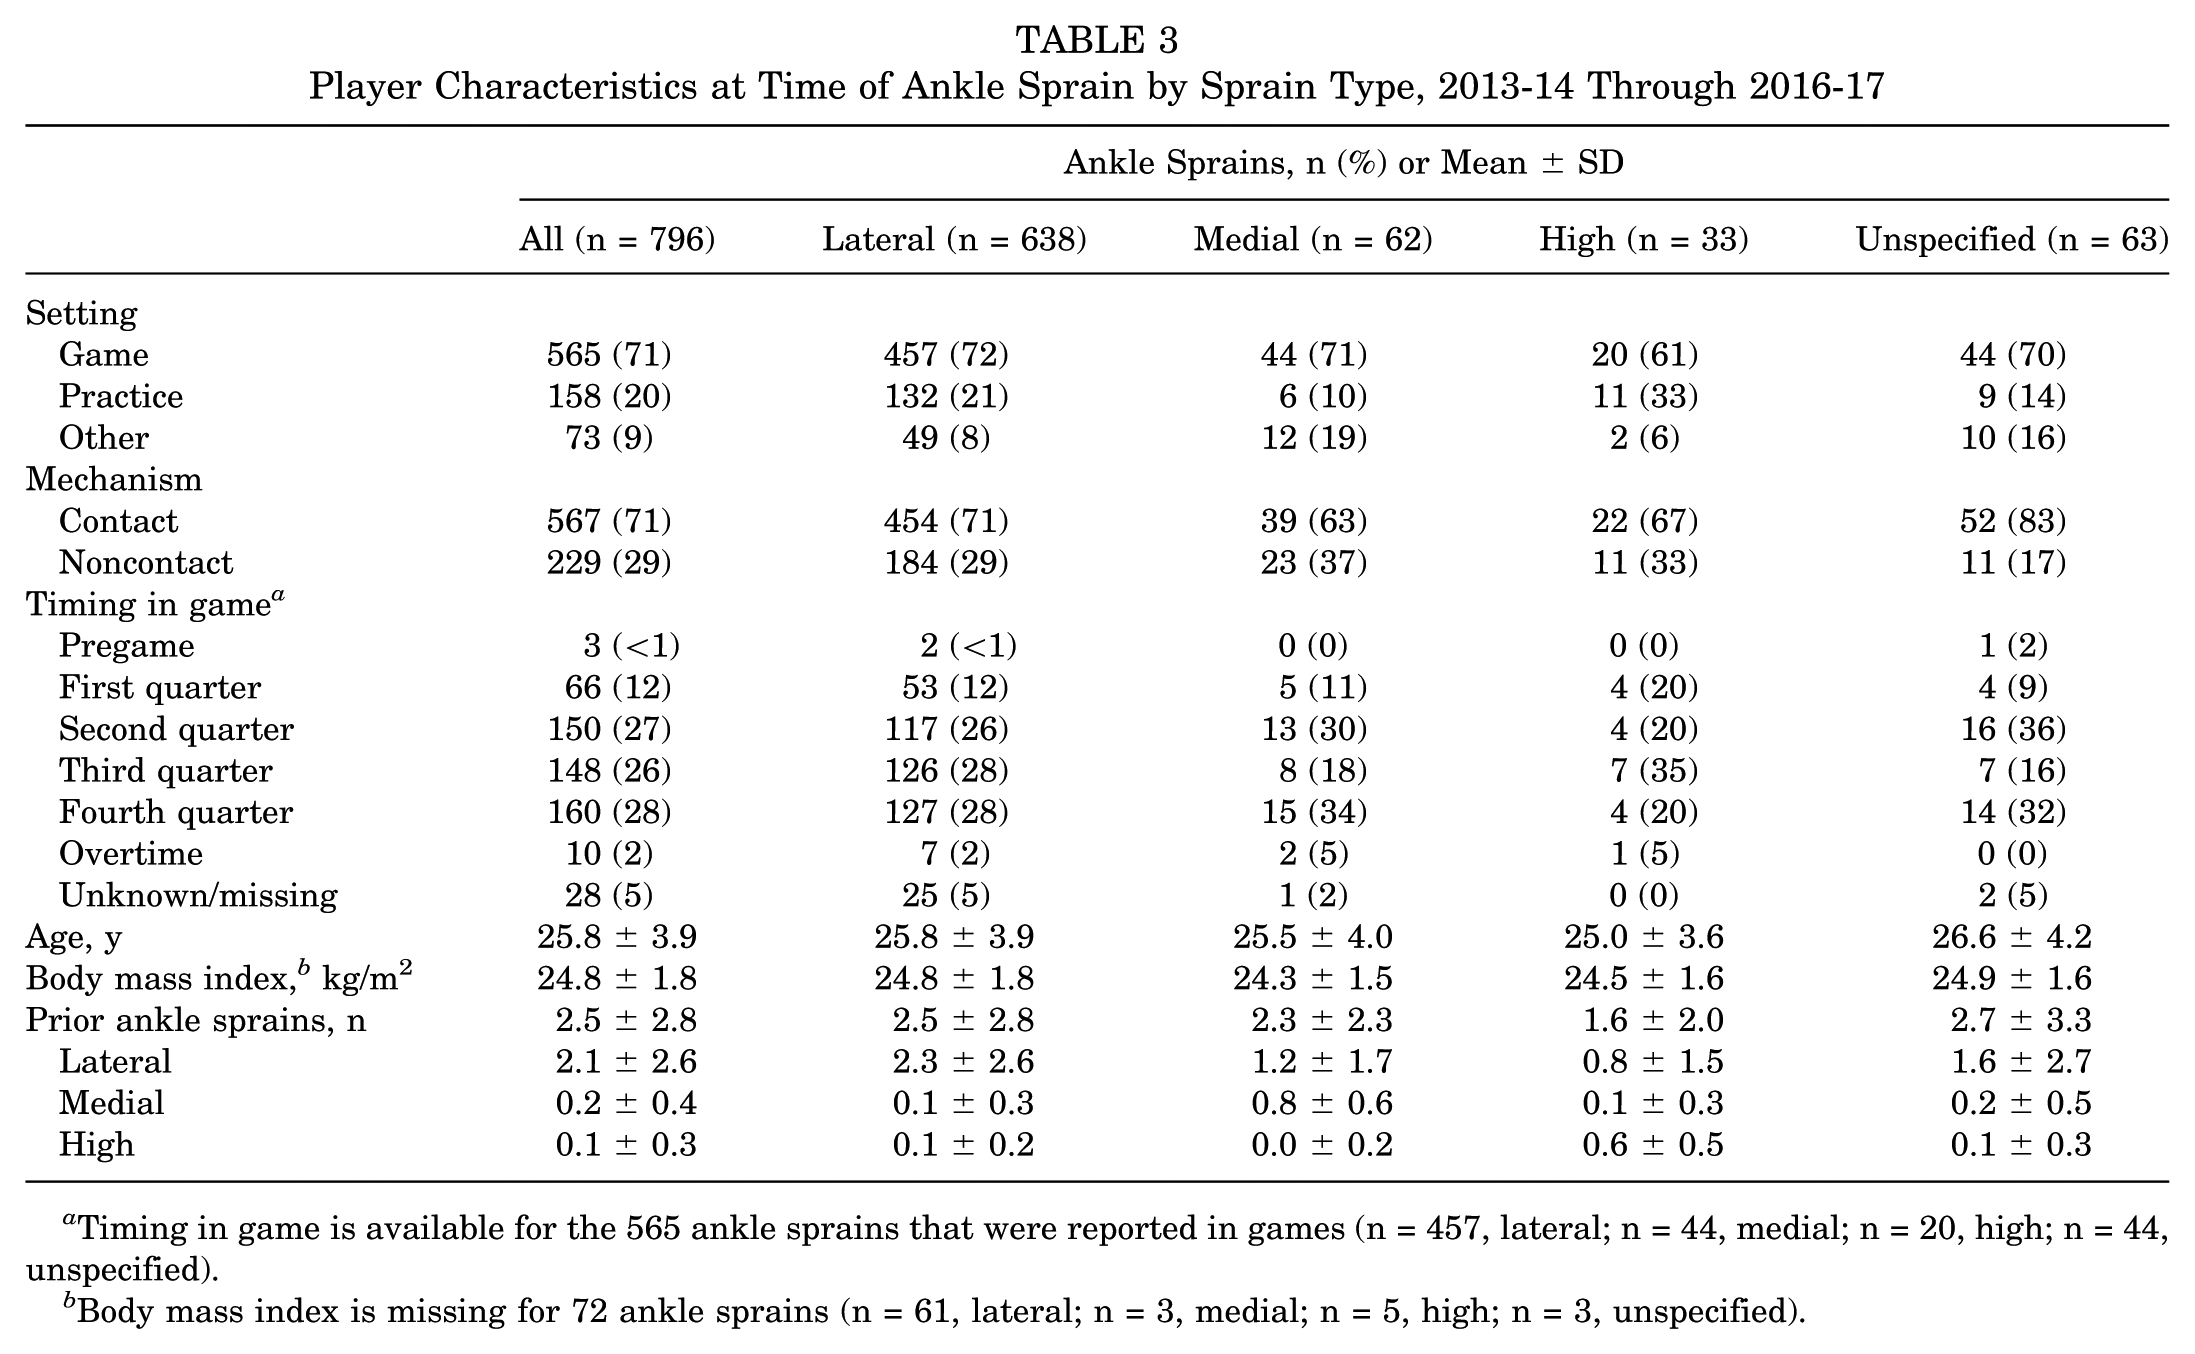
Timing in game is available for the 565 ankle sprains that were reported in games (n = 457, lateral; n = 44, medial; n = 20, high; n = 44, unspecified).
Body mass index is missing for 72 ankle sprains (n = 61, lateral; n = 3, medial; n = 5, high; n = 3, unspecified).
Fewer ankle sprains were reported in the first quarter as compared with the second, third, or fourth quarter (Table 3). Most ankle sprains that occurred in games were reported during the regular season. Game ankle sprain incidence rates were slightly higher in the preseason than in the regular season and playoffs (4.8 vs 4.5 and 4.0 ankle sprains per 1000 player-games, respectively) (Table 2). When counts of ankle sprains reported by week were assessed, ankle sprain incidence peaked at the start of preseason games and generally decreased over time (Figure 1).
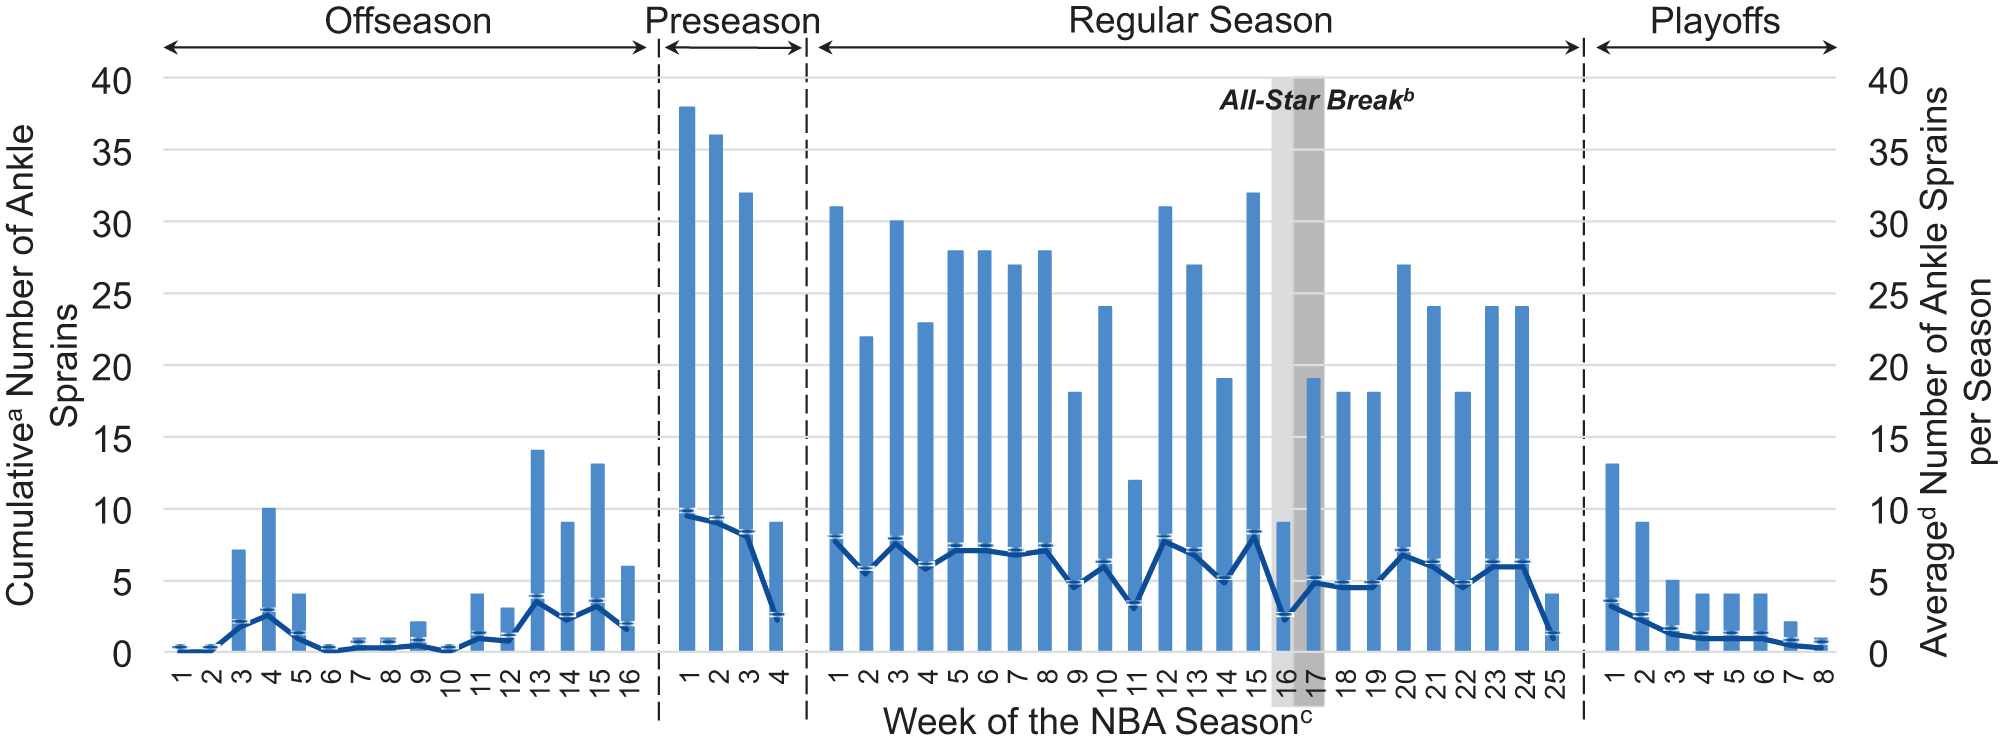
Cumulative (bars) and average (line) incidence of ankle sprain by week, 2013-14 through 2016-17. aThe cumulative number of ankle sprains is the 4-year sum of ankle sprains reported each week. bThe All-Star break was shorter in 2013-14 than the other seasons (2013-14: 4 days; 2014-15, 2015-16, 2016-17, and 2017-18: 6 days). cThe first day of preseason week 1 is the first day of training camp (2013-14: September 27, 2013; 2014-15: September 26, 2014; 2015-16: September 24, 2015; 2016-17: September 23, 2016). dThe average is calculated as the cumulative number of ankle sprains reported each week divided by 4. NBA, National Basketball Association.
Demographics
Player characteristics at the time of ankle sprain were fairly consistent across ankle sprain types, although players who sustained high ankle sprains had fewer prior ankle sprains (mean ± SD: 1.6 ± 2.8 vs 2.4 ± 2.8 for all injured players) (Table 3). The ankle sprain incidence rate in games, particularly lateral sprains, was higher among players aged <26 years versus ≥26 years (incidence rate ratio [IRR], 1.54; 95% CI, 1.27-1.86; P < .001) (Table 4).
Game Injury Incidence Rates per 10,000 Player-Minutes by Player Characteristics and Sprain Type, 2013-14 Through 2016-17 a
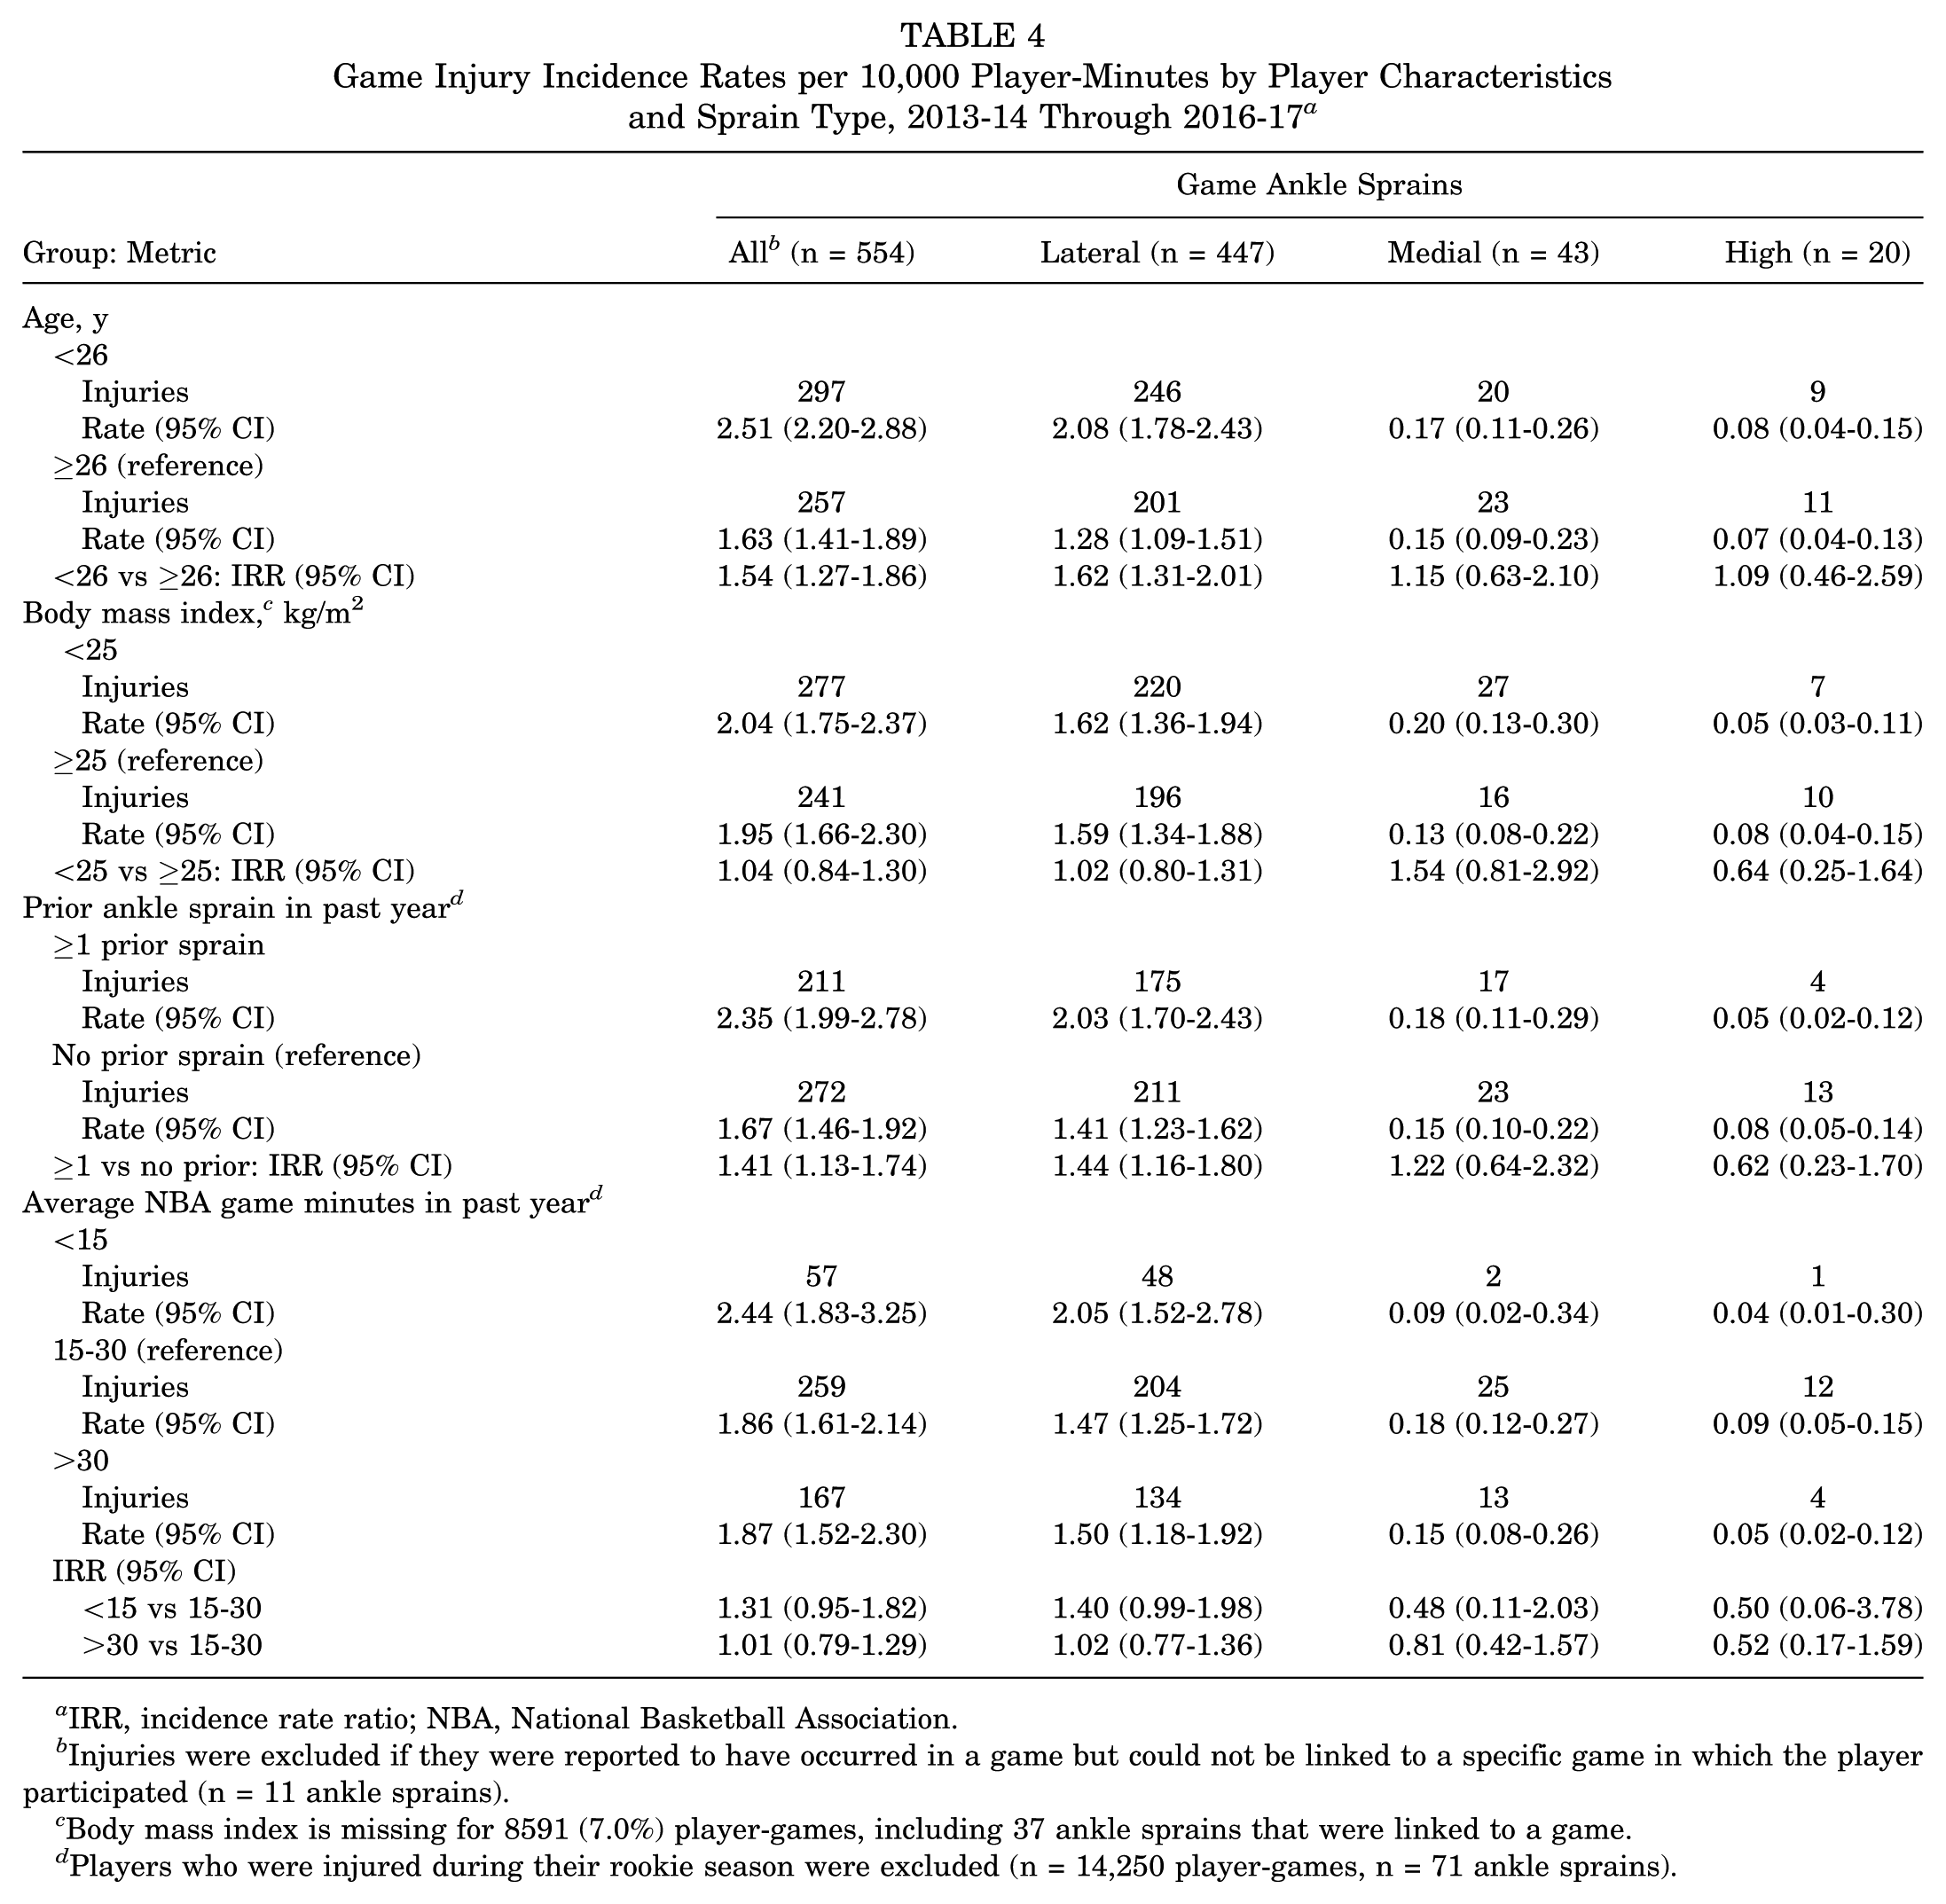
IRR, incidence rate ratio; NBA, National Basketball Association.
Injuries were excluded if they were reported to have occurred in a game but could not be linked to a specific game in which the player participated (n = 11 ankle sprains).
Body mass index is missing for 8591 (7.0%) player-games, including 37 ankle sprains that were linked to a game.
Players who were injured during their rookie season were excluded (n = 14,250 player-games, n = 71 ankle sprains).
History of Ankle Sprain
The ankle sprain incidence rate in games was 41% higher (IRR, 1.41; 95% CI, 1.13-1.74; P = .002) among players with a history of ankle sprain in the past year as compared with those without a history of ankle sprain in the past year (Table 4). The absolute rate difference between players with and without a history of ankle sprain was 0.68 excess ankle sprains per 10,000 player-minutes. The effect of previous ankle sprain was particularly notable for lateral ankle sprain occurrence (IRR, 1.44; 95% CI, 1.16-1.80; P = .001).
Playing Time Lost
Most ankle sprains did not result in any NBA games missed (n = 443, 56%) beyond the game, practice, or other activity in which they occurred. Among ankle sprains that resulted in at least 1 missed game, players missed a median of 2 NBA games (interquartile range [IQR], 1-4) and took a median 8 days (IQR = 5-15) to return to NBA game play (Table 5). High ankle sprains had a higher median number of games missed for injury (median, 5.0; IQR, 3-16) and a longer median number of days to return to NBA game play (median, 24.0; IQR, 7-37). NBA games missed and time lost for injury did not differ between contact and noncontact ankle sprains. A cumulative total of 1467 NBA player-games were missed because of ankle sprains in the league over the 4-season study period.
NBA Games Missed Because of Ankle Sprain and Days to Return to Game Play by Sprain Type and Mechanism, 2013-14 Through 2016-17 a
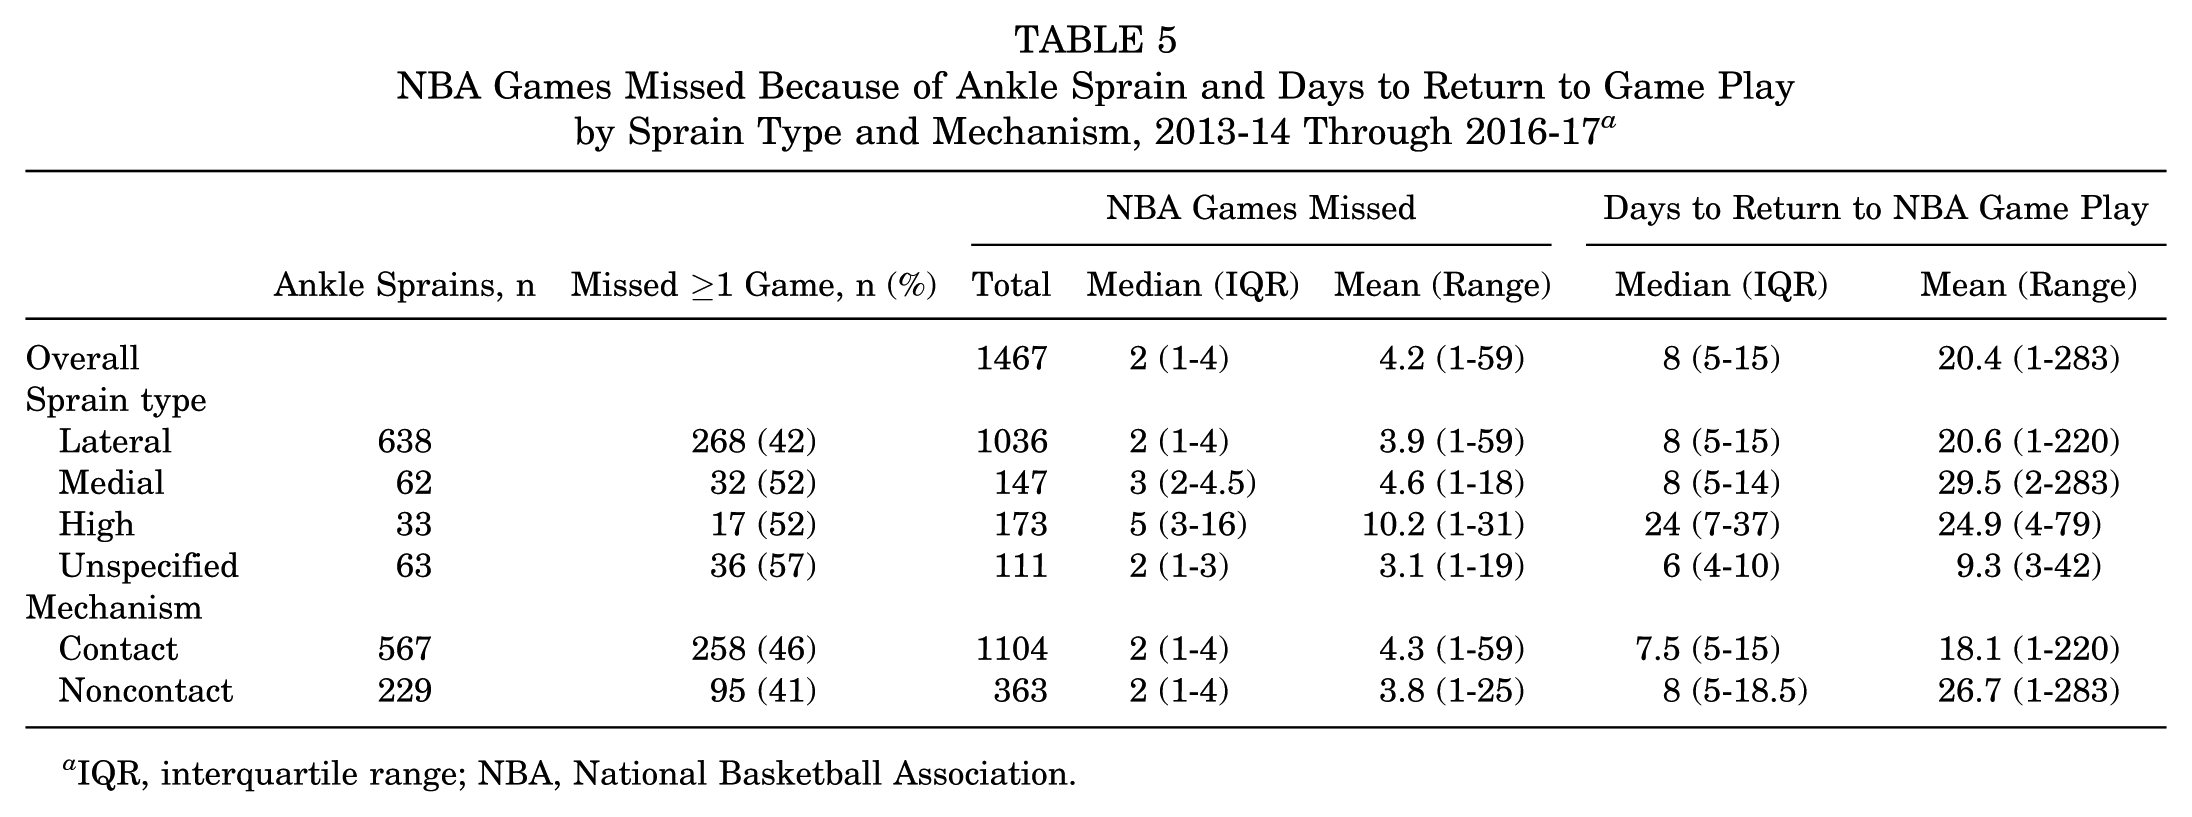
IQR, interquartile range; NBA, National Basketball Association.
Discussion
Approximately 1 in 4 NBA players experienced at least 1 incident ankle sprain each season, leading to a season average of nearly 200 ankle sprains reported in the NBA. Among these injuries, 44% resulted in the player missing a subsequent NBA game, and the cumulative effect was 1467 games missed attributed to ankle sprains that occurred across 4 seasons (an average of approximately 370 player-games missed per season).
Incidence of Ankle Sprain
Overall, the game incidence rate across the 4-season study period was 4.5 ankle sprains per 1000 player-games. In comparison, previous studies describing injuries and illnesses in the NBA estimated game incidence rates of 3.2 to 3.5 ankle sprains per 1000 player-games.6,8,21 Consistent with the prior literature, a majority of the ankle sprains reported in the NBA from 2013-14 through 2016-17 were lateral sprains (n = 638, 80.2%); however, this proportion was lower than that reported by Starkey 21 from the 1988-89 through 1997-98 seasons (n = 874, 92.8%), possibly driven by an increase in the proportion of high ankle sprains reported in our study (n = 33 [4.1%] vs n = 8 [0.8%]). While it is possible that these differences in reported incidence rates and sprain types across the literature on NBA players represent true changes in the incidence of ankle sprain, potentially because of changes in the pace and style of play in the league over time, it is also important to note the significant differences in data collection methods and inclusion criteria.
The previously published studies on NBA injuries utilized a convenience sample of data reported from 1988-89 through 2004-05. During that period, only 88.2% of NBA teams were represented in the database, and the reportable injury definition included the following: “injury required physician referral, prescription medication, or both; resulted in a game or practice being missed, or it necessitated emergent care.” 8 Ankle sprains reported in the present study likely include injuries from a broader distribution of basketball activities, given the transition of data collection to the EMR, expansion of reporting to all injuries rather than those within a more narrow reportable injury definition, and data quality enhancements over time. Subsequently, the ability to accurately compare findings across studies is limited.
Although similar limitations associated with differences in injury surveillance systems, sampling, and access to medical care also make it difficult to draw definitive conclusions about the differences in rates across levels of men’s basketball participation, the incidence rate of ankle sprains identified among NBA players in this study appears higher than that in other levels of men’s basketball participation. Previous studies based on the NCAA injury surveillance database reported ankle sprain incidence rates among men’s basketball players of 2.3 per 1000 player-games 7 from 1988-1989 through 2003-2004 and 1.4 per 1000 athlete-exposures 23 (which includes 1 player participating in 1 game or practice) from 2009-2010 through 2014-2015. Furthermore, there is some indication that incidence rates increase as the level of participation increases, with a reported incidence rate of ankle sprains in high school boys’ basketball lower than that reported in college at 0.8 per 1000 athlete-exposures. 17 Again, these comparisons provide some indication of trends across levels of participation, but more research with strong and consistent methodology could provide insight into ankle sprain occurrence and outcomes across the participation spectrum.
Injury History as a Risk Factor
A key finding of this study was that the incidence rate of ankle sprain in games was 41% higher among players with a history of ankle sprain in the past year as compared with those without a history of ankle sprain. History of ankle sprain was reported to be one of the strongest risk factors for future ankle sprain in other physically active populations.2,3,13 Agel et al 1 reported in 2007 that women’s basketball players with a history of ankle sprain were 5.5 times more likely to sustain another ankle sprain as compared with those with no history of ankle sprain, and a study of recreational and elite basketball players in Australia noted 4.9-times higher odds (95% CI, 2.0-12.5) of ankle sprain among athletes with a history of ankle injury as compared with those without. 13 To our knowledge, this is the first study to assess this association among NBA players. Given the consistency in results suggesting that ankle sprain history is an important risk factor for injury across multiple sports populations, this area may warrant further investigation into factors that may mitigate the increase in risk, as well as opportunities to predict and prevent future injury occurrence.
Setting, Timing, Player Demographics, and Playing Characteristics
In addition to supporting calculations of risk and incidence rates, the NBA EMR data used in this study provide rich information on setting, timing, player demographics, and playing characteristics associated with ankle sprain occurrence. Our results suggest that younger players have higher rates of ankle sprains in game than do players aged ≥26 years. Within games, ankle sprains are also more commonly reported in the second, third, and fourth quarters. The reason for this is unclear but may relate to intensity of competition, changes in type of player (starters vs rotation players), or reduction in joint stability over the course of the game, perhaps secondary to the effectiveness of tape wearing off. In addition, the majority of reported ankle sprains were due to a contact mechanism, such as stepping on an opponent’s foot or other player-to-player contact. These findings provide insight into which players may be at increased risk of sustaining an injury, which can be useful for targeting future prevention initiatives. In addition, these data help identify potential intrinsic and extrinsic injury risk factors that could benefit from further research. In particular, future studies should consider further assessing mechanisms of ankle sprains, perhaps including video review.
Strengths and Limitations
This study used the NBA EMR system, which contains detailed player health and participation information. The NBA EMR system included consistent reporting guidelines across the study period, and these likely enhanced accuracy and completeness of the data reported. However, it is possible that reporting changes in data entry over time may affect comparisons across seasons of the study. It is also important to note that rosters change throughout the course of the season, and some players who are on an NBA team roster in the preseason are released from the league before the start of the regular season. Thus, not all players who were on a roster have the same amount of exposure to NBA play. Additionally, data on player injury history outside of the NBA are limited, potentially resulting in some underascertainment of sprains that occurred outside of the player’s NBA career.
Reporting of mechanism and activity at the time of injury relies on AT observation or athlete recall and was not validated. Only game participation data were available for this study; therefore, incidence rate calculations are presented for game injuries only, and game results may not be generalizable to other settings of participation. We also were not able to assess practice or conditioning time missed because of the injury, and players who did not miss a game may have missed other NBA team-related activities because of the ankle sprain. Missed game calculations focus only on complete games missed after the onset of injury and do include time missed in the game where the injury occurred; in cases where a player was removed from participation in a game because of an incident injury but was able to participate in future NBA games, the partially missed game was not counted in these metrics. In addition, there may be a different threshold for return to play throughout the season (eg, players may be more likely to miss preseason games than playoffs games) that may influence missed time calculations. Missed time calculations are also affected by the timing of injury within the NBA season, as players with injuries that occur toward the end of the season have reduced opportunity to miss games.
Medians and interquartile ranges were emphasized for descriptive statistics instead of means and ranges, as they were less likely to be influenced by these censored observations. We had a low sample size to assess medial and high sprains, and data on shoe type, bracing, and taping were not available. Finally, this study assesses a unique population of elite athletes who participate in the NBA; results of this study may not be generalizable to other populations.
Conclusion
Ankle sprains affect approximately 26% of NBA players on average each season and account for a large number of missed NBA games in aggregate. Younger players and players with a history of ankle sprain have elevated rates of incident ankle sprains in games, highlighting the potential benefit of integrating injury prevention training programs into the management and rehabilitation of initial sprains, as well as the potential benefits of future research on basketball- and ankle-specific injury prevention strategies.
Footnotes
One or more of the authors has declared the following potential conflict of interest or source of funding: M.M.H., C.D.M., and N.A.D. are full-time employees of IQVIA, a human data science company that is funded for NBA injury surveillance and analytics efforts. D.A.P. is funded by the National Academy of Sports Medicine. J.P.D. is a paid consultant for the NBA. M.S.K. is a consultant for Smith & Nephew, OrthoPediatrics, and Ossur. AOSSM checks author disclosures against the Open Payments Database (OPD). AOSSM has not conducted an independent investigation on the OPD and disclaims any liability or responsibility relating thereto.